emissions: how does india compare to...
TRANSCRIPT
GROWTH AND CO2 EMISSIONS: HOW DOES INDIA COMPARE TO OTHER COUNTRIES?
Background paper India – Strategies for Low Carbon Growth
November 2007 World Bank

2
Table of Contents Acknowledgement................................................................................................................................3 Abbreviations and Acronyms...............................................................................................................4 Executive Summary .............................................................................................................................5 Background ..........................................................................................................................................6 Learning from past trends: decomposing CO2 emissions for 1994–2004............................................6 The technique of decomposition analysis ............................................................................................8 “Offsetting” CO2 emissions ...............................................................................................................19 Looking to the future..........................................................................................................................24 Conclusions ........................................................................................................................................24 Annex 1. Data Sources .......................................................................................................................26 Annex 2. Comparison of Decomposition of CO2 emissions in India using EIA and Government of India data ............................................................................................................................................28 Annex 3. Decomposition of Emissions between 1994 and 2004 (million metric tons).....................30 Annex 4. Emissions Intensity in 1994, 1999, and 2004.....................................................................34 Annex 5. Averaged Emissions and Intensities of Top 20 Emitters during 1993-95, 1998-00, and 2003-05...............................................................................................................................................36 Annex 6. A Summary of Recent Projections of India’s CO2 Intensity vis-à-vis Other Countries.....37 Bibliography.......................................................................................................................................44 Tables Table 1: CO2 emissions in 2004 (in million metric tons)...................................................................11 Table 2: Ratio of fossil fuel CO2 emissions to total GHG emissions in 2000..................................12 Table 3: Emissions per unit of GDP and GDP per capita in 2004 .....................................................13 Table 4: Emissions per capita (tons per person) and GDP per capita (2000 US$ PPP) in 2004 .......16 Table 5: Decomposition of the change in CO2 emissions between 1994 and 2004 (million metric tons) ....................................................................................................................................................17 Table 6: Offsetting coefficients for decomposition of emissions, 1994–2004 ..................................20 Table 7: Offsetting and changes in emissions, 1994–1999 and 1999–2004 ......................................21 Table A6.1: Summary of Projections .................................................................................................37 Table A6.2: IEA World Energy Outlook 2007 (see footnote 4 in Table A6.1) .................................41 Table A6.3: Planning Commission (2006) best scenario (see footnote 5 in Table A6.1)..................43 Figures Figure 1: Decomposition of the Change in CO2 Emissions for India in 1994–2004 (million metric tons of CO2)..........................................................................................................................................8 Figure 2: India’s emissions intensity trend, 1980–2005 ....................................................................14 Figure 3: CO2 intensity: India and comparators, 1980–2005.............................................................15 Figure 4: Decomposition for select countries for 1994–2004 (million metric tons of CO2).............19 Figure 5: Countries with largest percentage increase in emissions, 1994–2004................................23

3
Acknowledgement
This report was produced as a background paper for the study India: Strategies for Low Carbon Growth. The team that has worked on this paper comprises the following World Bank staff and consultants: Robert Bacon, Soma Bhattacharya, Richard Damania, Masami Kojima, Kseniya Lvovsky, and Suphachol Suphachasalai. Valuable comments were received from Dan Biller, Kirk Hamilton, Kwawu Mensan Gaba, and Gary Stuggins. Kseniya Lvovsky is the Team Leader for the study, Karin Kemper and Salman Zaheer are responsible Sector Managers, and Isabel Guerrero is the Country Director for India.

4
Abbreviations and Acronyms
Btu British thermal units CO2 carbon dioxide EIA Energy Information Administration GDP gross domestic product GHG greenhouse gas GoI Government of India IEA International Energy Agency IPCC Intergovernmental Panel on Climate Change MDG Millennium Development Goal MER market exchange rate PPP purchasing power parity

5
Executive Summary
This paper has been prepared as part of the India Low Carbon Growth Strategy study in response to a request from the Government of India to complement an analysis of India’s growth scenarios with a comparative assessment of India’s performance with respect to carbon dioxide (CO2) emissions from fossil fuel combustion in the international context. As a major economy and the second most populous nation in the world, India’s CO2 emissions from fossil fuel combustion rank high. Its CO2 emissions will continue to grow for some time, as in all those developing countries which need to increase the currently low levels of per capita energy use to support growth, reach the Millennium Development Goals and eventually provide modern living standards to all their citizens. The key question therefore is what India, as a member of the global community which is to collectively address the global challenge of climate change, can be expected to do⎯and what it has been already doing⎯to grow and meet is energy needs in a “low carbon” manner compared to reasonable international benchmarks. It is in this context that this paper assesses India’s CO2 performance over a 10-year period and compares it with that of other developed and developing economies. Specifically, it analyzes in detail data from 1994 to 2004 for 70 countries using a decomposition technique, and complements this analysis with a review of available future projections (from recent studies by reputed international research groups) to 2030 or 2050. The main findings are as follows:
• By two measures⎯CO2 emissions per capita and CO2 emissions per unit of gross domestic product (GDP) based on purchasing power parity⎯India emerges as a relatively low carbon economy by global comparison.
• India has also been offsetting its CO2 emissions in line with the performance of the global economy. Offsetting is defined in this paper as the combined effect on changes in CO2 emissions of reduced energy intensity, lower carbon intensity of fossil fuels, and fuel substitution away from fossil fuels, relative to the effect of growth in GDP and population in a particular country.
• India has managed to improve both the level of offsetting of CO2 emissions and CO2 emissions intensity of its economy over the period 1999–2004 compared to 1994–1999, when its economic growth accelerated and against the backdrop of increasing CO2 intensity of the global economy. The decline in CO2 emission intensity in India occurred from a relatively low initial level.
• Most of the available projections undertaken by reputed independent international organizations indicate that India’s CO2 intensity per unit of GDP is likely to continue to decline through 2030–2050. In this context, international financial institutions such as the World Bank can make an important contribution by supporting, strengthening, and accelerating the implementation of government policies and programs that reduce CO2 intensity as the economy continues to grow at a rapid pace, and by bringing concessional financing as needed.
• Given large variations in CO2 performance across countries and large swings in this performance across time periods, as observed by the analysis reported in this paper, further in-depth work is necessary to better understand the key determinants of India’s CO2 intensity and policies that would be effective in keeping the CO2 emissions intensity low.

6
Background
India is a large, fast growing economy with a significant share of coal in its primary energy mix. As a consequence of the size of its economy and population, India’s CO2 emissions from fossil fuel combustion1⎯at about 1.1 billion ton in 2004⎯rank high. Together with other major economies, India features prominently in climate change discussions. The combustion of fossil fuels is the largest single contributor to CO2 and total greenhouse gas (GHG) emissions, responsible for changing global climate. CO2 emissions from consumption of fossil fuels constitute more than half of total GHG emissions in many countries, India among them. In India’s case, CO2 emissions from fossil fuel combustion constituted 54 percent of total GHG emissions in 2000 (World Resources Institute 2007). Of all major sources of GHGs, CO2 from fuel combustion has grown the most rapidly since 1970. Furthermore, the recent Fourth Assessment report by the Intergovernmental Panel on Climate Change (IPCC) shows that the long-observed trend in declining global fossil-fuel-derived CO2 emission intensity per unit of GDP has reversed around 2000, implying that, with rapid economic growth, global CO2 emissions are growing faster than at any time since 1970 (IPCC 2007). Accelerating and maintaining the high rate of economic growth is the key to poverty reduction in India (where the largest number of the world poor still live) and achieving the Millennium Development Goals (MDGs). The energy needs to support this growth are vast. India is the only major economy with half of rural population, or roughly 400 million people, with no electricity access. India’s CO2 emissions will continue to grow for some time, as in all those developing countries that need to increase the currently low per capita levels of energy use to support growth, reach the MDGs and eventually provide modern living standards to all their citizens. The Government of India (GoI) estimates that meeting the MDGs (without improving energy services to urban and commercial customers and supporting economic growth) alone will imply an increase of about 18 percent in energy use from the current level and an additional 133 million metric tons of CO2 emissions per year, or 12 percent increase from the 2004 level.2 The key question therefore is what India, as a member of the global community which is to collectively address the global challenge of climate change, can be expected to do⎯and what it has been already doing⎯to grow and meet its energy needs in a “low carbon” manner. A related question is how to define a “low carbon economy” or a “low carbon economic growth” in a particular country relative to reasonable international benchmarks. It is in this context that this paper assesses India’s CO2 performance over time relative to other developed and developing economies. It analyzes in detail the past trends using data from the period 1994–2004 for 70 countries and complements this analysis with a review of available future projections to 2050.
Learning from past trends: decomposing CO2 emissions for 1994–2004
The growth of CO2 emissions over time has shown substantial variation across countries. In order to better appreciate individual countries’ position in a debate over an international framework and to provide focus on the factors that are amenable to policy interventions, it is important to understand (i) the comparative performance of different countries, and (ii) the key determinants of this
1 This paper considers CO2 emissions from fossil fuel combustion only. It excludes other GHG emissions from fossil fuel use, such as methane escape or venting during natural gas operations. 2 Presentation by Dr. Prodipto Ghosh.
7
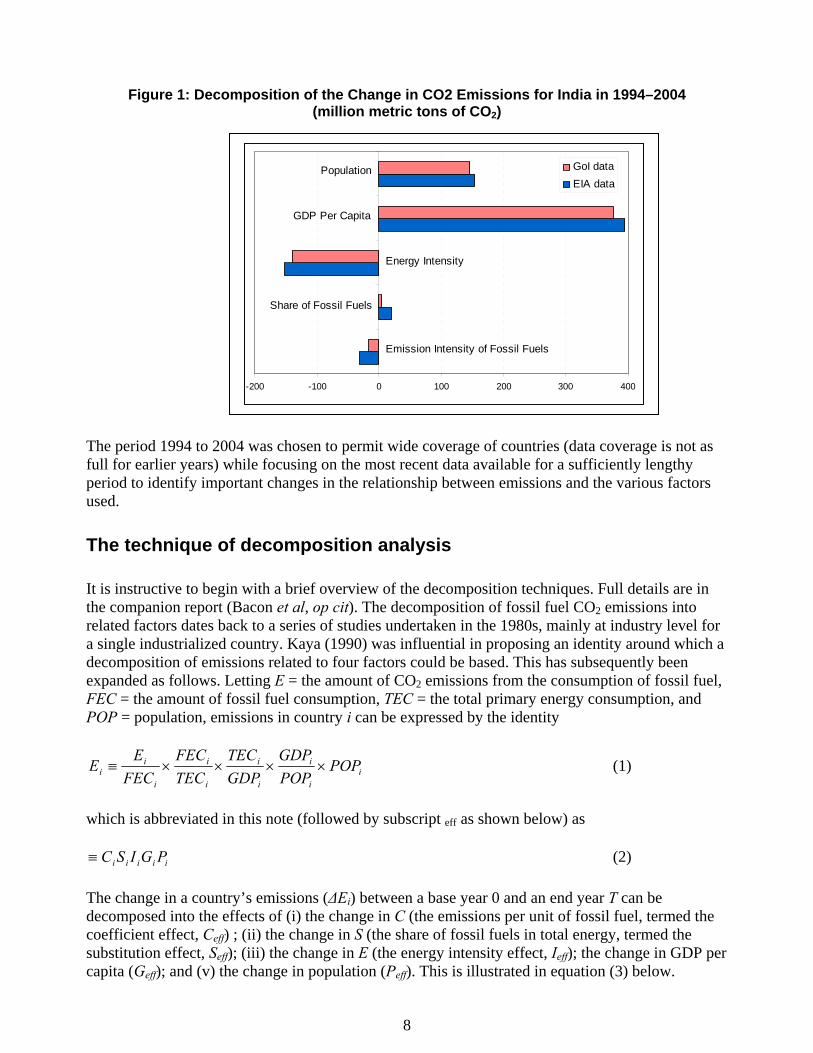
performance and its variations. The principal tool for describing the relationship between the growth of emissions and changes in various related factors is termed “decomposition analysis.” It attempts to assess the changes in emissions resulting from its proximate determinants⎯factors such as GDP (economic activity), size of population, fuel mix and efficiency of fuel use. Numerous studies have applied this technique to fossil fuel emissions of CO2, most of which concentrate on high income countries, with one or two large developing countries also being covered. This paper draws on a recent more comprehensive assessment by the World Bank which provides fuller details (Bacon et al 2007). At the outset a number of important caveats are in order. First, the analysis excludes the use of biomass, for which there is no comparable international data available. For the same reason, non-CO2 GHGs are not considered. Second, the focus is only on CO2 from fossil fuel use. There are significant CO2 emissions from other sources (particularly from forestry and land use changes), but again they are not examined in this paper because a comprehensive database is not available. These issues are briefly addressed later in the paper. Third, the size of an economy has an important impact on emission performance. Typically, all other things being equal, a larger economy can be expected to emit higher emissions than a smaller economy. Hence, in evaluating a country’s CO2 performance, it is necessary to assess the contribution of GDP. This raises questions about whether the appropriate way to measure GDP is at purchasing power parity (PPP) or market exchange rates (MER). Using market exchange rates to compare countries can be misleading because these reflect mainly: (a) trade flows on goods exchanged in international markets, (b) currency flows on capital accounts, and (c) country exchange rate policies, which may widely depart from the long-run stationary “equilibrium exchange rate” if the country adopts either fixed or floating pegs. In most developing countries a larger proportion of output is not traded, so GDP measured at exchange rates could be expected to understate the true levels of output and production. The PPP methods seek to correct for these deficiencies; it is an improvement for making comparisons of GDP, but there remain numerous imperfections. A key problem is that the numbers are sensitive to the basket of goods used to make adjustments. Some argue that, for energy decomposition, the basket should be based on energy-intensive goods. Conversely, other commentators suggest that a representative consumption bundle remains more appropriate since it provides a more accurate reflection of the energy intensity of consumption and economic activity in a country. In view of the lack of consensus and the uncertainties, many of the results are presented with comparisons of GDP at both PPP and MER. It is beyond the scope of this short paper to provide alternative measures of GDP, or resolve these long-standing debates in macroeconomics. The definitions of the variables presented in this study and sources of all data are in Annex 1. In order to have a common database for all the 70 countries, data from the U.S. Energy Information Administration (EIA) were used. In addition, for India, an assessment of India’s performance over time using official data from GoI sources and the data from the U.S. EIA employed in the rest of this note has been undertaken and reported in Annex 2. Figure 1 suggests that differences between the EIA and GoI data are not large and the five variables calculated show the same qualitative trends. As such, using the common EIA data base is unlikely to introduce significant distortions for India in making global comparisons. While Government data may be presumed more accurate, the use of information from a common data set, derived using a common methodology and definitions, is necessary to generate global comparisons. Accordingly the most recent EIA data is used for comparative analysis with countries ranked by various measures of emissions including total CO2 fossil fuel emissions; emissions per capita; and emissions per unit of GDP.
8
Figure 1: Decomposition of the Change in CO2 Emissions for India in 1994–2004 (million metric tons of CO2)
The period 1994 to 2004 was chosen to permit wide coverage of countries (data coverage is not as full for earlier years) while focusing on the most recent data available for a sufficiently lengthy period to identify important changes in the relationship between emissions and the various factors used.
The technique of decomposition analysis
It is instructive to begin with a brief overview of the decomposition techniques. Full details are in the companion report (Bacon et al, op cit). The decomposition of fossil fuel CO2 emissions into related factors dates back to a series of studies undertaken in the 1980s, mainly at industry level for a single industrialized country. Kaya (1990) was influential in proposing an identity around which a decomposition of emissions related to four factors could be based. This has subsequently been expanded as follows. Letting E = the amount of CO2 emissions from the consumption of fossil fuel, FEC = the amount of fossil fuel consumption, TEC = the total primary energy consumption, and POP = population, emissions in country i can be expressed by the identity
ii
i
i
i
i
i
i
ii POP
POPGDP
GDPTEC
TECFEC
FECE
E ××××≡ (1)
which is abbreviated in this note (followed by subscript eff as shown below) as
iiiii PGISC≡ (2) The change in a country’s emissions (ΔEi) between a base year 0 and an end year T can be decomposed into the effects of (i) the change in C (the emissions per unit of fossil fuel, termed the coefficient effect, Ceff) ; (ii) the change in S (the share of fossil fuels in total energy, termed the substitution effect, Seff); (iii) the change in E (the energy intensity effect, Ieff); the change in GDP per capita (Geff); and (v) the change in population (Peff). This is illustrated in equation (3) below.
-200 -100 0 100 200 300 400
GoI dataEIA data
Population
GDP Per Capita
Energy Intensity
Share of Fossil Fuels
Emission Intensity of Fossil Fuels

9
effeffeffeffeffiii PGLSCETEE ++++≡−≡Δ )0()( (3)
The effects, in turn, can be calculated from the following formula using a logarithmic mean Divisia index3:
[ ])]0(/)(ln[)]0(/)(ln[
)0()(ii
iiiieff ETE
CTCETEC ⋅−= (4)
Other effects (Seff, Ieff, Geff, Peff) can also be derived from similar formulae. With data on all the variables for a common base year and terminal year, the decomposition of the change in emissions can be calculated according to equation (4). The change in emissions will reflect changes in the five factors because of the nature of the identity linking them. To interpret these links, it is necessary to consider the circumstances under which the factors that can be directly influenced by emissions related policies will change. The carbon emissions per unit of total fossil fuel consumption (Ceff) will rise if there is a relative shift to higher emitting fuels (for example, the share of coal rising relative to the share of gas). This could occur even if the total quantity of fossil fuels consumed in energy terms stayed constant. The ratio of fossil fuels consumed to total energy consumed (Seff) will rise if the share of non-fossil fuels (hydro, nuclear and renewable energy) declines relative to the share of fossil fuels consumed. The energy intensity of the economy (Ieff) will decrease if the use of energy increases more slowly than the level of GDP. This can occur for two main reasons. Firstly, if the sector structure of GDP changes towards sectors that are less energy intensive, without any other changes, the average use of energy in total GDP would fall. Secondly, if energy efficiency increased in one or more sectors, without any structural shifts, the overall energy intensity would decline. The aggregate form of decomposition analysis used in this paper does not distinguish between these two effects. The exclusion of use of biomass fuel outside the power sector limits the generality of analysis, especially because its use varies greatly among countries. However, its omission is unlikely to have a large effect on the current level of total CO2 emissions because the use of biomass is generally, but not always, carbon neutral. Including biomass consumption outside the power sector would produce an increase in measured energy intensity and decrease the share of fossil fuels in total energy use relative to what is reported in this paper. The differences between the results obtained with and without full inclusion of biomass would obviously depend on the amount of biomass consumed outside the power sector. In the future, if households and small establishments switch from biomass, commercial or otherwise, to fossil fuels and electricity—and households are most certain to do so with increasing income—fossil fuel intensity and CO2 emissions may both rise more than what might be projected based on the past trends.
3 For small changes in the factors, this formula shares the total change in emissions by the ratio of the growth rate of each factor to the growth rate of emissions.

10
Emissions levels and decomposition of emissions changes between 1994 and 2004
This section begins with a description of the level of emissions in each country, measured as total emissions, emissions per unit of GDP and emissions per capita. These demonstrate the nuanced nature of the problem, suggesting that total emissions represent but one criterion that should guide policy focus. This is followed by the decomposition of changes in emissions between 1994 and 2004, and then a breakdown of the decomposition into two sub-periods, 1994–1999, and 1999–2004. a. The level of emissions Table 1 shows the level of CO2 emissions from fossil fuel combustion in 2004 for countries ranked by total emissions. The absolute and percentage changes with respect to emissions in 1994 are also shown. Several features are immediately apparent:
1. India ranks fifth, but the difference between the top two countries (United States and China) and the rest is much more substantial than the difference between India and any other lower ranking country, suggesting that greater care is needed in grouping the countries.
2. The majority of countries with the highest level of emissions in 2004 are high-income countries, but large developing economies⎯Brazil, China, India, Indonesia, Iran, Mexico South Africa, and Ukraine⎯also are in the top 20.
3. A notable group of countries that appear in the top 30 emitters are large oil producers, some of which have small populations or relatively low per capita incomes.
4. Fifteen countries experienced absolute decreases in emissions during the period, and these include several former Soviet Union and eastern European countries, whose economies underwent major transformations of the economy during the period.
5. The percentage growth of emissions between 1994 and 2004 showed considerable variation among countries. Some large economies saw their total emissions remain essentially the same (the Russian Federation, Germany, and the United Kingdom) while other large and several medium-size economies experienced substantial growth in emissions. The latter included China and India, but also countries as different as Bangladesh, Chile, Egypt, the Islamic Republic of Iran, Malaysia, Saudi Arabia, Spain, Thailand, Turkey, and Vietnam.

11
Table 1: CO2 emissions in 2004 (in million metric tons) Country Rank Emissions
in 2004 Increase
since 1994
% increase
since 1994
Country Rank Emissions in 2004
Increase since 1994
% increase
since 1994
United States 1 5912 674 13 Greece 36 106 22 26 China 2 4707 1911 68 Romania 37 95 -21 -18 Russian Fed. 3 1685 -5 0 Nigeria 38 94 -1 -1 Japan 4 1262 174 16 Algeria 39 77 -7 -8 India 5 1113 384 53 Philippines 40 75 22 42 Germany 6 862 -5 -1 Austria 41 70 13 23 Canada 7 588 95 19 Israel 42 66 18 38 United Kingdom 8 580 12 2 Portugal 43 63 17 38 Korea, Rep. of 9 497 143 40 Chile 44 62 26 70 Italy 10 485 85 21 Finland 45 61 4 7 South Africa 11 430 86 25 Sweden 46 59 0 0 France 12 406 46 13 Vietnam 47 57 30 108 Iran, Islamic Rep. of 13 402 153 62 Hungary 48 56 -2 -4 Australia 14 386 107 38 Denmark 49 56 -9 -13 Mexico 15 385 52 15 Belarus 50 55 -10 -16 Saudi Arabia 16 365 127 53 Colombia 51 55 2 4
Ukraine 17 364 -76 -17 Syrian Arab Rep. 52 53 12 29
Spain 18 362 128 55 Norway 53 51 15 43 Brazil 19 337 69 26 Bulgaria 54 47 -3 -7 Indonesia 20 308 99 48 Switzerland 55 45 3 6 Poland 21 288 -32 -10 Ireland 56 42 13 46 Netherlands 22 267 46 21 Slovak Rep. 57 38 -2 -5 Thailand 23 219 92 72 Bangladesh 58 38 19 97 Turkey 24 212 73 53 New Zealand 59 38 7 22 Kazakhstan 25 172 18 12 Azerbaijan 60 37 -9 -20
Malaysia 26 154 65 73 Trinidad and Tobago 61 33 11 50
Belgium 27 148 20 16 Morocco 62 29 2 7 Egypt, Arab Rep. of 28 147 50 51 Peru 63 27 4 19 Venezuela, R. B. de 29 143 24 20 Oman 64 23 8 56 Argentina 30 142 27 23 Bahrain 65 23 7 44 United Arab Emirates 31 141 47 51 Ecuador 66 23 5 27 Singapore 32 129 48 60 Croatia 67 22 4 23 Uzbekistan 33 121 23 24 Tunisia 68 21 5 30 Czech Rep. 34 112 -7 -6 Dominican Rep. 69 20 11 107 Pakistan 35 106 22 26 Angola 70 20 12 169 Source: EIA 2007 and World Bank calculations. Note: These numbers are taken from a table posted on the EIA Web site before September 18, 2007. The revised figures for 2004 posted on September 18 differ slightly from those shown in this table. To place the country data on the emissions of CO2 from the use of fossil fuels in the wider context of total GHG emissions, data measured in million tons of CO2 equivalent in 2000 are available from the Climate Analysis Indicators Tools database (World Resources Institute 2007). The data on total GHG emissions includes the six main gases⎯CO2, methane (CH4), nitrous oxide (N2O), perfluoro-carbons (PFCs), hydrofluorocarbons (HFCs) and sulfur hexafluoride (SF6)⎯from all sources including land use changes and international bunkers. Although the derivation of CO2 emissions from fossil fuel combustion may not be exactly the same as that used by the EIA, and 2000 is the most recent year currently available for the range of countries in this study, the ratio of CO2

12
emissions from fossil fuelcombustion to total GHG emissions (shown in Table 2) indicates the relative importance of fossil fuels globally and in specific countries.
Table 2: Ratio of fossil fuel CO2 emissions to total GHG emissions in 2000
Country % CO2 from fossil fuel
combustion to total GHG emissions
Country % CO2 from fossil fuel
combustion to total GHG emissions
Indonesia 9.3 Oman 66.3 Peru 10.3 Iran 66.5 Malaysia 12.5 Greece 66.8 Angola 13.6 Sweden 68.5 Brazil 13.8 Croatia 68.5 Nigeria 19.1 Denmark 68.9 Ecuador 19.2 South Africa 69.4 Colombia 21.4 Syria 69.7 Bangladesh 23.4 Canada 69.7 Philippines 30.4 Spain 70.0 Pakistan 30.5 Romania 70.1 Singapore 31.5 Belgium 70.2 Venezuela 35.6 France 70.7 New Zealand 38.8 Kazakhstan 71.6 Argentina 39.1 Bulgaria 71.8 Morocco 47.0 Israel 72.0 Thailand 48.8 Hungary 73.1 Tunisia 51.8 Saudi Arabia 73.4 Vietnam 52.0 Azerbaijan 74.2 Chile 53.1 Slovak Republic 75.4 India 53.7 Russia 75.8 Turkey 53.8 Trinidad and Tobago 75.9 United Arab Emirates 55.4 Switzerland 76.6 Egypt 57.2 United Kingdom 76.9 Mexico 58.5 Finland 77.1 Dominican Republic 59.0 Portugal 77.2 Ukraine 59.5 Italy 77.8 China 59.5 Austria 78.5 Algeria 60.9 Poland 78.6 Ireland 61.4 Korea, Republic of 79.0 Uzbekistan 63.6 Germany 80.1 Norway 64.4 Czech Republic 82.3 Belarus 64.6 Bahrain 82.5 Netherlands 64.9 Japan 83.3 Australia 65.2 United States 86.8 Source: World Resources Institute 2007. The ratiovaries substantially across countries. It is more than 50 percent for 53 of the countries⎯including India⎯and rises to more than 80 percent for 8 countries. For certain countries, such as Indonesia and Brazil, where other sources of GHG emissions are predominant, policies to reduce total emissions need to focus more intensively on non-fossil fuel sources. In India, the share of fossil fuel CO2 emissions is more than 50 percent but significantly lower than in the Russian Federation and most high-income countries. This suggests that a strategy for controlling the GHG intensity of growth in India might need to include activities and programs outside energy production and use.

13
A different perspective is provided by tabulating CO2 emissions per unit of GDP, which is typically referred to as emissions intensity. The data in Table 3 indicate that the ranking of countries according to emissions per unit of GDP at PPP is quite different from that for total emissions4. Particularly, Japan, India, and Mexico move a long way down the list, with the United States and China moving to the mid-range. Higher- and lower-income countries are scattered throughout the table, suggesting that there is little evidence of a systematic relationship between emissions per unit of GDP and the level of GDP.
Table 3: Emissions per unit of GDP and GDP per capita in 2004 Country E/G
PPP E/G
MER GDP pc
PPP GDP pc
MER Country E/G
PPP E/G
MER GDP pc
PPP GDP Pc
MER Uzbekistan 2686 7204 1712 639 Israel 437 548 22950 18319 Trinidad & Tobago 2054 2938 12181 8516 Croatia 437 973 10890 4891 Kazakhstan 1785 6309 6504 1840 Indonesia 431 1564 3245 894 Bahrain 1749 2292 18148 13852 New Zealand 423 614 22423 15425 UAE 1488 1470 22135 22405 Turkey 422 923 6951 3175 Ukraine 1300 8254 5949 937 Finland 418 465 28078 25239 Russia 1298 5124 9018 2285 Germany 403 442 25905 23627 Azerbaijan 1240 4683 3551 940 Mexico 402 624 9061 5847 Saudi Arabia 1204 1698 12661 8977 Algeria 392 1161 6058 2046 Singapore 1202 1227 25209 24689 Chile 378 707 10168 5436 Venezuela 995 1188 5457 4568 Hungary 366 1017 15228 5474 South Africa 972 2821 9362 3226 Japan 364 259 27080 38041 Belarus 877 3308 6425 1704 India 362 1887 2831 542 Iran 867 3163 6738 1847 Spain 357 552 23782 15372 Syria 861 2484 3304 1145 Denmark 350 334 29338 30685 Bulgaria 799 3101 7577 1953 Pakistan 349 1235 1969 556 Nigeria 762 1663 959 439 Dominican Rep. 341 948 6786 2442 Angola 719 1594 1772 799 Portugal 332 548 18278 11096
Australia 690 848
28049 22846 United
Kingdom 331 364
29406 26741
Oman 663 1027 13881 8961 Italy 326 428 25641 19527 China 661 2745 5441 1311 Argentina 316 495 11750 7486 Malaysia 658 1437 9374 4296 Ireland 314 359 33102 28981 Czech Rep. 638 1758 17233 6251 Norway 307 283 36234 39302 Poland 632 1497 11797 4983 Tunisia 290 897 7170 2322 Canada 631 747 29164 24618 Austria 288 340 29675 25087 Netherlands 569 670 28918 24560 Vietnam 274 1394 2520 496 Romania 569 2030 7688 2154 France 249 287 26989 23456 United States 552 552 36234 36234 Brazil 247 514 7406 3564 Korea, Rep. of 546 810 19108 12879 Morocco 243 727 3875 1297 Egypt 541 1286 3747 1577 Sweden 232 224 28226 29219 Slovak Rep. 536 1589 13282 4479 Philippines 207 836 4431 1094 Belgium 499 599 28437 23681 Colombia 196 586 6275 2099 Greece 476 774 20077 12354 Switzerland 194 177 31958 35060 Ecuador 463 1154 3740 1501 Peru 194 445 5122 2227 Thailand 460 1457 7453 2356 Bangladesh 155 655 1756 416
Source: World Bank calculations. E/G ≡ emissions in metric tones per million US$ of GDP; GDP pc ≡ GDP per capita; GDP pc PPP ≡ GDP per capita measured at purchasing power parity in 2000 US$; GDP pc MER ≡ GDP per capita measured in 2000 US$ at market exchange rates;.
4 The emissions intensity for 1994 and 1999 are provided in Annex 4.

14
It is evident from Table 3 that country rankings based on emissions intensity vary depending on whether MER or PPP is used to measure GDP. However, trends in emissions intensity are not affected by the choice of MER or PPP. To illustrate this point, Figure 2 compares the trends of India’s emissions intensity using GDP measured at MER and PPP from 1980 to 2005. The intensities calculated with GDP at MER are 5.2 times higher than those calculated with GDP at PPP, which simply reflects a constant ratio between the two measures of GDP in India. For both measures, the intensities have been declining slightly since 1994.
Figure 2: India’s emissions intensity trend, 1980–2005
0
500
1000
1500
2000
2500
3000
1980 1981 1982 1983 1984 1985 1986 1987 1988 1989 1990 1991 1992 1993 1994 1995 1996 1997 1998 1999 2000 2001 2002 2003 2004 2005
at PPP at market exchage
tons of CO2 per million 2000 US$
Source: World Bank calculations based on EIA’s International Energy Annual 2005 Figure 3, which is based on GDP at PPP, shows that India’s CO2 intensity has been relatively low compared to other large economies over the same period. It has been much lower than those of the United States, Russian Federation, China, South Africa, and Australia, and close to that of Japan. If the emissions from land-use change and forestry had been included in Figure 3, Indonesia’s and Brazil’s levels would be significantly higher, making India the least emission intensive country in the group of countries considered.5
5 Emissions from land-use change and forestry account for 80 percent and 90 percent of Brazil’s and Indonesia’s total emissions respectively; these emissions are negligible for India.

15
Figure 3: CO2 intensity: India and comparators, 1980–2005
Source: World Bank calculations based on EIA’s International Energy Annual 2005 Table 4 shows emissions per capita for each country in the list and GDP per capita, with countries ranked by emissions per capita. Higher-income countries are found predominantly in the top half of the rankings, and lower-income countries in the bottom half. In addition to income, population size matters: a group of low population countries rises in the ranking, while populous nations such as China, India and Indonesia fall markedly in the rankings. The global Gini coefficient for emissions per capita, where all individuals within a country are assumed to share emissions equally, is 0.53. This is almost identical to the measure of inequality of per capita incomes for the same group of countries.
100 200 300 400 500 600 700 800 900
1000 1100 1200 1300 1400 1500 1600 1700 1800
1980 1981 1982 1983 1984 1985 1986 1987 19881989199019911992199319941995 1996 19971998 1999 2000 2001 2002 20032004 2005
tons of CO2 per million 2000 US$, PPP
Mexico United States Brazil Russia South Africa
Australia China India Indonesia Japan

16
Table 4: Emissions per capita (tons per person) and GDP per capita (2000 US$ PPP) in 2004
Country Emissions per capita
GDP per capita
Country Emissions per capita
GDP per capita
UAE 32.94 22135 Malaysia 6.17 9374 Bahrain 31.75 18148 Portugal 6.08 18278 Singapore 30.30 25209 Bulgaria 6.06 7577 Trinidad & Tobago 25.02 12181 Iran 5.84 6738 United States 20.01 36234 Belarus 5.64 6425 Australia 19.36 28049 Hungary 5.57 15228 Canada 18.40 29164 Venezuela 5.43 5457 Netherlands 16.45 28918 Croatia 4.76 10890 Saudi Arabia 15.24 12661 Uzbekistan 4.60 1712 Belgium 14.20 28437 Azerbaijan 4.40 3551 Finland 11.74 28078 Romania 4.37 7688 Russia 11.71 9018 Chile 3.84 10168 Kazakhstan 11.61 6504 Argentina 3.71 11750 Norway 11.12 36234 Mexico 3.65 9061 Czech Rep. 10.99 17233 China 3.60 5441 Germany 10.43 25905 Thailand 3.43 7453 Korea, Rep. of 10.43 19108 Turkey 2.93 6951 Ireland 10.41 33102 Syria 2.85 3304 Denmark 10.26 29338 Algeria 2.38 6058 Israel 10.04 22950 Dominican Rep. 2.32 6786 Japan 9.87 27080 Tunisia 2.08 7170 United Kingdom 9.75 29406 Egypt 2.03 3747 Greece 9.56 20077 Brazil 1.83 7406 New Zealand 9.47 22423 Ecuador 1.73 3740 Oman 9.20 13881 Indonesia 1.40 3245 South Africa 9.10 9362 Angola 1.27 1772 Austria 8.54 29675 Colombia 1.23 6275 Spain 8.49 23782 India 1.02 2831 Italy 8.36 25641 Peru 0.99 5122 Ukraine 7.74 5949 Morocco 0.94 3875 Poland 7.46 11797 Philippines 0.92 4431 Slovak Rep. 7.12 13282 Nigeria 0.73 959 France 6.73 26989 Vietnam 0.69 2520 Sweden 6.56 28226 Pakistan 0.69 1969 Switzerland 6.20 31958 Bangladesh 0.27 1756
Source: World Bank calculations. b. The decomposition of emissions between 1994 and 2004 The decomposition of the change in CO2 emissions between 1994 and 2004 is presented in Table 5, where countries are ranked by decreasing GDP per capita. The decomposition is based on GDP measured in PPP and, as mentioned above, the results are identical for virtually all countries when GDP in MER is used. The table also includes the decomposition for the aggregate of the 70 countries; this can be taken as a close approximation of the decomposition for the global economy.

17
Table 5: Decomposition of the change in CO2 emissions between 1994 and 2004 (million metric tons)
Country Ceff Seff Ieff Geff Peff ΔE
2004 GDP per capita(2000 US$, PPP)
Norway -2.4 11.6 -6.7 10.3 2.6 15.4 36234 USA 6.1 14.6 -1126.1 1210.7 569.0 674.5 36234 Ireland -0.9 -0.2 -12.3 22.3 4.6 13.4 33102 Switzerland -0.2 1.3 -4.4 4.2 1.6 2.6 31958 Austria 0.2 2.0 -3.1 12.5 1.3 13.0 29675 United Kingdom -25.5 8.3 -133.7 143.7 19.6 12.4 29406 Denmark -1.3 -6.2 -13.5 10.1 2.3 -8.6 29338 Canada -9.4 38.6 -109.9 124.1 52.2 95.5 29164 Netherlands 11.1 -2.9 -21.1 46.0 13.3 46.4 28918 Belgium -6.8 -0.2 -2.5 25.6 4.0 20.1 28437 Sweden -1.1 -2.3 -13.3 15.2 1.5 -0.1 28226 Finland -1.2 -2.5 -13.3 19.3 1.7 4.0 28078 Australia 6.3 3.3 -22.0 80.7 38.8 107.2 28049 Japan 41.8 -0.4 0.6 106.1 26.0 174.1 27080 France -2.5 -4.1 -32.0 69.9 15.0 46.3 26989 Germany -22.2 -23.7 -84.7 111.6 14.1 -4.9 25905 Italy -6.6 3.2 20.0 61.6 6.5 84.8 25641 Singapore -4.1 0.0 -0.5 28.6 24.4 48.4 25209 Spain -4.9 8.7 22.3 82.3 20.2 128.5 23782 Israel -1.6 0.2 0.7 5.3 13.5 18.1 22950 New Zealand 1.7 1.3 -7.2 7.7 3.4 6.9 22423 UAE -4.6 0.0 -21.6 2.0 71.7 47.4 22135 Greece -2.9 -1.8 -8.1 30.3 4.7 22.2 20077 Korea, Rep. of. -11.0 -21.9 -28.0 175.9 27.9 142.8 19108 Portugal -1.1 1.3 2.6 12.4 2.3 17.4 18278 Bahrain -0.3 0.0 -1.7 4.4 4.5 7.0 18148 Czech Rep. -6.9 -6.1 -23.2 30.3 -1.2 -7.1 17233 Hungary -4.1 0.0 -20.0 23.2 -1.2 -2.1 15228 Oman -0.3 0.0 2.0 3.1 3.4 8.3 13881 Slovak Rep. -2.8 -1.4 -14.5 16.1 0.4 -2.2 13282 Saudi Arabia -6.6 0.0 70.9 -18.7 81.2 126.8 12661 Trinidad & Tobago -6.3 0.0 1.5 14.7 1.0 10.9 12181 Poland -20.0 1.0 -148.0 134.8 0.2 -31.9 11797 Argentina -4.6 2.8 14.4 0.0 14.1 26.6 11750 Croatia 0.8 0.5 -5.5 8.7 -0.5 4.0 10890 Chile -3.5 3.4 3.7 15.8 6.2 25.6 10168 Malaysia -5.2 2.7 8.6 31.9 26.8 64.9 9374 South Africa -0.3 -1.0 -30.1 62.2 55.0 85.8 9362 Mexico -9.5 -4.0 -28.9 40.1 54.1 51.7 9061 Russia -34.5 -17.7 -414.3 514.2 -52.4 -4.6 9018 Romania 0.3 -7.8 -39.3 30.4 -4.9 -21.3 7688 Bulgaria -2.4 -1.6 -8.0 12.1 -3.6 -3.4 7577 Thailand -9.7 -0.8 49.7 35.7 16.8 91.8 7453 Brazil -27.2 2.0 22.3 27.6 43.9 68.6 7406 Tunisia -1.3 -0.1 -2.5 6.4 2.2 4.9 7170 Turkey -8.4 2.1 9.7 41.9 27.7 73.0 6951 Dominican Rep. 0.3 -0.2 3.2 5.1 2.1 10.5 6786

18
Country Ceff Seff Ieff Geff Peff ΔE
2004 GDP per capita(2000 US$, PPP)
Iran -27.3 1.3 35.2 107.5 36.6 153.1 6738 Kazakhstan 3.3 2.9 -59.9 84.3 -12.8 17.8 6504 Belarus -3.8 -0.1 -34.6 31.0 -2.8 -10.3 6425 Colombia -2.1 -0.5 -7.1 2.3 9.3 1.9 6275 Algeria -6.7 -0.3 -30.4 18.2 12.4 -6.9 6058 Ukraine -11.3 -16.6 -93.0 84.0 -38.8 -75.7 5949 Venezuela 2.2 -0.2 8.9 -12.3 25.4 24.1 5457 China -108.3 -35.8 -1155.4 2917.7 293.0 1911.2 5441 Peru -0.1 -1.7 -2.6 4.6 4.1 4.3 5122 Philippines -0.3 -1.2 -2.1 13.2 12.5 22.0 4431 Morocco -0.9 -0.9 -4.6 3.9 4.4 1.9 3875 Egypt -11.4 2.6 5.8 29.8 22.9 49.7 3747 Ecuador 0.6 0.2 -1.4 2.3 3.1 4.7 3740 Azerbaijan -1.7 -1.1 -31.4 21.8 3.4 -9.0 3551 Syria -1.2 0.7 -2.3 2.6 12.0 11.9 3304 Indonesia -1.6 -3.3 30.1 40.6 33.6 99.4 3245 India -31.7 20.0 -152.4 394.4 153.2 383.6 2831 Vietnam -5.9 1.4 5.5 22.9 5.9 29.8 2520 Pakistan -3.7 1.0 -10.4 13.3 21.7 22.0 1969 Angola 5.4 0.2 -2.2 5.7 3.3 12.4 1772 Bangladesh 0.2 0.2 4.2 8.5 5.5 18.7 1756 Uzbekistan -3.9 1.2 -14.7 24.1 16.7 23.3 1712 Nigeria -29.8 -0.5 -6.6 13.3 22.7 -1.0 959 Aggregate -156.4 150.4 -3389.3 5735.0 2664.6 5004.3 9099
Source: World Bank calculations. Note: See the discussion of equation (3) for definitions of the decomposition factors. The aggregation of countries can be misleading for drawing conclusions for any particular country. To complement and draw additional observations, Figure 4 summarizes the decomposition of the five largest contributors to CO2 emissions. First, it is important to observe that Japan’s population grew slowly and its economy stagnated through much of this period. Hence GDP and population had a minimal impact on emissions. The Russian Federation too experienced sharp structural breaks and economic dislocation in this period, so growth-related emissions are negligible. Hence comparing these two countries with India, with its rapid growth, are somewhat less informative when it concerns the impact of growth. Of the remaining economies in the figure, the effects of India’s growth and population on CO2 emissions are lower. Regarding the intensity coefficient, the situation is reversed: India and Japan had much lower energy intensity per GDPPPP than the other three countries during the decade, so their performance is not directly comparable. India performed better on the intensity coefficient than Japan, and, as Table 5 shows, better than Mexico and Brazil—two large developing economies that also have relatively low CO2 intensity based on GDPPPP.

19
Figure 4: Decomposition for select countries for 1994–2004 (million metric tons of CO2)
Source: World Bank calculations.
“Offsetting” CO2 emissions
Another useful way to summarize the decomposition analysis is to compare the effects from income and population growth, which are virtually always positive,6 and are outside direct interventions that might have been expected to moderate emissions, and the three other factors that had the potential through policy interventions to reduce emissions. To this end an “offsetting” coefficient is defined: Offsetting coefficient = – [ sum of changes from emissions per unit of fossil fuel, fossil fuel
consumption relative to total energy consumption, and energy intensity of GDP] / [changes from GDP per capita and population]
⎟⎟⎠
⎞⎜⎜⎝
⎛
+
++−=
effeff
effeffeff
PGISC
(5)
A score of 100 percent indicates that the total increase in emissions attributed to GDP per capita growth and population growth was exactly offset by improvements in the three other factors. A negative score indicates that emissions increased faster than would have been accounted for by the growth of GDP and population. For the aggregate of 70 countries, 40 percent of the potential growth in emissions from GDP and population growth was offset by the three factors. For individual countries, the offsetting coefficients, ranked by size of coefficient, are shown in Table 6.
6 The exceptions are Saudi Arabia where per capita income fell during the period, and the Russian Federation and other countries in the former Soviet Union and Eastern Europe where changed political boundaries led to falls in population.
-1500 -1000 -500 0 500 1000 1500 2000 2500 3000
Energy Intensity of Fossil Fuels Share of Fossil FuelsEnergy Intensity GDP Per CapitaPopulation
India
China
Russia
Japan
USA

20
Table 6: Offsetting coefficients for decomposition of emissions, 1994–2004 Country Offsetting coefficient Country Offsetting coefficient Ukraine 267.4 Belgium 32.0 Romania 183.6 Trinidad and Tobago 30.4 Denmark 169.1 India 30.0 Bulgaria 140.3 Korea, Rep. of 29.9 Belarus 136.4 South Africa 26.8 Azerbaijan 135.5 Netherlands 21.7 Czech Republic 124.4 Bahrain 21.5 Poland 123.7 Syria 19.0 Algeria 122.6 Philippines 14.2 Slovak Rep. 113.5 Ecuador 12.4 Hungary 109.5 Australia 10.3 Germany 103.9 Singapore 8.8 Nigeria 102.7 Austria 6.0 Russia 101.0 Egypt 5.7 Sweden 100.4 Brazil 4.0 United Kingdom 92.4 Israel 3.5 Colombia 83.6 Vietnam -3.3 Finland 80.7 Turkey -4.9 Morocco 77.3 Iran -6.3 Kazakhstan 75.0 Malaysia -10.5 United States 62.1 Chile -16.2 Switzerland 56.7 Portugal -18.6 Croatia 51.5 Norway -19.5 Peru 50.6 Italy -24.4 Ireland 50.2 Spain -25.4 Canada 45.8 Oman -26.9 France 45.5 Japan -31.9 Mexico 45.1 Bangladesh -33.2 Tunisia 43.8 Indonesia -33.9 Uzbekistan 42.8 Angola -38.6 China 40.5 Dominican Republic -45.6 New Zealand 37.9 Thailand -74.6 Pakistan 37.1 Venezuela -83.8 Greece 36.5 Argentina -89.8 United Arab Emirates 35.7 Saudi Arabia -102.8
Source: World Bank calculations. The range of offsetting experienced during the period was wide. Fifteen countries more than fully offset the potential increase in emissions from income and population growth. Many of those included the economies of Eastern Europe and Central Asia whose economies collapsed in the early 1990s and then experienced economic transformation. Nineteen countries experienced negative offsetting, with growth in CO2 emissions higher than growth in GDP and population. This group included a mix of countries but also many oil producing economies and some high-income countries. Looking across the list of countries as a whole, it is noticeable that the offsetting coefficient is not correlated with income levels. India lies in the middle range, suggesting that its offsetting performance is broadly in line with the global average, but there could be scope for accelerating the pace of offsetting by emulating the more successful economies in this respect.
21
The changing pattern of performance between 1994 and 2004
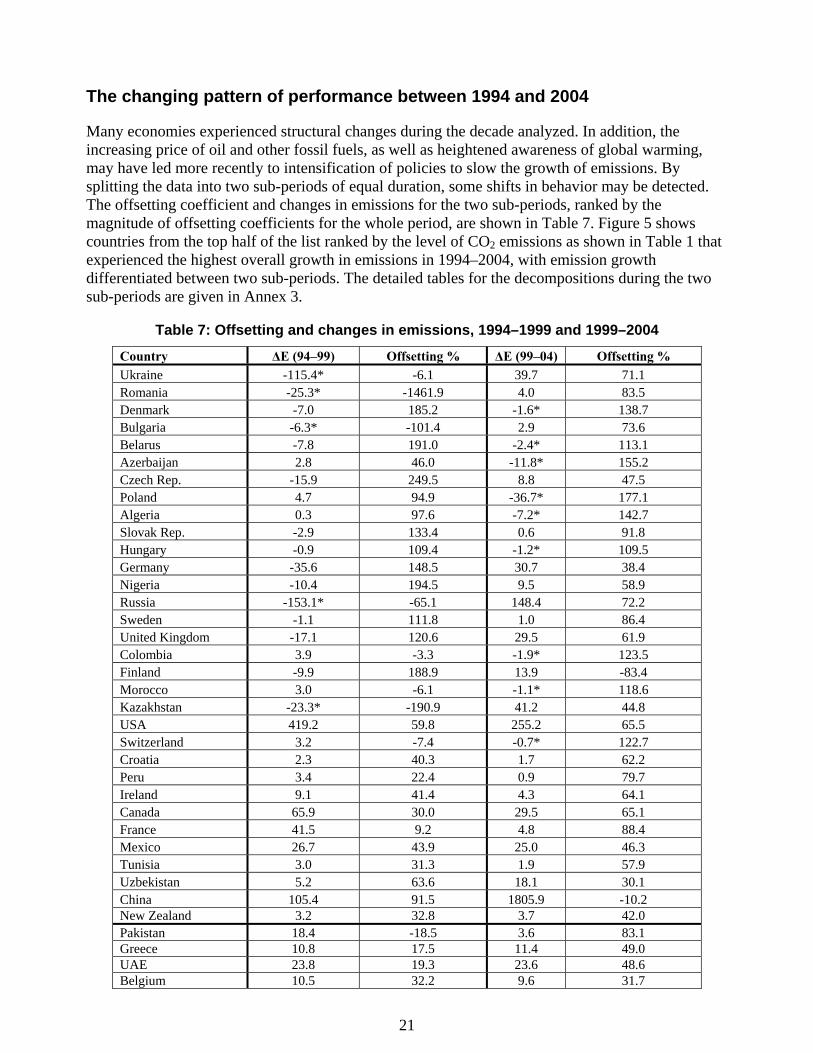
Many economies experienced structural changes during the decade analyzed. In addition, the increasing price of oil and other fossil fuels, as well as heightened awareness of global warming, may have led more recently to intensification of policies to slow the growth of emissions. By splitting the data into two sub-periods of equal duration, some shifts in behavior may be detected. The offsetting coefficient and changes in emissions for the two sub-periods, ranked by the magnitude of offsetting coefficients for the whole period, are shown in Table 7. Figure 5 shows countries from the top half of the list ranked by the level of CO2 emissions as shown in Table 1 that experienced the highest overall growth in emissions in 1994–2004, with emission growth differentiated between two sub-periods. The detailed tables for the decompositions during the two sub-periods are given in Annex 3.
Table 7: Offsetting and changes in emissions, 1994–1999 and 1999–2004
Country ΔE (94–99) Offsetting % ΔE (99–04) Offsetting % Ukraine -115.4* -6.1 39.7 71.1 Romania -25.3* -1461.9 4.0 83.5 Denmark -7.0 185.2 -1.6* 138.7 Bulgaria -6.3* -101.4 2.9 73.6 Belarus -7.8 191.0 -2.4* 113.1 Azerbaijan 2.8 46.0 -11.8* 155.2 Czech Rep. -15.9 249.5 8.8 47.5 Poland 4.7 94.9 -36.7* 177.1 Algeria 0.3 97.6 -7.2* 142.7 Slovak Rep. -2.9 133.4 0.6 91.8 Hungary -0.9 109.4 -1.2* 109.5 Germany -35.6 148.5 30.7 38.4 Nigeria -10.4 194.5 9.5 58.9 Russia -153.1* -65.1 148.4 72.2 Sweden -1.1 111.8 1.0 86.4 United Kingdom -17.1 120.6 29.5 61.9 Colombia 3.9 -3.3 -1.9* 123.5 Finland -9.9 188.9 13.9 -83.4 Morocco 3.0 -6.1 -1.1* 118.6 Kazakhstan -23.3* -190.9 41.2 44.8 USA 419.2 59.8 255.2 65.5 Switzerland 3.2 -7.4 -0.7* 122.7 Croatia 2.3 40.3 1.7 62.2 Peru 3.4 22.4 0.9 79.7 Ireland 9.1 41.4 4.3 64.1 Canada 65.9 30.0 29.5 65.1 France 41.5 9.2 4.8 88.4 Mexico 26.7 43.9 25.0 46.3 Tunisia 3.0 31.3 1.9 57.9 Uzbekistan 5.2 63.6 18.1 30.1 China 105.4 91.5 1805.9 -10.2 New Zealand 3.2 32.8 3.7 42.0 Pakistan 18.4 -18.5 3.6 83.1 Greece 10.8 17.5 11.4 49.0 UAE 23.8 19.3 23.6 48.6 Belgium 10.5 32.2 9.6 31.7

22
Country ΔE (94–99) Offsetting % ΔE (99–04) Offsetting % Trinidad & Tobago 4.5 15.0 6.4 39.8 India 205.6 21.4 178.0 39.4 Korea, Rep. of 72.2 15.8 70.6 41.7 South Africa 24.7 45.4 61.1 13.4 Netherlands 15.8 61.5 30.6 -88.5 Bahrain 4.4 -24.2 2.6 55.1 Syria 9.4 -45.3 2.4 72.3 Philippines 16.0 -47.2 6.0 63.2 Ecuador 1.6 -128.7 3.2 34.7 Australia 71.8 -7.9 35.4 36.1 Singapore 22.8 14.2 25.6 1.8 Austria 6.7 14.8 6.3 -6.9 Egypt 16.8 35.5 32.9 -32.9 Brazil 65.5 -100.1 3.1 92.9 Israel 11.4 -0.6 6.7 10.9 Vietnam 13.4 -9.2 16.4 2.8 Turkey 41.3 -35.7 31.8 23.0 Iran 66.1 -35.3 87.0 11.9 Malaysia 16.9 28.3 48.0 -47.6 Chile 22.5 -84.6 3.0 74.4 Portugal 16.8 -52.6 0.6 85.3 Norway 7.9 -4.0 7.5 -46.9 Italy 36.7 -0.7 48.1 -55.2 Spain 62.5 -32.4 66.0 -18.1 Oman 5.4 -91.3 2.9 29.2 Japan 61.4 -44.2 112.7 -25.5 Bangladesh 7.5 -34.6 11.2 -31.9 Indonesia 55.1 -248.1 44.3 30.5 Angola 6.1 -59.3 6.3 -15.1 Dominican Rep 4.4 -8.9 6.1 -125.4 Thailand 43.2 -355.2 48.6 -1.6 Venezuela 13.7 -174.6 10.4 -24.2 Argentina 23.5 -73.8 3.1 -704.4 Saudi Arabia 23.7 -61.7 103.1 -118.6
Source: World Bank calculations.

23
Figure 5: Countries with largest percentage increase in emissions, 1994–2004
Source: World Bank calculations. Note: The figure includes only those countries that are in the top half of the emitters listed in Table 1. A striking feature is a very different performance by many countries in the two-sub-periods. More than 40 percent of the countries decreased their offsetting during the second sub-period. Six countries moved from partial positive offsetting in the first sub-period to negative offsetting in the second sub-period, indicating that the policy-related factors had ameliorated the effects of growth earlier, but added to it in the latter period. This group includes Austria, China, Colombia, Egypt, Malaysia, and the Netherlands. The remaining countries improved or maintained their offsetting coefficient, with seventeen countries moving from negative to positive offsetting.
While experiencing high economic growth, India almost doubled its offsetting between the two sub-periods and reduced both growth in CO2 emissions and CO2 emissions intensity of GDP, suggesting that the country was on a lower carbon growth trajectory. Among other countries with large absolute emissions, the United States experienced growth in emissions but offset a substantial fraction of the effects of income growth during both sub-periods. China experienced little growth in emissions in the first sub-period—partly thanks to high offsetting—but in the second sub-period experienced a very large growth in emissions, when the effects of very rapid growth were slightly compounded by negative offsetting. Japan experienced modest increases in emissions during both sub-periods, partly related to negative offsetting in both. The Russian Federation experienced a substantial drop in emissions during the first sub-period, but then experienced a sizeable growth in emissions during the second sub-period despite a high degree of offsetting. Relatively few countries, however, performed steadily across both sub-periods. Above all, this has shown that offsetting, rate of growth in CO2 emissions and trends in CO2 intensity are prone to significant swings. It suggests that, if a country is motivated by a goal of controlling CO2 emissions growth, it is important to periodically evaluate and update a set of policies in place.
Countries with Largest Percentage Increase in Emissions: 1994-2004
0
10
20
30
40
50
60
70
Malaysia Thailand China Iran Spain India SaudiArabia
Turkey Egypt UnitedArab
Emirates
Indonesia
Perc
ent
1994-19991999-2004

24
To investigate the possibility that the findings of this study might have been influenced by the selection of the three years for which calculations were performed—1994, 1999, 2004—alternative calculations were also run for absolute emission levels and energy intensity for the top 20 CO2 emitters. In the alternative calculations, data from three years centered around the above three years were averaged: averaging over 1993–1995 instead of using data only from 1994, averaging over 1998–2000 instead of taking data from 1999 only, and so on. These calculations were run to check if there might have been anything unusual about 1994, 1999, or 2004. The results are shown in Annex 5. These calculations show that the trends observed hold when data are averaged across three years. All energy intensity figures, for example, were within 10 percent between the two sets of calculations.
Looking to the future
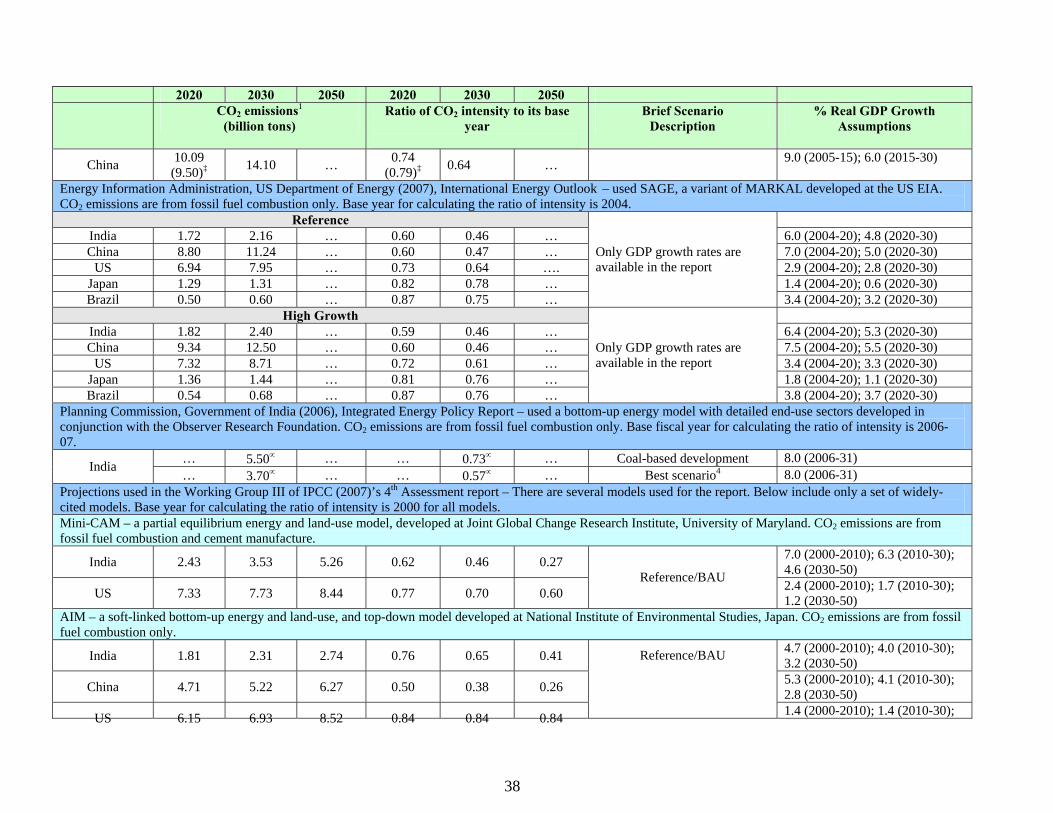
The finding reported above that CO2 emission trends are often volatile and subject to dramatic changes means that a simple extrapolation of trends cannot be used for forecasting future performance. To gain some understanding of India’s performance in the future, a review of several recent studies and models projecting CO2 emissions in India and other countries has been undertaken and is summarized in Annex 6. These include projections undertaken by the World Bank earlier (but not as part of the Low Carbon Growth Strategy study under which this background paper was commissioned), the International Energy Agency (IEA), the GoI’s Planning Commission, and those cited by the IPCC’s 3rd working group. In virtually all of the studies and scenarios, India’s CO2 emission intensity declines through 2030 (except for one scenario in one model). This suggests that there is an opportunity for India to remain on a relatively low carbon growth trajectory.7 The Low Carbon Growth Strategy study is developing a bottom-up model to evaluate a range of future scenarios and to help develop, monitor, and refine policies and programs that will maintain low carbon intensity for this rapidly growing economy by international standards.
Conclusions
The key findings on India’s CO2 emissions performance that emerge from an analysis of CO2 emission trends and drivers for 70 countries between 1994 and 2004, complemented by a limited review of future projections from existing studies, are as follows:
• By two measures⎯CO2 emissions per capita and CO2 emissions per unit of GDP PPP⎯India emerges as a relatively low carbon economy by global comparison.
• India has also been offsetting its CO2 emissions in line with the performance of the global economy through a combination of reduced energy intensity and lower carbon intensity of fossil fuels.
• India has managed to improve both the level of offsetting and CO2 emissions intensity of the economy over the period of 1999–2004 compared to 1994–1999, when its economic growth accelerated and against the backdrop of increasing CO2 intensity of the global economy.
7 An analysis of the power sector development plan given in the Government 11th Five Year Plan, reported in a parallel paper being submitted by the World Bank to the GoI, quantifies the CO2 reducing impact of several specific measures that are already in government programs.
25
• Most of the available projections undertaken by reputed independent international organizations indicate that India’s CO2 intensity per unit of GDP is likely to continue to decline through 2030-2050. In this context, international financial institutions such as the World Bank can make an important contribution by supporting, strengthening, and accelerating the implementation of government policies and programs that reduce CO2 intensity as the economy continues to grow at a rapid pace, and by bringing concessional financing as needed.
• Given large variations in CO2 performance across countries and large swings in this performance across time periods, further in-depth work is necessary to better understand the key determinants of India’s CO2 emissions and policies that would be effective in keeping CO2 intensity low.

26
Annex 1. Data Sources
Although the data are taken from well established sources, where updating and regular publication are observed, there are clearly possibilities of differences between the common sources and government’s statistics. Differences in definition, differences in assumptions about conversion factors to energy equivalents and CO2 emissions, and lags in publications can all lead to divergences in figures given for the decomposition, as well as in the basic data used. Inferences made about individual country results are limited by the accuracy of the data available. The specific sources for data for the main variables discussed in this study are detailed below. The emission of CO2 from fossil fuel consumption (million metric tons) The data source for emissions of fossil fuel consumption was the U.S. Department of Energy Web site8, produced by the Energy Information Administration (EIA). To arrive at the total emissions from all fossil fuels, it is necessary to aggregate the emissions from the three fuels involved (coal, oil, and natural gas) into common units. This is provided by the EIA through a two stage calculation. First, consumption of each fuel measured in physical units is converted into British thermal units (Btu) as a common energy unit that can be aggregated to provide a measure of total fossil fuel consumption9. The second step is to derive emissions of CO2 for each fossil fuel. Different fuels require an individual conversion factor from energy available to emissions produced, and the conversion factor for coal further depends on the quality of coal consumed. Details of these conversion factors are not provided on the EIA Web site. Data in million metric tons of CO2 emitted are provided for a list of 163 countries for every year in our data period and, from these, the 70 countries with the largest CO2 emissions in 2004 were selected for further study. The consumption of fossil fuels (quadrillion Btu) The EIA Web site provides consumption data for the three fossil fuels measured in Btu, and these are aggregated to provide the total fossil fuel consumption. The ratio of fossil fuel emissions to the consumption of fossil fuels provides the value of C, the emissions per unit of fossil fuel defined in equations (1) and (2). The consumption of primary commercial energy (quadrillion Btu) The EIA figures for the consumption of primary commercial energy includes oil, dry gas, coal, net hydro production, net nuclear production, and renewable sources of electricity supplied to the grid (net geothermal, solar, wind, and wood and waste). It does not include biomass or solar consumed outside of the power sector. The ratio of the consumption of fossil fuels to the total consumption of primary energy provides the value of S, the share of fossil fuels in total energy. The level of GDP (2000 US$ at purchasing power parity) Data on the level of GDP is taken from the World Development Indicators (World Bank various years). The data chosen was in constant 2000 US dollars, valued according to PPP. Data valued at market exchange rates (MER) in constant US dollars was also investigated. In virtually every case, data valued at MER showed the same percentage increase between 1994 and 2004 as the data in PPP. This indicated that for each country, the ratio between MER-based and PPP-based figures was constant throughout this period because of the lack of updating of the PPP calculations. The ranking
8 http://www.eia.doe.gov/emeu/international/contents.html 9 For coal, which comes in various qualities ranging from lignite to hard coal, the conversion factor depends strongly on the type and quality of the coal consumed and can be a source of differences among various estimates of emissions.
27
of countries by energy intensity (energy consumption per unit of GDP) does change markedly when the calculation is shifted from PPP to MER, but this does not affect the decomposition analysis which focuses on changes in emission during the period. The ratio of total energy consumption to GDP (coefficient I in equation 2) provides the measure of energy intensity. The population of the country (millions) Data on population is taken from the UN Population Fund and is based on extrapolations from the most recent census data available. The ratio of GDP to population (coefficient G in equation 2) provides the measure of GDP per capita.

28
Annex 2. Comparison of Decomposition of CO2 emissions in India using EIA and Government of India data
This section provides an assessment of India’s CO2 performance from 1994 to 2004 using both GoI data and information from the EIA in June 2006, which is based on earlier published government sources. GoI data can be taken as the most authoritative currently available. The data from the GoI takes account of the specific quality of the fuels consumed, which is reflected in the thermal content and in the emissions per physical unit. As described in Annex 1, data on GDP at 2000 US dollars in PPP is from the World Development Indicators (WDI; World Bank various years), as the sole source for comparable PPP data, and population data continued to be taken from the UN Population Fund as the most widely used estimate of population between censuses. Data from the two sources is shown so as to illustrate the differences, and provide alternative decompositions. a. Consumption of fossil fuel data in physical units
EIA 1994
GoI 1994
EIA 2004
GoI 2004
Petroleum – ‘000 barrels a day 1413 1412 2450 2419 Dry gas – billion cubic feet 594 612 1088 1185 Coal – million short tons 314 261 478 397
b. Consumption of energy in thermal units (quadrillion British thermal units)
EIA 1994
GoI 1994
EIA 2004
GoI 2004
Petroleum 2.94 2.88 5.02 4.92 Dry gas 0.68 0.62 1.13 1.26 Coal 5.45 5.05 8.11 7.19 All primary energy including non-fossil fuels 9.97 8.89 15.42 13.84
c. Emission of CO2 from fossil fuel consumption (million metric tons)
EIA 1994
GoI 1994
EIA 2004
GoI 2004
Petroleum 193 200 306 342 Dry gas 36 33 64 67 Coal 497 461 741 656 All fossil fuels including gas flaring 729 693 1113 1064
d. Gross Domestic Product in billion 2000 US$ at PPP
WDI 1994 WDI 2004
GDP 323 590

29
e. Population in millions
UNFAP 1994 UNFAP 2004 Population 918 1087
The comparison of the EIA data and the recent GoI data exhibit some important differences. EIA data consistently suggest higher fuel consumption, particularly coal, and as a consequence GoI figures suggest that CO2 emissions in 1994 and in 2004 are about 5 percent lower than those given by the EIA. These differences are also reflected in the decomposition analysis. Table A2.1 below and Figure 1 in the main text show the results of applying the decomposition formula (equation 4) to the data. Table A2.1 Decomposition of changes in emissions between 1994 and 2004 (million metric tons)
Ceff Seff Ieff Geff Peff ΔE EIA data -31.7 20.0 -152.4 394.4 153.2 383.6 GoI data -15.9 3.9 -139.1 376.0 146.0 371.0
To interpret these results, note that a positive coefficient indicates that the factor in question has contributed to an increase in emissions, whereas a negative sign indicates that the factor has helped to reduce emissions. Accordingly in India increases in population (Peff) and per capita GDP (Geff) contribute to higher emissions. This is a direct consequence of an increase in the size of the economy. Likewise the small positive value of Seff suggests a slight shift in the fuel mix towards more CO2 intensive fossil fuels. Conversely the negative coefficients on Ieff and Ceff indicate that some of the growth in CO2 has been offset by improvements in intensity and the emissions per unit of fossil fuel used. These are likely to be a consequence of factors such as changes in economic structure, efficiency and technology. Comparison of EIA and GoI data also suggests that differences appear to be small, and importantly for none of the variables is the sign reversed. The magnitudes of the five factors differ but the main conclusions on the relative importance of the different factors are similar.

30
Annex 3. Decomposition of Emissions between 1994 and 2004 (million metric tons)
Decomposition of Emissions between 1994 and 1999 (million metric tons) Country Ceff Seff Ieff Geff Peff ΔE Norway 0.0 3.3 -3.1 6.3 1.3 7.9 USA -3.2 -19.2 -601.2 753.6 289.4 419.2 Ireland -0.6 0.1 -5.8 14.0 1.5 9.1 Switzerland -0.3 0.9 -0.3 2.0 1.0 3.2 Austria 0.3 -0.3 -1.2 7.2 0.7 6.7 United Kingdom -26.0 -4.1 -69.5 73.1 9.5 -17.1 Denmark -5.4 -2.6 -7.3 7.0 1.3 -7.0 Canada -3.4 31.5 -56.4 69.6 24.6 65.9 Netherlands 7.1 -2.5 -29.8 34.3 6.6 15.8 Belgium -5.8 -0.9 1.7 13.3 2.2 10.5 Sweden -0.4 -3.1 -6.6 8.6 0.5 -1.1 Finland -6.3 -4.8 -10.0 10.3 0.8 -9.9 Australia 4.5 2.3 -1.6 47.3 19.2 71.8 Japan -10.9 -23.7 53.5 28.0 14.5 61.4 France -0.5 7.5 -11.2 38.4 7.3 41.5 Germany -28.1 -13.3 -67.6 63.5 9.9 -35.6 Italy -10.4 1.0 9.6 33.1 3.3 36.7 Singapore 0.7 0.0 -4.4 12.6 13.9 22.8 Spain -3.4 10.3 8.4 43.1 4.1 62.5 Israel -0.4 0.2 0.3 4.1 7.2 11.4 New Zealand -0.2 1.7 -3.1 3.2 1.5 3.2 UAE 0.3 0.0 -6.0 0.5 29.0 23.8 Greece -1.6 -1.2 0.5 10.0 3.0 10.8 Korea, Rep. of -5.8 -16.5 8.8 69.6 16.1 72.2 Portugal -0.1 4.1 1.8 10.1 0.9 16.8 Bahrain 0.3 0.0 0.6 0.9 2.7 4.4 Czech Rep. -6.9 -0.3 -19.3 11.2 -0.5 -15.9 Hungary -2.3 0.3 -8.2 9.8 -0.5 -0.9 Oman 1.2 0.0 1.4 0.6 2.3 5.4 Slovak Rep. -4.4 0.4 -7.4 8.2 0.4 -2.9 Saudi Arabia -17.7 0.0 26.7 -19.5 34.1 23.7 Trinidad & Tobago -1.4 0.0 0.6 4.7 0.5 4.5 Poland -9.2 0.2 -79.5 92.2 1.0 4.7 Argentina -2.3 6.4 5.9 5.9 7.6 23.5 Croatia 0.7 -0.3 -1.9 4.4 -0.5 2.3 Chile -0.5 6.6 4.2 8.8 3.4 22.5 Malaysia -2.8 0.3 -4.2 11.4 12.1 16.9 South Africa -0.6 -3.1 -16.9 11.4 33.9 24.7 Mexico 5.2 -10.1 -16.1 19.4 28.2 26.7 Russia -8.6 -17.3 -34.5 -77.3 -15.4 -153.1 Romania -0.1 -9.0 -14.6 1.1 -2.8 -25.3 Bulgaria 0.1 -2.7 -0.7 -1.3 -1.9 -6.3 Thailand -0.8 0.9 33.5 1.5 8.0 43.2 Brazil -4.7 4.2 33.3 10.3 22.4 65.5 Tunisia -0.4 0.0 -0.9 3.2 1.2 3.0 Turkey -3.5 2.9 11.5 16.5 13.9 41.3 Dominican Rep. -0.1 -0.2 0.6 3.2 0.9 4.4

31
Country Ceff Seff Ieff Geff Peff ΔE Iran -13.2 3.0 27.4 29.8 19.1 66.1 Kazakhstan 2.0 2.1 -19.5 0.1 -8.1 -23.3 Belarus -1.8 -0.8 -13.8 9.8 -1.2 -7.8 Colombia -0.9 0.8 0.2 -1.3 5.0 3.9 Algeria -0.3 -0.3 -13.3 7.6 6.7 0.3 Ukraine -9.1 -16.1 18.5 -93.0 -15.7 -115.4 Venezuela 1.0 -1.6 9.3 -7.8 12.8 13.7 China -102.7 -23.9 -1010.1 1111.9 130.2 105.4 Peru 0.2 0.0 -1.2 2.2 2.1 3.4 Philippines 0.7 -2.6 7.0 4.6 6.3 16.0 Morocco 0.1 0.1 0.0 0.5 2.3 3.0 Egypt -2.5 -1.3 -5.4 16.1 9.9 16.8 Ecuador 0.4 -0.1 0.5 -0.8 1.5 1.6 Azerbaijan 17.3 -0.3 -19.4 2.8 2.4 2.8 Syria -0.1 0.4 2.6 0.5 6.0 9.4 Indonesia 4.0 -2.9 38.1 -0.2 16.0 55.1 India -13.7 13.0 -55.2 187.4 74.0 205.6 Vietnam -3.2 0.7 3.6 9.7 2.6 13.4 Pakistan -0.1 4.9 -1.9 4.0 11.6 18.4 Angola 4.6 0.2 -2.5 2.6 1.2 6.1 Bangladesh 0.1 0.2 1.6 3.2 2.4 7.5 Uzbekistan -2.2 1.1 -7.9 6.2 8.1 5.2 Nigeria -19.0 0.0 -2.5 -0.3 11.3 -10.4 Source: World Bank calculations.
32
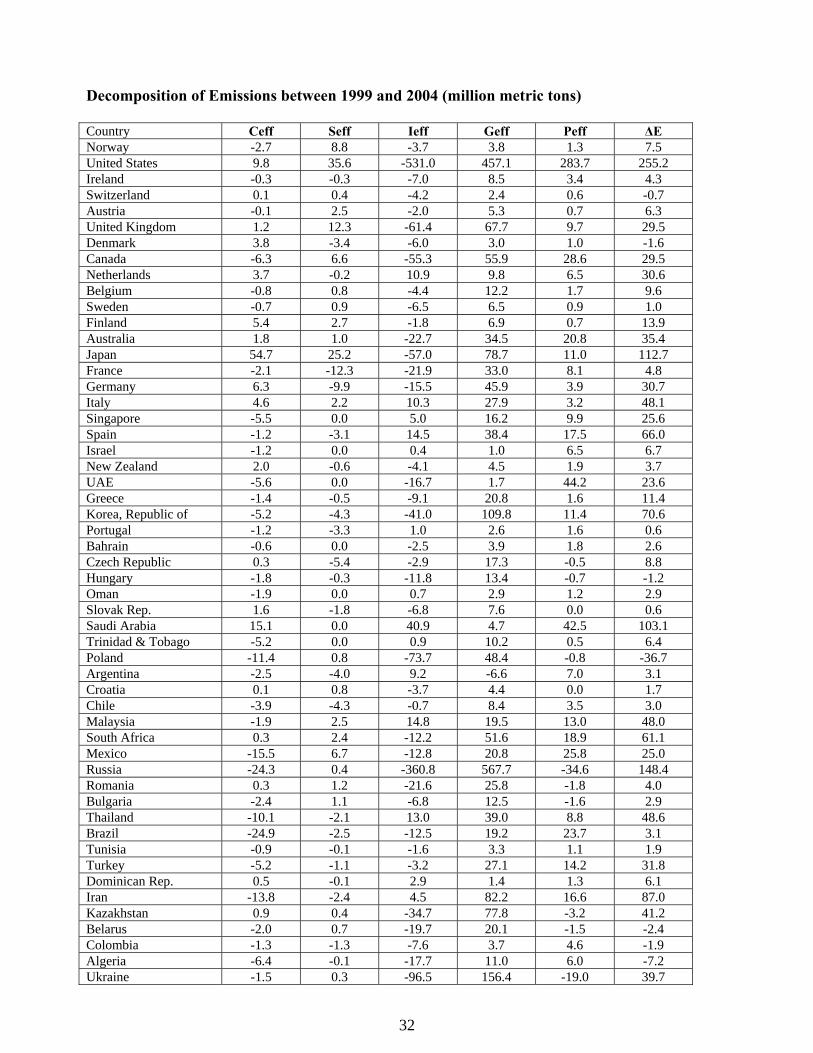
Decomposition of Emissions between 1999 and 2004 (million metric tons) Country Ceff Seff Ieff Geff Peff ΔE Norway -2.7 8.8 -3.7 3.8 1.3 7.5 United States 9.8 35.6 -531.0 457.1 283.7 255.2 Ireland -0.3 -0.3 -7.0 8.5 3.4 4.3 Switzerland 0.1 0.4 -4.2 2.4 0.6 -0.7 Austria -0.1 2.5 -2.0 5.3 0.7 6.3 United Kingdom 1.2 12.3 -61.4 67.7 9.7 29.5 Denmark 3.8 -3.4 -6.0 3.0 1.0 -1.6 Canada -6.3 6.6 -55.3 55.9 28.6 29.5 Netherlands 3.7 -0.2 10.9 9.8 6.5 30.6 Belgium -0.8 0.8 -4.4 12.2 1.7 9.6 Sweden -0.7 0.9 -6.5 6.5 0.9 1.0 Finland 5.4 2.7 -1.8 6.9 0.7 13.9 Australia 1.8 1.0 -22.7 34.5 20.8 35.4 Japan 54.7 25.2 -57.0 78.7 11.0 112.7 France -2.1 -12.3 -21.9 33.0 8.1 4.8 Germany 6.3 -9.9 -15.5 45.9 3.9 30.7 Italy 4.6 2.2 10.3 27.9 3.2 48.1 Singapore -5.5 0.0 5.0 16.2 9.9 25.6 Spain -1.2 -3.1 14.5 38.4 17.5 66.0 Israel -1.2 0.0 0.4 1.0 6.5 6.7 New Zealand 2.0 -0.6 -4.1 4.5 1.9 3.7 UAE -5.6 0.0 -16.7 1.7 44.2 23.6 Greece -1.4 -0.5 -9.1 20.8 1.6 11.4 Korea, Republic of -5.2 -4.3 -41.0 109.8 11.4 70.6 Portugal -1.2 -3.3 1.0 2.6 1.6 0.6 Bahrain -0.6 0.0 -2.5 3.9 1.8 2.6 Czech Republic 0.3 -5.4 -2.9 17.3 -0.5 8.8 Hungary -1.8 -0.3 -11.8 13.4 -0.7 -1.2 Oman -1.9 0.0 0.7 2.9 1.2 2.9 Slovak Rep. 1.6 -1.8 -6.8 7.6 0.0 0.6 Saudi Arabia 15.1 0.0 40.9 4.7 42.5 103.1 Trinidad & Tobago -5.2 0.0 0.9 10.2 0.5 6.4 Poland -11.4 0.8 -73.7 48.4 -0.8 -36.7 Argentina -2.5 -4.0 9.2 -6.6 7.0 3.1 Croatia 0.1 0.8 -3.7 4.4 0.0 1.7 Chile -3.9 -4.3 -0.7 8.4 3.5 3.0 Malaysia -1.9 2.5 14.8 19.5 13.0 48.0 South Africa 0.3 2.4 -12.2 51.6 18.9 61.1 Mexico -15.5 6.7 -12.8 20.8 25.8 25.0 Russia -24.3 0.4 -360.8 567.7 -34.6 148.4 Romania 0.3 1.2 -21.6 25.8 -1.8 4.0 Bulgaria -2.4 1.1 -6.8 12.5 -1.6 2.9 Thailand -10.1 -2.1 13.0 39.0 8.8 48.6 Brazil -24.9 -2.5 -12.5 19.2 23.7 3.1 Tunisia -0.9 -0.1 -1.6 3.3 1.1 1.9 Turkey -5.2 -1.1 -3.2 27.1 14.2 31.8 Dominican Rep. 0.5 -0.1 2.9 1.4 1.3 6.1 Iran -13.8 -2.4 4.5 82.2 16.6 87.0 Kazakhstan 0.9 0.4 -34.7 77.8 -3.2 41.2 Belarus -2.0 0.7 -19.7 20.1 -1.5 -2.4 Colombia -1.3 -1.3 -7.6 3.7 4.6 -1.9 Algeria -6.4 -0.1 -17.7 11.0 6.0 -7.2 Ukraine -1.5 0.3 -96.5 156.4 -19.0 39.7

33
Country Ceff Seff Ieff Geff Peff ΔE Venezuela 1.2 1.6 -0.8 -4.4 12.8 10.4 China 24.4 -5.1 148.2 1510.9 127.4 1805.9 Peru -0.4 -1.9 -1.4 2.5 2.1 0.9 Philippines -1.2 1.7 -10.8 9.5 6.7 6.0 Morocco -1.0 -1.1 -4.9 3.6 2.2 -1.1 Egypt -9.2 4.4 13.0 12.3 12.5 32.9 Ecuador 0.1 0.3 -2.1 3.4 1.5 3.2 Azerbaijan -17.4 -0.9 -14.9 20.0 1.4 -11.8 Syria -1.2 0.3 -5.5 2.4 6.5 2.4 Indonesia -6.7 -0.2 -12.5 45.6 18.2 44.3 India -18.7 6.5 -103.4 212.6 81.0 178.0 Vietnam -2.5 0.7 1.3 13.5 3.4 16.4 Pakistan -3.9 -4.4 -9.3 10.2 11.0 3.6 Angola -0.3 0.0 1.1 3.2 2.3 6.3 Bangladesh 0.0 0.0 2.6 5.4 3.1 11.2 Uzbekistan -1.6 0.0 -6.2 17.8 8.1 18.1 Nigeria -9.3 -0.5 -3.8 12.9 10.2 9.5 Source: World Bank calculations.

34
Annex 4. Emissions Intensity in 1994, 1999, and 2004
Carbon Emissions intensity (tonnes/constant 2000 US$, million)
Carbon Emissions intensity (tonnes/constant 2000 PPP$, million) Region/Country
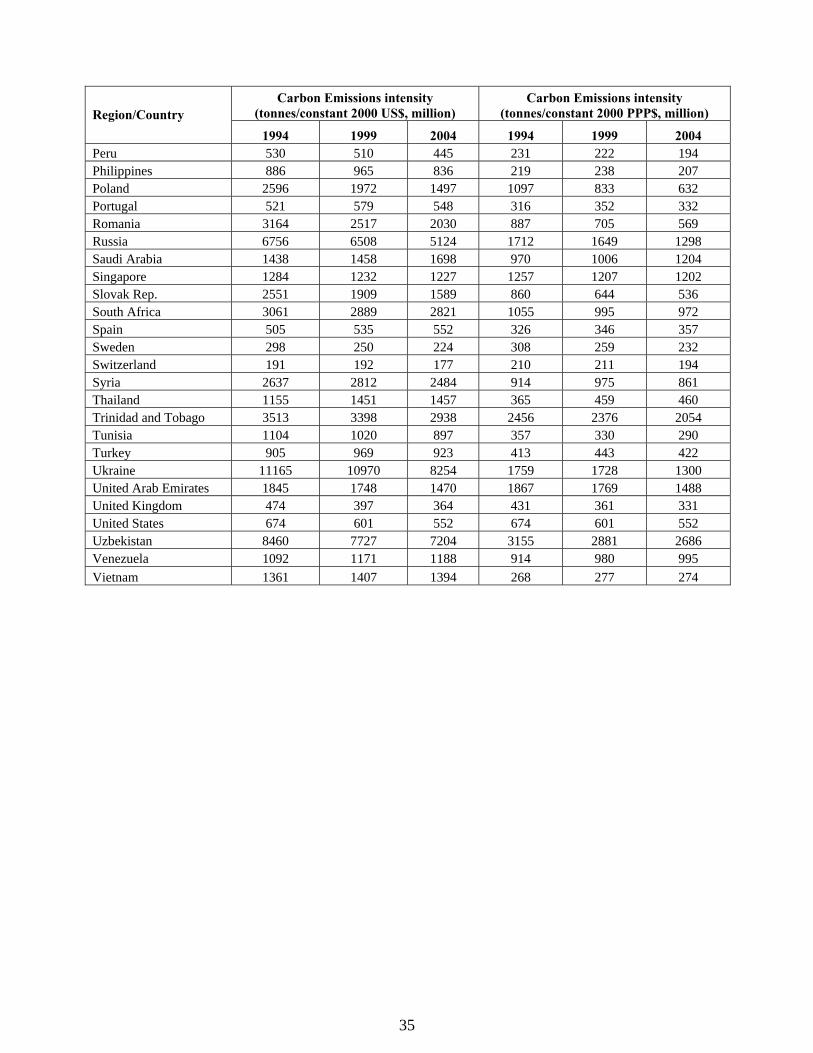
1994 1999 2004 1994 1999 2004 Algeria 1851 1569 1161 625 530 392 Angola 1211 1516 1594 546 684 719 Argentina 449 486 495 286 309 316 Australia 880 895 848 717 729 690 Austria 345 338 340 292 286 288 Azerbaijan 10766 10233 4683 2850 2709 1240 Bahrain 2535 2659 2292 1935 2030 1749 Bangladesh 553 602 655 131 142 155 Belarus 6264 4796 3308 1661 1272 877 Belgium 642 618 599 535 515 499 Brazil 519 579 514 250 278 247 Bulgaria 3958 3701 3101 1020 954 799 Canada 868 823 747 733 694 631 Chile 657 819 707 351 438 378 China 3911 2624 2745 943 632 661 Colombia 701 703 586 235 235 196 Croatia 1208 1112 973 543 499 437 Czech Republic 2403 1893 1758 872 687 638 Denmark 475 369 334 497 386 350 Dominican Republic 755 778 948 272 280 341 Ecuador 1193 1251 1154 479 502 463 Egypt 1319 1208 1286 555 509 541 Finland 619 414 465 556 372 418 France 318 314 287 276 273 249 Germany 514 452 442 468 412 403 Greece 886 864 774 545 531 476 Hungary 1547 1298 1017 556 466 366 India 2261 2113 1887 433 405 362 Indonesia 1417 1675 1564 390 461 431 Iran 3074 3269 3163 843 896 867 Ireland 526 434 359 460 380 314 Israel 554 555 548 442 443 437 Italy 412 412 428 314 314 326 Japan 250 254 259 351 357 364 Kazakhstan 8764 7871 6309 2480 2227 1785 Korea, Republic of 936 904 810 631 609 546 Malaysia 1364 1273 1437 625 583 658 Mexico 702 661 624 453 426 402 Morocco 913 918 727 305 307 243 Netherlands 706 633 670 600 537 569 New Zealand 694 662 614 477 455 423 Nigeria 2460 1937 1663 1126 887 762 Norway 267 269 283 290 292 307 Oman 935 1084 1027 604 700 663 Pakistan 1416 1460 1235 400 412 349
35
Carbon Emissions intensity (tonnes/constant 2000 US$, million)
Carbon Emissions intensity (tonnes/constant 2000 PPP$, million) Region/Country
1994 1999 2004 1994 1999 2004 Peru 530 510 445 231 222 194 Philippines 886 965 836 219 238 207 Poland 2596 1972 1497 1097 833 632 Portugal 521 579 548 316 352 332 Romania 3164 2517 2030 887 705 569 Russia 6756 6508 5124 1712 1649 1298 Saudi Arabia 1438 1458 1698 970 1006 1204 Singapore 1284 1232 1227 1257 1207 1202 Slovak Rep. 2551 1909 1589 860 644 536 South Africa 3061 2889 2821 1055 995 972 Spain 505 535 552 326 346 357 Sweden 298 250 224 308 259 232 Switzerland 191 192 177 210 211 194 Syria 2637 2812 2484 914 975 861 Thailand 1155 1451 1457 365 459 460 Trinidad and Tobago 3513 3398 2938 2456 2376 2054 Tunisia 1104 1020 897 357 330 290 Turkey 905 969 923 413 443 422 Ukraine 11165 10970 8254 1759 1728 1300 United Arab Emirates 1845 1748 1470 1867 1769 1488 United Kingdom 474 397 364 431 361 331 United States 674 601 552 674 601 552 Uzbekistan 8460 7727 7204 3155 2881 2686 Venezuela 1092 1171 1188 914 980 995 Vietnam 1361 1407 1394 268 277 274

36
Annex 5. Averaged Emissions and Intensities of Top 20 Emitters during 1993-95, 1998-00, and 2003-05
1993-1995
1998-2000
2003-2005
1993-1995
1998-2000
2003-2005
1993-1995
1998-2000
2003-2005
Average CO2 emissions
(million tons of CO2) Average CO2 intensity at MER
(tons of CO2 per million $ GDP) Average CO2 intensity at PPP
(tons of CO2 per million $ GDP) United States 5,226 5,686 5,902 676 605 553 676 605 553 China 2,743 2,938 4,686 3,865 2,657 2,715 931 640 654 Russia 1,742 1,540 1,664 6,741 6,456 5,077 1,707 1,635 1,286 Japan 1,063 1,145 1,235 244 251 254 348 358 363 India 758 949 1,108 2,339 2,164 1,872 448 415 359 Germany 876 848 859 520 459 441 467 411 395 Canada 494 556 624 876 820 793 740 692 669 United Kingdom 567 555 573 477 399 362 435 364 330 Korea, Rep. of 350 412 489 923 875 798 622 590 538 Italy 412 440 468 424 413 414 315 307 308 South Africa 335 373 424 2,979 2,905 2,769 1,026 1,001 954 France 364 402 411 322 314 292 266 260 242 Iran 249 309 413 3,040 3,172 3,252 833 869 891 Australia 281 346 388 887 888 849 676 676 647 Mexico 323 370 390 703 673 634 450 431 406 Saudi Arabia 235 270 381 1,420 1,472 1,761 953 988 1,181 Ukraine 440 325 346 10,715 10,798 8,106 1,687 1,700 1,276 Spain 244 302 371 527 546 565 346 358 371 Brazil 268 332 352 481 530 496 249 275 257 Indonesia 207 258 339 1,402 1,615 1,716 386 445 472
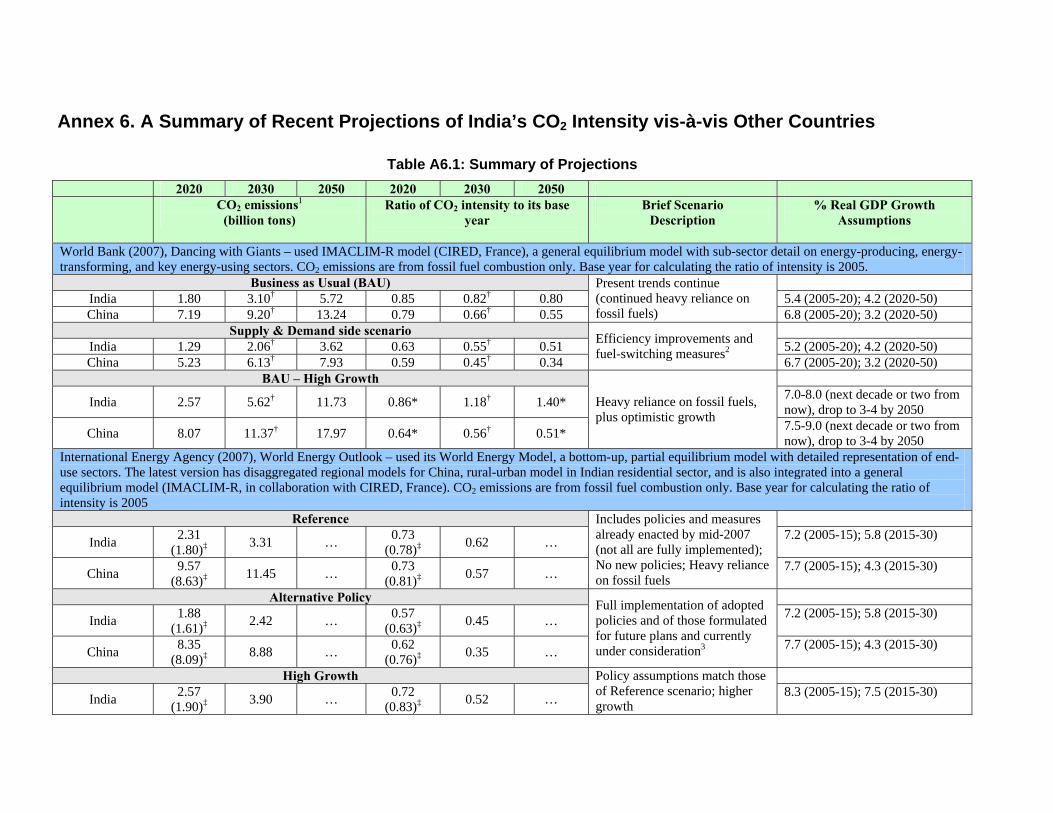
Annex 6. A Summary of Recent Projections of India’s CO2 Intensity vis-à-vis Other Countries
Table A6.1: Summary of Projections 2020 2030 2050 2020 2030 2050 CO2 emissions1
(billion tons) Ratio of CO2 intensity to its base
year
Brief Scenario Description
% Real GDP Growth Assumptions
World Bank (2007), Dancing with Giants – used IMACLIM-R model (CIRED, France), a general equilibrium model with sub-sector detail on energy-producing, energy-transforming, and key energy-using sectors. CO2 emissions are from fossil fuel combustion only. Base year for calculating the ratio of intensity is 2005.
Business as Usual (BAU) India 1.80 3.10† 5.72 0.85 0.82† 0.80 5.4 (2005-20); 4.2 (2020-50) China 7.19 9.20† 13.24 0.79 0.66† 0.55
Present trends continue (continued heavy reliance on fossil fuels) 6.8 (2005-20); 3.2 (2020-50)
Supply & Demand side scenario India 1.29 2.06† 3.62 0.63 0.55† 0.51 5.2 (2005-20); 4.2 (2020-50) China 5.23 6.13† 7.93 0.59 0.45† 0.34
Efficiency improvements and fuel-switching measures2 6.7 (2005-20); 3.2 (2020-50)
BAU – High Growth
India 2.57 5.62† 11.73 0.86* 1.18† 1.40* 7.0-8.0 (next decade or two from now), drop to 3-4 by 2050
China 8.07 11.37† 17.97 0.64* 0.56† 0.51*
Heavy reliance on fossil fuels, plus optimistic growth 7.5-9.0 (next decade or two from
now), drop to 3-4 by 2050 International Energy Agency (2007), World Energy Outlook – used its World Energy Model, a bottom-up, partial equilibrium model with detailed representation of end-use sectors. The latest version has disaggregated regional models for China, rural-urban model in Indian residential sector, and is also integrated into a general equilibrium model (IMACLIM-R, in collaboration with CIRED, France). CO2 emissions are from fossil fuel combustion only. Base year for calculating the ratio of intensity is 2005
Reference
India 2.31 (1.80)‡ 3.31 … 0.73
(0.78)‡ 0.62 … 7.2 (2005-15); 5.8 (2015-30)
China 9.57 (8.63)‡ 11.45 … 0.73
(0.81)‡ 0.57 …
Includes policies and measures already enacted by mid-2007 (not all are fully implemented); No new policies; Heavy reliance on fossil fuels
7.7 (2005-15); 4.3 (2015-30)
Alternative Policy
India 1.88 (1.61)‡ 2.42 … 0.57
(0.63)‡ 0.45 … 7.2 (2005-15); 5.8 (2015-30)
China 8.35 (8.09)‡ 8.88 … 0.62
(0.76)‡ 0.35 …
Full implementation of adopted policies and of those formulated for future plans and currently under consideration3 7.7 (2005-15); 4.3 (2015-30)
High Growth
India 2.57 (1.90)‡ 3.90 … 0.72
(0.83)‡ 0.52 …
Policy assumptions match those of Reference scenario; higher growth
8.3 (2005-15); 7.5 (2015-30)
38
2020 2030 2050 2020 2030 2050 CO2 emissions1
(billion tons) Ratio of CO2 intensity to its base
year
Brief Scenario Description
% Real GDP Growth Assumptions
China 10.09 (9.50)‡ 14.10 … 0.74
(0.79)‡ 0.64 … 9.0 (2005-15); 6.0 (2015-30)
Energy Information Administration, US Department of Energy (2007), International Energy Outlook – used SAGE, a variant of MARKAL developed at the US EIA. CO2 emissions are from fossil fuel combustion only. Base year for calculating the ratio of intensity is 2004.
Reference India 1.72 2.16 … 0.60 0.46 … 6.0 (2004-20); 4.8 (2020-30) China 8.80 11.24 … 0.60 0.47 … 7.0 (2004-20); 5.0 (2020-30)
US 6.94 7.95 … 0.73 0.64 …. 2.9 (2004-20); 2.8 (2020-30) Japan 1.29 1.31 … 0.82 0.78 … 1.4 (2004-20); 0.6 (2020-30) Brazil 0.50 0.60 … 0.87 0.75 …
Only GDP growth rates are available in the report
3.4 (2004-20); 3.2 (2020-30) High Growth
India 1.82 2.40 … 0.59 0.46 … 6.4 (2004-20); 5.3 (2020-30) China 9.34 12.50 … 0.60 0.46 … 7.5 (2004-20); 5.5 (2020-30)
US 7.32 8.71 … 0.72 0.61 … 3.4 (2004-20); 3.3 (2020-30) Japan 1.36 1.44 … 0.81 0.76 … 1.8 (2004-20); 1.1 (2020-30) Brazil 0.54 0.68 … 0.87 0.76 …
Only GDP growth rates are available in the report
3.8 (2004-20); 3.7 (2020-30) Planning Commission, Government of India (2006), Integrated Energy Policy Report – used a bottom-up energy model with detailed end-use sectors developed in conjunction with the Observer Research Foundation. CO2 emissions are from fossil fuel combustion only. Base fiscal year for calculating the ratio of intensity is 2006-07.
… 5.50∝ … … 0.73∝ … Coal-based development 8.0 (2006-31) India … 3.70∝ … … 0.57∝ … Best scenario4 8.0 (2006-31)
Projections used in the Working Group III of IPCC (2007)’s 4th Assessment report – There are several models used for the report. Below include only a set of widely-cited models. Base year for calculating the ratio of intensity is 2000 for all models. Mini-CAM – a partial equilibrium energy and land-use model, developed at Joint Global Change Research Institute, University of Maryland. CO2 emissions are from fossil fuel combustion and cement manufacture.
India 2.43 3.53 5.26 0.62 0.46 0.27 7.0 (2000-2010); 6.3 (2010-30); 4.6 (2030-50)
US 7.33 7.73 8.44 0.77 0.70 0.60 Reference/BAU 2.4 (2000-2010); 1.7 (2010-30);
1.2 (2030-50) AIM – a soft-linked bottom-up energy and land-use, and top-down model developed at National Institute of Environmental Studies, Japan. CO2 emissions are from fossil fuel combustion only.
India 1.81 2.31 2.74 0.76 0.65 0.41 4.7 (2000-2010); 4.0 (2010-30); 3.2 (2030-50)
China 4.71 5.22 6.27 0.50 0.38 0.26 5.3 (2000-2010); 4.1 (2010-30); 2.8 (2030-50)
US 6.15 6.93 8.52 0.84 0.84 0.84
Reference/BAU
1.4 (2000-2010); 1.4 (2010-30);

39
2020 2030 2050 2020 2030 2050 CO2 emissions1
(billion tons) Ratio of CO2 intensity to its base
year
Brief Scenario Description
% Real GDP Growth Assumptions
1.1 (2030-50)
Japan 1.12 1.13 1.34 0.78 0.75 0.83 0.7 (2000-2010); 0.6 (2010-30); 0.3 (2030-50)
MERGE – a Computable General Equilibrium model with detailed representation in power sector, developed by A. Manne (Stanford) and R. Richels (EPRI, US). CO2 emissions are from fossil fuel combustion only.
India 1.55 1.98 3.00 0.59 0.48 0.30 5.5 (2000-2010); 4.8 (2010-30); 4.3 (2030-50)
China 4.55 5.50 8.38 0.59 0.45 0.29 5.1 (2000-2010); 4.7 (2010-30); 4.3 (2030-50)
US 7.04 6.86 7.86 0.76 0.64 0.57 2.4 (2000-2010); 1.9 (2010-30); 1.3 (2030-50)
Japan 1.22 1.24 1.45 0.82 0.73 0.67
Reference/BAU
1.5 (2000-2010); 1.2 (2010-30); 1.1 (2030-50)
POLES – a top-down, partial equilibrium energy model that is disaggregated into sectors. Key developer is Patrick Criqui (Institute of Energy Policy and Economics, France). CO2 emissions are from fossil fuel combustion and cement manufacture.
India 3.17 4.32 0.93 0.90 4.8 (2000-30) China 8.16 10.16 0.75 0.65 4.6 (2000-30)
US 6.89 7.37 0.77 0.69 2.0 (2000-30) Japan 1.24 1.28 0.78 0.69 1.5 (2000-30) Brazil 0.78 0.97 0.99 0.97
Reference/BAU
2.9 (2000-30) Notes: † The data for 2030 do not exist and these are from linear interpolation between 2020 and 2050 data. * No exact information on growth path towards 2050. CO2 intensities were calculated based on midpoints of the given ranges of average annual growth rates: 7.5% during 2005-20, then 3.5% during 2020-50 (India); 8.25% during 2005-20, then 3.5% during 2020-50 (China). ‡ 2020 data are linearly interpolated between 2015 and 2030 for comparison across studies. The original 2015 figures are in parentheses. ∝ The figures given are for the fiscal year 2031–32. 1CO2 emissions from fossil fuel combustion in 2005 (Gt): India (1.17), China (5.32), US (5.96), Japan (1.23), and Brazil (0.36). 2Demand side scenario includes additional actions geared toward improving end-use efficiency/energy saving, over and above the energy efficiency improvements already incorporated in the BAU. The additional improvements are (i) a 25 percent improvement in overall energy efficiency in the “composite” sector (including both “pure efficiency” and structural change in the economy with an increase in the share of services in GDP), relative to the base case; (ii) an additional 1.1 percent efficiency gain annually in residential/household energy-using equipment, leading to an eventual 60 percent improvement over the base case; and (iii) a 50 percent improvement in the fuel efficiency of cars by 2050, compared with the base case. Supply side scenario includes a higher share of hydroelectric and nuclear power in both China and India than under the BAU cases, which already incorporate some expansion of non-fossil fuels sectors. The additional improvements include (i) a 20 percent increase in hydroelectric capacity, relative to the base case; (ii) a 30 percent increase in the share of nuclear power in new investments for power generation; (iii) the share of biofuels is increased progressively to 10 percent of the total amount of fuels produced by India and China. The shares of wind and solar energy increase significantly from a very low base but not enough to offset the reduction in the use of traditional biomass; and (iv) energy efficiency is increased by 15 percent in the use of coal for industry and by 8 percent in the use of coal for electricity generation in the new capital stock installed after 2005.

40
3IEA (2007)’s measures included in Alternative Policy Scenario for India and China are provided in Table A6.2. 4GoI’s Planning Commission’s best scenario, provided in Table A6.3.
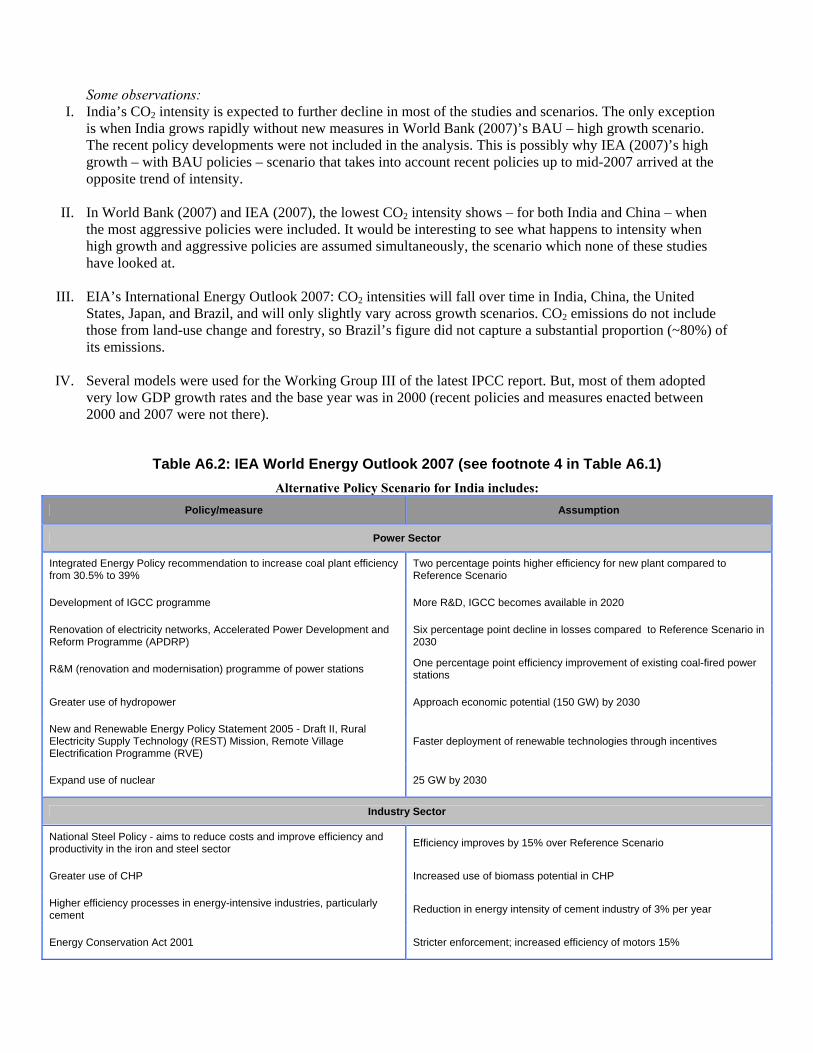
Some observations: I. India’s CO2 intensity is expected to further decline in most of the studies and scenarios. The only exception
is when India grows rapidly without new measures in World Bank (2007)’s BAU – high growth scenario. The recent policy developments were not included in the analysis. This is possibly why IEA (2007)’s high growth – with BAU policies – scenario that takes into account recent policies up to mid-2007 arrived at the opposite trend of intensity.
II. In World Bank (2007) and IEA (2007), the lowest CO2 intensity shows – for both India and China – when the most aggressive policies were included. It would be interesting to see what happens to intensity when high growth and aggressive policies are assumed simultaneously, the scenario which none of these studies have looked at.
III. EIA’s International Energy Outlook 2007: CO2 intensities will fall over time in India, China, the United States, Japan, and Brazil, and will only slightly vary across growth scenarios. CO2 emissions do not include those from land-use change and forestry, so Brazil’s figure did not capture a substantial proportion (~80%) of its emissions.
IV. Several models were used for the Working Group III of the latest IPCC report. But, most of them adopted very low GDP growth rates and the base year was in 2000 (recent policies and measures enacted between 2000 and 2007 were not there).
Table A6.2: IEA World Energy Outlook 2007 (see footnote 4 in Table A6.1) Alternative Policy Scenario for India includes:
Policy/measure Assumption
Power Sector
Integrated Energy Policy recommendation to increase coal plant efficiency from 30.5% to 39%
Two percentage points higher efficiency for new plant compared to Reference Scenario
Development of IGCC programme More R&D, IGCC becomes available in 2020
Renovation of electricity networks, Accelerated Power Development and Reform Programme (APDRP)
Six percentage point decline in losses compared to Reference Scenario in 2030
R&M (renovation and modernisation) programme of power stations One percentage point efficiency improvement of existing coal-fired power stations
Greater use of hydropower Approach economic potential (150 GW) by 2030
New and Renewable Energy Policy Statement 2005 - Draft II, Rural Electricity Supply Technology (REST) Mission, Remote Village Electrification Programme (RVE)
Faster deployment of renewable technologies through incentives
Expand use of nuclear 25 GW by 2030
Industry Sector
National Steel Policy - aims to reduce costs and improve efficiency and productivity in the iron and steel sector Efficiency improves by 15% over Reference Scenario
Greater use of CHP Increased use of biomass potential in CHP
Higher efficiency processes in energy-intensive industries, particularly cement Reduction in energy intensity of cement industry of 3% per year
Energy Conservation Act 2001 Stricter enforcement; increased efficiency of motors 15%
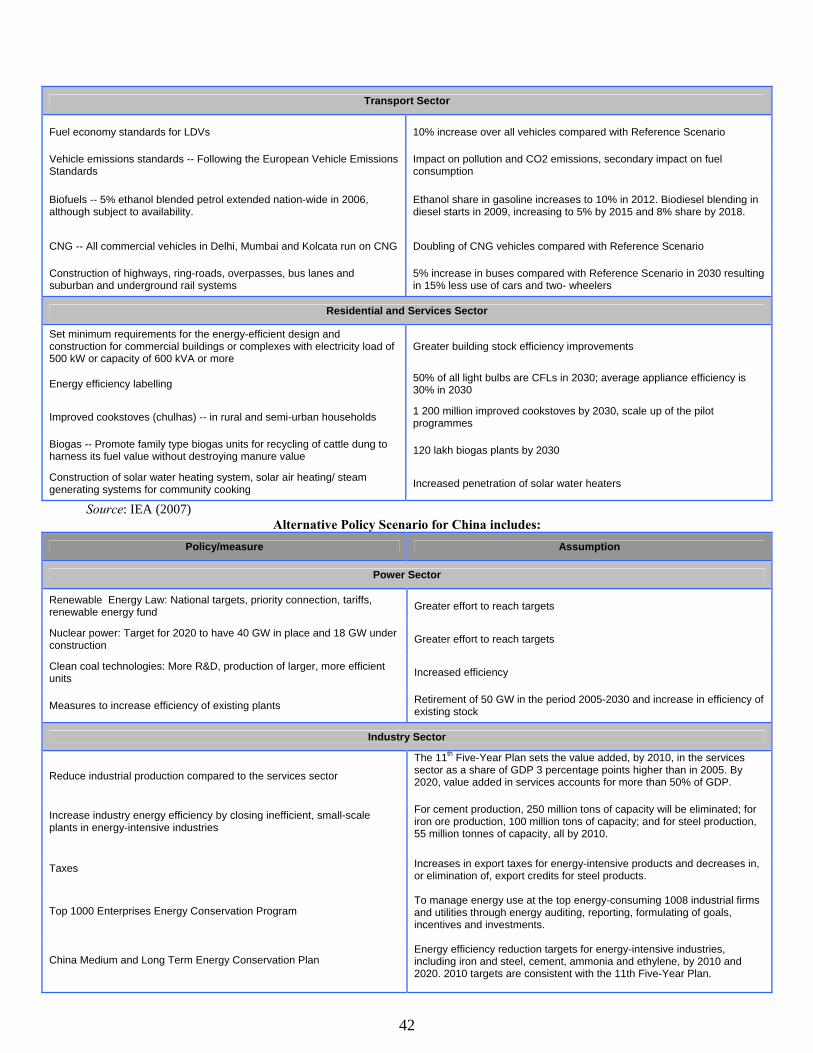
42
Transport Sector
Fuel economy standards for LDVs 10% increase over all vehicles compared with Reference Scenario
Vehicle emissions standards -- Following the European Vehicle Emissions Standards
Impact on pollution and CO2 emissions, secondary impact on fuel consumption
Biofuels -- 5% ethanol blended petrol extended nation-wide in 2006, although subject to availability.
Ethanol share in gasoline increases to 10% in 2012. Biodiesel blending in diesel starts in 2009, increasing to 5% by 2015 and 8% share by 2018.
CNG -- All commercial vehicles in Delhi, Mumbai and Kolcata run on CNG Doubling of CNG vehicles compared with Reference Scenario
Construction of highways, ring-roads, overpasses, bus lanes and suburban and underground rail systems
5% increase in buses compared with Reference Scenario in 2030 resulting in 15% less use of cars and two- wheelers
Residential and Services Sector
Set minimum requirements for the energy-efficient design and construction for commercial buildings or complexes with electricity load of 500 kW or capacity of 600 kVA or more
Greater building stock efficiency improvements
Energy efficiency labelling 50% of all light bulbs are CFLs in 2030; average appliance efficiency is 30% in 2030
Improved cookstoves (chulhas) -- in rural and semi-urban households 1 200 million improved cookstoves by 2030, scale up of the pilot programmes
Biogas -- Promote family type biogas units for recycling of cattle dung to harness its fuel value without destroying manure value 120 lakh biogas plants by 2030
Construction of solar water heating system, solar air heating/ steam generating systems for community cooking Increased penetration of solar water heaters
Source: IEA (2007) Alternative Policy Scenario for China includes:
Policy/measure Assumption
Power Sector
Renewable Energy Law: National targets, priority connection, tariffs, renewable energy fund Greater effort to reach targets
Nuclear power: Target for 2020 to have 40 GW in place and 18 GW under construction Greater effort to reach targets
Clean coal technologies: More R&D, production of larger, more efficient units Increased efficiency
Measures to increase efficiency of existing plants Retirement of 50 GW in the period 2005-2030 and increase in efficiency of existing stock
Industry Sector
Reduce industrial production compared to the services sector
The 11th Five-Year Plan sets the value added, by 2010, in the services sector as a share of GDP 3 percentage points higher than in 2005. By 2020, value added in services accounts for more than 50% of GDP.
Increase industry energy efficiency by closing inefficient, small-scale plants in energy-intensive industries
For cement production, 250 million tons of capacity will be eliminated; for iron ore production, 100 million tons of capacity; and for steel production, 55 million tonnes of capacity, all by 2010.
Taxes
Increases in export taxes for energy-intensive products and decreases in, or elimination of, export credits for steel products.
Top 1000 Enterprises Energy Conservation Program
To manage energy use at the top energy-consuming 1008 industrial firms and utilities through energy auditing, reporting, formulating of goals, incentives and investments.
China Medium and Long Term Energy Conservation Plan
Energy efficiency reduction targets for energy-intensive industries, including iron and steel, cement, ammonia and ethylene, by 2010 and 2020. 2010 targets are consistent with the 11th Five-Year Plan.

43
Transport Sector
Fuel economy standards for LDVs Cars in 2030 40% more efficient than current models. Regulation extended to trucks
Vehicle taxation Sales taxes for cars, SUVs, medium buses ranging from 3 to 20% of sale price proportional to engine size
Scrappage
Not-for-revenue passenger vehicles to be scrapped after 10/15 years
For-revenues passenger vehicles to be scrapped after 8/10 years (or 500 000 km)
Trucks to be scrapped when they reach 10 years (or 400 000 km)
Public transport and fuel taxes Decrease in private cars and trucks use of 5% in 2030 compared to Reference Scenario
Alternative Fuels
Support of CNG subsidise on the natural gas refueling station set up and land allocation
Biofuels – subsidies for ethanol and biodiesel production. Indicative targets of ethanol consumption of 10 million tons by 2020 and 2 million tons by 2020 Targets met in 2020, strengthened and prolonged to 2030
Residential and Services Sector
Minimum efficiency performance standards set for refrigerators, air-conditioners and colour TVs. All standards met, strengthened and extended to other appliances
Energy efficiency mandatory labelling for refrigerators, air conditioners and clothes washers. Labelling standards implemented and extended to other products
Building codes: National target to reduce energy consumption in new buildings by 50% by 2010 compared to efficiency of 1980’s buildings. Standards for three major climate zones already in place.
Standards met and prolonged
Source: IEA (2007)
Table A6.3: Planning Commission (2006) best scenario (see footnote 5 in Table A6.1)
Measures Description
Forced hydro Development of the entire (150 GW) domestic hydro potential (from 32 GW now) by 2031
Coal power plant efficiency Thermal efficiency of future coal power plants increased to 38-40% from 36% for the present 500 MW super critical boilers
Higher freight share of railways Increased railways freight share from 32% to 50%
Maximize nuclear Accelerated development of nuclear capacity to 63 GW
Wind power to 30 GW
Solar power to 10 GW
Biomass power to 50 GW Scale-up renewables
10 Mt of bio-diesel and 5 Mt of ethanol
Fuel efficiency of all motorized vehicles increased by 50% Vehicle efficiency and public transport Public transport
Forced natural gas 16% of electricity generation from gas
Demand side management Reduce electricity demand by 15%
Source: Planning Commission (2006)

44
Bibliography
Ang, B. W. 2004. “Decomposition Analysis for Policymaking in Energy: Which is the Preferred Method?” Energy Policy 32: 1131–39.
———. 2005. “The LMDI Approach to Decomposition Analysis: A Practical Guide.” Energy Policy 33: 867–71.
Ang, B. W., and F. Q. Zhang. 1999. “Inter-Regional Comparisons of Energy-Related CO2 Emissions Using the Decomposition Technique.” Energy 24 (4): 297–304.
Bacon, R.W., S. Bhattacharya, R. Damania, M. Kojima, and K. Lvovsky. 2007. “Growth and CO2 Emissions: How do Different Countries Fare?” Environment Department, The World Bank, Washington D.C.
De la Chesnaye, F. and J. Weyant (eds). 2006. Multi-Greenhouse Gas Mitigation and Climate Policy. The Energy Journal, Special Issue, November 2006. http://www.stanford.edu/group/EMF/projects/projectemf21.htm
Duro, J. A., and E. Padilla. 2006. “International Inequalities in per Capita CO2 emissions: A Decomposition Methodology by Kaya Factors.” Energy Economics 28: 170–87.
Ebohon, O. J., and A. J. Ikeme. 2006. “Decomposition Analysis of CO2 Emission Intensity Between Oil-Producing and Non-Oil Producing Sub-Saharan African Countries.” Energy Policy 34: 3599–3611.
EIA (Energy Information Administration). 2007. International Carbon Emissions Data. www.eia.doe.gov/environment.html.
Heil, M. T., and Q. T. Wodon. 2000. “Future Inequality in CO2 Emissions and the Impact of Abatement Proposals.” Environmental and Resource Economics 17: 163–81.
Herzog, T., K. A. Baumert, and J. Pershing. 2006. Target Intensity. An Analysis of Greenhouse Gas Intensity Targets. Washington, DC: World Resources Institute.
Hoffman, B., and K. Labar. 2007. “Structural Change and Energy Use: Evidence from China’s Provinces.” China Working Paper Series No. 6, World Bank, Washington, DC.
Holtsmark, B. J., and K. H. Alfsen. 2004. “PPP Correction of the IPCC Emission Scenarios – Does It Matter?” Discussion Paper No. 366, Research Department, Statistics Norway, Oslo.
International Energy Agency. 2007. World Energy Outlook 2007. IEA, Paris. IPCC (Intergovernmental Panel on Climate Change). 2007. “Climate Change 2007: Mitigation of
Climate Change.” Working Group III Contribution to the IPCC Fourth Assessment Report: Summary for Policymakers. UNEP.
Kaya, Y. 1990. “Impact of Carbon Dioxide Emission Control on GNP Growth: Interpretation of Proposed Scenarios.” Paper presented to IPCC Energy and Industry Subgroup, Response Strategies Working Group.
Lee, K., and W. Oh. 2006. “Analysis of CO2 Emissions in APEC Countries: A Time-Series and a Cross-Sectional Decomposition Using the Log Mean Divisia Method.” Energy Policy 34: 2779–87.
Liao, H., Y. Fan, and Y. Wei. 2007. “What Induced China’s Energy Intensity to Fluctuate: 1997–2006?” Energy Policy 35 (9): 4640–4649.
Lise, W. 2006. “Decomposition of CO2 Emissions over 1980–2003 in Turkey.” Energy Policy 34: 1841–52.
Liu, N., and B. Ang. 2007. “Factors Shaping Aggregate Energy Intensity Trend for Industry: Energy Intensity versus Product Mix.” Energy Economics 29: 609–35.

45
Ma, C., and D. I. Stern. 2006. “China’s Changing Energy Intensity Trend: A Decomposition Analysis.” Working Papers in Economics No. 0615, Rensselaer Polytechnic Institute, Troy, NY.
Nag, B., and J. K. Parikh. 2005. “Carbon Emission Coefficient of Power Consumption in India: Baseline Determination from the Demand Side.” Energy Policy 33: 777–86.
Paul, S., and R. N. Bhattacharya. 2004. “CO2 Emission from Energy Use in India: A Decomposition Analysis.” Energy Policy 32: 585–93.
Planning Commission. 2006. Integrated Energy Policy: Report of the Expert Committee. Government of India, New Delhi.
Stern, D. I. 2003. “The Environmental Kuznets Curve.” Internet Encyclopaedia of Ecological Economics. http://www.ecoeco.org/pdf/stern.pdf.
Viguier, L. 1999. “Emissions of SO2, NOx and CO2 in Transition Economies: Emissions Inventories and Divisia Index Analysis.” The Energy Journal 20: 59–87.
Wang, C., J. Chen, and J. Zou. 2005. “Decomposition of Energy-Related CO2 Emission in China: 1957–2000.” Energy 30: 73–83.
Winters, L.A., and S. Yusuf (eds). 2007. Dancing with Giant: China, India, and the Global Economy. The World Bank and the Institute of Policy Studies.
World Bank. various years. World Development Indicators. Washington, DC: World Bank. World Resources Institute. 2007. Climate Analysis Indicators Tool. Version 4.0. Washington D.C.
http://cait.wri.org.