emission of so , co , and h s from augustine volcano, 2
TRANSCRIPT
The 2006 Eruption of Augustine Volcano, AlaskaPower, J.A., Coombs, M.L., and Freymueller, J.T., editorsU.S. Geological Survey Professional Paper 1769
Chapter 26
Emission of SO2, CO2, and H2S from Augustine Volcano, 2002–2008
By Kenneth A. McGee1, Michael P. Doukas1, Robert G. McGimsey2, Christina A. Neal2, and Rick L. Wessels2
1Cascades Volcano Observatory, U.S. Geological Survey, 1300 SE Cardinal Court, Vancouver, WA 98683.
2Alaska Volcano Observatory, U.S. Geological Survey, 4210 University Drive, Anchorage, AK 99508.
AbstractAirborne surveillance of gas emissions from Augustine
Volcano and other Cook Inlet volcanoes began in 1990 to identify baseline emission levels during noneruptive condi-tions. Gas measurements at Augustine for SO2, CO2, and H2S showed essentially no evidence of anomalous degassing through spring 2005. Neither did a measurement on May 10, 2005, right after the onset of low level seismicity and inflation. The following measurement, on December 20, 2005, showed Augustine to be degassing about 600 metric tons per day (t/d) of SO2, and by January 4, 2006, only 7 days before the first explosive event, SO2 emissions had climbed to ten times that amount. Maximum emission rates measured during the subsequent eruption were: 8,930 t/d SO2 (February 24, 2006), 1,800 t/d CO2 (March 9, 2006), and 4.3 t/d H2S (January 19, 2006). In total, 45 measurements for SO2 were made from December 2005 through the end of 2008, with 19 each for CO2 and H2S during the same period. Molar CO2/SO2 ratios averaged about 1.6. In general, SO2 emissions appeared to increase during inflation of the volcanic edifice, whereas CO2 emissions were at their highest during the period of deflation associated with the vigorous effusive phase of the eruption in March. High SO2 was probably associated with degassing of shallow magma, whereas high CO2 likely reflected deep (>4 km) magma recharge of the sub-volcanic plumbing system, For the 2005–6 period, the volcano released a total of about 1.5×10⁶ tons of CO2 to the atmosphere, a level similar to the annual output of a medium-sized natural-gas-fired powerplant. Augustine also emitted about 8×10⁵ tons of SO2, similar to that produced by the 1976 and 1986 eruptions of the volcano.
IntroductionAugustine Volcano is located on an uninhabited island in
the lower Cook Inlet of Alaska (fig. 1). It lies about 100 km west of Homer and 280 km southwest of Anchorage. The site of frequent explosive eruptions, Augustine Volcano is a young 1,250-m-high convergent plate boundary stratovolcano, lying about 100 km above the Benioff zone in the eastern portion of the Aleutian arc. It has had at least four periods of signifi-cant activity in the twentieth century in 1935, 1964–65, 1976, and 1986 before the most recent eruption in 2006 (Miller and others, 1998) and erupts mostly andesitic and dacitic lavas (Kienle and Swanson, 1983). Augustine Volcano consists of a broad apron of pyroclastic and debris-avalanche deposits surrounding a central vent and dome complex (Swanson and Kienle, 1988; Waitt and and Begét, 2009). When Augustine erupts, a number of volcanic hazards have the potential to threaten communities in south central Alaska and aviation, industrial facilities, petroleum and natural gas production, shipping, and other activities (Waythomas and Waitt, 1998).
Airborne gas measurements at Augustine Volcano are part of a systematic program to monitor baseline gas emissions at Cook Inlet volcanoes in order to recognize the beginning of unrest and to identify baseline values of gas emissions to which future measurements could be compared in the event of unrest (Doukas, 1995). In 1990, 4 years after the 1986 erup-tion, annual measurements were begun and have continued through 2008. This paper reports gas measurements made from 2002 to 2008 with special emphasis on precursory and eruptive activity during 2005–6.
Data from two earlier eruptions of Augustine allow comparisons with peak SO2 emission rates measured during 2006. From February 8 through 18 during the 1976 eruption, Stith and others (1978) made a series of measurements using a Meloy flame photometric detector to determine total gaseous sulfur, which was assumed, by smell, to be all SO2. They

610 The 2006 Eruption of Augustine Volcano, Alaska
measured a peak value of 25,900 t/d of SO2 on February 9, 1976, followed by 8,600 t/d on February 11, 13, and 18. Their lowest measured SO2 emission rate was 173 t/d on February 12, 16, and 17. A little more than a year after the eruption, they returned to Augustine for an additional measurement and recorded a value of 26 t/d on April 22, 1977. Using a scrub-ber system attached to their instrument, they were also able to remove SO2 and estimate an emission rate for H2S of 3.5 t/d for the 1977 measurement. They estimated that Augustine emitted about 1×10⁵ tons of SO2 during the 1-year period sur-rounding the 1976 eruption. As this estimate neglects the par-oxysmal emissions of April 1976, it is only a minimum value. They point out that a significant portion of the SO2 emitted during the paroxysmal eruptions was attached to the surfaces of ash particles and fell out of the plume after a short time.
During the March–April 1986 eruption of Augustine, Rose and others (1988) successfully made airborne ultravio-let spectroscopic (COSPEC) plume measurements on April 3, 1986, and calculated a SO2 emission rate of 24,000 t/d during active ash emission and under high wind conditions;
gas emission rates were likely higher during the peak of the eruptive activity from March 27 to April 3. More than a year after the end of the eruption, additional measurements of 380 t/d (July 24, 1986) and 45 t/d (May 24, 1987) were made dur-ing a period of post-eruptive passive degassing (Symonds and others, 1990). Rose and others (1988) used ash leachate and emission data along with seismic information and other obser-vations to scale up their SO2 measurement of April 3, 1986, to an emission rate of 3.75×10⁴ t/d that was likely achieved on more than one day during the peak phase of the eruption.
Before the 2005–6 eruption, fumarolic activity at Augus-tine was confined to scattered areas near the summit dome complex (fig. 2). As early as the summers of 1986 and 1987, Symonds and others (1990) observed that the 1986 lava dome produced >90 percent of the gas emitted from Augustine. Other sources were the solfataras located west of the 1986 dome along the high ridge between the remnants of the 1935 and 1964 lava domes and in unconsolidated pyroclastic flow deposits near the northern base of the volcano’s dome complex. In 1987, at least one fumarole on the dome was as hot as 870°C, but by 1989 it
Homer
Redoubt
Iliamna
Augustine Volcano
Spurr
0 50 100
KILOMETERS
151°W154°W
61°N
60°N
Alaska
Port Graham
Anchorage
Beluga
Nanwalek
Cook
Inle
t
KenaiPeninsula
N
Areaof
Map
Figure 1. Location map for Augustine Volcano. Plus sign (+), Augustine Volcano; Open triangles, other volcanoes of Cook Inlet; Filled circles, cities and towns near Cook Inlet. Inset map of Alaska.

26. Emission of SO2, CO2, and H2S from Augustine Volcano, 2002–2008 611
was only 640°C (Symonds and others, 1990). By 1992, fuma-role temperatures had declined to about 97°C, boiling point for the summit elevation (Symonds and others, 2003).
Methods
Instrumentation
In this study, we used an instrument platform developed over the past 15 years at the Cascades Volcano Observatory (CVO). The platform is mounted on board an aircraft for transport to volcanic centers, usually in remote settings, and is capable of measuring volcanic CO2, SO2, and H2S (Gerlach and others, 2008). For airborne emission measurements of the Augustine plume, a LI-COR Model LI-6252 nondispersive infrared analyzer and a Model LI-670 flow control unit were used to determine volcanic CO2 (Gerlach and others, 1997; Gerlach and others, 1999). An Interscan Model 4170 analyzer with a 0 to 1 ppm range and an Interscan Model 4240 analyzer with a 0 to 2 ppm range were used for direct measurements of H2S and SO2 in the plume, respectively. These instruments consist of an electrochemical voltametric sensor coupled to a 1 -liter-per-minute sample-draw pump. The calibrated ana-log output of the instruments record gas concentrations as described in detail by McGee and others (2001) and Werner and others (2006).
The airborne instrument package also included a COSPEC for measuring SO2 column abundance (units of parts per million-meter, or ppm·m) and a type-T thermocouple shielded from wind and direct sunlight for measuring ambient air temperature. Atmospheric pressure was measured in the unpressurized aircraft cabin by a pressure transducer mounted within the LI-COR analyzer. A GPS receiver was used to tag the precise latitude, longitude, and altitude of each measure-ment. Data from all of the instruments were recorded on a common 1/s time base. All gas readings were corrected for the actual pressure and temperature at the altitude at which the measurements were taken.
Procedure
Two different instrument configurations were used for the airborne measurements between 1995 and 2006 owing to funding limitations and instrumentation availability. In one configuration (24 of the 45 campaigns reported in table 1), only a COSPEC V and a Model 60CSX GPS were used to determine SO2 emission rates. Typically, four to six traverses were flown under the downwind plume perpendicular to the direction of plume travel with the upward-looking COSPEC to determine an average column abundance of SO2. GPS-reg-istered wind circles (positions logged once per second) at the elevation of the plume were then flown in order to calculate the velocity of plume travel so that a SO2 emission rate could
Spf
1935
1986
1964
So
f
f
f
f
f
f
M
Figure 2. View of 2004 preeruptive summit of Augustine Volcano, as seen from the west. 1986, lava dome surrounded by moat (M) formed during the 1986 eruption. Spf, Spine fumarole located near base of spine (faint outline) (Symonds, and others, 1990). 1964, lava dome remnant forms collar on south summit. 1935, lava dome remnant lies north of the solfatara area (So). f, locations in 2004 wispy boiling-point fumaroles plumes (not sampled). Photo by M. Doukas.

612 The 2006 Eruption of Augustine Volcano, Alaska
be computed (Doukas, 2002). In the other configuration (21 of the 45 campaigns reported in table 1), the full instrument package for measuring CO2, SO2, and H2S (LICOR, COSPEC, and Interscan) was mounted in a twin-engine aircraft config-ured for open-flow sampling of external air upstream of engine exhaust as described in Gerlach and others (1997) and Gerlach and others (1999). In addition to the traverses flown under the plume for the COSPEC measurements described above, a series of additional traverses were flown top to bottom through the plume at the same distance downwind of the vent in order to describe a vertical cross section of the plume.
To illustrate data collection techniques, figure 3 shows the reconstructed flight path from GPS data for a typical flight between 1400 and 1500 Alaska Standard Time (AKST) on January 19, 2006, with the full instrumentation package. Five traverses were made underneath the plume for the COSPEC measurements. Then, a series of 12 additional plume profile traverses were flown through the plume ranging from a top traverse at an altitude of 1,700 m above mean sea level (amsl) down to a bottom traverse of 780 m amsl based on aircraft altimeter readings and with an average vertical spacing of 80 m. Winds measured just after the flight by the wind circle method indicated winds out of the west-northwest at an aver-age speed of 6.1 m/s. The plume from Augustine on this day was detected on all but the top and bottom traverses, and the characteristic smell of both H2S and SO2 was noticed by the aircrew on all of the traverses through the plume. Atmospheric pressure and temperature were nearly constant inside and
outside the plume on each traverse and averaged 88.04 kPa and −9.8°C. No temperature anomaly was detected in the volcanic plume on any of the traverses.
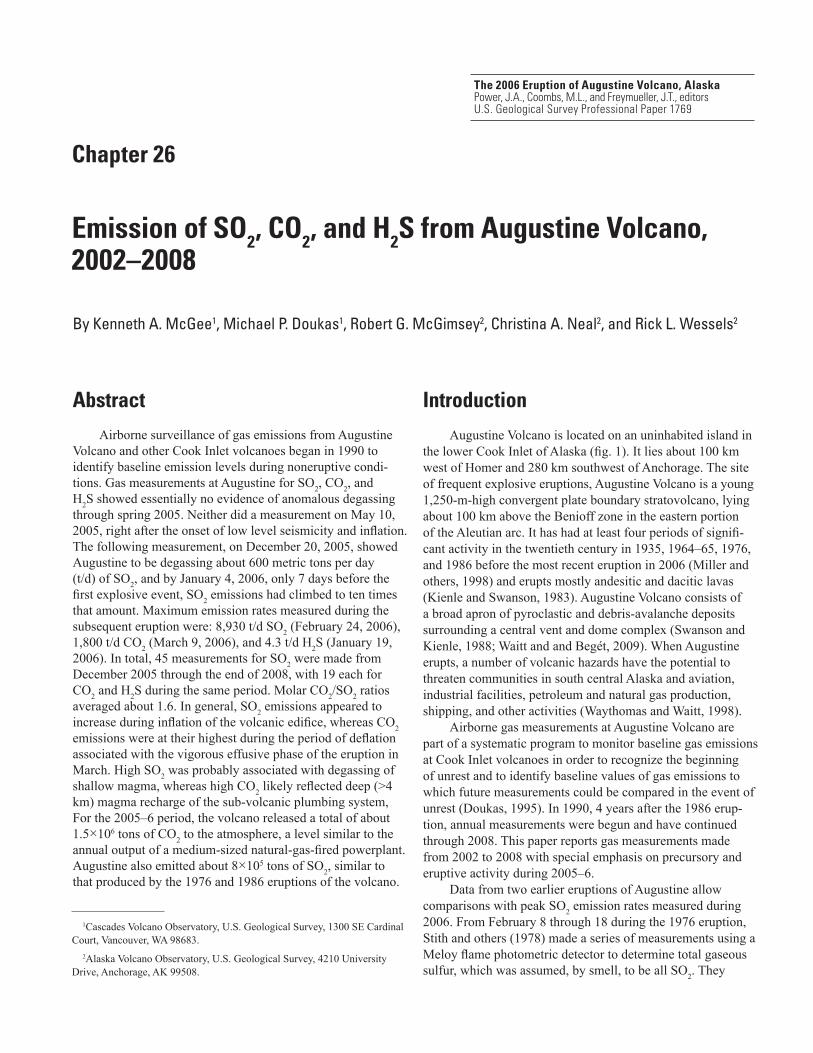
Two representative COSPEC traverses from the January 19, 2006, example are presented in figure 4. The COSPEC SO2 signal is processed in Peakfit v. 4.0 (AISN Software, Inc.) to determine the area under the signal curve in kilometers×ppm.m. The average ppm.m is then determined by dividing the area by the width in kilometers. The average signal is then reduced by the ratio of the calibration cells used during the flight. The reduc-tion equation gives the SO2 emission rate (E) in units of t/d:
Ecospec=0.00023(SW × Plume width × Ave ppm·m) (1)
Where SW is the average wind speed (m/s), Plume width in meters and Ave ppm·m is the resultant average ppm·m of the plume traverse. The constant reduces the concentration of the cross section to t/d.
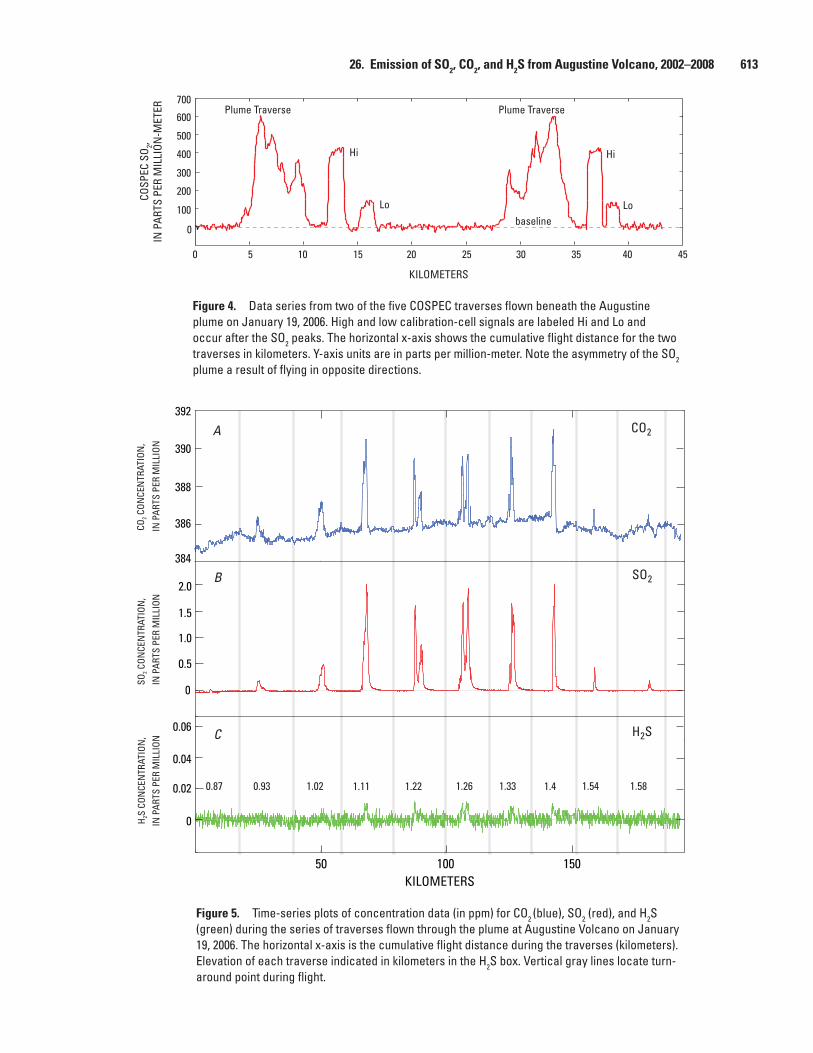
Figure 5 shows a time-series plot of the January 19 CO2, SO2, and H2S data series. The ambient CO2 background mea-sured on each traverse on either side of the CO2 anomaly was fit using routines in PeakFit v. 4.0 (AISN Software, Inc.) and subtracted from each peak and zeroed to obtain the volcanic CO2 gas signal. The resulting CO2 plume anomaly on January 19, 2006, has a maximum concentration of nearly 5 ppm. A similar procedure was used for H2S and SO2 from the Interscan mea-surements, although no H2S and SO2 were present in the ambient
0 10 20
KILOMETERS
-153.0°W
59.3°N
Wind Circles
WindDirection
-153.5°W
59.5°N
AUGUSTINEISLAND
PLUME
Approach track
Depar
t trac
k
Traverse tracks
N
Figure 3. Map showing recorded GPS flight-track positions during the airborne survey at Augustine Volcano, Alaska, on January 19, 2006. Arrow shows determined wind direction, and the cluster of flights lines to the east of Augustine shows the NNE-SSW gas measurement traverses under and intersecting the volcanic plume downwind of the volcano. Red triangle locates the summit of the volcano. Flight tracks for wind circles to determine wind speed are shown northeast of Augustine and were flown at the altitude of the plume core.
26. Emission of SO2, CO2, and H2S from Augustine Volcano, 2002–2008 613
10 20 30 400 15 25 35 455
KILOMETERS
0
200
400
600
COSP
EC S
O 2,IN
PAR
TS P
ER M
ILLI
ON-M
ETER
Hi
Lo
Hi
Lo
Plume Traverse Plume Traverse
baseline
300
500
700
100
50 100 150KILOMETERS
0
1.5
1.0
0.5
2.0
0
0.06
0.04
0.02
384
390
388
386
392
IN P
ARTS
PER
MIL
LION
IN P
ARTS
PER
MIL
LION
CO 2 C
ONCE
NTR
ATIO
N,
SO 2 C
ONCE
NTR
ATIO
N,
H2S
CON
CEN
TRAT
ION
, IN
PAR
TS P
ER M
ILLI
ON
1.02 1.580.930.87 1.541.41.331.261.221.11
A
B
C
CO2
SO2
H2S
Figure 4. Data series from two of the five COSPEC traverses flown beneath the Augustine plume on January 19, 2006. High and low calibration-cell signals are labeled Hi and Lo and occur after the SO2 peaks. The horizontal x-axis shows the cumulative flight distance for the two traverses in kilometers. Y-axis units are in parts per million-meter. Note the asymmetry of the SO2 plume a result of flying in opposite directions.
Figure 5. Time-series plots of concentration data (in ppm) for CO2 (blue), SO2 (red), and H2S (green) during the series of traverses flown through the plume at Augustine Volcano on January 19, 2006. The horizontal x-axis is the cumulative flight distance during the traverses (kilometers). Elevation of each traverse indicated in kilometers in the H2S box. Vertical gray lines locate turn-around point during flight.

614 The 2006 Eruption of Augustine Volcano, Alaska
(background) air. For the example shown, the maximum plume concentration was about 2 ppm for SO2 and 0.01 ppm for H2S.
The conventional airborne method for measuring CO2 emission rates from passively degassing volcanoes is based on analysis of air sampled through the volcanic plume normal to wind direction. The emission rate is then calculated from the average plume pressure and temperature, wind speed, and the volcanic CO2 concentration anomaly in cross section (Gerlach and others, 1997). This method was adapted further by using the location of H2S peaks, when present, as a guide to resolv-ing the boundary between volcanic CO2 and ambient CO2 (McGee and others, 2001). Further, anomalous CO2 signals appear during flying maneuvers (fig. 5, between altitudes 1.26 and 1.33 km, CO2 time series), but the absence of SO2 and H2S peaks confirmed the nonvolcanic nature of the gas. Because the measurement traverses at Augustine were flown in a back-and-forth fashion through the plume, every other traverse was inverted before processing so that all traverses start from a common latitude and longitude and extend in the same direc-tion across the plume. This eliminates introducing potential offsets between traverses due to the travel time of gas in the sample tubing from intake to analyzer when importing the data into contouring and mapping software.
Equation (1) from Gerlach and others (1997) gives the CO2 emission rate (E) in units of t/d:
E=0.457329 (A×SW×PCO2 ) /T (2)
where A is the area of plume cross-section (m2), SW is the average wind speed (m/s), PCO2 is the partial pressure of CO2 (Pa) in the plume calculated from the product of average barometric pressure and the average molar concentration of CO2 in the plume, and T is the average air temperature in the plume (K). The constant includes the formula weight of CO2, the univer-sal gas constant, and the number of seconds in a day. Average concentration of CO2 in plume cross section was determined with kriging models for gridding and contouring the con-centration measurements. A similar approach was used for computing emission rates for H2S (constant = 0.354141) and SO2 (constant = 0.665665).
Figure 6 shows resultant vertical plume cross sections for each of the three gases measured from the plume profile traverses on January 19, 2006, using contouring and mapping software (Surfer v. 8, Golden Software, Inc.). The cross-section for H2S appears to show a smaller plume than those for CO2 and SO2 due to the very low concentration of H2S and an Inter-scan detection limit of ~4 ppb for this type of measurement.
Standard deviation (s.d., table 1) for each day’s COSPEC SO2 emission rate calculation are based on the number of traverses flown and therefore represent the natural variation of the volcanic plume’s SO2. To decrease the standard deviation of the mean of our measurements by a factor of two would require that we acquire four times as many observations in our
daily measurements. The distance to and from the volcano and aircraft fuel capacity limits time at the volcano and thus the number of traverses made.
With the full instrument configuration, comparison of COSPEC results and Interscan SO2 emission rates (table 1) were not always in agreement. Variability of environmental conditions during measurement was usually the cause. For example, clouds at the summit or opaque (perhaps ash bear-ing) plumes may prevent traverses through the whole plume, resulting in higher COSPEC SO2 emissions compared with Interscan contoured results. A higher concentration section of a plume may lie between traverses. For internal consistency, only the COSPEC results are used in this report.
2005–2006 Eruption Chronology and Gas Data
Before the onset of volcanic unrest in 2005, airborne measurements were usually made once per year. Flight fre-quency increased once the unrest started but varied consider-ably over the course of the eruption. From July 2002 through the end of 2008, 45 successful COSPEC measurements of SO2 and 21 measurements of CO2 and H2S were made using the full instrument package.
Emission rates from airborne measurements for CO2, SO2, and H2S at Augustine Volcano from 2002 through 2008 are given in table 1 (Doukas and McGee, 2007) and are shown plotted with other eruption parameters and eruptive phases in figure 7. CO2 or SO2 were not detected at Augus-tine from 2002 through May 2005 with the exception of a very small amount of CO2 in May 1997. H2S measurements were not begun until 2001, and no H2S was detected through 2005. Not until December 20, 2005, was SO2 detected during a COSPEC flight. CO2 measurements were not attempted until January 16, 2006. Note that some data from the 2006 time period have been revised from those published in McGee and others (2008), owing to reprocessing using the contouring technique.
Precursory Phase (April 30, 2005–January 11, 2006)
The precursory phase (fig. 7) began with an increase in the number of microearthquakes in late April 2005 (fig. 8; Power and Lalla, this volume). The first airborne gas measurement during the unrest on May 10, 2005, detected no CO2, SO2, or H2S. In mid-summer 2005, geodetic baselines began to lengthen suggesting inflation of the edifice throughout the last half of 2005 (Cervelli and others, this volume). The increasing seis-micity continued until early December 2005 when a number of small phreatic explosions were recorded on seismometers (fig. 8; Power and Lalla, this volume). Sulfur smells had been reported in Nanwalek and Port Graham (fig. 1) on December 11,

26. Emission of SO2, CO2, and H2S from Augustine Volcano, 2002–2008 615
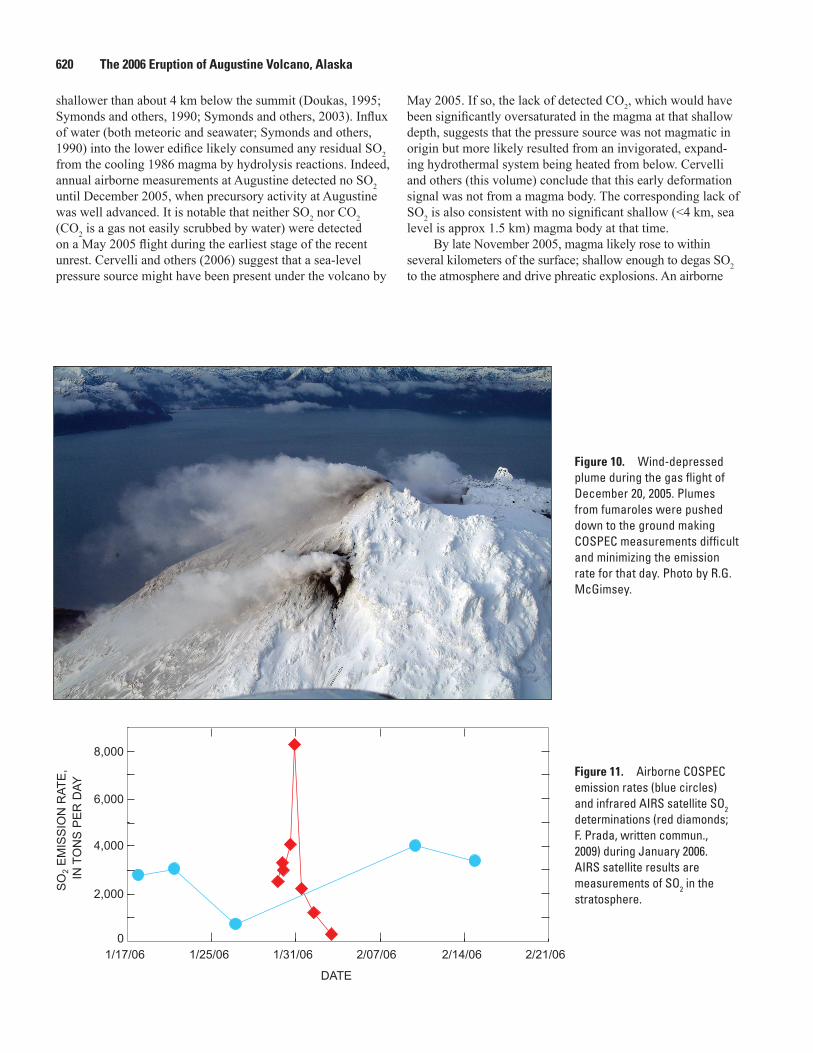
2005, suggesting the arrival of significant sulfur-bearing gas at the surface at least by early December. On December 12, 2005, a vigorous gas and minor ash plume from the summit area was noted in MODIS satellite imagery and by observers, represent-ing the most energetic of precursory phreatic explosions (fig. 9). The next measurement, for SO2 only, was made on December 20, 2005, during the period of phreatic activity and showed a modest amount of SO2 (660 t/d) in the plume. The emission rate was considered a minimum value owing to high wind speeds that pushed the plume to the ground, preventing the aircraft from flying below the plume (fig. 10). From early December 2005 through early January 2006, increased surface heating and snowmelt, phreatic explosions, and the energetic venting of gas and steam were recorded by the seismic network and observed on overflights (Power and Lalla, this volume; Power and others, 2006; Wessels and others, this volume). The following three measurements, taken on January 4, 9, and 10 near the end of the precursory phase, and just days prior to the first violent Vul-canian explosions, showed a significant rise in SO2 emissions (6,700, 2,800, and 5,500 t/d, respectively; table 1; fig. 7).
Explosive Phase (January 11–28, 2006)
The explosive phase began with a vigorous swarm of volcano-tectonic (VT) earthquakes early on January 11, fol-lowed by two brief (1:18 and 3:18 minutes), ash-poor explo-sions (fig. 7; Power and Lalla, this volume). Additional explo-sions reamed a vent through the southern margin of the 1986 lava dome on January 13, 14, and 17. Ash clouds from these events deposited trace amounts of fine ash on communities to the northwest and east and disrupted air traffic (Wallace and others, this volume; Neal and others, this volume). Seismicity characteristic of lava effusion was recognized on January 12, 2006, (Power and others, 2006) and a small new lava dome was observed during a gas flight on January 16, 2006. Lava formed a second lava lobe between January 17 and 27, followed by more explosive events (Coombs and others, this volume).
Three gas-measurement flights with the full instrument package were conducted during the explosive phase (January 16, 19, and 24; table 1, fig. 7A). Sulfur dioxide emission rates were high (2,800, 3,000, and 730 t/d) but down somewhat
1.0
1.5
1 2 3 4 5 6 7
1.0
1.5
1.0
1.5
ppm CO2
ppm SO2
ppm H2S
3.02.01.00
1.4
0.8
0.4
0
0.0090.0070.0050
KILOMETERS
CO22740 t/d
SO23020 t/d
H2S4.3 t/d
A
B
CALT
ITU
DE
, IN
KIL
OM
ETE
RS
Figure 6. Concentration in a vertical cross-section for the CO2 (A), SO2 (B), and H2S (C) components of the Augustine plume 5 km downwind from summit vent on January 19, 2006. View is upwind toward volcano. The x-axis is the flight distance during the traverses. Contours show concentration of each gas above background with color scale bars to the right. The CO2 cross-section contains each data point of the traverses used to construct the contours (same points not shown in the SO2 and H2S contours). Cross-section of the 4 km-wide plume was constructed with contouring software (Surfer v.8) using exponential kriging models based on variograms fit to the concentration data for the plume. For the example shown, calculated emission rates are 2740 t/d of CO2, 3,020 t/d of SO2 and 4.3 t/d of H2S.

616 The 2006 Eruption of Augustine Volcano, Alaska
Table 1. Augustine volcanic gas emission rates 2002 to 2008 (data from Doukas and McGee, 2007 and this report).
[Dates of eruption phases separate dates of measurements. Uncertainty derived primarily from wind speed measurements is estimated at plus or minus 19 percent (Doukas, 2002). n=number of traverses, s.d.=standard deviation, nm = not measured, tr = trace, below detection limit, nd = not determined m = minimum result]
s.d.Distance
Downwindkm
WindSpeed
m/s
WindError
%
WindDirectionDegrees
T°C
Pkpa
PlumeWidth
km
Molarratio
CO2/SO2
Date COSECSO2 t/d
n InterscanSO2 t/d
LiCorCO2 t/d
InterscanH2S t/d
07-01-02 0 5 0 0 0 0 0.0 3 8.8 6% 220 10.2 89.2207-02-02 0 2 0 0 0 0 0.0 2 6.2 x 270 11.5 87.8809-10-02 0 1 0 0 0 nm 0.0 2 nm nd 180/270 1.4 85.6409-10-02 0 7 0 0 0 nm 0.0 2 nm nd 3.4 87.2108-03-03 0 4 0 0 0 0 0.0 2 2.7 10% 270 7 88.0208-07-04 0 2 0 0 0 0 0.0 2 3.4 38% 170 16.6 89.82April 30, 2005 Precursory Phase05-10-05 0 5 0 0 0 0 0.0 1.5 4.6 26% 120 1.7 87.7
m12-20-05 660 4 190 nm nm nm nd 4.5 8.7 90nd nm 2.101-04-06 6,700 4 790 nm nm nm nd 4.5 13.4 100nd nm 9.601-09-06 2,800 7 520 nm nm nm nd 1.6 6.2 90nd nm 301-10-06 5,500 2 200 nm nm nm nd 13 10 19% 60 nm nm
January 11, 2006 Explosive Phase01-16-06 2,800 4 500 836 1,470 tr 0.8 7 14.5 10% 0 0.9 96.08 2.601-19-06 3,000 5 620 1,516 2,700 4.3 1.3 15 6.1 31% 250 -9.8 88.04 7.501-24-06 730 5 80 280 500 1 1.0 15 2 80% 300 -21 80.1 8January 28, 2006 Continuous Phase
02-08-06 4,000 3 820 nm nm nm nd 7 16.5 19% 110 nm nm 10
February 24, 2006 Hiatus
02-13-06 3,400 3 700 nm nm nm nd 8 5.3 28% 300 nm nm 13.502-16-06 7,800 5 990 nm nm nm nd 7 13 230 nm nm 4.1
02-24-06 8,930 5 630 nm nm nm nd 4.5 6.5 15% 320 nm nm 2.303-01-06 8,650 8 1,130 nm nm nm nd 4.5 5.6 18% 310 nm nm 2
000000
0nmnmnm
22
nd
March 3, 2006 Effusive Phase03-09-06 1,130 4 200 340 1,800 0 2.3 13 17.3 4% 350 -12 89.78 2.803-10-06 3,200 4 430 390 1,200 0 0.5 10 7 30 -7.5 82.64 5.103-16-06 3,050 5 400 nm nm nm nd 8 9.6 42% 80 nm nm 8.2March 16, 2006 Post-eruption Phase03-22-06 1,070 6 190 nm nm nm nd 6.3 5.6 50 nm nm 2.503-29-06 1,270 6 190 nm nm nm nd 10 5.5 11% 320 nm nm 3.204-06-06 1,970 6 160 nm nm nm nd 8 6 45 nm nm 3.904-11-06 1,220 5 90 nm nm nm nd 5.8 7.7 140 nm nm 304-19-06 1,440 5 180 nm nm nm nd 3.4 3.6 220 nm nm 5.204-27-06 750 5 210 860 660 1.3 1.3 10 18.6 2% 20 1.4 95.28 2.405-12-06 400 7 50 nm nm nm nd 6 2.6 40 nm nm 6.305-23-06 230 5 30 nm nm nm nd 11 7 21% 45 nm nm 3.306-02-06 430 6 80 nm nm nm nd 2.6 4.6 330 nm nm 1.807-12-06 500 7 90 nm nm nm nd 4 7.3 3% 25 nm nm 1.908-23-06 530 6 30 nm nm nm nd 3.6 3.3 15% 330 nm nm 5.409-24-06 250 3 56 180 280 1.3 1.6 6.5 4 13% 330 1.25 86.55 5.309-25-06 280 5 50 nd nd 0 nd 7.1 7.8 12% 110 6.54 95.8 510-12-06 1,100 2 56 nm nm nm nd 5 10.6 5% 120 nm nm 7.6510-23-06 100 2 3 nm nm nm nd 4 16 280 nm nm 3.611-04-06 190 2 15 nm nm nm nd 7.2 4.1 7% 280 nm nm 411-16-06 170 2 43 0 0 0 nd 6.3 13 7% 45 -15.7 80.15 1.811-17-06 100 1 0 0 0 0 nd 5 4.3 6% 40 -9.3 84.5 2.811-18-06 220 1 0 0 0 0 nd 3 7.3 9% 40 -7.4 88.83 1.502-22-07 50 4 8 nm nm nm nd 1.3 4.8 15% 280 nm nm 1.305-18-07 30 4 6 80 94 0.0 4.3 2.8 3.7 8% 90 -4.9 85.88 203-14-08 Tr 4 14 nm 180 0 3.8 2% 270 -7 88.7907-17-08 120 3 17 nd 5.4trtr 0
32
nd
18% 280 9.8 94.1 2.34.2
14%
nd
nd
nd
nd
14%
13.7%
.17%
ndnd
26. Emission of SO2, CO2, and H2S from Augustine Volcano, 2002–2008 617
eruptive volume
PePPP HExP CP
2
1
0
-1 VE
RTI
CA
L G
RO
UN
D
DE
FOR
MAT
ION
,
IN C
EN
TIM
ETE
RS
A
B
C
D
100
200
300
EA
RTH
QU
AK
E C
OU
NTS
, IN
CO
UN
TS P
ER
DAY
2,000
4,000
6,000
8,000
10,000
ER
UP
TIV
E V
OLU
ME
, IN
MIL
LIO
NS
OF
CU
BIC
ME
TER
SE
MIS
SIO
N R
ATE
OF
SO
2, IN
TO
NS
PE
R D
AY
100
60
80
40
20
0
500
0
3,000
1,000
1,500
2,000
2,500
EM
ISS
ION
RAT
ES
OF
CO
2, IN
TO
NS
PE
R D
AY
5/10/20064/14/20063/14/20062/14/200611/14/2005 1/14/200612/14/2005
EP
SO2
CO2
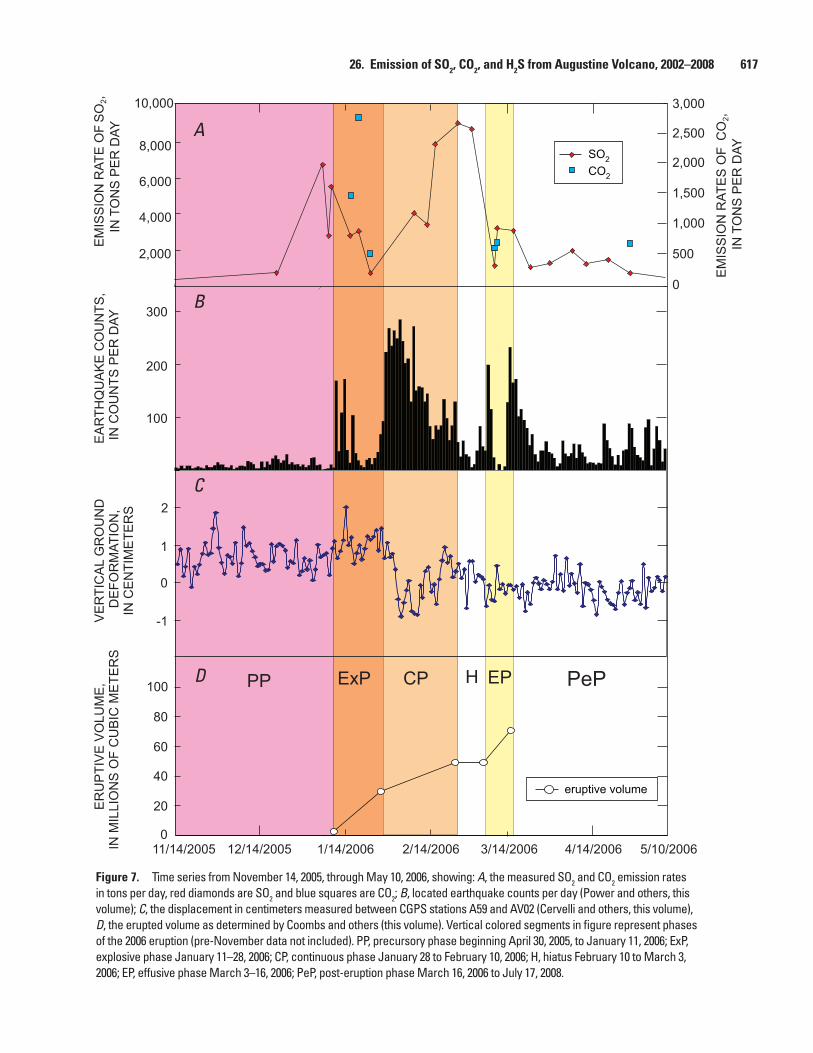
Figure 7. Time series from November 14, 2005, through May 10, 2006, showing: A, the measured SO2 and CO2 emission rates in tons per day, red diamonds are SO2 and blue squares are CO2; B, located earthquake counts per day (Power and others, this volume); C, the displacement in centimeters measured between CGPS stations A59 and AV02 (Cervelli and others, this volume), D, the erupted volume as determined by Coombs and others (this volume). Vertical colored segments in figure represent phases of the 2006 eruption (pre-November data not included). PP, precursory phase beginning April 30, 2005, to January 11, 2006; ExP, explosive phase January 11–28, 2006; CP, continuous phase January 28 to February 10, 2006; H, hiatus February 10 to March 3, 2006; EP, effusive phase March 3–16, 2006; PeP, post-eruption phase March 16, 2006 to July 17, 2008.

618 The 2006 Eruption of Augustine Volcano, Alaska
from the levels recorded during the precursory phase. CO2 was measured for the first time since the beginning of the unrest (1,466, 2,740, and 500 t/d). The highest emission rate of H2S during the eruption, 4.3 t/d, was recorded on January 19. We have no measurements of gas emissions during any of the 13 explosions that occurred between January 11 and 28.
Radar data and pilot reports suggest Augustine injected gases and ash into the stratosphere on as many as four dif-ferent days during this period (January 11, 13, 17, and 27 (Collins, and others, 2007; Schneider and others, 2006). We estimate from meteorological data (NOAA, Air Resources Laboratory, www.arl.noaa.gov/ready.php, last accessed April 1, 2010) that the tropopause was at about 8.5 to 9.0 km asl above Augustine during this time period.
Infrared based Atmospheric Infrared Sounder (AIRS) satellite detected the SO2 clouds during January 28 and 29, 2006. Prada (2006) reported that .0025 to .0041 Tg (2,500–4,100 t/d) were ejected into the atmosphere during the explosive events on these days. Early satellite measurements showed SO2 eruption clouds represented equal to or above quiescent SO2 emission rates (fig. 11). The AIRS satellite detected SO2 in the stratosphere, so the values reported are probably minimums due to the missed SO2 below 8 to 9 km. The first satellite measurements suggest measurements of the quiescent plumes with emission near 3,000 t/d (fig. 11). Later, measurements may represent syneruptive SO2 plumes. These clouds did not contain the syneruptive amounts of SO2 typical of explosive eruptions.
Ozone Monitoring Instrument (OMI) satellite determina-tions of SO2 were unavailable during this time interval (Simon Carn, oral communication, 2008) owing to low winter UV levels. Not until March and at lower latitudes (Nevada) were OMI satellite results available.
Continuous Phase (January 28–February 10, 2006)
A continuous eruption phase began on January 28 and was characterized by nearly constant, low-altitude tephra emission and rapid andesitic dome extrusion, high rates of shallow seismicity, and steady deflation of the edifice. Repeated collapses of the growing dome and overlapping lobes of lava extending to the north beyond the margin of the 1986 lava dome produced block-and-ash flows intermittently through February 10, 2006 (Vallance and others, this volume; Coombs and others, this volume). Gas and ash plumes dur-ing this phase penetrated the tropopause on at least two days (January 28 and 29; Bailey and others, this volume); however, most ash plumes remained below 6,000 m asl. A gas measure-ment on February 8 (table 1, fig. 7A) during the continuous phase yielded an emission of 3,960 t/d SO2, a value similar to those calculated during the late precursory and early explosive phases. SO2 was detected (but no value derived) in the erup-tion cloud from January 29–30 by satellite (Dean and others, 2006). We have no CO2 data from the continuous phase.
Hiatus (February 10–March 3, 2006)
Careful analysis of photography and other observations reveal no evidence of significant additional accumulation of lava in the summit crater from February 10 through March 3 (Coombs and others, this volume). Low levels of seismicity also suggest that the eruption was in a pause during this inter-val (Power and Lalla, this volume). Interestingly, of the four gas measurements made during the hiatus, three recorded the highest SO2 emission rates of the eruption (7,800, 7,930, and 8,650 t/d; table 1; fig. 7A).
200
100
0 E
AR
THQ
UA
KE
S
LOC
ATE
D P
ER
WE
EK
2005 2006
APR MAY JUN JUL AUG SEP OCT NOV DEC JAN FEB MAR APR
Figure 8. Earthquake counts from April 2005 through April 2006 showing the gradual increase of located earthquakes during 2005 (from Power and Lalla, this volume). Purple and red lines correspond to approximate times of phreatic and magmatic explosions, respectively (Power and Lalla, this volume).

26. Emission of SO2, CO2, and H2S from Augustine Volcano, 2002–2008 619
Figure 9. A, December 12, 2005, MODIS satellite view of lower Cook Inlet, Alaska, showing Augustine Volcano, as the source of a long narrow plume extending Southeast towards the southern portion of the Kenai Peninsula (image courtesy of the Geographic Information Network of Alaska (GINA)). B, December 12, 2005, photograph of an ashy plume extending from summit fumaroles to the southeast. Photo by R.G. McGimsey.
Effusive Phase (March 3–16, 2006)
On March 3, increasingly frequent rockfall signals on seis-mometers suggested a return to active lava effusion and resulting instability of the dome as new material was added to the surface and lava flow fronts advanced. Over the next 2 weeks, more or less continuous eruption of lava from a single vent in the sum-mit dome marked the final activity of the effusive phase of the eruption (EP, fig. 7D). The top of the growing dome eventually reached an elevation more than 100 m higher than the preerup-tion summit of the 1986 lava dome. Collapse of the fronts of two primary lava flow lobes produced block-and-ash flows down the north and northeast flank of Augustine especially during the early portion of the effusive phase. The end of the phase coincided with cessation of drumbeat earthquakes, which were recorded from March 7 to March 16 (Power and Lalla, this volume). Three SO2 emission measurements during this period range from 1,130 t/d to 3,050 t/d, values in the low to moderate range for the eruption. Two emission rates for CO2, however, were showing decline in the eruption sequence—590 and 680 t/d.
Post-eruption Phase (March 16, 2006–July 17, 2007)
Twenty-one additional gas measurement flights made from April 2006 to July 2008 show SO2 emission rates declining from
Homer
NanwalekAugustine Volcano
Homer
NanwalekAugustine Volcano
A B
more 1000 t/d to less than or equal to 120 t/d (table 1). We define the end of the post-eruption phase as the date when SO2 emis-sions reached levels of 50 t/d. A single helicopter-borne flight in July 2008 measured 120 t/d, revealing latent degassing was still possible at the volcano. These final low values of SO2 emission are similar to those observed following the 1986 eruption of Augustine when, within 8 months of the end of the eruption, 45 t/d was measured (Symonds and others, 1990). Similarly, emis-sion rates for CO2 went from 660 t/d on April 27, 2006, to 94 t/d in May 2007. H2S levels were typically very low (1.3 t/d) or not quantifiable through the last measurement in July 2008.
DiscussionChanging SO2, CO2, and H2S emissions pre-, syn-, and
post-eruption can be interpreted in the context of other moni-toring and observational data to infer characteristics of chang-ing magma supply and residence at shallow levels beneath and within the volcano (fig. 7). The following discussion is limited somewhat by the lack of equivalently detailed time series data for all three gas species, in addition to a paucity of gas output measurements by satellite or other means during individual explosive events.
Sulfur dioxide largely disappeared from the plume and fumarole gases of Augustine in the months following the 1986 eruption, indicating no further influx of fresh magma
620 The 2006 Eruption of Augustine Volcano, Alaska
shallower than about 4 km below the summit (Doukas, 1995; Symonds and others, 1990; Symonds and others, 2003). Influx of water (both meteoric and seawater; Symonds and others, 1990) into the lower edifice likely consumed any residual SO2 from the cooling 1986 magma by hydrolysis reactions. Indeed, annual airborne measurements at Augustine detected no SO2 until December 2005, when precursory activity at Augustine was well advanced. It is notable that neither SO2 nor CO2 (CO2 is a gas not easily scrubbed by water) were detected on a May 2005 flight during the earliest stage of the recent unrest. Cervelli and others (2006) suggest that a sea-level pressure source might have been present under the volcano by
May 2005. If so, the lack of detected CO2, which would have been significantly oversaturated in the magma at that shallow depth, suggests that the pressure source was not magmatic in origin but more likely resulted from an invigorated, expand-ing hydrothermal system being heated from below. Cervelli and others (this volume) conclude that this early deformation signal was not from a magma body. The corresponding lack of SO2 is also consistent with no significant shallow (<4 km, sea level is approx 1.5 km) magma body at that time.
By late November 2005, magma likely rose to within several kilometers of the surface; shallow enough to degas SO2 to the atmosphere and drive phreatic explosions. An airborne
AAXXXX_Figure 01
SO
2 EM
ISS
ION
RAT
E,
IN T
ON
S P
ER
DAY
8,000
6,000
4,000
2,000
01/25/06 2/21/062/14/062/07/061/31/061/17/06
DATE
Figure 10. Wind-depressed plume during the gas flight of December 20, 2005. Plumes from fumaroles were pushed down to the ground making COSPEC measurements difficult and minimizing the emission rate for that day. Photo by R.G. McGimsey.
Figure 11. Airborne COSPEC emission rates (blue circles) and infrared AIRS satellite SO2 determinations (red diamonds; F. Prada, written commun., 2009) during January 2006. AIRS satellite results are measurements of SO2 in the stratosphere.

26. Emission of SO2, CO2, and H2S from Augustine Volcano, 2002–2008 621
measurement on December 20, 2005, detected SO2 at Augus-tine for the first time since 1987. A minimum emission rate of 660 t/d was measured on that flight (fig. 10, table 1; wind conditions prevented traverses completely beneath the plume, resulting in a minimum emission rate.). During December, observers also noted large white plumes that suggested the release of large amounts of water vapor from the volcano as it continued to heat up. ASTER thermal infrared (TIR) images of Augustine taken on December 20 showed a broad area of new snow-free ground and fumaroles at the summit, and forward-looking infrared (FLIR) surface-temperature measurements on December 22 indicated the temperature of a fumarole on the south flank was 210°C and the summit moat area at 80°C (Wes-sels and others, this volume). By January 4, 2006, the surface temperature of the moat area had increased to 390°C. Based on reports from residents in the village of Nanwalek on the lower Kenai Peninsula of strong “rotten egg” odors, it is likely that a significant portion of sulfur emissions from Augustine during the precursory stage were in the form of H2S, consistent with earlier scrubbing of SO2 by water and subsequent boiling of the fluid to create H2S (Symonds and others, 2001). Further, dur-ing a FLIR flight on December 22, 2006, observers noted that fume emitted from a fumarole on the southeast base of the 1986 Augustine dome was distinctly pale yellow-green in color. We believe this was likely due to the transient presence of native sulfur in the plume produced by the reaction of H2S and SO2 (Symonds and others, 1994; Kodosky and others, 1991). Based on GPS measurements, dike propagation into the edifice started on November 17, 2005, a month earlier, and Cervelli and others (2006) conclude that magma was shallow enough by the time of the December 20, 2005, gas measurement to allow CO2 and H2S to escape, along with SO2, and become incorporated into the plume. It is not possible, however, to confirm this because CO2 and H2S measurements were not made during this period.
By early January 2006, continued heating of the Augus-tine summit by the shallow magma had dried out the shallow hydrothermal system thereby limiting scrubbing effectiveness. The volcano was emitting SO2 in large amounts with emission rates reaching 6,700 t/d (table 1; fig. 7A). On January 11, 2006, either the gas-filled dike tip arrived at the surface or a highly pressurized shallow hydrothermal system was breached, result-ing in a series of explosions with little, if any, juvenile material ejected (Coombs and others, this volume; Wallace and others, this volume). SO2 emission rates began to drop by more than half and finally to below 1,000 t/d near the end of the explosive period on January 28. This drop could reflect relative depletion in the volume of near-surface, SO2-charged magma along with a temporary lack of replenishment. Similarly, CO2 measurements during the explosive phase showed high CO2 at the beginning (1,400–2,700 t/d) but dropping to 500 t/d by the end of the period. The continuing trend of inflation of the edifice through-out the explosive period (fig. 7C), however, suggests a net mass or pressure increase. An alternative explanation for the rela-tively low gas values during this time is a repetitive sealing of the shallow conduit system that prevented complete gas escape to the surface but contributed to pressurization seen as inflation.
Interestingly, on the gas-measurement flight of Janu-ary 16, 2006, observers noticed a yellow-orange plume in the largely white vapor cloud enveloping the new lava dome within the summit crater (fig. 12). As noted earlier, the highest H2S emission rate of the eruption was measured during this time (table 1). We believe the yellow-orange plume, like the colored plume observed on December 22, 2005, was native sulfur, produced at a single vent under just the right condi-tions of temperature and concentrations of gas streams rich in SO2 and H2S. This reaction possibly could reduce H2S as seen in the trace amount measured that day. Production of native sulfur is achieved in industry using the Claus process (2H2S + O2 → S2 + 2H2O) where gases rich in H2S (>25%) at high tem-peratures burn to produce sulfur and water. An accompanying process with H2S and SO2 reacting together can reduce H2S to native sulfur (2H2S + SO2 → 3S + 2H2O). The high-temper-ature fumarole at the base of the 1986 dome probably was a
Yellow plume
New lava dome
Figure 12. Yellow plume venting from summit of Augustine Volcano. View to the southwest. Dark mass below and left of yellow plume is first sighting of a lava dome mass (January 16, 2006). Dashed line outlines yellow part of plume. Photo by R.G. McGimsey.

622 The 2006 Eruption of Augustine Volcano, Alaska
source for this plume (Wessels and others, this volume). After January 19, 2006, H2S emission rates declined and no further yellow plumes were observed during the eruption.
Moderate to high SO2 emissions—similar in magnitude to those measured during the explosive phase—persisted during the continuous phase of the eruption and into the very early days of the hiatus as reflected in two airborne mea-surements on February 8 and 13 (table 1; fig. 7A). During the continuous phase, intense seismicity due to rapid extru-sion and explosive disruption of blocky andesitic lava was accompanied by marked deflation of the volcano as magma was withdrawn to feed surface activity (Power and others, 2006; Coombs and others, this volume; Cervelli and others, this volume).
The onset of a hiatus in extrusion and a return to a very weak inflationary signal (Cervelli and others, this volume) on February 10 at first saw no significant change in SO2 emis-sion (fig. 7). However, SO2 emission rates more than doubled on February 16 and remained high until the onset of rapid effusion (Coombs and others, this volume) and weak shallow deflation in early March (Cervelli and others, this volume). In fact, the highest SO2 emission rates measured during the entire eruption occurred during this 3-week pause in extru-sion, accompanied by low rates of seismicity and an overall weak inflationary trend (fig. 7). Several factors may have
contributed to the high SO2 during the hiatus. The high erup-tion rates and conduit drawdown of the continuous phase (fig. 7; Coombs and others, this volume) may have resulted in an open, hot, and dry pathway in the upper few kilometers of the conduit facilitating degassing of residual melt. Alternatively (or in addition), the inflationary signal during the hiatus may reflect recharge of the shallow conduit system with fresh, gas-rich melt that lacked sufficient time to reach the surface but was able to degas freely. Unfortunately, we have no CO2 emission rate data for the hiatus.
The hiatus ceased on March 6 marked by the return of strong shallow seismicity and a deflationary signal as seen on GPS (fig. 7C). March 9 and 10 had relatively high CO2 emission rates; at the same time, SO2 emission rates were near the lower end of their range during the eruption. The plume was visually dramatic on these days (fig. 13). The high CO2 probably reflected deep recharge of magma (see below) at depths below the SO2 exsolution level. High CO2 and heat flux could have been the response of the rapid extrusion of largely degassed lava in early March feed-ing the north and northeast lava flow lobes and associated block-and-ash flows (Coombs and others, this volume). The next measurement of CO2 was at the end of April, by which time it had dropped to about 600 t/d, confirming that the influx of new magma had stopped.
Figure 13. Gas plume from Augustine Volcano. White condensate plume is short lived, while gases and aerosols continue down wind. View to the east. Photo by R.G. McGimsey.

26. Emission of SO2, CO2, and H2S from Augustine Volcano, 2002–2008 623
Evaluating CO2 /SO2 Ratios
Seven instances of simultaneous airborne plume measure-ments of CO2 and SO2 during 2006 provide the opportunity to compute a CO2/SO2 ratio for those days (fig. 14). The mean molar ratio is 1.1 with a standard error of ±0.4.
The CO2/SO2 measured on March 9, 2006, (0.8 under a mean of 1.1) occurred during the effusive phase (EP), a period of intense seismicity that began in early March, increased to a nearly continuous signal by March 8, and lasted until March 14 (Power and others, this volume). This was also a period of weak deflation of the edifice (Cervelli and others, this volume) and partly reflects no new CO2 or additional magma rising from depths up towards the surface to feed the eruption, and SO2 being depleted from a shallower magma source. By May 2007 the molar ratio had climbed to 4.3, higher than the erup-tive values (not used in the mean ratio calculation). Melting of the snow pack of winter 2006–7 added water to the shallow hydrothermal system in the summit, thus aiding in the scrub-bing of residual sulfur gases and raising the ratio.
The mean molar CO2/SO2 value of 1.1 for Augustine during the eruption is not out of line with that of other active Cook Inlet volcanoes. Casadevall and others (1994) report an average CO2/SO2 of about 2 for the 1989–90 eruption of Redoubt Volcano. Molar CO2/SO2 values of 10 ranging to as great as 100 were noted for the gases produced by the 1992 eruption of Crater Peak, although the higher ratios were almost certainly due to the masking of SO2 emissions by aqueous scrubbing (Doukas and Gerlach, 1995). During 1980–81 when CO2 was measured at Mount St. Helens, CO2/SO2 ratios averaged about 8, while during 2004–5 the median CO2/SO2 was about 11; this difference was also attributed to scrubbing (Gerlach and others, 2008). In general, unless the magma is degassing through liquid or boiling water, it
appears that CO2/SO2 values for convergent-plate volcanoes typically fall in the range 1 to 12 (Doukas and Gerlach, 1995; Marty and Le Cloarec, 1992; Williams and others, 1992).
SO2 Emission Rates in Previous Augustine Eruptions
Two earlier eruptions of Augustine allow comparisons with peak SO2 emission rates measured during 2006. Although the peak emission rates measured during the last three erup-tions are different, other evidence suggests that the total SO2 output for the Augustine eruptions in 1976, 1986, and 2006 were likely similar in magnitude.
During the 2006 unrest, the highest measured SO2 emission rate was 8,930 t/d, only about one-third the peak values reported in 1976 and 1986. This could imply that the earlier eruptions were larger or more gas-rich events or simply reflect that during 2006 a measurement was not made on a day when SO2 emissions were at their highest levels. Regardless, we believe total SO2 emissions for the past three eruptions of Augustine are roughly similar. Eruptive volume estimates for the 1976, 1986, and 2005–6 eruptions of 0.39, 0.26, and 0.12×10⁶ m3, respectively (bulk volumes; Coombs and others, this volume) suggest that the recent event was smaller; however, limited gas data do not permit an in-depth comparison of total gas emissions from the three eruptions.
Comparison to Anthropogenic Emissions
Without quantitative emissions data it would be difficult to evaluate the volcanic contribution of greenhouse gases, such as CO2, to the atmosphere. Augustine, even with its char-acteristically short interval between eruptions, illustrates that the volcanic contribution is likely not significant over time.
Figure 14. Molar CO2/SO2 for all the days when CO2 and SO2 were measured simultaneously. The mean molar ratio of the points (not counting the 4.3 ratio measured in 2007) is 1.3 (middle horizontal line) with a standard deviation of ±0.69.
C
O/S
O M
OLA
R R
ATIO
2
2
1.0
2.0
3.0
4.0
5.0
0
DATE
1/18/2007 4/28/2007 8/06/200710/10/200612/14/2005 3/24/2006 7/02/2006
+s.d.
-s.d.
mean
624 The 2006 Eruption of Augustine Volcano, Alaska
Some volcanoes passively emit low levels of gases for decades or more (McGee, 2001). Others, like Augustine, become rest-less and emit gases for a few months and then become quiet again. In the case of Augustine, the repose periods between the five eruptions since the beginning of the twentieth century are 29, 11, 10, and 20 years. On the basis of CO2 measurements reported here and using linear extrapolating to a full year, we estimate a total CO2 output of 1.96×10⁵ tons of CO2 for Augustine in 2006, the year encompassing the majority of the most recent eruption. This is similar to the 1.2×10⁶ tons of CO2 emitted by the Beluga natural gas-fired powerplant on the west side of the Cook Inlet near Tyonek in 2004 (fig. 1) and signifi-cantly less than the output of most of the U.S. coal-fired power generation plants, some of which produce more than 20×106 million tons of CO2 per year (U.S. Environmental Protection Agency, 2007). No CO2 data exist for the earlier eruptions of Augustine. Even though Augustine erupts frequently, every 17.5 years on average since the beginning of the last century, it is clear that the greenhouse gas output of Augustine is negli-gible compared to the several hundred power plants of all fossil fuel types currently operating in the United States. Augustine’s 2006 eruption might be considered a typical size for an average eruption worldwide (for example, volcanic explosivity index = 3, 0.01–0.1 km3 of eruptive products; Simkin and Siebert, 1994). Using estimates from Casadevall and others (1994) for the total emission rate of SO2 (1×10⁶ tons) and the molar CO2/SO2 (~2) for the 1989–90 eruption of Redoubt Volcano, we can compute a total CO2 emission rate of 1.4×10⁶ tons for a similar-sized eruption of another Cook Inlet volcano.
From these data it is clear that even if several volcanoes like Augustine erupted continuously for a decade or even a century, they would still be negligible greenhouse gas contributors to the atmosphere compared to current anthropogenic sources of CO2 emission. One of the largest continuous volcanic carbon dioxide sources on Earth is Kilauea Volcano, which emits about 9,000 tons of CO2 a day (Gerlach and others, 2002). This amounts to 3.3×10⁶ tons of CO2 annually, still considerably less than the yearly output of a single large coal-fired powerplant (U.S. Envi-ronmental Protection Agency, 2007). Thus it appears that vol-canoes are currently not significant contributors of greenhouse gases to the atmosphere compared to power generation plants.
We also estimate that Augustine emitted about 6.3×10⁵ tons of SO2 during 2006, slightly more than half the amount of CO2 produced. Although not a greenhouse gas, SO2 combines readily with water droplets to form aerosols and can fall as acid rain or cause cooling if injected into the upper atmosphere. The SO2 output of Augustine during 2006 is equivalent to several coal-fired powerplants, but the short duration of the eruption insures that any impact from acid rain or acid-coated ash particles will be comparatively small. Further, given Augustine Volcano’s island location and relatively low elevation, much of the gas from Augustine during 2006, with the exception of several days in January, was discharged at low elevation into the troposphere, and most of any resulting acid rain likely fell into the ocean or on sparsely inhabited land areas downwind. From early 2007
through the summer of 2008, the SO2 output of Augustine was about 100 t/d and is expected to fall to near zero within several years as it has following the previous two eruptions.
Conclusions1. The similar nature of recent Augustine eruptions points
to generalizations regarding the timing and eruptive behavior of the volcano as well as to generalizations about the nature and magnitude of its gas emissions.
2. Geochemical surveillance of Augustine since the 1986 eruption indicates that degassing declines essentially to nil within 1 to 2 years after an eruption and does not resume to a measurable level until magma once again ascends toward the surface. This is likely due to abundant ground and hydrother-mal waters available to scrub any acid gases released from remnant magma once the system cools down.
3. Although the number of plume measurements for SO2 during the eruption is not large, the available evidence suggests that, in general, once magma is within hundreds of meters of the surface and an open pathway exists between magma and the surface, SO2 emissions will increase. The measured SO2 output decreased during the explosive and continuous phases but increased again during the hiatus phase of the activity prior to the final rapid effusion phase. The highest SO2 emission rates were achieved during the early part of the hiatus, whereas the highest measured CO2 emission rates were measured about 1 month earlier during inflation and explosive activity in Janu-ary. This is in line with the idea that more SO2 will be released as magma intrudes to shallow levels and lower pressures. High emission rates for CO2 should be detected as deeper CO2-rich magma moves toward the surface and discharges its load of CO2 while still deep enough to inhibit SO2 outgassing, although the scant CO2 measurements do not conclusively illustrate this.
4. Emissions measurements yield an average molar CO2/SO2 value of about 1.3±0.7 for the 2006 eruption of Augus-tine, similar to typical values of 1 to 12 reported for other convergent plate boundary volcanoes.
5. Augustine is not a significant contributor to the atmo-spheric load of greenhouse gases compared to anthropogenic sources. In 2006, Augustine released about 1.9×10⁵ tons of CO2, a level similar to the output of a medium-sized natural-gas-fired powerplant. Augustine also released about 8×10⁵ tons of SO2 during the 2006 eruption. Evidence from other investigators suggests that the sulfur dioxide output in the 1976 and 1986 eruptions was of similar magnitude to that measured in 2006.
AcknowledgmentsWe would like to acknowledge the skilled and dedicated
pilots and staff of Security Aviation in Anchorage for pro-viding safe and effective air support. Comments by Tobias Fischer, Cynthia Werner, Michelle Coombs, and William Scott were appreciated in improvement of the manuscript.
26. Emission of SO2, CO2, and H2S from Augustine Volcano, 2002–2008 625
References Cited
Bailey, J.E., Dean, K.G., Dehn, J., and Webley, P.W., 2010, Integrated satellite observations of the 2006 eruption of Augustine Volcano, in Power, J.A., Coombs, M.L., and Freymueller, J.T., eds., The 2006 eruption of Augustine Vol-cano, Alaska: U.S. Geological Survey Professional Paper 1769 (this volume).
Casadevall, T.J., Doukas, M.P., Neal, C.A., McGimsey, R.G., and Gardner, C.A., 1994, Emission rates of sulfur dioxide and carbon dioxide from Redoubt Volcano, Alaska, during the 1989–1990 eruptions, in Miller, T.P., and Chouet, B.A., eds., The 1989–1990 Eruptions of Redoubt Volcano, Alaska: Journal of Volcanology and Geothermal Research, v. 62, p. 519–530.
Cervelli, P.F., Fournier, T.J., Freymueller, J.T., and Power, J.A., 2006, Ground deformation associated with the precur-sory unrest and early phases of the January 2006 eruption of Augustine volcano, Alaska: Geophysical Research Letters, v. 33, p. 1–5, L18304 , doi: 10.1029/2006GL027219.
Cervelli, P.F., Fournier, T.J., Freymueller, J.T., Power, J.A., Lisowski, M., and Pauk, B.A., 2010, Geodetic constraints on magma movement and withdrawal during the 2006 erup-tion of Augustine Volcano, in Power, J.A., Coombs, M.L., and Freymueller, J.T., eds., The 2006 eruption of Augustine Volcano, Alaska: U.S. Geological Survey Professional Paper 1769 (this volume).
Collins, R.L., Fochesatto, J., Sassen, K., Webley, P.W., Atkin-son, D.E., Dean, K.G., Cahill, C.F., and Kohei, M., 2007, Predicting and validating the motion of an ash cloud during the 2006 eruption of Mount Augustine Volcano, Alaska, USA: Journal of the National Institute of Information and Communications Technology, v. 54, no. 1/2, p. 17–28.
Coombs, M.L., Bull, K.F., Vallance, J.W., Schneider, D.J., Thoms, E.E., Wessels, R.L., and McGimsey, R.G., 2010, Timing, distribution, and volume of proximal products of the 2006 eruption of Augustine Volcano, in Power, J.A., Coombs, M.L., and Freymueller, J.T., eds., The 2006 erup-tion of Augustine Volcano, Alaska: U.S. Geological Survey Professional Paper 1769 (this volume).
Dean, K.G., Dehn, J., Wallace, K.L., Prata, F., and Cahill, C.F., 2006, The distribution and movement of volcanic ash and SO2 observed in satellite data from the eruption of Augus-tine volcano, 2006 [abs]: Eos (American Geophysical Union Transactions), v. 87, no. 52, Fall Meeting Supplement, abstract V41F-05.
Doukas, M.P., 1995, a compilation of sulfur dioxide and car-bon dioxide emission-rate data from Cook Inlet volcanoes (Redoubt, Spurr, Iliamna, and Augustine), Alaska, during
the period from 1990 to 1994: U. S. Geological Survey Open-File Report 95-55, 15 p.
Doukas, M.P., 2002, A new method for GPS-based wind speed determinations during airborne volcanic plume measurements: U.S. Geological Survey Open-File Report 02-395, 13 p.
Doukas, M.P., and Gerlach, T.M., 1995, Sulfur dioxide scrub-bing during the 1992 eruptions of Crater Peak, Mount Spurr Volcano, Alaska, in Keith, T.E.C., ed., The 1992 Eruptions of Crater Peak Vent, Mount Spurr Volcano, Alaska: U.S. Geological Survey Bulletin 2139, 220 p.
Doukas, M.P. and McGee, K.A., 2007, A compilation of gas emission-rate data from volcanoes of the Cook Inlet (Spurr, Crater Peak, Redoubt, Iliamna, and Augustine) and the Alaska Peninsula (Douglas, Fourpeaked, Griggs, Mageik, Martin, Peulik, Ukinrek Maars, and Veniaminof), Alaska from 1995–2006: U.S. Geological Survey Open-File Report 2007-1400, 13 p.
Gerlach, T.M., Delgado, H., McGee, K.A., Doukas, M.P., Venegas, J J., and Cardenas, L., 1997, Application of the LI-COR CO2 analyzer to volcanic plumes; A case study, Volcán Popocateptl, Mexico, June 7 and 10, 1995: Journal of Geophysical Research, v. 102, p. 8005–8019.
Gerlach, T.M., Doukas, M.P., McGee, K.A., and Kessler, R., 1999, Airborne detection of diffuse carbon dioxide at Mam-moth Mountain, California: Geophysical Research Letters, v. 26, p. 3661–3664.
Gerlach, T.M., McGee, K.A., Elias, T., Sutton, A.J., and Dou-kas, M.P., 2002, Carbon dioxide emission rate of Kilauea Volcano—Implications for primary magma and the summit reservoir: Journal of Geophysical Research, v. 107, no. B9, 2189–2204, doi:10.1029/2001JB000407.
Gerlach, T.M., McGee, K.A., and Doukas, M.P., 2008, Emis-sion rates of CO2, SO2, and H2S, scrubbing, and preeruption excess volatiles at Mount St. Helens, 2004–2005, chap. 26 in Sherrod, D.R., Scott, W.E., and Stauffer, P.H., eds., A volcano rekindled; the renewed eruption of Mount St. Hel-ens, 2004–2006: U.S. Geological Survey Professional Paper 1750, p. 543-571.
Kienle, J., and Swanson, S.E., 1983, Volcanism in the east-ern Aleutian arc; Late Quaternary and Holocene centers, tectonic setting and petrology: Journal of Volcanology and Geothermal Research, v. 17, p. 393–432.
Kodosky, L.G., Motyka, R.J., and Symonds, R.B., 1991, Fumarolic emissions from Mount St. Augustine, Alaska; 1979–1984 degassing trends, volatile sources and their pos-sible role in eruptive style: Bulletin of Volcanology, v. 53, p. 381–394.

626 The 2006 Eruption of Augustine Volcano, Alaska
Marty, B., and Le Cloarec, M.-.F, 1992, Helium-3 and CO2 fluxes from subaerial volcanoes estimated from polo-nium-210 emissions: Journal of Volcanology and Geother-mal Research, v. 53, p. 67–72.
McGee, K.A., Doukas, M.P., and Gerlach, T.M., 2001, Quies-cent hydrogen sulfide and carbon dioxide degassing from Mount Baker, Washington: Geophysical Research Letters, v. 28, p. 4479–4482.
McGee, K.A., Doukas, M.P., McGimsey, R.G., Neal, C.A., and Wessels, R.L., 2008, Atmospheric contribution of gas emissions from Augustine volcano, Alaska during the 2006 eruption: Geophysical Research Letters, v. 35, L03306, doi: 10.1029/2007GL032301, 5 p.
Miller, T.P., McGimsey, R.G., Richter, D.H., Riehle, J.R., Nye, C.J., Yount, M.E., and Dumoulin, J.A., 1998, Catalog of historically active volcanoes of Alaska: U.S. Geological Survey Open-File Report 98-582, 104 p.
Neal, C.A., Murray, T.L., Power, J.A, Adleman, J.N., Whit-more, P.M., and Osiensky, J.M., 2010, Hazard information management, interagency coordination, and impacts of the 2005–2006 eruption of Augustine Volcano, in Power, J.A., Coombs, M.L., and Freymueller, J.T., eds., The 2006 erup-tion of Augustine Volcano, Alaska: U.S. Geological Survey Professional Paper 1769 (this volume).
Power, J.A., and Lalla, D.J., 2010, Seismic observations of Augustine Volcano, 1970–2007, in Power, J.A., Coombs, M.L., and Freymueller, J.T., eds., The 2006 eruption of Augustine Volcano, Alaska: U.S. Geological Survey Profes-sional Paper 1769 (this volume).
Power, J.A., Nye, C.J., Coombs, M.L., Wessels, R.L., Cervelli, P.F., Dehn, J., Wallace, K.L., Freymueller, J.Y., and Dou-kas, M.P., 2006, The reawakening of Alaska’s Augustine volcano: Eos (American Geophysical Union Transactions), v. 87, no. 37, p. 373–377.
Prada, F., 2006, Augustine: Bulletin of the Global Volcanism Network v. 31, issue 01.
Rose, W.I., Heiken, G., Wohletz, K., Eppler, D., Barr, S., Miller, T., Chuan, R.L., and Symonds, R.B., 1988, Direct rate measurements of eruption plumes at Augustine vol-cano: A problem of scaling and uncontrolled variables: Journal of Geophysical Research, v. 93, p. 4485–4499.
Schneider, D.J., Scott, C., Wood J., and Hall T., 2006, NEXRAD weather radar observations of the 2006 Augus-tine volcanic eruption clouds [abs.]: Eos (American Geo-physical Union Transactions), v. 87, abstract V51C-1686.
Simkin, T., and Siebert, L., 1994, Volcanoes of the World (2nd ed.): Tucson, Arizona, Geoscience Press, Inc., 349 p.
Stith, J.L., Hobbs, P.V., and Radke, L.F., 1978, Airborne particle and gas measurements in the emissions from six volcanoes: Journal of Geophysical Research, v. 83, p. 4009–4017.
Swanson, S.E., and Kienle, J., 1988, The 1986 eruption of Mount St. Augustine; Field test of a hazard evaluation: Jour-nal of Geophysical Research, v. 93, p. 4500–4520.
Symonds, R.B., Rose, W.I., Gerlach, T.M., Briggs, P.H., and Harmon, R.S., 1990, Evaluation of gases, condensates, and SO2 emissions from Augustine volcano, Alaska; The degas-sing of a Cl-rich volcanic system: Bulletin of Volcanology, v. 52, p. 355–374.
Symonds, R.B., Rose, W.I., Bluth, G.J.S., and Gerlach, T.M., 1994, Volcanic-gas studies: methods, results, and applica-tions, in Carroll, M.R., and Holloway, J.R., eds., Volatiles in magmas: Reviews in Mineralogy, V. 30, p. 1–66.
Symonds, R.B., Gerlach, T.M., and Reed, M.H., 2001, Mag-matic gas scrubbing; Implications for volcano monitoring: Journal of Volcanology and Geothermal Research, v. 108, p. 303–341.
Symonds, R.B., Janik, C.J., Evans, W.C., Ritchie, B.E., Counce, D., Poreda, R.J., and Iven, M., 2003, Scrubbing masks magmatic degassing during repose at Cascade-Range and Aleutian-Arc volcanoes: U.S. Geological Survey Open-File Report 03-435, 22 p.
U.S. Environmental Protection Agency, 2007, Emissions and Generation Resource Integrated Database (eGrid2006, Version 2.1): [http://www.epa.gov/cleanenergy/egrid/index.htm; last accessed April 12, 2007].
Vallance, J.W., Bull, K.F., and Coombs, M.L., 2010, Pyroclas-tic flows, lahars, and mixed avalanches generated during the 2006 eruption of Augustine Volcano, in Power, J.A., Coombs, M.L., and Freymueller, J.T., eds., The 2006 erup-tion of Augustine Volcano, Alaska: U.S. Geological Survey Professional Paper 1769 (this volume).
Waitt, R.B., and Begét, J.E., 2009, Volcanic processes and geology of Augustine Volcano, Alaska: U.S. Geological Survey Professional Paper 1762, 90 p, 2 plates.
Wallace, K.L., Neal, C.A., and McGimsey, R.G., 2010, Timing, distribution, and character of tephra fall from the 2005–2006 eruption of Augustine Volcano, in Power, J.A., Coombs, M.L., and Freymueller, J.T., eds., The 2006 erup-tion of Augustine Volcano, Alaska: U.S. Geological Survey Professional Paper 1769 (this volume).
Waythomas, C.F., and Waitt, R.B., 1998, Preliminary volcano-hazard assessment for Augustine volcano, Alaska: U.S. Geological Survey Open-File Report 98-106, 39 p.

26. Emission of SO2, CO2, and H2S from Augustine Volcano, 2002–2008 627
Werner, C.A., Christenson, B.W., Hagerty, M., and Britten, K., 2006, Variability of volcanic gas emissions during a crater lake heating cycle at Ruapehu Volcano, New Zealand: Jour-nal of Volcanology and Geothermal Research, v. 154, p. 291–302.
Wessels, R.L., Coombs, M.L., Schneider, D.J., Dehn, J., and Ramsey, M.S., 2010, High-resolution satellite and airborne thermal infrared imaging of the 2006 eruption of Augustine Vol-
cano, in Power, J.A., Coombs, M.L., and Freymueller, J.T., eds., The 2006 eruption of Augustine Volcano, Alaska: U.S. Geologi-cal Survey Professional Paper 1769 (this volume).
Williams, S.N., Schaefer, S.J., Calvache, M.L., and Lopez, D., 1992, Global carbon dioxide emission to the atmosphere by volcanoes: Geochimica et Cosmochimica Acta, v. 56, p. 1765–1770.