emission factors for biomass burning -...
TRANSCRIPT

REPORT 9 12/2016
EMISSION FACTORS
FOR BIOMASS
BURNING


AIRUSE LIFE 11 ENV/ES/584
Authors:


Report 9: Emission factors for biomass burning
AIRUSE LIFE 11 ENV/ES/584 1 / 26
INDEX
1. INTRODUCTION...........................................................................................................................3
2. EXPERIMENTAL DETAILS .......................................................................................................5
3. EMISSION FACTORS ..................................................................................................................9
3.1. EMISSIONS FROM RESIDENTIAL BIOMASS COMBUSTION APPLIANCES ....................................10
3.2. EMISSIONS FROM A FLUIDISED BED REACTOR ..........................................................................16
4. SUMMARY AND RECOMMENDATIONS ..............................................................................18
REFERENCES .....................................................................................................................................19
SUPPLEMENTARY MATERIAL .....................................................................................................22
1) EMISSION FACTORS FROM TRADITIONAL APPLIANCES (FIREPLACE VERSUS WOODTOVE) .........22
2) EMISSION FACTORS FROM A MODERN CERTIFIED WOODSTOVE ...................................................24
3) EMISSION FACTORS FROM A PELLET STOVE ...................................................................................25
4) EMISSION FACTORS FROM A FLUIDISED BED REACTOR .................................................................26

Report 9: Emission factors for biomass burning
AIRUSE LIFE 11 ENV/ES/584 2 / 26

Report 9: Emission factors for biomass burning
AIRUSE LIFE 11 ENV/ES/584 3 / 26
1. INTRODUCTION
Residential wood combustion (RWC) has been identified as an important source of air
pollution in many European urban and rural areas in Central and Northern Europe (e.g.
Puxbaum et al., 2007; Gelencsér et al., 2008; Schmidl et al., 2008; Bari et al., 2009, 2010;
Caseiro et al., 2009; Piazzalunga et al., 2011). Besides greenhouse gases, the emission of
carbonaceous particles under 10 or 2.5 µm (PM10 or PM2.5) from biomass combustion
deserves special attention. These particles are formed by a complex mixture of organic
compounds, normally referred to as organic carbon (OC), and a mass of carbon atoms (black
in colour) with a graphitic-like structure that is normally called elemental carbon (EC). EC
has optical and chemically catalytic properties, causing visibility reduction, positive radiative
forcing and an impact on atmospheric photochemistry (Chuang et al., 2003; Li et al., 2005).
On the other hand, OC presents light scattering properties and, since a significant fraction is
water soluble, participates in various aerosol-cloud interactions (Bates et al., 2005). OC
encompasses constituents known or suspected to be carcinogens, such as polycyclic aromatic
hydrocarbons (PAHs), within which benzo[a]pyrene (BaP) is included (Bølling et al., 2009).
In the early fall of 2010 a survey questionnaire was conducted to assess RWC practices in the
18 districts of mainland Portugal (Gonçalves et al., 2012). The survey questionnaire allowed
estimating a total of about 2 Mt y-1
of domestic wood consumption in the country. RWC is
used by more than 3 million and a half inhabitants, which corresponds to 37% out of the
population. In the households where wood is frequently burned, 43% use fireplaces.
Woodstoves and traditional ovens represent about 24% of the total number of appliances. The
emissions of PM2.5 from RWC in Portugal (11 kt y-1
) account for 30% of the estimate for
different source activities. In Italy, Pastorello et al. (2011) undertook a RWC activity survey,
in the Lombardy region, in order to obtain information useful for the development of high
quality emission inventories at the local and regional scale and to provide input data to air
quality modelling and planning. The survey indicated that wood logs are typically the most
used fuel, mainly for domestic heating and hardly ever for cooking. Among appliances for
heating purposes, traditional combustion systems (open fireplace, traditional stove) were
found to represent 61% of the total appliances in the region; 27% are closed fireplaces and the
remaining 12% are innovative devices (or automatic stoves). Moreover, it has been estimated
that, in Lombardy, the impact of wood burning on PM10 ranged from about 5% to about 25%.
It is noteworthy the not negligible contribution of wood burning also in the large city of Milan
(PM10 from RWC = 6.0-16.5%), especially in view of effective abatement policies, which are
mandatory because of the very high PM levels registered during wintertime (Piazzalunga et
al., 2011). The regional emission inventory carried out in 2008 in the same Italian region
showed that RWC in small appliances is the major source of BaP, representing 77% (2.9 t y–1
)
of the total emissions (3.8 t y–1
). In particular, traditional woodstoves, closed fireplaces and
open fireplaces are the major contributors accounting, respectively, for 32%, 23% and 19%. It
should be noted that, due to its carcinogenicity, BaP is regulated in the European Union by the
4th
Air Quality Daughter Directive (2004/107/EC). Belis et al. (2011) conducted a study in
2007 and 2009 at ten air quality monitoring stations in the North Italian Po Plain and
Valtelline Valley. Emissions from biomass burning accounted for 74±32%, 79±18%,

Report 9: Emission factors for biomass burning
AIRUSE LIFE 11 ENV/ES/584 4 / 26
85±33%, and 84±46% of all BaP sources, respectively, at a kerbside in Milan, six urban
background stations in the Po Plain, two rural background stations in the Po Plain, and an
urban background station in the Valtelline Valley. BaP measurements in 2010 were above the
target value threshold (1 ng m-3
annual average) at 38 % of the EMEP monitoring stations.
Exceedances are most predominant in central and eastern Europe, although they are also
observed in Bulgaria, Germany, Ireland, the United Kingdom, France and Greece (EEA,
2012).
Air pollution is usually not the first consequence that comes to mind when thinking about an
economic crisis, but new research out of economically downtrodden Greece has found that as
the price of heating oil increases, Greek residents are switching to burning cheaper material,
such as wood, to warm their homes, which is having an effect on the environment and
possibly public health. Air quality in the Greek city of Thessaloniki has worsened during the
recent economic crisis, because residents burn more wood and other types of biomass to keep
warm. A recent study has found a 30% increase in the concentration of fine particle (PM2.5)
emissions associated with RWC in 2012 and 2013 (Saffari et al., 2013). Evening samples
encompassed a higher proportion of organic matter (74%) compared with the morning
samples (58%), again suggesting more wood and biomass were used for heating in the
evening. Also, the concentrations of vanadium and nickel, which imply combustion of
residential fuel oil and industrial activity, were 30-40% lower in 2013 compared with 2012.
Although no similar study has been conducted in Portugal, some sales statistics indicate that
Portuguese people are also burning more wood. Moreover, in recent years there has been a
proliferation of companies selling RWC appliances. The certification processes are still being
discussed and there are no regulations in force in the country. In Spain, the Ministry of
Economy has encourage the installation of boilers as part of the 2004-2012 Energy Plan,
which aimed to promote the use of biomass, such as pellets, olive pit and almond shell, as an
energy source. Therefore, it has subsidized the installation of biomass boilers with up to 30%
of the investment cost.
Estimations of the contributions of RWC to PM2.5 or PM10 are hard to obtain, because
emission factors vary greatly with wood type and burning equipment (Gonçalves et al., 2011).
Moreover, the amounts and types of wood burned, the categories of burning appliances can
also differ significantly from region to region.
Biomass based heat and power production is an increasingly popular renewable energy
technology that shows overall greenhouse gas benefits. However, industrial combustion gives
rise to other airborne emissions, such as CO, and particulate matter. Currently, Portugal has 2
thermoelectric power plants with 22 MW capacity, consuming 269000 t y-1
of biomass
(Teixeira, 2009). However, 13 new power plants having a total capacity of 86.4 MW are in
construction. Nine co-generation power plants are installed in forestry sector industries, which
exploit biomass for heat production. It was estimated that energy production and industrial
combustion contribute to 3% and 20% of total PM10 emissions, respectively (APA, 2011).
However, national-level data on detailed emission factors from industrial combustion are non-
existent, pending further investigation.
The understanding of the emission processes as well as the databases covering the emission
factors from RWC and industrial burning of important trace gases and PM10/PM2.5 are still
very limited. This subject is of utmost importance, in particular in the Mediterranean region,
where the scarcity of information is more evident. The purpose of this research is focused on
fulfilling the need for detailed characterisation of emission profiles resulting from residential

Report 9: Emission factors for biomass burning
AIRUSE LIFE 11 ENV/ES/584 5 / 26
and industrial combustion of the most prevalent biofuels in Southern Europe. This will
contribute with new data to improve emission inventories and will help in the adoption of air
pollution control measures.
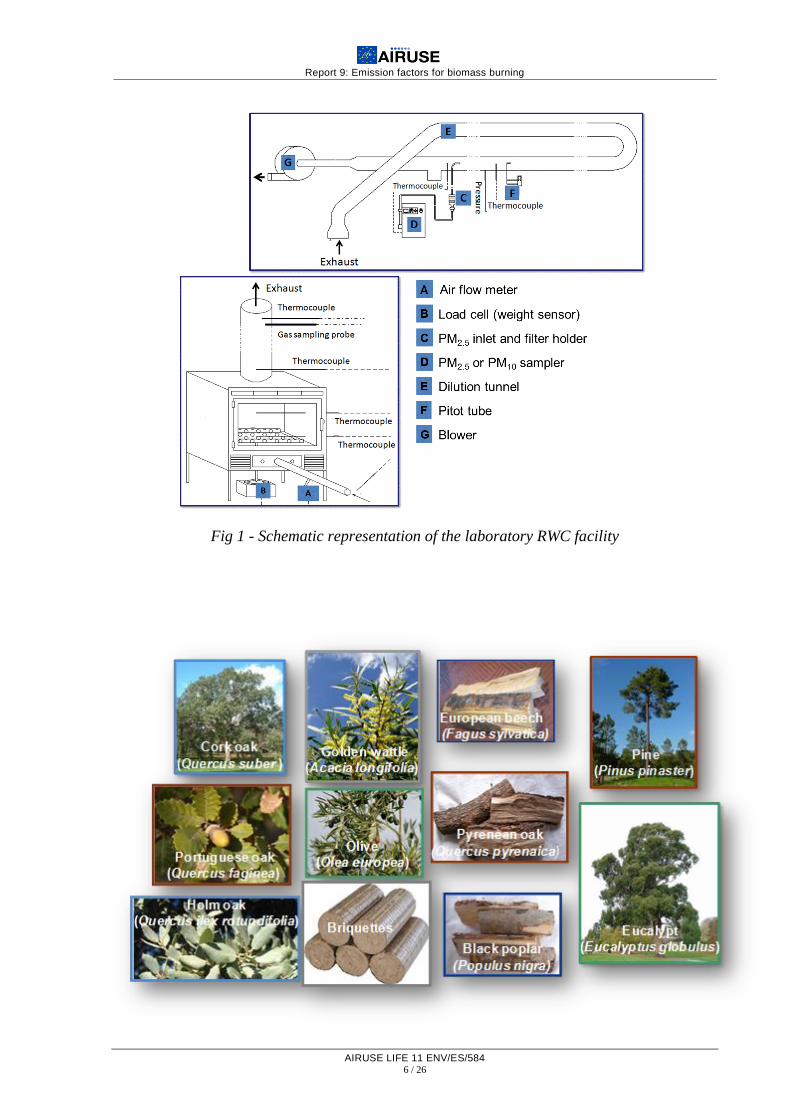
2. EXPERIMENTAL DETAILS
The Centre of Environmental and Marine Studies (CESAM), one of the research units of the
University of Aveiro (UAVR), has built a biomass combustion facility (Fig. 1) where
different biofuels (Fig. 2) have been burned in disctint appliances (Fig. 3). The infrastructure
enables the continuous control and monitoring of different parameters (e.g. temperatures,
pressures, flows, etc.) at various points (e.g. combustion chamber, chimney, dilution tunnel).
Particles are collected under isokinetic conditions in a dilution tunnel located downstream of
the chimney, which consists of a tube of circular section with 11 m length and 0.20 m internal
diameter. During the combustion experiments, different parameters are continuously
controlled:
i) mass of the fuel in the grate at the combustion chamber and fuel
consumption rate (weight sensor - load cell DSEUROPE Model 535QD-A5)
ii) temperature profiles of the combustion flue gas inside the combustion
chamber and at the exit of the chimney (K-type thermocouples)
iii) combustion gas flow rate entering the combustion chamber in the stove
(mass flow meter, Kurz, Model: 500-2.0-P 40) and at the exit of the chimney
(a Pitot tube, Testo AG 808, and a K-type thermocouple)
iv) composition of combustion flue gases at the exit of the chimney:
a. CO2 and CO (non-dispersive infrared, Environnement MIR 9000).
b. Total hydrocarbons (Dyna-FID Hidrocarbon Gas Analyser, model SE-310)
c. O2 (paramagnetic, ADC model O2-700 with a Servomex Module).
Report 9: Emission factors for biomass burning
AIRUSE LIFE 11 ENV/ES/584 6 / 26
Fig 1 - Schematic representation of the laboratory RWC facility

Report 9: Emission factors for biomass burning
AIRUSE LIFE 11 ENV/ES/584 7 / 26
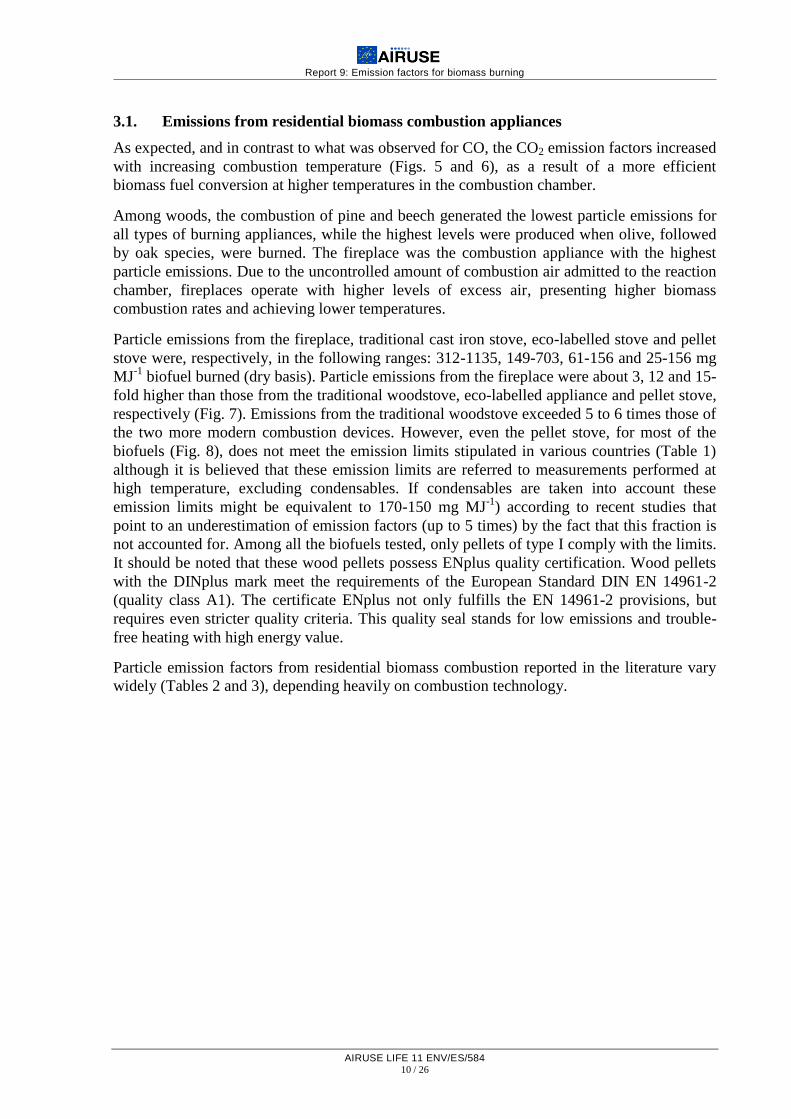
Fig. 2 - Biofuels whose emissions have been characterised. Upper group: biofuels burned in
fireplace and woodstoves. Bottom group: biofuels burned in a pellet stove.
Traditional fireplace
Operated manually in batch mode and with no control
of combustion air
Traditional woodstove
(Solzaima, Sahara, 9.8-18.2 kW)
Operated manually in batch mode and with handheld
control of combustion air

Report 9: Emission factors for biomass burning
AIRUSE LIFE 11 ENV/ES/584 8 / 26
Eco-labelled chimney-type woodstove, 6 kW
Operated manually in batch mode
Pellet stove (Solzaima, Alpes, 9.5 kW)
Automatic feeding
Fig. 3 – RWC appliances for which emission factors have been obtained
Taking into account the proliferation of residual forest biomass power plants, especially in
Portugal, and their likely impact on atmospheric PM levels, the emissions from the
combustion of wood chips in a Fluidised Bed Reactor (FBR) under different stoichiometric
conditions were studied (Fig. 4). The reactor is a thermally insulated AISI 310 SS tube with
an internal diameter of 0.25 m and 3 m height. The bed is operated with silica sand particles
in the 0.25-1.00 mm size range. The combustion air is staged, with primary air through the
distributor plate and secondary air through a vertical tube located inside the freeboard. The
solid fuels are fed together with the secondary air, and discharged continuously at bed surface.
Pressure, temperature and composition of the combustion flue gas are monitored by means of
nine water-cooled sampling probes located at several heights; two are immersed in the dense
bed and the others are located along the freeboard. Each probe is equipped with a cooled
particle filter at the rear, a K-type thermocouple, and a cerablanket plug at the tip. O2 and CO2
are monitored by an on-line gas analysis system (ADC WA-558G), paramagnetic for O2
(ADC model 02-700 with a Servomex Module) and non-dispersive infra-red for CO2 (ADC
model SB-300). The flue gas is exhausted to the atmosphere after passing through a cyclone
separator and/or a bag filter. Particle sampling from the exhaust can be done before or after
the dust separators.

Report 9: Emission factors for biomass burning
AIRUSE LIFE 11 ENV/ES/584 9 / 26
Dashed line - Electric circuit, Solid line - Pneumatic circuit, A - Primary air heating system, B - Sand bed, C - Bed solids level control, D -
Bed solids discharge, E - Bed solids discharge silo, F - Propane burner system, G - Port for visualisation of bed surface, H - Air flowmeter
(primary and secondary air), I - Control and command unit, J - Biomass feeder, K - Water-cooled gas sampling probe, L, M, P, Q - Command and gas distribution units (UCD0, UCD1, UCD2, UCD3), N - Gas sampling pump, O - Gas condensation unit for moisture
removal, R, S, T, U, V, W - Automatic on-line gas analysers, X - Electronic command unit (UCE1), Y - Computer data acquisition and
control system, Z - Exhaust duct to cyclone.
Fig. 4. Schematic representation of the pilot-scale installation.
In addition to the determination of emission factors (EFs) for combustion gases and particles
(PM2.5 or PM10), the particulate matter samples have been subjected to the determination of
their carbonaceous content (organic and elemental carbon, OC and EC) by a thermal-optical
technique (Pio et al., 2011).
3. EMISSION FACTORS
From the experimental results, four databases compiling the emission factors for CO, CO2,
PM10 or PM2.5, OC and EC resulting from the combustion of various biofuels in distinct
equipments were obtained (Supplementary Material):
1) Emission factors from traditional appliances (fireplace versus woodstove),
2) Emission factors from a modern certified woodstove,
3) Emission factors from a pellet stove,
4) Emission factors from a fluidised bed reactor.
Report 9: Emission factors for biomass burning
AIRUSE LIFE 11 ENV/ES/584 10 / 26
3.1. Emissions from residential biomass combustion appliances
As expected, and in contrast to what was observed for CO, the CO2 emission factors increased
with increasing combustion temperature (Figs. 5 and 6), as a result of a more efficient
biomass fuel conversion at higher temperatures in the combustion chamber.
Among woods, the combustion of pine and beech generated the lowest particle emissions for
all types of burning appliances, while the highest levels were produced when olive, followed
by oak species, were burned. The fireplace was the combustion appliance with the highest
particle emissions. Due to the uncontrolled amount of combustion air admitted to the reaction
chamber, fireplaces operate with higher levels of excess air, presenting higher biomass
combustion rates and achieving lower temperatures.
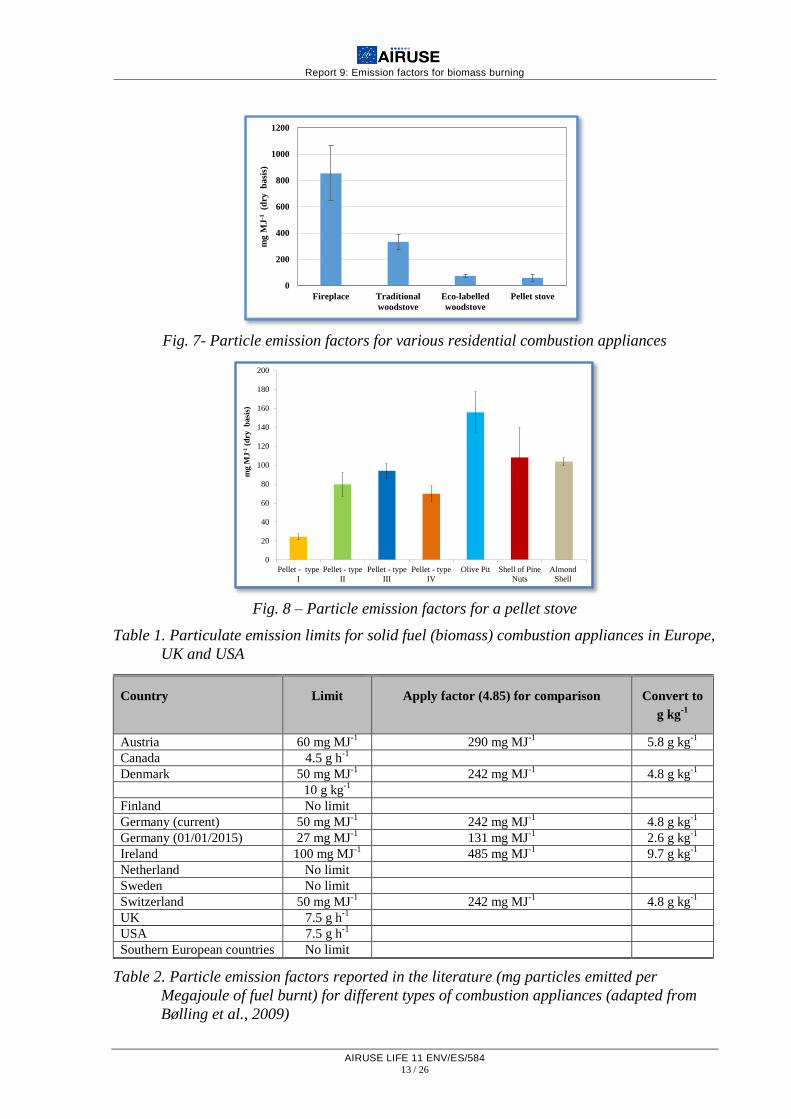
Particle emissions from the fireplace, traditional cast iron stove, eco-labelled stove and pellet
stove were, respectively, in the following ranges: 312-1135, 149-703, 61-156 and 25-156 mg
MJ-1
biofuel burned (dry basis). Particle emissions from the fireplace were about 3, 12 and 15-
fold higher than those from the traditional woodstove, eco-labelled appliance and pellet stove,
respectively (Fig. 7). Emissions from the traditional woodstove exceeded 5 to 6 times those of
the two more modern combustion devices. However, even the pellet stove, for most of the
biofuels (Fig. 8), does not meet the emission limits stipulated in various countries (Table 1)
although it is believed that these emission limits are referred to measurements performed at
high temperature, excluding condensables. If condensables are taken into account these
emission limits might be equivalent to 170-150 mg MJ-1
) according to recent studies that
point to an underestimation of emission factors (up to 5 times) by the fact that this fraction is
not accounted for. Among all the biofuels tested, only pellets of type I comply with the limits.
It should be noted that these wood pellets possess ENplus quality certification. Wood pellets
with the DINplus mark meet the requirements of the European Standard DIN EN 14961-2
(quality class A1). The certificate ENplus not only fulfills the EN 14961-2 provisions, but
requires even stricter quality criteria. This quality seal stands for low emissions and trouble-
free heating with high energy value.
Particle emission factors from residential biomass combustion reported in the literature vary
widely (Tables 2 and 3), depending heavily on combustion technology.

Report 9: Emission factors for biomass burning
AIRUSE LIFE 11 ENV/ES/584 11 / 26
Fig. 5 - CO, CO2 and PM2.5 emission factors for traditional appliances
0
500
1000
1500
2000
2500
Emis
sio
n f
acto
rs (
g C
O2
kg-1
bio
fue
l, d
ry b
asis
)
Fireplace Traditional woodstove
0
20
40
60
80
100
120
140
Emis
sio
n f
acto
rs (
g C
O k
g-1b
iofu
el,
dry
bas
is)
FireplaceTraditional woodstove
0
5
10
15
20
25
30
35
Emis
sio
n f
acto
rs (
g P
M2.
5kg
-1b
iofu
el,
dry
bas
is)
Fireplace
Traditional woodstove

Report 9: Emission factors for biomass burning
AIRUSE LIFE 11 ENV/ES/584 12 / 26
Fig.6 – Emission factors for the eco-labelled (chimney-type) woodstove
1520
1540
1560
1580
1600
1620
1640
1660
1680
Maritime pine Golden wattle Eucalypt Cork oak
CO
2(g
kg-1
, dry
bas
is)
0
10
20
30
40
50
60
70
80
Maritime pine Golden wattle Eucalypt Cork oak
CO
(g
kg-1
, dry
bas
is)
0.00
0.50
1.00
1.50
2.00
2.50
3.00
3.50
4.00
Maritime pine Golden wattle Eucalypt Cork oak
PM
10(g
kg-
1, d
ry b
asis
)
Report 9: Emission factors for biomass burning
AIRUSE LIFE 11 ENV/ES/584 13 / 26
Fig. 7- Particle emission factors for various residential combustion appliances
Fig. 8 – Particle emission factors for a pellet stove
Table 1. Particulate emission limits for solid fuel (biomass) combustion appliances in Europe,
UK and USA
Country Limit Apply factor (4.85) for comparison Convert to
g kg-1
Austria 60 mg MJ-1
290 mg MJ-1
5.8 g kg-1
Canada 4.5 g h-1
Denmark 50 mg MJ-1
242 mg MJ-1
4.8 g kg-1
10 g kg-1
Finland No limit
Germany (current) 50 mg MJ-1
242 mg MJ-1
4.8 g kg-1
Germany (01/01/2015) 27 mg MJ-1
131 mg MJ-1
2.6 g kg-1
Ireland 100 mg MJ-1
485 mg MJ-1
9.7 g kg-1
Netherland No limit
Sweden No limit
Switzerland 50 mg MJ-1
242 mg MJ-1
4.8 g kg-1
UK 7.5 g h-1
USA 7.5 g h-1
Southern European countries No limit
Table 2. Particle emission factors reported in the literature (mg particles emitted per
Megajoule of fuel burnt) for different types of combustion appliances (adapted from
Bølling et al., 2009)
0
200
400
600
800
1000
1200
Fireplace Traditional
woodstove
Eco-labelled
woodstove
Pellet stove
mg
MJ
-1(d
ry
ba
sis)
0
20
40
60
80
100
120
140
160
180
200
Pellet - type
I
Pellet - type
II
Pellet - type
III
Pellet - type
IV
Olive Pit Shell of Pine
Nuts
Almond
Shell
mg
MJ
-1(d
ry b
asi
s)

Report 9: Emission factors for biomass burning
AIRUSE LIFE 11 ENV/ES/584 14 / 26
Combustion appliances
Emission factors
Reference Aprox. range
(mg MJ-1
)
Data used for
inventories
(mg MJ-1
)
Open fireplaces 160 - 910 800
160-447 a,1
860-910 a,2
Karvosenoja et al. (2008)
Nussbaumer et al. (2008)
Nussbaumer et al. (2008)
Modern boilers for wood chips or logs 5-450 5-450 a,1
Nussbaumer et al. (2008)
20-25 Jokiniemi et al. (2008)
30-100 Sternhufvud et al. (2004)
Pellet stoves and boilers 3-50 30 Karvosenoja et al. (2008)
10-50 a,1 and 2
Nussbaumer et al. (2008)
20 Jokiniemi et al. (2008)
30 Sternhufvud et al. (2004)
miscanthus pellets 8*
Schmidl et al. (2011)
triticale pellets 120*
full load 8-11*
start up 8-34*
maloperation 3-21*
wood pellets 16-31* Kistler el al. (2012)
Chimney stoves
6kW 4 Portuguese wood types 114* Gonçalves et al. (2010)
6kW, 10kW Australian wood types+Briquetts 83* Schmidl et al. (2011)
8kW 12 Central European wood types 20-222* Kistler el al. (2012)
8kW Wood briquetts 32*
Conventional wood stoves 50-2100 700 Karvosenoja et al. (2008)
94-650 a,1
Nussbaumer et al. (2008)
50-1932 a,2
Nussbaumer et al. (2008)
100 Jokiniemi et al. (2008)
150-2100 Sternhufvud et al. (2004)
Other conventional stoves,
including masonry heaters
and sauna stoves
30-140
140
30-100
Karvosenoja et al. (2008)
Jokiniemi et al. (2008)
Conventional boilers for wood logs
without accumulator tank
50-2000
700
Karvosenoja et al. (2008)
300-2000 a,1 and 2
Nussbaumer et al. (2008)
1300 Jokiniemi et al. (2008)
300-900 Sternhufvud et al. (2004)
with accumulator tank 50-250 80 Karvosenoja et al. (2008)
50-300 a,1 and 2
Nussbaumer et al. (2008)
95 Sternhufvud et al. (2004)
arange of emission factors based on data from members of the International Energy Agency, as reported in Nussbaumer et al. (2008).
1 = measurement of particles at temperatures > 100°C, 2 = measurement of particles in dilution tunnel at temperatures < 100°C.
bdata from Puxbaum and Winiwarter (2011)
* mgPM10 MJ-1

B4: Emission factors for biomass burning
AIRUSE LIFE 11 ENV/ES/584
Page 15
Table 3. Particle emission factors (g kg-1
). Adapted from Fernandes et al. (2011)
Biofuel type Burning appliance PM2.5 emission factors PM10 emission factors Ref.
Birch wood Soapstone stove 0.1- 2.6 g PM2.5 kg-1 Hedberg et al. (2002)
Australian trees:
Modified commercial
stove
Fast burning conditions:
0.14-0.21 g PM2.5 kg-1 for wood (wet basis)
0.45-4.7 g PM2.5 kg-1 for leaves and branches
(wet basis)
Slow burning conditions:
0.12-0.48 g PM2.5 kg-1 for wood (wet basis)
3.3-4.9 g PM2.5 kg-1 for leaves and branches (wet
basis
Wardoyo et al. (2006)
Potted Gum (Corymbia citriodora),
Blue Gum (Eucalyptus tereticornis),
Bloodwood (Eucalyptus intermedia),
Iron Bark (Eucalyptus crebra), and
Stringybark (Eucalyptus umbra).
Prevalent USA tree species
Non-catalytic stove 0.88-3.4 g PM2.5 kg-1 biomass (wet basis)
Fine et al. (2004) Catalytic stove 1.2-2.2 g PM2.5 kg-1 biomass (wet basis)
Fireplace 3.3-6.8 g PM2.5 kg-1 biomass (wet basis)
Acacia nilotica and briquettes
Indian traditional stoves
0.8-1.8 g PM10 kg-1 biomass
(dry basis) Venkataraman and Rao
(2001) Improved stoves
2.1-2.2 g PM10 kg-1 biomass
(dry basis)
Portuguese woods and briquettes
“Chimney type”
logwood stove
1.12-2.89 g PM10 kg-1 biomass
(dry basis)
Fernandes et al. (2011) Cast iron traditional
stove
5.17-12.8 g PM2.5 kg-1 biomass (dry basis)
Fireplace 6.89-20.1 g PM2.5 kg-1 biomass (dry basis)
Biofuel type Burning appliance OC/PM mass percentages EC/PM mass percentages Ref.
Chinese woody fuels Chinese stoves 19-59% (avg. 37%) 36-71% (avg. 47%) Li et al. (2009)
Wood Cook stoves in Honduras 28-65% (avg. 43%) 4-55% (avg. 21%) Roden et al. (2006)
Alpine woods Tiled stove (Kachelofen) 41-56% 9.8-31% Schmidl et al. (2008)
Portuguese woods and briquettes “Chimney type”
logwood stove
20-43% 11-37%
Fernandes et al. (2011)
Cast iron traditional
stove
39-55% 3-12%
Fireplace 40-52% 2-12%

B4: Emission factors for biomass burning
AIRUSE LIFE 11 ENV/ES/584
Page 16
In the fireplace and the old type stove, OC dominated the emissions, while more efficient
combustion in the “chimney-type” and pellet stoves contributed to 1.3 to 4.7-fold higher EC
relative fractions in PM (Table 4). The pellet stove presented more variable EC particle mass
fractions, ranging from 3% (olive pit) to 47% (shell of pine nuts). The EC-to-total carbon
(TC=OC+EC) ratios were, on average, 0.076, 0.164, 0.413 and 0.400 for the fireplace,
traditional woodstove, eco-labelled stove and pellet stove, respectively. An increase in the
ratios with increasing combustion temperature was generally observed. Bølling et al. (2009)
reported EC/TC ratios from 0.01 to 0.11 for low-temperature combustion in conventional
stoves, confirming that PM from these combustion conditions are dominated by OC.
Comparatively, EC/TC ratios for incomplete high-temperature combustion in stoves and
masonry heaters have been reported to range from approximately 0.5 to 0.75 (Bølling et al.,
2009). In the present study, OC contributed to approximately 55% of the fine particle mass in
the emissions from every wood species studied, representing, on average, 92 and 84% of total
carbon in PM2.5 emitted by the fireplace and woostove, respectively. This overwhelming
proportion of carbonaceous constituents in smoke particles from the low-temperature
combustion equipments of this study differs from the fly ash composition of modern
appliances with improved combustion conditions, good burn out and lower emissions of PM,
in which inorganic salts dominate.
Table 4. Particulate mass fractions (%) of organic and elemental carbon
Appliance OC EC
Fireplace 55 11 4.6 2.8
Traditional woodstove 53 7.2 11 9.9
Eco-labelled woodstove 30 9.9 22 13
Pellet stove 18 7.9 14 15
3.2. Emissions from a fluidised bed reactor
Some industries, such as pulp and paper mills, generate an important fraction of their energy
needs from biomass fuels derived from forest management activities and industrial process
streams. Forest residues and sewage sludge are produced in different processes in the pulp and
paper industry. Among the main routes for sewage sludge management (agriculture
application, combustion or landfilling), combustion seems to be an interesting option due to
three main aspects: i) volume reduction, ii) destruction of pathogen agents and organic
pollutants and iii) energy recovery. Co-combustion, i.e. the simultaneous combustion of two
or more fuels in the same plant for energy production, constitutes a promising option for
valorisation of some industrial wastes. Among the technologies available for co-combustion,
fluidised bed combustion is one of the most advantageous due to its fuel flexibility and
operating conditions. However, particulate emissions from the co-combustion of forest
biomass residues and sewage sludge from a pulp and paper industry are unknown.
Forest biomass residues from eucalyptus felling and sewage sludge from the pulp and paper
industry were used as fuel. Forest biomass residues and sewage sludge were air dried,

Report 9: Emission factors for biomass burning
AIRUSE LIFE 11 ENV/ES/584 17 / 26
chopped and sieved in order to obtain particles in the size range of 1-5 mm. The final fuel was
composed of 40%wt of secondary sewage sludge and 60%wt of forest biomass residues.
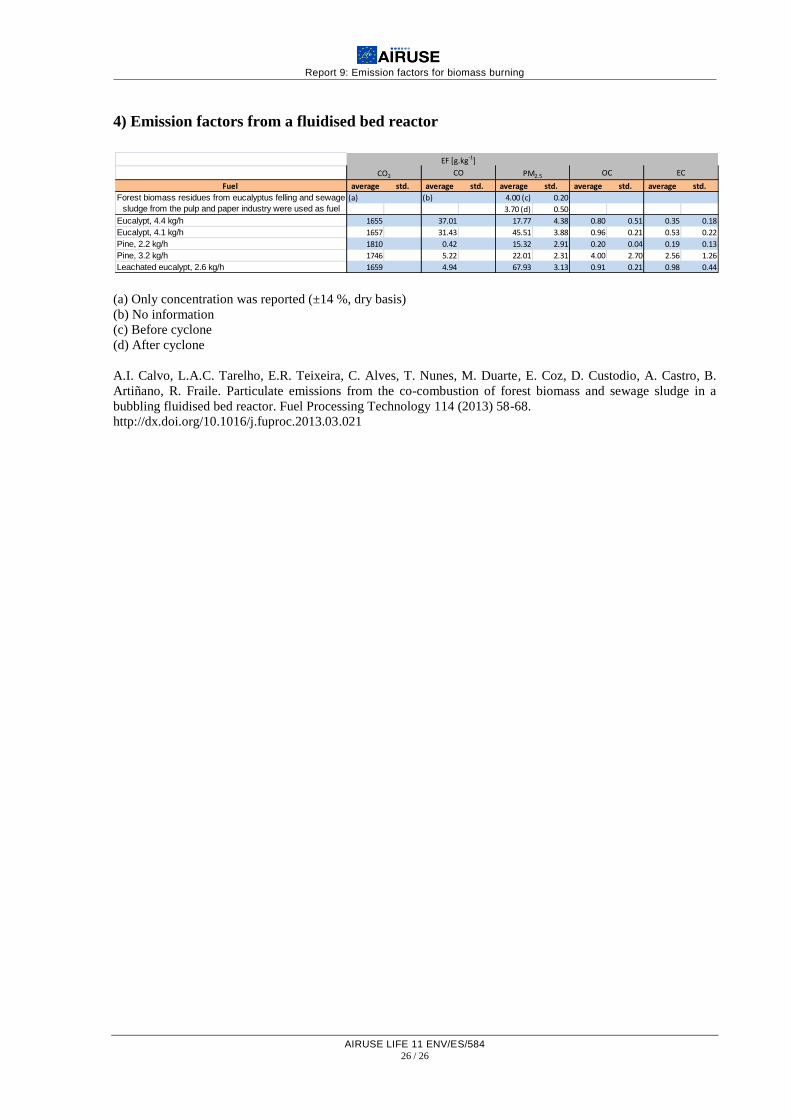
An emission factor of 4.0 ± 0.2 g PM2.5·kg−1
of fuel (as burned) and 3.7 ± 0.5 g PM2.5·kg−1
of
fuel (as burned) was estimated for the flue gas before and after the cyclone, during the co-
combustion experiments. Total carbon represented a small fraction of PM2.5, with higher
TC/PM2.5 ratios before the cyclone (6.9%wt vs 1.9%wt, before and after the cyclone,
respectively). A significant fraction of TC is composed of OC. On average, this accounted for
97.1%wt and 68.7%wt of TC, before and after the cyclone, respectively.
Emissions from the combustion of two types of biomass that are typically used in Portugal in
industrial facilities for power and energy production were also studied. Wood chips from
eucalypt (Eucalyptus globulus) and pine (Pinus pinaster) were combusted in a FBR under
various stoichiometric conditions:
- Experiments E1 – eucalypt, 4.1 kg h-1
, 3.3±0.2 O2
- Experiments E2 – eucalypt, 4.4 kg h-1
, 4.0±0.3 O2
- Experiments LE – leachated eucalypt, 2.6 kg h-1
, 7.6±0.4 O2
- Experiments P1 – pine, 2.2 kg h-1
, 8.4±0.1 and 10.3±0.4 O2
- Experiments P2 – pine, 3.2 kg h-1
, 4.9±0.0 O2
The PM2.5 emission factors (after cyclone) for softwood combustion ranged between 15.3 ±
2.91 and 22.0 ± 2.31 (mg kg-1
of fuel, dry basis). The lowest PM2.5 emission factor was
observed when operating the reactor with high O2 content (P1). Particulate emissions increase
with the decrease of the stoichiometry (Fig. 9). Unlike residential combustion appliances that
present high carbonaceous content, combustion in a FBR generates low amounts of OC and
EC, representing, on average, 5.5 and 3.5% of the PM2.5 mass.
Fig. 9. Particle emission factors for a wood chips combusted in a BFR under different
stoichiometries
0.0
20.0
40.0
60.0
80.0
E1 E2 LE P1 P2
mg
kg-1
fue
l bu
rne
d (
dry
bas
is)

Report 9: Emission factors for biomass burning
AIRUSE LIFE 11 ENV/ES/584 18 / 26
4. SUMMARY AND RECOMMENDATIONS
Results from several measurement studies, together with disaggregation of emissions factors
by technology and fuel type, lead to quite large differences, especially between old-type
residential appliances, which dominate in Southern European countries, versus modern
woodstoves and boilers with higher combustion efficiency.
With regard to human health, emission requirements for the eco-labelling of small-scale
combustion appliances for wood logs and pellets should be mandatory in all countries. The
requirement for selling only certified pellets should also be widespread. The product testing
should be performed by qualified and recognised laboratories. Similarly to what has already
been implemented in a few countries, other regulations should be imposed so that aspects
such as storage of wood logs or pellets and transportation are taken into account.
For areas that do not meet the national particle standards due in part to wood smoke, the local
jurisdiction may consider banning the use of non-certified woodstoves. National governments
and regional authorities should support voluntary woodstove and fireplace
replacement/retrofit programmes to motivate households to replace older technologies with
safer, more efficient, cleaner burning technologies. A plan for education and outreach to the
public should definitely be included when introducing burn ban ordinances or wood-burning
appliance replacement programmes. Financial incentives may be a necessity to encourage
households to replace or retrofit old wood-burning appliances.

Report 9: Emission factors for biomass burning
AIRUSE LIFE 11 ENV/ES/584 19 / 26
REFERENCES
APA – Agência Portuguesa do Ambiente (2011) Emissões de Poluentes Atmosféricos por Concelho
2009: Gases acidificantes e eutrofizantes, precursores de ozono, partículas, metais pesados e
gases com efeito de estufa. Amadora, Portugal.
Bari M.A., Baumbach G., Kuch B., Scheffknech, G. (2010) Temporal variation and impact of wood
smoke pollution on a residential area in southern Germany. Atmospheric Environment 44,
3823-3832.
Bari M.A., Baumbach G., Kuch B., Scheffknecht G. (2009) Wood smoke as a source of particle-phase
organic compounds in residential areas. Atmospheric Environment 43, 4722-4732.
Bates T.S., Quinn P.K., Coffman D.J., Johnson J.E., Middlebrook A.M. (2005) Dominance of organic
aerosols in the marine boundary layer over the Gulf of Maine during NEAQS 2002 and their
role in aerosol light scattering Journal of Geophysical Research 110, D18202.
Belis C.A., Cancelinha J., Duane M., Forcina V., Pedroni V., Passarella R., Tanet G., Douglas K.,
Piazzalunga A., Bolzacchini E., Sangiorgi G., Perrone M.-G., Ferrero L., Fermo P., Larsend
B.R. (2011) Sources for PM air pollution in the Po Plain, Italy: I. Critical comparison of
methods for estimating biomass burning contributions to benzo(a)pyrene. Atmospheric
Environment 45, 7266-7275.
Bølling A.K., Pagels J., Yttri K.E., Barregard L., Sallsten G., Schwarze P.E., Boman C. (2009) Health
effects of residential wood smoke particles: the importance of combustion conditions and
physicochemical particle properties. Particle and Fibre Toxicology 6, 29. doi:10.1186/1743-
8977-6-29.
Caseiro A., Bauer H., Schmidl C., Pio C., Puxbaum H. (2009) Wood burning impact on PM10 in three
Austrian regions. Atmospheric Environment 43, 2186-2195.
Chuang P.Y., Duvall R.M., Bae M.S., Jefferson A., Schauer J.J., Yang H., Yu J.Z., Kim, J. (2003)
Observations of elemental carbon and absorption during ACE-Asia and implications for
aerosol radiative properties and climate forcing. Journal of Geophysical Research 108(D23),
8634.
European Environment Agency (2012) Air quality in Europe - 2012 report. EEA Report No 4/2012.
Copenhagen.
Fernandes A.P., Alves C.A., Gonçalves C., Tarelho L., Pio C., Schimdl C., Bauer H. (2011). Emission
factors from residential combustion appliances burning Portuguese biomass fuels. Journal of
Environmental Monitoring 13, 3196-3206.
Fine P., Cass G.R., Simoneit B.R.T. (2004) Chemical characterization of fine particle emissions from
the wood stove combustion of prevalent United States tree species. Environmenta Engireeng
Science 21, 705-721.
Gelencsér A., May B., Simpson D., Sanchez-Ochoa A., Kasper-Gieb, A., Puxbaum H., Caseiro A., Pio
C., Legrand M. (2008) Major sources of PM2.5 organic aerosols in Europe: predominance of
biomass burning and secondary organic aerosols (SOA). Geochimica et Cosmochimica Acta
73 (13), A425.
Gianelle V., Colombi C., Caserini S., Ozgen S., Galante S., Marongiu A., Lanzani G. (2013)
Benzo(a)pyrene air concentrations and emission inventory in Lombardy region, Italy.
Atmospheric Pollution Research 4, 257‐266.

Report 9: Emission factors for biomass burning
AIRUSE LIFE 11 ENV/ES/584 20 / 26
Gonçalves C., Alves C., Evtyugina M., Mirante F., Pio C., Caseiro A., Schmidl C., Bauer H.,
Carvalho F. (2010) Characterisation of PM10 emissions from wood stove combustion of
common woods grown in Portugal. Atmospheric Environment 44, 4474‐4480.
Gonçalves C., Alves C., Fernandes A.P., Monteiro C., Tarelho L., Evtyugina M., Pio C. (2011)
Organic compounds in PM2.5 emitted from fireplace and woodstove combustion of typical
Portuguese wood species. Atmospheric Environment. 45, 4533-4545.
Gonçalves C., Alves C., Pio C. (2012) Inventory of fine particulate organic compound emissions from
residential wood combustion in Portugal. Atmospheric Environment 50, 297-306.
Hedberg E., Kristensson A., Ohlsson M., Johansson C., Johansson P.A., Swietlicki E., Vesely E.,
Wideqvist U.,Westerholm R. (2002) Chemical and physical characterization of emissions
from birch wood combustion in a wood stove. Atmospheric Environment 36, 4823-4837.
Jokiniemi J., Hytönen K., Tissari J., Obernberger I., Brunner T., et al. (2008) Biomass combustion in
residential heating: particulate measurements, sampling, and physicochemcial and
toxicological characterisation. ISSN 0786-728 Final report of the project 'Biomass-PM' funded
by ERA-NET Bioenergy Programme 2007-2008.;University of Kuopio, Report 1/2008; 2008.
Karvosenoja N., Tainio M., Kupiainen K., Tuomisto J.T., Kukkonen J., Johansson M. (2008)
Evaluation of the emissions and uncertainties of PM2.5 originated from vehicular traffic and
domestic wood combustion in Finland. Boreal Environmental Research 13, 465-474.
Kistler M., Schmidl C., Padouvas E., Giebl H., Lohninge J., Ellinger R., Bauer H., Puxbaum H. (2012)
Odor, gaseous and PM10 emissions from small scale combustion of wood types indigenous to
Central Europe. Atmospheric Environment 51, 86-93
Li G., Zhang R., Fan J., Tie X. (2005) Impacts of black carbon aerosol on photolysis and ozone.
Journal of Geophysical Research, 110, D23206.
Li X.H., Wang S.X., Duan L., Hao J.M., Nie Y.F. (2009) Carbonaceous aerosol emissions from
household biofuel combustion in China. Environmental Science and Technology 43, 6076-
6081.
Nussbaumer T., Klippel N., Johansson L. (2008) Survey on measurements and emission factors on
particulate matter from biomass combustion in IEA countries [abstract]. 16th Eurpoean
Biomass Conference and Exhibition, 2- 6 June, Valencia, Spain 2008 [http://
www.verenum.ch/Publikationen/Biomass-Conf9.2.pdf].
Pastorello C., Caserini S., Galante S., Dilara P., Galletti F. (2011) Importance of activity data for
improving the residential wood combustion emission inventory at regional level. Atmospheric
Environment 45, 2869-2876.
Piazzalunga A., Belis C., Bernardoni V., Cazzuli O., Fermo P., Valli G., Vecchi R. (2011) Estimates
of wood burning contribution to PM by the macro-tracer method using tailored emission
factors. Atmospheric Environment 45, 6642-6649.
Pio C., Cerqueira M., Harrison R.M., Nunes T., Mirante F., Alves C., Oliveira C., Sanchez de la
Campa A., Artiñano B., Matos M. (2011) OC/EC Ratio Observations in Europe: Re-thinking
the approach for apportionment between primary and secondary organic carbon. Atmospheric
Environment. 45, 6121-6132.
Puxbaum H., Caseiro A., Sánchez-Ochoa A., Kasper-Giebl A., Claeys M., Gelencsé, A., Legrand M.,
Preunkert S., Pio C. (2007) Levoglucosan levels at background sites in Europe for assessing
the impact of biomass combustion on the European aerosol background. Journal of
Geophysical Research 112, D008114.

Report 9: Emission factors for biomass burning
AIRUSE LIFE 11 ENV/ES/584 21 / 26
Puxbaum H., Winiwarter W. (2011) Advances of Atmospheric Aerosol Research in Austria.
Compendium prepared by the Clean Air Commission of the Austrian Academy of Sciences.
http://www.oeaw.ac.at/krl/publikation/documents/KRL_compendium_PM.pdf
Roden C.A., Bond T.C., Conway S., Pinel A.B.O. (2006) Emission factors and real-time optical
properties of particles emitted from traditional wood burning cookstoves. Environmental
Science and Technology 40, 6750-6757.
Saffari A., Daher N., Samara C., Voutsa D., Kouras A., Manoli E., Karagkiozidou O., Vlachokostas
C., Moussiopoulos N., Shafer M.M., Schauer J.J.,Sioutas C. (2013) Increased biomass
burning due to the economic crisis in Greece and its adverse impact on wintertime air quality
in Thessaloniki. Environmental Science & Technology 47, 13313-13320.
Schmidl C., Luisser M., Padouvas E., Lasselsberger L., Rzaca M., Ramirez-Santa Cruz C., Handler
M., Peng G., Bauer H., Puxbaum H. (2011) Particulate and gaseous emissions from manually
and automatically fired small scale combustion systems. Atmospheric Environment 4, 7443-
7454
Schmidl C., Marr I.L., Caseiro A., Kotianova P., Berner A., Bauer H., Kasper-Giebl A., Puxbaum H.
(2008). Chemical characterisation of fine particle emissions from wood stove combustion of
common woods growing in mid-European Alpine regions. Atmospheric Environment 42, 126-
141.
Schmidl C., Marr I.L., Caseiro A., Kotianová P., Berner A., Bauer H., Kasper-Giebl A., Puxbaum H.
(2008) Chemical characterisation of fine particle emissions from wood stove combustion of
common woods growing in mid-European Alpine regions. Atmospheric Environment 42, 126-
141.
Sternhufvud C., Karvosenoja N., Illerup J., Kindbom K., Lükewille A., Johansson M., Jensen D.
(2004) Particulate matter emissions and abatement options in residential wood burning in the
Nordic countries. ANP 2004:735 2004 [http://www.norden.org/is/utgafa/utgefid-efni/2004-
735/at_download/publicationfile]. Nordic Council of Ministers.
Teixeira L.M.A. (2009) Opções de utilização da biomassa florestal no context energético de Portugal.
Dissertação do Mestrado Integrado em Engenharia Mecânica. Faculdade de Engenharia da
Universidade do Porto. Portugal.
Venkataraman C., Rao G.U.M. (2001). Emission factors of carbon monoxide and size-resolved aerosol
from biofuel combustion. Environmental Science and Technology 35, 2100-2107.
Wardoyo A.Y.P., Morawska L., Ristovski Z.D., Marsh J. (2006) Quantification of particle number and
mass emission factors from combustion of Queensland trees. Environmental Science and
Technology 40, 5696-5703.

Report 9: Emission factors for biomass burning
AIRUSE LIFE 11 ENV/ES/584 22 / 26
SUPPLEMENTARY MATERIAL
1) Emission factors from traditional appliances (fireplace versus woodtove)
References:
[1] GONÇALVES, C.; ALVES, C.; PIO, C. - Inventory of fine particulate organic compound emissions from
residential wood combustion in Portugal. Atmospheric Environment. 50 (2012) 297–306. doi:
10.1016/j.atmosenv.2011.12.013.
[2] MARTINS, V. I. F. - Emissões de carbono particulado durante a queima doméstica de biomassa. [S.l.]:
Universidade de Aveiro, 2012
[3] DUARTE, M. A. C. - Emissões de compostos carbonosos pela queima doméstica de biomassa. [S.l.]:
Universidade de Aveiro, 2011
[4] Vicente, E. A. D. - Medidas para mitigar as emissões da combustão doméstica de biomassa. [S.l.]:
Universidade de Aveiro, 2013
[5] FERNANDES, A. P. et al. - Emission factors from residential combustion appliances burning Portuguese
biomass fuels. Journal of environmental monitoring: JEM. 13:11 (2011) 3196–206. doi:
10.1039/c1em10500k.
[6] SCHMIDL, C. et al. - Particulate and gaseous emissions from manually and automatically fired small
scale combustion systems. Atmospheric Environment. ISSN 13522310. 45:39 (2011) 7443–7454. doi:
10.1016/j.atmosenv.2011.05.006.
Ref Fuel average std. average std. average std. average std. average std. average std.
Maritime pine 1735 132 51.10 6.89 6.90 3.60 2.90 1.30 0.62 0.49
Golden wattle 1697 69 61.80 3.79 7.80 6.20 3.50 3.10 0.34 0.26
Holm oak 1675 147 61.80 8.17 13.00 8.30 7.20 4.00 0.30 0.11
Eucalypt 1585 73 78.90 7.35 12.00 7.60 5.10 3.90 0.36 0.36
Olive 1743 193 81.00 8.02 21.00 10.00 9.10 5.70 0.39 0.16
Cork oak 1662 307 85.50 21.90 18.00 10.00 10.00 5.20 0.68 0.40
Portuguese oak 1641 41 78.50 17.60 14.00 9.70 6.10 3.40 0.32 0.20
Briquettes/Pellets 1691 55 58.30 16.90 12.00 7.70 5.90 4.20 0.29 0.25
European beech 1749 92 74.39 6.70 5.77 1.26 3.90 0.92 0.43 0.23
Pyrenean oak 1618 83 86.05 14.08 12.50 4.08 9.02 3.03 0.60 0.09
Black poplar 1765 179 115.78 11.73 14.01 5.09 10.51 3.37 0.79 0.19
Maritime pine 60.00 9.00 13.36 4.37 7.99 2.78 1.51 0.77
Eucalypt 84.00 2.90 20.23 2.85 11.66 1.67 0.39 0.04
Cork oak 87.00 10.20 13.78 2.85 8.33 1.91 0.60 0.15
Maritime pine 1670 251 57.10 19.00 5.20 4.30 2.50 2.50 0.61 0.43
Golden wattle 1584 413 96.50 24.00 7.90 4.30 4.10 2.65 0.29 0.18
Holm oak 1632 315 63.70 18.60 5.80 3.90 3.00 2.10 0.23 0.10
Eucalypt 1548 259 67.60 14.30 10.00 6.70 5.20 4.00 0.37 0.30
Olive 1725 320 64.90 15.70 8.70 4.50 4.60 2.20 0.46 0.24
Cork oak 1604 414 99.20 30.80 8.30 6.10 4.80 3.40 0.42 0.33
Portuguese oak 1573 200 85.90 12.80 13.00 8.30 6.20 4.60 0.32 0.15
Briquettes/Pellets 1636 261 62.90 15.80 7.10 4.80 3.70 3.00 0.18 0.12
European beech 1748 59 54.88 3.88 2.77 0.73 1.60 0.50 0.43 0.13
Pyrenean oak 1415 136 95.59 7.76 13.34 3.77 9.14 2.68 0.90 0.20
Black poplar 1879 29 84.07 4.85 4.38 1.40 2.86 1.10 0.88 0.05
Maritime pine 38.00 0.80 4.74 2.36 1.98 0.59 1.66 1.12
Eucalypt 47.00 4.20 7.61 2.46 4.15 1.35 0.60 0.22
Cork oak 54.00 9.40 5.56 2.87 2.97 1.83 0.50 0.03
Maritime pine 1623 30 65.81 12.45 6.50 1.59 3.06 2.08 1.88 0.71
European beech 1634 144 47.53 8.76 6.26 0.06 2.64 0.12 1.24 0.22
ECCO2 CO PM2.5 PM10 OC
EF [g.kg-1]
[4]
Woodstove
Fireplace
[1]
[2]
[3]
[1]
[2]
[3]

Report 9: Emission factors for biomass burning
AIRUSE LIFE 11 ENV/ES/584 23 / 26
Calorific value = 18.5 MJ kg-1
References:
[1]
GONÇALVES, C.; ALVES, C.; PIO, C. - Inventory of fine particulate organic compound
emissions from residential wood combustion in Portugal. Atmospheric Environment.
50:2012) 297–306. doi: 10.1016/j.atmosenv.2011.12.013.
[2] MARTINS, V. I. F. - Emissões de carbono particulado durante a queima doméstica de
biomassa. [S.l.]: Universidade de Aveiro, 2012
[3] DUARTE, M. A. C. - Emissões de compostos carbonosos pela queima doméstica de
biomassa. [S.l.]: Universidade de Aveiro, 2011
[4] Vicente, E. A. D. - Medidas para mitigar as emissões da combustão doméstica de biomassa.
[S.l.]: Universidade de Aveiro, 2013
[5]
FERNANDES, A. P. et al. - Emission factors from residential combustion appliances burning
Portuguese biomass fuels. Journal of environmental monitoring: JEM. 13:11 (2011) 3196–
206. doi: 10.1039/c1em10500k.
[6]
SCHMIDL, C. et al. - Particulate and gaseous emissions from manually and automatically
fired small scale combustion systems. Atmospheric Environment. ISSN 13522310. 45:39
(2011) 7443–7454. doi: 10.1016/j.atmosenv.2011.05.006.
Ref Fuel average std. average std. average std. average std. average std. average std.
Maritime pine 93784 7135 2762.16 372.43 372.97 194.59 156.76 70.27 33.51 26.49
Golden wattle 91730 3714 3340.54 204.86 421.62 335.14 189.19 167.57 18.38 14.05
Holm oak 90541 7946 3340.54 441.62 702.70 448.65 389.19 216.22 16.22 5.95
Eucalypt 85676 3930 4264.86 397.30 648.65 410.81 275.68 210.81 19.46 19.46
Olive 94216 10432 4378.38 433.51 1135.14 540.54 491.89 308.11 21.08 8.65
Cork oak 89838 16595 4621.62 1183.78 972.97 540.54 540.54 281.08 36.76 21.62
Portuguese oak 88703 2200 4243.24 951.35 756.76 524.32 329.73 183.78 17.30 10.81
Briquettes/Pellets 91405 2946 3151.35 913.51 648.65 416.22 318.92 227.03 15.68 13.51
European beech 94545 4966 4021.15 361.96 311.89 68.11 210.81 49.73 23.24 12.43
Pyrenean oak 87466 4482 4651.18 761.31 675.68 220.54 487.57 163.78 32.43 4.86
Black poplar 95406 9667 6258.36 634.20 757.30 275.14 568.11 182.16 42.70 10.27
Maritime pine 3243.24 486.49 0.00 0.00 722.42 235.96 431.88 150.08 81.86 41.46
Eucalypt 4540.54 156.76 0.00 0.00 1093.70 154.10 630.05 90.17 20.88 2.12
Cork oak 4702.70 551.35 0.00 0.00 744.86 154.13 450.14 103.50 32.45 8.17
Maritime pine 90270 13568 3086.49 1027.03 281.08 232.43 135.14 135.14 32.97 23.24
Golden wattle 85622 22324 5216.22 1297.30 427.03 232.43 221.62 143.24 15.68 9.73
Holm oak 88216 17027 3443.24 1005.41 313.51 210.81 162.16 113.51 12.43 5.41
Eucalypt 83676 14000 3654.05 772.97 540.54 362.16 281.08 216.22 20.00 16.22
Olive 93243 17297 3508.11 848.65 470.27 243.24 248.65 118.92 24.86 12.97
Cork oak 86703 22378 5362.16 1664.86 448.65 329.73 259.46 183.78 22.70 17.84
Portuguese oak 85027 10811 4643.24 691.89 702.70 448.65 335.14 248.65 17.30 8.11
Briquettes/Pellets 88432 14108 3400.00 854.05 383.78 259.46 200.00 162.16 9.73 6.49
European beech 94484 3176 2966.25 209.70 149.73 39.46 86.49 27.03 23.24 7.03
Pyrenean oak 76477 7369 5166.89 419.34 721.08 203.78 494.05 144.86 48.65 10.81
Black poplar 101586 1544 4544.21 262.23 236.76 75.68 154.59 59.46 47.57 2.70
Maritime pine 2054.05 43.24 256.09 127.43 107.00 32.15 89.80 60.59
Eucalypt 2540.54 227.03 411.50 132.78 224.35 73.05 32.28 11.85
Cork oak 2918.92 508.11 300.73 155.00 160.53 99.00 26.80 1.55
Maritime pine 87756 1639 3557.38 672.80 351.19 85.80 165.18 112.34 101.61 38.35
European beech 88298 7781 2569.00 473.58 338.19 3.33 142.95 6.30 67.29 11.90
EF [mg.MJ-1]
CO2 CO PM2.5 PM10 OC EC
Fireplace
[1]
[2]
[3]
Woodstove
[1]
[2]
[3]
[4]

Report 9: Emission factors for biomass burning
AIRUSE LIFE 11 ENV/ES/584 24 / 26
2) Emission factors from a modern certified woodstove
References:
[5]
FERNANDES, A. P. et al. - Emission factors from residential combustion appliances
burning Portuguese biomass fuels. Journal of environmental monitoring: JEM. 13:11
(2011) 3196–206. doi: 10.1039/c1em10500k.
[6]
SCHMIDL, C. et al. - Particulate and gaseous emissions from manually and automatically
fired small scale combustion systems. Atmospheric Environment. ISSN 13522310. 45:39
(2011) 7443–7454. doi: 10.1016/j.atmosenv.2011.05.006.
Fuel average std. average std. average std. average std. average std.
Maritime pine 1640 10 27.49 2.68 1.12 0.25 0.29 0.12 0.44 0.24
Golden wattle 1660 71 46.36 2.23 1.22 0.19 0.24 0.10 0.29 0.10
Eucalyptus 1580 9 40.48 8.97 2.07 0.85 0.66 0.31 0.27 0.19
Cork oak 1638 10 64.56 6.41 2.89 0.90 1.24 0.25 0.33 0.18
CO
Eco-labelled
woodstove
PM10
[5]
OC EC
EF [g kg-1]
CO2
Fuel average std. average std. average std. average std. average std.
Maritime pine 88649 525 1485.95 144.86 60.54 13.51 15.68 6.49 23.78 12.97
Golden wattle 89730 3819 2505.95 120.54 65.95 10.27 12.97 5.41 15.68 5.41
Eucalyptus 85405 461 2188.11 484.86 111.89 45.95 35.68 16.76 14.59 10.27
Cork oak 88541 525 3489.73 346.49 156.22 48.65 67.03 13.51 17.84 9.73
Eco-labelled
woodstove
EF [mg MJ-1]
COCO2 PM10 OC EC
[5]
EF [mg MJ-1]
Fuel average std. average std. average std. average std. average std. average std. average std.
Briquettes 939.33 72.77 37.60 33.10 27.36 24.09
Beech 1680.96 89.28 37.00 35.60 33.04 31.79
Oak 1813.66 71.86 29.80 22.20 21.41 15.95
Spruce 1339.82 79.55 32.90 28.30 26.17 22.51
EF [mg MJ-1]
CO2 CO PM10
Eco-labelled
woodstove[6]
OC EC
%PM10
OC EC

Report 9: Emission factors for biomass burning
AIRUSE LIFE 11 ENV/ES/584 25 / 26
3) Emission factors from a pellet stove
All emission factors are in dry basis. Pellets of type I are the only certified.
OC/EC
PM10
Fuel average std. average std. average std. average std. average std.
Pellet - type I 1433 270.30 13.55 2.29 0.49 0.06 0.14 0.03 0.03 0.01 4.19
Pellet - type II 1577 102.33 2.63 1.04 1.51 0.24 0.25 0.15 0.24 0.15 1.03
Pellet - type III 1705 323.82 5.22 0.84 1.77 0.15 0.15 0.02 0.17 0.05 0.87
Pellet - type IV 1628 98.54 1.62 0.34 1.35 0.17 0.27 0.11 0.16 0.04 1.71
Olive Pit 1360 193.02 27.38 2.31 3.12 0.44 0.90 0.57 0.10 0.06 9.40
Shell of Pine Nuts 1594 466.50 13.69 5.68 2.19 0.63 0.35 0.06 1.02 0.44 0.34
Almond Shell 1768 117.63 16.91 4.12 2.07 0.07 0.22 0.06 0.13 0.02 1.73
EF [g.kg-1]
CO2 CO PM10 OC EC
EF [mg.kg-1]
EF [mg MJ-1] EF [μg MJ-1]
HHV (db) HHV (db)
Fuel MJ/kg kJ/kg average std. average std. average std. average std. average std.
Pellet - type I 19.85 19845 72206 13620 683 115 24.55 2.90 6.82 1.72 3.61 1.71
Pellet - type II 18.92 18916 83381 5410 139 55 79.90 12.54 13.24 7.83 36.77 11.58
Pellet - type III 18.85 18853 90419 17176 277 45 94.05 7.96 7.73 1.11 7.67 2.89
Pellet - type IV 19.26 19255 84545 5118 84 18 69.91 8.68 14.05 5.81 20.46 12.06
Olive Pit 19.99 19988 68020 9657 1370 116 156.07 21.81 45.07 28.64 8.85 5.21
Shell of Pine Nuts 20.18 20185 78949 23112 678 282 108.28 31.37 17.29 2.89 38.13 9.68
Almond Shell 19.92 19917 88788 5906 849 207 103.82 3.74 11.18 2.77 8.80 0.54
PM10 OC ECCO2 CO
Report 9: Emission factors for biomass burning
AIRUSE LIFE 11 ENV/ES/584 26 / 26
4) Emission factors from a fluidised bed reactor
(a) Only concentration was reported (±14 %, dry basis)
(b) No information
(c) Before cyclone
(d) After cyclone
A.I. Calvo, L.A.C. Tarelho, E.R. Teixeira, C. Alves, T. Nunes, M. Duarte, E. Coz, D. Custodio, A. Castro, B.
Artiñano, R. Fraile. Particulate emissions from the co-combustion of forest biomass and sewage sludge in a
bubbling fluidised bed reactor. Fuel Processing Technology 114 (2013) 58-68.
http://dx.doi.org/10.1016/j.fuproc.2013.03.021
Fuel average std. average std. average std. average std. average std.
(a) (b) 4.00 (c) 0.20
3.70 (d) 0.50
Eucalypt, 4.4 kg/h 1655 37.01 17.77 4.38 0.80 0.51 0.35 0.18
Eucalypt, 4.1 kg/h 1657 31.43 45.51 3.88 0.96 0.21 0.53 0.22
Pine, 2.2 kg/h 1810 0.42 15.32 2.91 0.20 0.04 0.19 0.13
Pine, 3.2 kg/h 1746 5.22 22.01 2.31 4.00 2.70 2.56 1.26
Leachated eucalypt, 2.6 kg/h 1659 4.94 67.93 3.13 0.91 0.21 0.98 0.44
OC EC
Forest biomass residues from eucalyptus felling and sewage
sludge from the pulp and paper industry were used as fuel
EF [g.kg-1]
CO2 CO PM2.5