emission factor documentation for ap-42 pesticide ... · emission factor documentation for ap-42...
TRANSCRIPT
Emission Factor Documentation for AP-42Section 9.2.2
Pesticide Application
Final Report
For U.S. Environmental Protection AgencyOffice of Air Quality Planning and Standards
Emission Inventory Branch
EPA Contract No. 68-D2-0159Work Assignment No. I-08
MRI Project No. 4601-08
September 1994

Emission Factor Documentation for AP-42Section 9.2.2
Pesticide Application
Final Report
For U.S. Environmental Protection AgencyOffice of Air Quality Planning and Standards
Emission Inventory BranchResearch Triangle Park, NC 27711
Attn: Mr. Dallas Safriet (MD-14)Emission Factor and Methodology
EPA Contract No. 68-D2-0159Work Assignment No. I-08
MRI Project No. 4601-08
September 1994

iii
NOTICE
The information in this document has been funded wholly or in part by the UnitedStates Environmental Protection Agency under Contract No. 68-D2-0159 to MidwestResearch Institute. It has been subjected to the Agency's peer and administrativereview, and it has been approved for publication as an EPA document. Mention oftrade names or commercial products does not constitute endorsement orrecommendation for use.

iv

v
PREFACE
This report was prepared by Midwest Research Institute (MRI) for the Office ofAir Quality Planning and Standards (OAQPS), U.S. Environmental Protection Agency(EPA), under Contract No. 68-D2-0159, Assignment No. 005 and I-08. Mr. DallasSafriet was the EPA work assignment manager for this project.
Approved for:
MIDWEST RESEARCH INSTITUTE
Roy M. NeulichtProgram ManagerEnvironmental Engineering Department
Jeff ShularDirector, Environmental Engineering Department
September 29, 1994

vi

vii
CONTENTS
LIST OF FIGURES . . . . . . . . . . . . . . . . . . . . . . . . . . . . . . . . . . . . . . . . . . . . . . . . viiiLIST OF TABLES . . . . . . . . . . . . . . . . . . . . . . . . . . . . . . . . . . . . . . . . . . . . . . . . . viii
1. Introduction . . . . . . . . . . . . . . . . . . . . . . . . . . . . . . . . . . . . . . . . . . . . . . . . 1-1
2. Industry Description . . . . . . . . . . . . . . . . . . . . . . . . . . . . . . . . . . . . . . . . . . 2-12.1 Industry characterization . . . . . . . . . . . . . . . . . . . . . . . . . . . . . . 2-22.2 Pesticide formulations and application methods . . . . . . . . . . . . 2-22.3 Pesticide emissions . . . . . . . . . . . . . . . . . . . . . . . . . . . . . . . . . . 2-7
3. General Data Review and Analysis Procedures . . . . . . . . . . . . . . . . . . . . 3-13.1 Literature search and screening . . . . . . . . . . . . . . . . . . . . . . . . . 3-13.2 Data quality rating system . . . . . . . . . . . . . . . . . . . . . . . . . . . . . 3-23.3 Emission factor quality rating system . . . . . . . . . . . . . . . . . . . . . 3-33.4 Emission testing methods . . . . . . . . . . . . . . . . . . . . . . . . . . . . . 3-5
4. AP-42 Section Development . . . . . . . . . . . . . . . . . . . . . . . . . . . . . . . . . . . 4-14.1 Review of specific data sets . . . . . . . . . . . . . . . . . . . . . . . . . . . . 4-14.2 Development of candidate emission factors . . . . . . . . . . . . . . . 4-144.3 Algorithm development . . . . . . . . . . . . . . . . . . . . . . . . . . . . . . . 4-16
5. Proposed AP-42 Section 9.2.2 . . . . . . . . . . . . . . . . . . . . . . . . . . . . . . . . . . 5-1
APPENDIX A REFERENCE 1 . . . . . . . . . . . . . . . . . . . . . . . . . . . . . . . . . . . . A-1APPENDIX B REFERENCE 2 . . . . . . . . . . . . . . . . . . . . . . . . . . . . . . . . . . . . B-1APPENDIX C REFERENCE 3 . . . . . . . . . . . . . . . . . . . . . . . . . . . . . . . . . . . . C-1APPENDIX D REFERENCE 4 . . . . . . . . . . . . . . . . . . . . . . . . . . . . . . . . . . . . D-1APPENDIX E REFERENCE 5 . . . . . . . . . . . . . . . . . . . . . . . . . . . . . . . . . . . . E-1APPENDIX F REFERENCE 6 . . . . . . . . . . . . . . . . . . . . . . . . . . . . . . . . . . . . F-1APPENDIX G REFERENCE 7 . . . . . . . . . . . . . . . . . . . . . . . . . . . . . . . . . . . . G-1APPENDIX H REFERENCE 8 . . . . . . . . . . . . . . . . . . . . . . . . . . . . . . . . . . . . H-1APPENDIX I REFERENCE 9 . . . . . . . . . . . . . . . . . . . . . . . . . . . . . . . . . . . . . I-1APPENDIX J REFERENCE 10 . . . . . . . . . . . . . . . . . . . . . . . . . . . . . . . . . . . . J-1APPENDIX K REFERENCE 11 . . . . . . . . . . . . . . . . . . . . . . . . . . . . . . . . . . . K-1APPENDIX L REFERENCE 12 . . . . . . . . . . . . . . . . . . . . . . . . . . . . . . . . . . . . L-1APPENDIX M REFERENCE 13 . . . . . . . . . . . . . . . . . . . . . . . . . . . . . . . . . . . M-1APPENDIX N REFERENCE 14 . . . . . . . . . . . . . . . . . . . . . . . . . . . . . . . . . . . N-1APPENDIX O REFERENCE 15 . . . . . . . . . . . . . . . . . . . . . . . . . . . . . . . . . . . O-1
viii
LIST OF FIGURES
Number Page
2-1 Factors that influence pesticide volatilization . . . . . . . . . . . . . . . . . 2-93-1 Air sampling apparatus . . . . . . . . . . . . . . . . . . . . . . . . . . . . . . . . . . 3-7
LIST OF TABLES
Number Page
2-1 Top 10 herbicides used on major crops in the United States . . . . . 2-32-2 Top 10 insecticides used on major crops in the United States . . . . 2-34-1 Summary of field tests of pesticide volatilization . . . . . . . . . . . . . . . 4-34-2 Selected active ingredient vapor pressures . . . . . . . . . . . . . . . . . . 4-234-3 Emission factors for active ingredients as functions of
application method and vapor pressure . . . . . . . . . . . . . . . . . . . . . 4-264-4 Average VOC content of pesticide inert ingredient portion,
by formulation type . . . . . . . . . . . . . . . . . . . . . . . . . . . . . . . . . . . . . 4-284-5 Trade names for selected active ingredients . . . . . . . . . . . . . . . . . . 4-31

1-1
SECTION 1
INTRODUCTION
The document Compilation of Air Pollutant Emission Factors (AP-42) has been
published by the U.S. Environmental Protection Agency (EPA) since 1972. Supple-ments to AP-42 have been routinely issued to add new emission source categories andto update existing emission factors. The EPA also routinely updates AP-42 in responseto the needs of federal, state, and local air pollution control programs, and industry.
An emission factor relates the quantity (weight) of pollutants emitted to a unit ofsource activity. Emission factors reported in AP-42 are used to:
1. Estimate areawide emissions;2. Estimate emissions for a specific facility; and3. Evaluate emissions relative to ambient air quality.
This background report supports preparation of a new AP-42 Section 9.2.2,Pesticide Application.
This report contains five sections. Following this introduction, Section 2 gives adescription of the pesticide industry, including a brief characterization of the industry,formulations and application methods, and factors impacting pesticide emissions. Section 3 describes the literature search and criteria used to select and rate emissiondata and emission factors for use in AP-42 documents. Section 4 details emissionfactor development for pesticide application. Section 5 presents the proposed AP-42Section 9.2.2, Pesticide Application.

2-1
SECTION 2
INDUSTRY DESCRIPTION
Pesticides are substances or mixtures—either derived from natural products orchemically synthesized—that are used to control populations of certain kinds of plantand animal life. Four major categories of pesticide users are: (1) agricultural;(2) industrial, commercial, and institutional; (3) home and garden; and(4) governmental. This report focuses solely on agricultural use of pesticides; inaddition, it does not address the much smaller commercial use of selected pesticides infood product distribution.
Pesticide application is the process of applying or delivering various types ofpesticides to target pests to increase and improve food production, protect publichealth, decrease pest-related property damage and injury, and reduce nuisance pestpopulations. In agriculture, pesticides are used primarily to control nuisance weeds(herbicides), insects (insecticides), fungi (fungicides), nematodes (nematicides), androdents (rodenticides). Agricultural pesticides are used in the greatest quantities toprotect field and orchard crops, but they are also used extensively to protect livestock. Pesticide application is used both preventively, as preemergence application(application before the appearance of the pest), and reactively, as postemergenceapplication to reduce damage to infested crops and animals.
Pesticides are manufactured by firms under the Standard Industrial Classification(SIC) codes for pesticides and other organic agricultural chemicals (2869) andagricultural chemicals, NEC (2879). Pesticides are distributed by manufacturers, retailagricultural distributors, and farm service businesses (SIC 0711, 0721), such as farmercooperatives. The application of pesticides for disease and insect control isincorporated in SIC 0721.

2-2
2.1 INDUSTRY CHARACTERIZATION1
Agricultural pesticides are used throughout all regions of the United States withthe highest usage occurring in farm states. The five states with the highest pesticideusage by weight are:
1. Iowa2. Illinois3. Minnesota4. Texas5. California
Table 2-1 lists the top 10 herbicides in terms of usage in 1991 for the 10 major crops inthe United States, and Table 2-2 lists the top 10 insecticides in terms of usage in 1991for the same crops.
2.2 PESTICIDE FORMULATIONS AND APPLICATION METHODS2-6
Pesticide application methods vary according to the target pest and the crop orother value to be protected. In some cases the pesticide is preferably applied directlyto the pest; in others to the host plant; and in others to the soil or an enclosed air space. Akesson and Yates concluded that "as a general rule, the more thorough the coverageand uniform the distribution of materials on the target or the plant host the moreeffective is the control." In some cases, however, much of the pesticide applied can belost inefficiently to the soil or to the air. Since pesticide users desire cost-effective pestcontrol, pesticide manufacturers have attempted to develop formulations that deliveroptimal coverage to the target. Different formulations, including dry, liquid, and aerosol,are available to provide different coverages and distributions. Formulations generallycontain several components in addition to the "active ingredient" (AI) (i.e., the principalchemical having pesticidal activity). These components may include solvents,emulsifiers, diluents, stabilizers, wetting agents, thickeners, anticaking compounds, andothers, depending upon the specific product. These components are collectivelytermed inert ingredients. The AI content may vary from a percent or less of the totalformulation to 50 percent or more, depending on the intended application, and a

2-3
TABLE 2-1. TOP 10 HERBICIDES USED ON MAJOR CROPS IN THE UNITED STATESa
AI applied annuallyb
Herbicide Pounds Kilograms
1. Atrazine 57,309,000 25,995,000
2. Alachlor 51,155,000 23,204,000
3. Metolachlor 50,280,000 22,807,000
4. Cyanazine 24,958,000 11,321,000
5. Trifluralin 22,753,000 10,321,000
6. EPTC 15,547,000 7,052,000
7. Pendimethalin 12,817,000 5,814,000
8. Butylate 8,478,000 3,846,000
9. 2,4-D 7,918,000 3,592,000
10. Propanil 6,696,000 3,037,000
aSource: Reference 1.bAI = active ingredient.
TABLE 2-2. TOP 10 INSECTICIDES USED ON MAJOR CROPS IN THE UNITED STATESa
AI applied annuallyb
Insecticide Pounds Kilograms
1. Chlorpyrifos 8,024,000 3,640,000
2. Terbufos 6,130,000 2,781,000
3. Fonophos 3,011,000 1,366,000
4. Carbofuran 2,797,000 1,269,000
5. Phorate 2,735,000 1,241,000
6. Methyl parathion 2,643,000 1,199,000
7. Aldicarb 1,071,000 486,000
8. Acephate 609,000 276,000
9. Dicrotophos 440,000 200,000
10. Dicofol 423,000 192,000
aSource: Reference 1.bAI = active ingredient.

2-4
formulation can have more than one AI. In addition, applicators may field mix two ormore products immediately before use for specific needs and economy of application. The following sections discuss the three most common types of formulations.
2.2.1 Dry Formulations
Dry formulations can be obtained as dusts, granules, wettable and solublepowders, water dispersible granules, and baits. Dusts contain relatively small particlesand are subject to wind drift; they may also present a coverage problem if they do notremain on target plant surfaces. Granulars are of larger size (50 micrometers [Fm] to2,500 Fm in diameter) and are usually intended for soil application. They present lessof a drift problem than dusts. Wettable powders and water dispersible granulars bothform suspensions when mixed with water. Baits may be approximately the same sizeas granules or larger, but in the application of baits, the AI is mixed with something suchas bran or sawdust, which the target pest will eat.
2.2.2 Liquid Formulations
Solutions and emulsions are examples of liquid formulations. True solutions areformed when soluble liquid or solid AIs are dissolved in water or organic solvent forapplication. Emulsifiable concentrates are made up of the AI dissolved in an organicsolvent with an emulsifier that will allow the AI to be field-mixed with water to form asuspension. The emulsifiers prevent phase separation and settling until application. Aflowable formulation is a liquid mixture or powder suspension of an AI, that is nearlyinsoluble in either organic solvents or water, together with a petroleum base andemulsifiers. The emulsifiers keep the formulation from separating before use and alsoenable it to mix readily with water for application.
2.2.3 Aerosols
Aerosols are liquids with the active ingredient in solution with a solvent and apropellant. They are used for fog or mist applications. Optimum droplet size rangesare as follows: 10 to 50 Fm for flying insects; 30 to 50 Fm for foliage insects; 40 to100 Fm for foliage; and 250 to 500 Fm for soil to avoid drift.

2-5
2.2.4 Pesticide Application Equipment
Pesticides may be applied in a number of different formulations as liquids, drysolids, or gases. Liquid formulations are usually applied as a spray of an aqueoussolution or as oil droplets containing a solution or suspension of active ingredient. Pesticides formulated as dusts or granules are normally applied dry. Those activeingredients that exist in a gaseous state at ambient temperature may be applied by soilincorporation as gases or pressurized liquids. Some pesticides have a very high vaporpressure at ambient temperature; formulations of these pesticides are usuallyincorporated into the soil during application. Those pesticides that are gases or havevery high vapor pressure are used as fumigants. A fumigant is a substance or mixtureof substances which produce gas, vapor, fume, or smoke intended to destroy insects,bacteria, or rodents. The following sections provide a brief overview of the applicationmethods for liquids, dry solids, and gases or volatile liquids.
2.2.4.1 Liquid Application Equipment—Different application equipment is required depending on the characteristics of
the crop or area treated. A listing of common liquid application equipment and commonareas of usage is shown below.
! Low-pressure sprayers—Landscape, right-of-way, and agricultural;! Powered backpack sprayer—Aquatic, landscape, forest, right-of-way, and
agricultural;! Controlled droplet sprayer—Contact herbicides and insecticides;! High-pressure hydraulic sprayer—Landscape, dense foliage, large trees,
agricultural, and right-of-way;! Air blast sprayer—Trees, shrubs, and vines; ! Ultralow-volume sprayer—Agricultural and aquatic; and! Electrostatic sprayers—Row crops, trees, and vines.
Liquid application equipment ranges from small aerosol cans to air blast sprayerswith tank capacities up to 1,000 gallons which are capable of spraying up to 1,000gallons per acre. Of the application methods listed, the most common are the low-pressure sprayers, powered backpack sprayers, and the high-pressure hydraulicsprayers.

2-6
Low-pressure sprayers are the common boom-nozzle field and row cropsprayers used for low-growing agricultural row crops and tall crops like corn and cotton. Booms for both low and high crops can be mounted on the back of the tractor or trailerunit or between the front and rear wheels. Powered backpack sprayers are the portablesprayers commonly used for spot applications of pesticides. These units are seldomused for large scale applications. High-pressure hydraulic sprayers used to treat densefoliage, tall trees, or large surface areas are usually vehicle-mounted units. These unitsdischarge the pesticide using either compressed air or an electric motor to directlypropel the liquid.
2.2.4.2 Dry Application Equipment—There are basically two different types of dry pesticide formulations: dusts and
granules (including pellets). The large scale application of agricultural pesticides asdust formulations has declined considerably due to concerns for operator safety, lowapplication efficiency, and the high susceptibility of dusts to drift. Particles that doreach the target often do not adhere to the target surface. The application of granules ismuch more common than dusts because it does not suffer the disadvantages of thedusts.
The most common application methods for dusts are bulb applicators,compressed air dusters, mechanical dusters, and power dusters. Bulb applicators andcompressed air dusters are used to treat very small areas such as small cracks andcrevices, wall voids, and other confined areas. Mechanical dusters are used for treatinglandscapes and small agricultural areas. Power dusters are used to treat vine cropsand buildings.
Common application methods for granules or pellets are hand-operatedapplicators, mechanically driven applicators, and powered granule applicators. Handoperated units are used primarily to treat landscapes or aquatic areas; their use islimited for agricultural purposes. Mechanically driven applicators are used principallyfor the treatment of turf, landscape, and some agricultural areas. Powered applicatorsare used primarily for agricultural areas, usually row crops.

2-7
2.2.4.3 Soil Incorporation Equipment—Soil fumigants are generally applied to the soil by one of three methods:
(a) the liquid or condensed gas can by injected directly into the soil using soilincorporation equipment;
(b) a gas can be released above the soil surface but beneath a sealed plasticcover; and
(c) a solid fumigant can be applied to the soil and incorporated into the soil bycultivation.
Solid fumigants are compounds that react with water ( i.e., soil moisture) to forma gaseous product; the gaseous product is the actual fumigating compound, not theoriginal solid compound.
As with granule applications, soil conditions are most influential in determiningfumigant effectiveness. The soil must be neither too wet nor too dry when applying afumigant. Wet soils tend to trap the fumigant in the soil water, slowing down orpreventing fumigant movement through the soil. In soils that are too dry, the gas maydiffuse so rapidly that it is not retained long enough to be lethal to the target organism. Fumigation effectiveness is also improved by higher soil temperatures. Highertemperatures enhance vaporization and diffusion of the fumigant in the soil, decreasingthe concentration and time required for a lethal dose.
2.3 PESTICIDE EMISSIONS6
Constituents of pesticide products may be emitted to the atmosphere both duringapplication and for some months following application. Emissions can occur asparticulate matter, mists or droplets, and as vaporous substances. Particulates canconsist primarily of inorganic matter used to carry and dilute the active ingredient (AI),or they can contain significant amounts of AI adsorbed on the carrier dust. Mists ordroplets occur in spray applications of liquids. Vaporous substances can consist ofchemicals having high vapor pressures at ambient conditions that evaporate soon afterapplication or chemicals with lower vapor pressures that require some months toevaporate in significant amounts.

2-8
The term "volatile organic compounds" is used differently in differentpublications, and is abbreviated as both VOC and VOCs. 40 CFR Part 51 defines VOC
as organics that participate in atmospheric reactions, excluding certain compoundshaving negligible reaction. (Excluded compounds are C2H6, CH2Cl2, CH3CCl3, andsome chlorofluorocarbons and fluorocarbons.) Analytical chemists distinguish volatileorganic compounds (VOCs) from semivolatile organic compounds (SVOCs) on thebasis of their amenability to EPA-approved analytical methods; a VOC in that contextusually has a vapor pressure of about 0.1 mmHg (0.1 torr) at 25EC. Still others mayconsider all organics that are liquids at ambient temperature to be VOCs. For presentpurposes, substances in formulations other than AIs will be called inert ingredients. Depending on the formulation, some or all of the inert ingredients may be VOC; thesecompounds are used as solvents, diluents, emulsifiers, etc. Most pesticide AIs areorganic compounds, but few are very volatile (some fumigants are); most are eithersemivolatile organics or essentially nonvolatile under field conditions.
The following discussion focuses on the volatilization of ingredients in pesticideformulations applied to plants or soils because little information was found onvolatilization from other applications or on particulate emissions. Note that the termvolatilization is used in some literature sources to include spray drift losses duringapplication as well as true evaporation. In this document, spray drift is not included involatilization losses because very little information is known concerning lossmechanisms during drift. For this reason, aerial applications are not considered in thisAP-42 section.
Many references describe the processes that affect the volatilization(evaporation) of agricultural pesticides applied to soils or plants. Numerous laboratoryand field studies have been conducted in an effort to understand these processes. Figure 2-1 summarizes factors that influence volatilization, such as the nature of thepesticide itself, climatic factors, and soil characteristics. An alternative pathway forpesticide emissions is semivolatile pesticides being adsorbed to soil particles thatbecome airborne in the wind.

2-9
Figure 2-1. Factors that influence pesticide volatilization.

2-10
Brief summaries of the major factors impacting pesticide volatilization are givenbelow. In addition, two important volatilization mechanisms, diffusion and volatilizationfrom plant surfaces, are briefly discussed.
2.3.1 Nature of the Pesticide and Formulation
The molecular structure of a pesticide determines its physical properties, such asvapor pressure and solubility, and its chemical reactivity. The vapor pressure of mostpesticides is sufficiently low that they are considered to be semivolatile rather thanvolatile in chemical analysis. The rate of evaporation of a pesticide is determinedprimarily by its vapor pressure, which in turn is usually increased by temperature anddecreased by adsorption to the soil surface to which the pesticide is applied. The rateof evaporation can also be decreased if the pesticide dissolves in the oils or waxes ofvegetation.
The nature of the formulation also affects emissions during application. Dusts ofsmall particle size would likely give higher emissions of particulates (probablycontaining AI) than granulars, for example. Also, the several types of liquidformulations might yield still different emissions based on droplet sizes and applicatorcharacteristics. For some formulations, volatile organic inert ingredients may be themajor constituents volatilizing rather than the AI.
2.3.2 Meteorological Conditions7-9
Studies have shown that meteorological conditions can have a significant effecton the rate of pesticide volatilization from soil. This effect is observed especially in fieldtests when the amount of pesticide volatilizing from the soil surface changes accordingto the cycle of daytime and nighttime temperatures.
The extent of pesticide volatilization also depends in part on temperature. Apesticide is applied as a formulation of AIs and inert ingredients. Temperature will havea different effect on each component of the formulation, depending on its vaporpressure. An increase in temperature can increase or decrease volatilization,depending on its influence on other factors, such as diffusion of the pesticide towardsor away from the soil surface and mass flow in the water present in the soil. Usually anincrease in temperature enhances volatilization because the vapor pressure of thepesticide increases. If temperature increases enough, however, the soil surface will dry

2-11
out, which decreases soil water movement and mass transport of the pesticide to thesurface, and therefore volatilization.
Wind conditions also affect volatilization. A layer of stagnant air exists above anevaporating soil surface. An increased flow of air decreases the depth of the stagnantlayer, increases turbulent mixing of the air near the surface, and reduces theconcentration of volatilizing substance in the atmosphere, thereby increasing thevolatilization rate. Glotfelty described the dispersion process that gradually takes placeas the airstream above the stagnant layer comes in contact with, dilutes, and transportsthe pesticide from the soil surface.9 Researchers routinely use wind profiles incombination with measured pesticide concentrations to calculate vertical flux intensities.
2.3.3 Soil Characteristics9-13
Adsorption-desorption of a pesticide depends on its chemical makeup and, to agreat extent, on the characteristics of the soil. Increased amounts of organic matter orclay in soils decrease the volatilization rate of pesticides, probably because adsorptionis increased, and the water content of the soil influences the rate of vaporization of thepesticide present in the soil. When soil is very dry, the volatilization of the pesticide islowered significantly, while volatilization increases as the soil moisture contentincreases. (Note that in some cases the hydrolysis rate of a pesticide is greater in wetsoils so that overall all volatilization can be decreased.) As water evaporates from thesoil surface, pesticide present in the soil is transported to the surface in solution. Hartley refers to this as the "wick effect" because the soil acts as a wick for movementof the pesticide. The extent of this mass flow to the surface depends on the amount ofsolar radiation. Normally, at solar noon the movement is greatest, resulting inincreased pesticide volatilization. The extent of the wick effect would be expected tovary with the solubility of the pesticide in water.
When pesticides are well-incorporated into soil during application, this mass flowmechanism limits volatilization and results in a lower rate of volatilization than when thepesticide is surface-applied.

2-12
2.3.4 Diffusion9-11
As vaporization occurs from the surface, a pesticide concentration gradient formsbetween the depleted surface and the more concentrated subsurface. Pesticide in thesubsurface of the soil then diffuses upwards to the surface as pesticide at the surfacevolatilizes. Temperature, pesticide concentration, and soil composition influence therate of diffusion. An extensive discussion on diffusion is provided by Hamaker. Mathematical equations for diffusion have been developed by Mayer for predictingvolatilization of surface applied and soil-incorporated pesticides.
2.3.5 Volatilization from Plant Surfaces14
The rate of pesticide volatilization from plant surfaces depends on the manner inwhich the pesticide residue covers the plant structure. For example, highervolatilization losses occur from plant surfaces if the pesticide is present as droplets onthe plant. After these droplets evaporate, volatilization slows down because remainingresidues are left in the regions of the plant structure less exposed to air circulation orare adsorbed onto the plant material.
REFERENCES FOR SECTION 2
1. Agricultural Chemical Usage: 1991 Field Crops Summary, Economic ResearchService, National Agricultural Statistics Service, U.S. Department of Agriculture,Washington, DC, March 1992.
2. N. G. Akesson and W. E. Yates, Pesticide Application Equipment and Techniques,Food and Agricultural Organization of the United Nations, Rome, Italy, 1979.
3. L. E. Bode et al., ed., Pesticide Formulations and Applications Systems, Vol. 10,American Society of Testing and Materials, Philadelphia, PA, 1990.
4. T. S. Colvin and J. H. Turner, Applying Pesticides, 3rd ed., American Associationof Vocational Materials, Athens, GA, 1988.
5. G. A. Matthews, Pesticide Application Methods, Longham Groups Limited, NewYork, NY, 1979.
6. Alternative Control Technology Document: Control of VOC Emissions from theApplication of Agricultural Pesticides, EPA-453/R-92-011, Office of Air QualityPlanning and Standards, U.S. Environmental Protection Agency, ResearchTriangle Park, NC, March 1993.

2-13
7. D. J. Arnold, "Fate of Pesticides in Soil: Predictive and Practical Aspects,"Environmental Fate of Pesticides, D. H. Hutson and T. R. Roberts, eds., Wiley &Sons, New York, NY, 1990.
8. A. W. White et al., "Trifluralin Losses from a Soybean Field," Journal ofEnvironmental Quality, 6(1):105-110, 1977.
9. D. E. Glotfelty, "Pathways of Pesticide Dispersion in the Environment," inAgricultural Chemicals of the Future, BARC Symposium 8, J. L. Hilton, ed.,Rowman and Allanheld, Totowa, NJ, 1985.
10. J. W. Hamaker, "Diffusion and Volatilization," in Organic Chemicals in the SoilEnvironment, Goring and Hamaker, eds., Dekker, NY, 1972.
11. R. Mayer et al., "Models for Predicting Volatilization of Soil-IncorporatedPesticides," Proceedings of the Society of American Soil Scientists, 38:563-568,1974.
12. G. S. Hartley, "Evaporation of Pesticides," in Pesticidal Formulations Research,Advances in Chemical Series 86, R. F. Gould, ed., American Chemical Society,Washington, DC, 1969.
13. A. W. Taylor et al., "Volatilization of Dieldrin and Heptachlor from a Maize Field,"Journal of Agricultural and Food Chemistry, 24(3):625-631, 1976.
14. A. W. Taylor, "Post-Application Volatilization of Pesticides under Field Conditions,"Journal of Air Pollution Control Association, 28(9):922-927, 1978.

3-1
SECTION 3
GENERAL DATA REVIEW AND ANALYSIS PROCEDURES
This section describes the literature search to collect emissions data and theEPA quality rating systems applied to data and to any emissions factors developed fromthose data.
3.1 LITERATURE SEARCH AND SCREENING1
A literature search was performed to collect pertinent emissions data foroperations associated with agricultural pesticide application. The majority of emissiondata reports were found in journals such as the Journal of Agricultural Food Chemistry,
Journal of Environmental Quality, Pesticide Monitor, and Residue Reviews. Information
on pesticide application techniques was found in standard pesticide applicationhandbooks and manuals. A comprehensive list of these references is found in thereferences for Sections 2 and 4 of this report.
During the review of each document, the following criteria were used todetermine the acceptability of reference documents for emission factor development:
1. The report must be a primary reference:
a. Source testing must be from a referenced study that does not reiterateinformation from previous studies.
b. The document must constitute the original source of test data.
2. The referenced study must generally contain test results based on more thanone test run or that are collected over a relatively long time frame.

3-2
3. The report must contain sufficient data to evaluate the testing proceduresand source operating conditions.
3.2 DATA QUALITY RATING SYSTEM1
Based on Office of Air Quality Planning and Standards (OAQPS) guidelines, thefollowing data are always excluded from consideration in developing AP-42 emissionfactors:
1. Test series averages reported in units that cannot be converted to theselected reporting units;
2. Test series representing incompatible test methods; and
3. Test series in which the production and control processes are not clearlyidentified and described.
If there is no reason to exclude a particular data set, data are assigned a qualityrating based on an A to D scale specified by OAQPS as follows:
A—This rating requires that multiple tests be performed on the same sourceusing sound methodology and reported in enough detail for adequate validation. Testsdo not necessarily have to conform to the methodology specified by EPA reference testmethods, although such methods are used as guides.
B—This rating is given to tests performed by a generally sound methodology butlacking enough detail for adequate validation.
C—This rating is given to tests that are based on an untested or newmethodology or that lack a significant amount of background data.
D—This rating is given to tests that are based on a generally unacceptablemethod but may provide an order-of-magnitude value for the source.

3-3
The following are the OAQPS criteria used to evaluate source test reports forsound methodology and adequate detail:
1. Source operation. The manner in which the source was operated should bewell documented in the report, and the source should be operating withintypical parameters during the test.
2. Sampling procedures. The sampling procedures should conform to agenerally accepted methodology. If actual procedures deviate from acceptedmethods, the deviations must be well documented. When this occurs, anevaluation should be made of how such alternative procedures couldinfluence the test results.
3. Sampling and process data. Adequate sampling and process data should bedocumented in the report. Many variations can occur without warning duringtesting and sometimes without being noticed. Such variations can inducewide deviations in sampling results. If a large spread between test resultscannot be explained by information contained in the test report, the data aresuspect and are given a lower rating.
4. Analysis and calculations. The test reports should contain original raw datasheets. The nomenclature and equations used are compared to thosespecified by EPA (if any) to establish equivalency. The depth of review of thecalculations is dictated by the reviewer's confidence in the ability andconscientiousness of the tester, which in turn is based on factors such asconsistency of results and completeness of other areas of the test report.
3.3 EMISSION FACTOR QUALITY RATING SYSTEM1
EPA guidelines specify that the quality of the emission factors developed fromanalysis of the test data be rated utilizing the following general criteria:
A—Excellent: The emission factor was developed only from A-rated test datataken from many randomly chosen facilities in the industry population. The source
* Source category: A category in the emission factor table for which an emissionfactor has been calculated.
3-4
category* was specific enough to minimize variability within the source categorypopulation.
B—Above average: The emission factor was developed only from A-rated testdata from a reasonable number of facilities. Although no specific bias was evident, itwas not clear if the facilities tested represented a random sample of the industries. Asin the A-rating, the source category was specific enough to minimize variability withinthe source category population.
C—Average: The emission factor was developed only from A- and B-rated testdata from a reasonable number of facilities. Although no specific bias was evident, itwas not clear if the facilities tested represented a random sample of the industry. As inthe A-rating, the source category was specific enough to minimize variability within thesource category population.
D—Below average: The emission factor was developed only from A- andB-rated test data from a small number of facilities, and there was reason to suspect thatthese facilities did not represent a random sample of the industry. There also may beevidence of variability within the source category population. Limitations on the use ofthe emission factor are footnoted in the emission factor table.
E—Poor: The emission factor was developed from C- and D-rated test data, andthere was reason to suspect that the facilities tested did not represent a random sampleof the industry. There also may be evidence of variability within the source categorypopulation. Limitations on the use of these factors are footnoted.
As part of the analysis of the emission data, the quantity and quality of theinformation contained in the final set of documents used for emission factor estimationin Section 4 were evaluated. Three types of references were reviewed: field studyreports, theoretical discussions on volatilization, and emission-estimating algorithmpresentations.
The theoretical discussions on volatilization were not rated because they did notdiscuss a particular source test, but instead provided important background information.

3-5
The use of the above criteria is somewhat subjective depending to a large extenton the individual reviewer. Details of how each candidate emission factor was rated areprovided in Section 4.
3.4 EMISSION TESTING METHODS2-5
Pesticide volatilization has been measured successfully in both the laboratoryand the field. In a laboratory setting, the experimental conditions used duringmeasurement can be more closely controlled and monitored than in the field. Much ofthe current understanding of the process of volatilization is credited to early laboratorystudies by Hartley.
The field testing that began in the late sixties and early seventies attempted toprovide a more realistic picture of the complex process of pesticide volatilization. Changing meteorological conditions and pesticide application losses are examples ofthe factors that complicate the measurement process in the field.
The objective in typical field tests is to apply one or more pesticide formulationsto a test plot of tilled or vegetated soil and collect air, soil, and sometimes crop samplesnear the surface over a measured period of time. These samples are analyzed foractive ingredient (AI) residues and, in some instances, for biodegradation products ofthe AI.
The characteristics of the test plots used vary according to the objective of theresearch. Sometimes the plots are sprayed with water or even flooded to determine theeffects of water on movement of the pesticide in the soil. Several experimentsperformed in the past were designed to determine if different soil types affected the rateof volatilization.
Two of the major factors in any of the field testing studies conducted todetermine pesticide volatilization are the existing meteorological conditions and the airsampling and analysis methods. Each of these factors is discussed in the followingparagraphs.
3-6
3.4.1 Meteorological Conditions
The meteorological conditions monitored during field testing are important in theinterpretation of data obtained for residue measurement. Factors such as temperature,rainfall, humidity, wind speeds, and water evaporation play a major role in the extent ofpesticide volatilization.
Pesticide volatilization is influenced greatly by the turbulent flow of theatmosphere above the soil or vegetation surface. Pesticide vertical flux densitiesreported in grams per hectare per day or grams per hectare per hour are calculatedusing pesticide air concentrations and meteorological conditions such as wind speeds.
3.4.2 Air Sample Collection6
Air sampling studies are typically performed at a number of heights above theground or crop canopy. A sampling station is constructed with sample collectiondevices at each of the desired heights as in Figure 3-1. Typically, several samplingstations are positioned in the test plot, usually in the center and on the downwind edge. Pesticide samples are taken by drawing air through impingers containing a solvent suchas ethylene glycol or hexylene glycol at sampling rates ranging from 1 to 25 liters perminute (L/min). The impingers are changed frequently (once every 2 to 4 hr) during thefirst several days of a field test. The frequency of sampling is normally decreased overtime as the amount of pesticide remaining on the treated plot decreases.
Many of the field tests used porous polyurethane foam plugs for air samplecollection. The sampling equipment used for this method is similar to those describedabove, but the organic compounds are collected onto the plugs rather than absorbedinto liquid. The advantage of this method over the impinger method is that highervolumes of air can be sampled without the risk of pesticide breakthrough.

Figure 3.1 Air Sam
pling Aparatus

3-8
3.4.3 Air Sample Extraction and Analysis Methods
Impingers—Air samples collected in a solvent using impingers are normallyextracted with hexane. The hexane extract is reduced in volume, and sometimes aFlorisil chromatography column cleanup is performed. Recoveries of pesticides arereported to be greater than 90 percent using this extraction method. The final extract istypically analyzed using gas chromatography (GC) with an electron capture detector orother appropriate detector.
Polyurethane foam plugs—Air samples collected using polyurethane foam plugsare Soxhlet-extracted using hexane. After the volume of the extract is reduced, thesample is analyzed using GC with an electron capture detector. Recoveries using thistechnique are also reported to be greater than 90 percent.
REFERENCES FOR SECTION 3
1. Technical Procedures for Developing AP-42 Emission Factors and Preparing AP-42Sections (Draft), Office of Air Quality Planning and Standards, U.S. EnvironmentalProtection Agency, Research Triangle Park, NC, March 6, 1992.
2. G. S. Hartley, "Evaporation of Pesticides," in Pesticidal Formulations Research,Advances in Chemistry Series 86, R. F. Gould, ed., American Chemical Society,Washington, DC, 1969.
3. G. H. Willis et al., "Volatilization of Dieldrin from Fallow Soil as Affected by DifferentSoil Water Regimes," Journal of Environmental Quality, 1(2):193-196, 1972.
4. D. E. Glotfelty et al., "Volatilization of Surface-Applied Pesticides from Fallow Soil,"Journal of Agricultural and Food Chemistry, 32:638-643, 1984.
5. R. Grover et al., "Evaluation of Polyurethane Foam as a Trapping Medium forHerbicide Vapor in Air Monitoring and Worker Inhalation Studies," Journal ofEnvironmental Science and Health, B16(1):59-66, 1981.

* See Section 2.3.
4-1
SECTION 4
AP-42 SECTION DEVELOPMENT
This section describes the literature surveyed, test data evaluated, and methodconsidered for estimating emissions associated with applying agricultural pesticides tocrops. An algorithm and its use are then described. The results serve as the basis fora new addition to Chapter 9 of AP-42: Section 9.2.2, Pesticide Application.
The discussion focuses on emissions of volatile organic substances, includingthe organic active ingredients (AI) and inert volatile organic compounds.* (Inert VOCs include a range of solvents, diluents, emulsifiers, etc., used in pesticide formulations.) This discussion does not address particulate emissions during or following applicationof pesticide formulations. Insufficient data were found on these topics to developemission factors.
The emission factor algorithm development reflects current insights on pesticideapplication practices and volatilization processes as obtained from industry, literature,application handbooks, and research articles. Information on emissions was developedprimarily from mathematical pesticide volatilization models in the literature.
4.1 REVIEW OF SPECIFIC DATA SETS
A search was conducted for published data pertaining to emissions due toapplication of agricultural pesticides. From this search, 16 references were found tocontain sufficient documentation to be of value for developing the section on pesticideapplication. Fifteen of these references described field tests performed between 1964and 1990 that contained data on losses within 30 days after application. Thevolatilization estimates reported in these references were based on either fluxmeasurements or residue measurements taken in the field. Table 4-1

4-2
TABLE 4-1. SUMMARY OF FIELD TESTS OF PESTICIDE VOLATILIZATION
Active ingredient
Vaporpressure(mmHg)a
Formulationtype
Applicationmethod
Soiltype Loss/timeb
ReportDate Reference
2,4-D 8 x 10!6 Aq. soln. Surface spray Notstated
1%-8%; applica-tion
1978 2
2,4-D (butyl ester) — Aq. soln. Surface spray Notstated
30%-40%; 2 hr 1978 2
2,4-D (octyl ester) — Aq. soln. Surface spray Notstated
10%-15%; 2 hr 1978 2
2,4-D (isooctyl ester) — Aq. soln. Surface spray Clay/silt 21%; 5 days 1985 11
Chlordane 1 x 10!5 Aq. emul. Surface spray Drysandyloam
2%; 2 days 1984 7
Chlordane 1 x 10!5 Aq. emul. Surface spray Moist siltloam
50%; 2.5 days 1984 7
DCPA (Dacthal) 2.5 x 10!6 Wet powder Surface spray Moist siltloam
2%; 1.5 days 1984 7
DCPA (Dacthal) 2.5 x 10!6 Wet powder Surface spray Yolo 10%; 21 days 1990 14
DDT 1.5 x 10!7 Aq. emul. Surface spray Notstated
72%; applica-tion 1983 3
Dieldrin 9.9 x 10!6 Aq. emul. Surface spray Sandyloam
89%; 30 days 1977 1
Dieldrin 9.9 x 10!6 Aq. emul. Surface spray Silt loam 43%; 2 days 1976 6
Dieldrin 9.9 x 10!6 Aq. emul. Surface spray Sandyloam
12%; 12 hrc 1977 1
Dimethoate 2.5 x 10!5 Aq. emul. Surface spray Sandyloam
94%; 14 days 1964 5
Dyfonate 2.1 x 10!4 Aq. emul. Surface spray Silt loam 13%; applica-tion 1971 4
EPTC 3.4 x 10!2 Aq. soln. Surface spray Wetsandyloam
69%; 24 hr 1965 9

4-3
TABLE 4-1. (continued)
Active ingredient
Vaporpressure(mmHg)a
Formulationtype
Applicationmethod
Soiltype Loss/timeb
ReportDate Reference
EPTC 3.4 x 10!2 Aq. soln. Surface spray Wetsandyloam
44%; 15 min 1965 9
EPTC 3.4 x 10!2 Aq. soln. Surface spray Moistsandyloam
49%; 24 hr 1965 9
EPTC 3.4 x 10!2 Aq. soln. Surface irrig. Clayloam
74%; 2.25 days 1980 8
EPTC 3.4 x 10!2 Aq. soln. Surface spray Moistsandyloam
27%; 15 min 1965 9
EPTC 3.4 x 10!2 Aq. soln. Surface spray Wetloam/sand
90%; 6 days 1965 9
EPTC 3.4 x 10!2 Aq. soln. Surface spray Moistloam/sand
68%; 6 days 1965 9
EPTC 3.4 x 10!2 Aq. soln. Surface spray Dryloam/sand
44%; 6 days 1965 9
EPTC 3.4 x 10!2 Aq. soln. Surface spray Clayloam
55%; 24 hr 1980 8
EPTC 3.4 x 10!2 Aq. soln. Surface spray Drysandyloam
23%; 24 hr 1965 9
EPTC 3.4 x 10!2 Aq. soln. Surface spray Drysandyloam
20%; 15 min 1965 9
Heptachlor 3 x 10!4 Aq. emul. Surface spray Sandyloam
45%; 12 hrc 1977 1

4-4
TABLE 4-1. (continued)
Active ingredient
Vaporpressure(mmHg)a
Formulationtype
Applicationmethod
Soiltype Loss/timeb
ReportDate Reference
Heptachlor 3 x 10!4 Aq. emul. Surface spray Silt loam 43%; 2 days 1976 6
Heptachlor 3 x 10!4 Aq. emul. Surface spray Moist siltloam
90%; 6 days 1984 7
Heptachlor 3 x 10!4 Aq. emul. Surface spray Sandyloam
96%; 30 days 1977 1
Heptachlor 3 x 10!4 Aq. emul. Surface spray Drysandyloam
14%-40%; 2 days 1984 7
Heptachlor 3 x 10!4 Aq. emul. Surface spray Moist siltloam
50%; 6 hr 1984 7
Lindane 3.3 x 10!5 Aq. emul. Surface spray Moist siltloam
90%; 6 days 1984 7
Lindane 3.3 x 10!5 Aq. emul. Surface spray Drysandyloam
12%; 2 days 1984 7
Lindane 3.3 x 10!5 Aq. emul. Surface spray Moist siltloam
50%; 6 hr 1984 7
Methoxychlor — Aq. emul. Aerial Notstated
47%; applica-tiond,e
1970 10
Toxaphene 4 x 10!6 Aq. emul. Aerial Notstated
26%; 5 days 1980 12
Toxaphene 4 x 10!6 Dust Aerial Notstated
86%; applica-tiond
1970 10
Toxaphene 4 x 10!6 Aq. emul. Aerial Notstated
52%; applica-tiond
1970 10
Toxaphene 4 x 10!6 Aq. emul. Surface spray Notstated
54%; applica-tion 1983 3
Toxaphene 4 x 10!6 Aq. soln. Surface spray Notstated
17%; applica-tion 1983 3

4-5
TABLE 4-1. (continued)
Active ingredient
Vaporpressure(mmHg)a
Formulationtype
Applicationmethod
Soiltype Loss/timeb
ReportDate Reference
Triallate 1.1 x 10!4 Aq. emul. Surface spray Clay 70%-100%;5 days
1993 13
Trifluralin 1.1 x 10!4 Aq. emul. 2.5 cm soilincorp.
Cecil soil 3.5%; applica-tion
1979 15
Trifluralin 1.1 x 10⁻⁴ Aq. emul. 2.5 cm soilincorp.
Cecil soil 20%; 35 days 1977 15
Trifluralin 1.1 x 10!4 Aq. emul. Surface spray Clay 61%-79%; 5 days 1993 13
Trifluralin 1.1 x 10!4 Aq. emul. Surface spray Moist siltloam
50%; 5 hr 1984 7
Trifluralin 1.1 x 10!4 Aq. emul. Surface spray Moist siltloam
90%; 7 days 1984 7
Trifluralin 1.1 x 10!4 Aq. emul. Surface spray Drysandyloam
2%-25%; 2 days 1984 7
Zinophos 3 x 10!3 Aq. emul. Surface spray Silt loam 40%; applica-tion 1971 4
aReference 17.bLosses were believed to be primarily by volatilization of AI, but experimental conditions and parameters measured varied substantiallybetween investigators. Some of the tests do not appear to have distinguished between true evaporation and drift, particulate windreentrainment, or rain losses. Studies without data collected within 30 days after application were excluded.
cIncludes losses upon application.dIncludes losses due to drift during application.eAverage of 15 separate studies over a 5-year period using methoxychlor applied at temperatures ranging from 2 E to 41EC.
4-6
summarizes important parameters for the 15 field tests. Excerpts from the varioustechnical publications cited in Table 4-1 are contained in Appendices A through O. The16th reference reviewed summarized information on the use of control technologies toreduce emissions. In addition, five other publications, cited in support of emissionfactor development, are identified in the references, and other documents reviewed arelisted. The references cited in this section represent the most recent field applicationstudies available for the volatilization of pesticides. It is reported that theU. S. Department of Agriculture (USDA) and the U. S. Environmental Protection Agency(EPA) are initiating studies directed specifically towards the development of data onvolatilization from formulated pesticides under field application conditions. However,these studies are only in the initial stages.
Of the 15 references cited in Table 4-1, only 4 of the studies occurred after 1983. Because the majority of the studies were prior to 1983, many of the AIs cited in thesestudies are no longer registered for use in the U. S. The use of volatilization databased on AIs that are no longer registered would pose a potential problem only if theultimate goal was to calculate emission factors only for these nonregistered AIs, but thisis not the case. The use of these referenced studies is only to create a data base ofvapor pressure and percent loss by volatilization. The fact that many of the compoundsused to create this data base are no longer in use has no impact on the validity of eitherthe vapor pressure values or the volatilization loss measured in these studies.
The use of volatilization data only within 30 days of pesticide application wasselected primarily for two reasons: (1) there are very few data available in thepublished literature on pesticide volatilization based on field application studies withsampling times greater than 30 days, and (2) after 30 days, the impacts of othermechanisms, such as plant uptake, soil adsorption, and biological or physicaldegradation can become very significant. There are very few published studies basedon actual field application that address these other impacts, either cumulatively or on anindividual basis. In addition, it is recognized that some AIs may be significantlyimpacted by these loss mechanisms in times less than 30 days and also that the levelof the impact will vary between AIs.

4-7
Reference 1
This 1977 report describes emission of dieldrin and heptachlor surface-applied toa grass pasture. Vapor density profiles were measured over a 23-day period. Duringthe first 12 hours after application, 12 percent of the dieldrin and 45 percent of theheptachlor were volatilized. It is estimated that during application about 60 percent ofthe dieldrin and 42 percent of the heptachlor were lost directly to the atmosphere asvapor or spray drops that never reached the target area. Volatilization declined rapidlyover the first 7 days and after 30 days, 89 percent of the applied dieldrin and 96 percentof the heptachlor had volatilized. Marked diurnal variation in vertical flux intensities ofboth insecticides were observed during the initial period of rapid volatilization.
A rating of B was assigned to the data contained in this report. Documentationof all aspects of the study was thorough, and sampling and analysis methods weresound. Vapor density profiles and vertical flux intensities were calculated. Note that asimilar study conducted by Taylor is described in reference 6. In this study, thepesticides were surface-applied, while in the Taylor study, the pesticides wereincorporated into the soil after application.
Reference 2
This 1978 emission report describes a series of field trials undertaken on theCanadian prairies using ground rigs and aerial spraying to ascertain the relativemagnitudes of droplet and vapor migration of various 2,4-D formulations from targetareas. The results indicated that 30 to 40 percent of the initial quantity of the butyl esterof 2,4-D evaporated and drifted downwind, as vapor, in the 2 hours following spraying;the corresponding evaporation rate for the octyl ester was 10 to 15 percent. Off-targetdroplet drift during spraying varied between 1 and 8 percent for ground rig applicationand 20 to 35 percent with aircraft spraying.
A rating of B was assigned to these data. Vertical flux densities were calculated. Documentation of the study was thorough, and sampling and analysis methods weresound. Losses during application were calculated based on the quantity of AI collectedin ground samples in the spray swath.

4-8
Reference 3
This 1983 report describes emissions of toxaphene and/or DDT during twoapplication periods to a cotton field. Air samples for the two tests were collected over aperiod of 11 days and 33 days following application. In the first application, onlytoxaphene was applied to the cotton plants; in the second application, a mixture oftoxaphene and DDT was applied. For the first application, 17 percent of the toxaphenewas lost during application and within the first three hours after application. For theapplication of the toxaphene-DDT mixture, 54 percent of the toxaphene and 72 percentof the DDT were lost during the same time interval. Pesticide disappearance rateswere observed to be a linear function of the pesticide loads on the plants. Nomeasurable pesticide volatilization occurred from the soil, but very dry weather mayhave been a major factor. The study provided additional evidence that postapplicationvolatilization from plants is a major pathway of pesticide transport.
A rating of B was assigned to the data contained in this report. Documentationof all aspects of the study was thorough, and sampling and analysis methods weresound. Vapor density profiles and vertical flux intensities were calculated.
Reference 4
This 1971 emission report accounts for losses of dyfonate and zinophos duringapplication and within the first 24 hours after spray application. The results showed thatmajor losses of pesticide occurred during the application process. Nearly 40 percent ofthe zinophos and 13 percent of the dyfonate failed to reach the soil surface. In sometests, the pesticide was soil-incorporated after application for comparison to plots thatwere not soil-incorporated. Soil samples were taken at 0.5, 4, and 22 hr to determineevaporation. Neither pesticide showed significant losses during the 22 hours followingapplication, regardless whether or not the pesticide was soil incorporated. Sampleswere analyzed by gas chromatography.
A rating of C was assigned to these data. The report does not present thoroughdocumentation of analytical methods and sample collection. No air samples weretaken. Losses during application were estimated rather than measured.
Reference 5

4-9
In this 1964 emission study, dimethoate was spray-applied to a plot andincorporated to a depth of 6 inches (in). Soil samples were taken immediately afterapplication and then seven times throughout the next 2 weeks to determine dimethoatecontent. The results showed that within 3 inches of the soil surface, 94 percent of thedimethoate had disappeared within 14 days after application.
A rating of C was assigned to these data. No flux densities were calculated. The report did not document the analytical procedures used other than a statement ofthe method and it generally lacked sufficient background data. No air samples weretaken. Agricultural application methods were simulated on a small area of land.
Reference 6
This 1976 report describes emissions of dieldrin and heptachlor incorporated7.5 centimeters (cm) into soil immediately before maize was planted. Air samples weretaken over a 6-month period to evaluate daily flux densities. No measurements wereconducted for pesticide concentrations in the air either over or downwind of the siteduring application. However, the loss during application was estimated from soilanalyses taken on the day after application. These analyses indicated that 43 percentof the limited application was not present in the soil. Marked diurnal variations withnoon day maxima were observed during this study.
A rating of B was assigned to the data in this report. Documentation of allaspects of the study was thorough, and sampling and analysis methods were sound. Vapor density profiles and vertical flux intensities were calculated.
Reference 7
This 1984 emission report describes the application of various combinations ofheptachlor, chlordane, lindane, trifluralin, and dacthal (DCPA) to fallow soil in threeseparate tests using two different soil types. Air samples were taken over a period of23 hr in one test and 18 hr in each of two tests. The results showed that for trifluralin,the losses ranged from 2 to 25 percent over 2 days in dry sandy loam whereas in moistsilt loam, the losses were 50 percent in 5 hours and 90 percent in 7 days. Heptachlorshowed losses between 14 and 40 percent over 2 days in dry sandy loam but for moistsilt loam, the losses were 50 percent and 90 percent for 6 hours and 6 days,respectively. Lindane losses were 12 percent in dry sandy loam over 2 days; in moistsilt loam, the losses were 50 percent in 6 hours and 90 percent in 6 days. For

4-10
chlordane, the loss from dry sandy loam was 2 percent in 2 days but 50 percent in2.5 days for moist silt loam. Dacthal loss was measured only in moist silt loam andfound to be 2 percent in 1.5 days. Soil moisture content in an obvious major factor inevaluating vaporization loss from bare soils.
A rating of B was assigned to these data. Documentation of all aspects of thestudy was thorough, and sampling and analysis methods were sound. Vapor densityprofiles and vertical flux intensities were calculated.
Reference 8
This 1980 emission report describes the application of the herbicide S-ethyl,
N,N-dipropylthiocarbamate (EPTC) to an alfalfa field by "herbigation" (i.e., in irrigation
water). After 52 hours, it was found that 74 percent of the EPTC had volatilized fromthe irrigation water. Studies of the soil prior to irrigation showed a 55 percent loss ofEPTC within 24 hours of application.
A rating of B was assigned to the data in this report. Documentation of allaspects of the study was thorough, and sampling and analysis methods were sound. Vapor density profiles and vertical flux intensities were calculated.
Reference 9
This 1965 emission report describes volatilization of EPTC from soil. Soilsamples were analyzed by steam distillation of the EPTC from substrate. The results ofthe study showed that during the first 15 minutes after spraying on the soil surface,20 percent of the EPTC disappeared from dry soil, 27 percent from moist soil, and44 percent from wet soil. The losses were 23, 49, and 69 percent after 24 hours and44, 68, and 90 percent after 6 days on dry, moist, and wet soils, respectively. Theamount of soil moisture was identified as the most important factor affectingvolatilization. A rating of C was assigned to the data contained in this report. No airsamples were taken. Agricultural application methods were simulated.
Reference 10
In this 1970 report, deposition data for aerial application from 16 pesticidestudies were presented and used to estimate the percent of methoxychlor andtoxaphene deposited on target from the aerial application to irrigated alfalfa and cotton

4-11
fields. Of the 16 studies, 14 were results for aerial application of solutions ofmethoxychlor for varying application rates and meteorological conditions. The other2 studies used toxaphene; one application was for a dust and the other was anaqueous emulsion. The application of toxaphene dust resulted in 86 percent of thequantity applied missing the target area whereas using toxaphene in the aqueousemulsion resulted in only 52 percent missing the target area. In the methoxychlorstudies, the percentage of the quantity applied that missed the target area ranged from27 to 72 percent; the average loss rate was 47 percent.
A rating of C was assigned to the emission data presented in this report. Analytical methods were not documented thoroughly in this report.
Reference 11
In this 1985 study, the isooctyl ester of 2,4-dichlorophenoxyacetic acid (2,4-D)and its acid metabolite were applied to a field of wheat. The total or cumulative vaporloss of the isooctyl ester over a 5 day sampling period was estimated to be 21 percentof the amount applied. The crop canopy was determined to have intercepted52 percent of the applied ester.
A rating of B was assigned to these emission data. Documentation of all aspectsof the study was thorough, and sampling and analysis methods were sound. Vapordensity profiles and vertical flux intensities were calculated. Data were also presentedfor the acid metabolite, which was observed to form rapidly after application, followedby a slow decline.
Reference 12
This 1980 study describes the results of aerial application of toxaphene to acotton field. Air samples were taken from above the crop canopy over a period of5 days. For the 5-day period following application, the cumulative volatile loss oftoxaphene was 26 percent. Increased volatilization rates were observed when leaveswere drying after heavy dew or light rain.
A rating of B was assigned to these data. Documentation of all aspects of thestudy was thorough, and sampling and analysis methods were sound. Vapor densityprofiles and vertical flux intensities were calculated.

4-12
Reference 13
For this 1993 emission study, a study plot was sprayed with trifluralin and triallateas an emulsified aqueous suspension and not incorporated into the soil. Air samplesfrom above the fallow soil were taken immediately after spraying and continued for120 h. Soil samples were taken at 12-h intervals for 3 days and then once per day for2 days.
Two techniques were used to measure volatilization from the fallow soil: therelaxed eddy accumulation (REA) technique and the aerodynamic-gradient (AG)technique. A mass balance based on the quantity of pesticide volatilized over the 5-dayperiod should losses of 100 and 70 percent for triallate and 79 and 61 percent fortrifluralin by the AG and REA techniques, respectively.
A data rating of B was assigned to these data. Documentation of all aspects ofthe study was thorough. Pesticide fluxes were calculated. Two measurement methodswere used. The relaxed eddy accumulation method was compared to the aerodynamicgradient technique.
Reference 14
This 1990 report describes a study to determine which transport mechanisms(drift, volatilization and deposition, windblown particles, or plant uptake) contribute todimethyl tetrachloroterephthalate (DCPA) contamination of nontarget crops. Air, soil,and vegetation were sampled for DCPA. An estimated 10 percent of the DCPA(Dacthal) applied was lost to the atmosphere within 21 days after application. Theoverall test results indicated that drift during application, and volatilization withsubsequent air transport after application are potentially important sources of DCPAcontamination on nontarget crops.
A data rating of B was assigned to these data. Volatilization fluxes and soildissipation of DCPA were measured. The study was well documented.
Reference 15
This 1977 study describes the measurement of trifluralin volatilization lossesfrom a field during application at soybean planting and for a period of 120 days afterplanting. Volatilization losses during application were estimated to be 3.5 percent of the
4-13
applied quantity. Total seasonal volatilization losses, excluding application losses, wereestimated to be 22 percent, of which about 20 percent occurred within 35 days.
A rating of B was assigned to these data. Documentation of all aspects of thestudy was thorough, and sampling and analysis methods were sound. Vapor densityprofiles and vertical flux intensities were calculated. Both losses during application andseasonal losses were calculated.
Reference 16
This document does not contain original test results, but it discusses estimatedemissions of agricultural pesticides in the United States based on data compiled by theResources for the Future, EPA, and the California Department of Pesticide Regulation(DPR). Various alternative control technologies for reducing pesticide usage andemissions are discussed. Control technologies include microencapsulation ofpesticides, reformulating pesticides to reduce solvent usage, improved efficiencyapplication equipment, and integrated pest management techniques. Estimates weregiven for the potential of different control technologies to reduce pesticide emissions. The document discusses methods for estimating pesticide emissions.
This report was given a C rating because the emission calculations were basedon equations and pesticide physical properties data, and represented an untestedmethodology for estimating volatilization losses.
4.2 DEVELOPMENT OF CANDIDATE EMISSION FACTORS
Pesticides are applied to agricultural crops in many forms and in many ways. Specific application techniques are numerous and vary considerably, depending uponthe form of the pesticide. The form in which a specific pesticide is made available forapplication to agricultural crops is termed the formulation. Formulations are generallycomposed of the pesticide's active ingredient (AI) and a number of other materials thathave little or no pesticide activity. These materials, collectively termed the inertingredients, may include solvents, emulsifiers, diluents, fillers, carriers, and manyothers. The pesticide AI may be present in formulations in very small proportions(<1 percent) or up to relatively large proportions (>50 percent of the total formulation). Conversely, the inert ingredients may range from less than 50 percent to over99 percent of the formulation.

4-14
Field conditions such as weather, soil characteristics, and application techniquehave been shown to influence the degree of pesticide volatilization. The chemicalcomposition and physical properties of the formulation also affect volatilization. Anemission factor model is based on knowledge of specific formulations, methods ofapplication of the formulation, and the available data base of pesticide properties.
The emission model developed in this document considers only vaporousorganic substances, and does not include particulate emissions. However, it doesconsider the contributions of both the inert ingredients and the AIs to the total emissionsof organics resulting from the application of agricultural pesticide formulations. Themodel is separated into two parts: emissions of the AI and emissions of inert volatileingredients in the formulation.
All organic constituents in the formulation that are not AIs are considered, forpresent purposes, to be potential volatile organic compounds (inert VOCs). Norecognized published model is currently available that specifically estimates VOCemissions resulting from the inert ingredient portion of the pesticide formulation. Consequently, an emission model for the inert ingredients was developed based oninformation developed from existing data bases to estimate the quantity of VOCs invarious types of pesticide formulations. Information on the nature of the specific VOCstypically present in these formulations was used to estimate an overall emission forthese constituents.
Emissions resulting from the volatilization of the AI portion of the pesticideformulation have been investigated in a very limited number of studies as shown inTable 4-1. The models developed in some of the studies are focussed on vapor densityprofiles or vertical flux intensities, usually data intensive, and specific to the set ofconditions existing during the specific field application test. No comprehensive modelsemploying readily available physical or chemical properties have been developed forthe estimation of the degree of volatilization of the AIs due to the surface application ofpesticide formulations. The data obtained from the reports described in Section 4.1,and summarized in Table 4-1, were used to estimate emission factors for the surfaceapplication of pesticides based on a readily available physical property, the vaporpressure of the AI.
Comprehensive studies were published by Jury, Spencer, and Farmer for theapplication of pesticide formulations by soil incorporation.18-21 The mathematical models

4-15
developed in those studies were used herein, in conjunction with existing data forselected AIs, to estimate emission factors for that application method. Although otheremission models are available, these models were selected because they were themost amenable to reducing the number of variables and could be converted intofunctions of a readily available physical property (i.e., vapor pressure) of the specific AI.
The emission factors based on the data presented in Table 4-1 or the soilincorporation model are E-rated because the estimates are derived solely frommathematic representations using averages of test results or physical properties of theAIs. In addition, the physical properties required for the soil incorporation model wereavailable for only selected AIs within the different vapor pressure ranges. For thisreason, the emission estimates for each vapor pressure range are based on data froma very small number of specific active ingredients. Because the total number of datapoints is small and the data within a vapor pressure range show considerable variation,the emission estimates obtained by use of these emission factors should be consideredonly as an approximation. However, no alternative emission estimation procedureshave been suggested. As the USDA, EPA, and other studies are completed andadditional data become available, the emission factors and the methodology used toderive the emission factors will be reviewed and revised, as appropriate, to incorporatethe new data.
This emission model is not valid for the aerial application of pesticideformulations. A major factor in losses by this application technique is drift, and neitherequations nor experimental data are currently available to permit predictions of theselosses. Work is currently in progress by the Spray Drift Task Force, a joint venture of28 basic manufacturers and end-use formulators, to compile a spray drift data base tosatisfy registration requirements of the EPA under the Federal Insecticide, Fungicide,and Rodenticide Act (FIFRA). Testing to complete the data base is expected tocontinue through 1994.
The following section discusses the development of the emission model into anAP-42 emission factor (algorithm).
4.3 ALGORITHM DEVELOPMENT
Emissions due to the applications of agricultural pesticides have been shown tobe primarily functions of the physical properties of the specific AI and various field

4-16
conditions including temperature, relative humidity, and soil moisture content. Themodeling approach develops emission estimates for the inert ingredient portion of thepesticide formulation based on information derived from pesticide registration data. Emission estimates for surface application of the active ingredient (AI) portion of theformulation are based on the numerical averages of the data in Table 4-1 for tworanges of AI vapor pressure. The selection of the vapor pressure of the AI as thephysical property for the emission estimates was based on the overall generalavailability of values for this property for a large number of AIs. Other properties, suchas Henry's Law constant, may also be descriptive of the actual physical processes thatoccur after field application. However, values for these properties may not be generallyfound in readily available sources. One of the determinants in the selection of thephysical property was that the values should be present in readily available sources.
For application by soil incorporation, the emission estimates use equationsdeveloped by Jury, Spencer, and Farmer. These methods have been developed intoan algorithm for estimating AI emissions over a time interval of 30 days afterapplication. One of the major objectives of the algorithm development was to estimateemission factors based on a straightforward relationship using readily available date. The following sections discuss the informational needs of the algorithm, the form of theestimating equations, and the use of the algorithm.
4.3.1 Information Requirements
Pesticide formulations contain both an AI and inert ingredients, and the pesticidevolatilization algorithm uses separate steps to estimate emissions for both the AI andinert ingredients.
Ideally, the information used in the algorithm calculation matches as closely aspossible the actual conditions under which the pesticide was used. The followinginformation is necessary to use the algorithm.
! Method by which the formulation was applied (the algorithm cannot be usedfor aerially applied pesticides);
! Total quantity of formulation applied;
! Type of formulation (e.g., emulsifiable concentrate, granules, microcapsules,powder);

4-17
! Name of the specific AI (or AIs) and the percentage of AI (or each AI) in theformulation;
! Vapor pressure of the AI (or each AI);
! Percentage of inert ingredients; and
! Quantity or percentage of VOCs in the inerts.
Information on the formulation (name of AI, percent content of the AI, percent contentof the inert ingredients) is required by FIFRA to be on the product label. If a label isunavailable, this information can be obtained from the manufacturer or end-useformulator. Tables are presented in Section 4.3.2 that provide information on defaultvalues for the percentage of VOCs in the inert ingredient portion of variousformulations, active ingredients contained in common trade name formulations, andvapor pressure data for specific AIs.
4.3.2 Emission Estimation Methods
Two basic methods are used in the algorithm to estimate total emissions fromthe application of agricultural pesticides. One method estimates the quantity of activeingredient emissions for selected time intervals after application, and the otherestimates emissions of VOCs present in the inert ingredients.
4.3.2.1 Emissions Due to the Active Ingredients—Application of pesticide formulations occur by three general methods: (1) aerial
application, (2) surface application, and (3) soil incorporation. The methods presentedin this section are not valid for aerial applications. In addition, the method should not beused to estimate emissions due to fumigants because these liquid or gaseous productsare highly volatile and would be rapidly discharged to the atmosphere. In many states,the gaseous fumigants and some of the liquid products are no longer used or are beingreplaced. The remainder of this section presents the methods used to estimateemissions of AIs due to surface application techniques and soil incorporationtechniques.
Surface application - The behavior of the pesticide AI as it interacts with air,water, soil, and biota is strongly influenced by the physical and chemical properties ofthe specific AIs. Water solubility, vapor pressure or volatility, and the tendency to sorb

4-18
to organic and mineral matter in the soil are major properties to be considered. Henry'sLaw constant has been used to describe air-water partitioning of pesticides and mayprovide a measure of the tendency to volatilize. Vapor pressure is an importantproperty that can also provide a measure of AI volatility. Every AI has a characteristicvapor pressure, which varies with temperature. Vapor pressure is a key chemicalcharacteristic controlling the vaporization potential of the AI. In this section, Henry'sLaw constant and vapor pressure will be evaluated to estimate volatilization rates fromthe soil surface.
Table 4-1 presented a summary of the results of studies conducted to measurethe loss of AI from pesticide formulations applied to soil surfaces over a variety ofconditions for time intervals ranging from immediately after application to 30 days afterapplication. In the table, data are provided for a range of combinations of AI,formulation type, application method, soil type, and length of time after application. Ofthe 48 results listed in the table, 43 were the result of conventional surface applicationtechniques (e.g., ground rig sprayers), 4 were due to aerial application, and one resultwas for soil incorporation. After results were excluded for aerial applications, soilincorporation, and those for which no vapor pressure data were available, 39 datapoints for AI loss remained. This set of data represents the available information on thepercentage loss for the surface application of several AIs for time intervals up to30 days after application. The rationale for limiting the volatilization losses to 30 daysafter application was provided in Section 4.1.
In Table 4-1, the 39 data points for AI loss represent 15 different AIs. The mostrecent compilation of Henry's Law constants for pesticides was published by Suntio, etal., in 1988.22 In this review article, the constants were listed for 96 pesticide AIs anddisplayed a range of about 11 orders of magnitude between the highest and lowestconstant. If the extreme high and low values are excluded, most of the constants fellwithin a 7 order of magnitude range. The compilation provided Henry's Law constantvalues for 12 of the 15 AIs in Table 4-1. Of the 12 values, 9 of the values were within arange of less than two orders of magnitude. This represents a very small portion of thetotal range of Henry's Law constants and would not result in estimated emission factorsfor a significant percentage of the AIs used in pesticide formulation. The AIs inTable 4-1 fall within a range that is too narrow for the use of Henry's Law constants tobe an effective way to group AIs for emission factor purposes.

4-19
The use of vapor pressure provides a overall range that is more inclusive of alarger portion of the AIs in pesticide formulations. Most AIs typically have vaporpressures in the range of 10-3 to 10-6mmHg at ambient temperatures. The data fromTable 4-1 were segregated into groups based on the vapor pressure of the AI. Twovapor pressure ranges were selected: (1) greater than 1x10⁻⁴mmHg, and (2) between1x10-4 and 1x10⁻⁶mmHg. Because only one data point was available for the group withvapor pressures less than 1x10⁻⁶mmHg, no emission factor was developed for thisvapor pressure range. For an AI in this vapor pressure range, a possible defaultprocedure would be to use the soil incorporation equation; however, these equationsmay provide a very low emission estimate.
For AIs with vapor pressures greater than 1x10⁻⁴mmHg, the data in Table 4-1show that the average percentage loss of AI within 30 days after application was58 percent. For AIs with vapor pressures in the range between 1x10⁻⁴ and1x10-6mmHg, the data show the average percentage loss to be 35 percent. Withineach of the vapor pressure groups, there is considerable variability of field conditionsfrom one field test to the other and in the volatilization data in Table 4-1 so that theaverage percentage loss is subject to considerable uncertainty. However, based on themodels and data available at this time, use of the average values may be the bestsimplistic and straightforward approach to provide emission estimates.
Soil incorporation - Vaporization of AIs from the soil can be estimated byconsidering the physical and chemical factors controlling concentrations at the soilsurface. Most models developed for estimating volatilization rates of soil-incorporatedAIs are based on equations describing the rate of movement of the AI to the surface bydiffusion and/or convection.
Volatilization rates were calculated for AP-42 Section 9.2.2 for a number ofpesticides using the screening model proposed by Jury, Spencer, and Farmer.18-21 Inthe model, pesticides are divided into volatilization categories I, II, and III based on theirrate of movement to the soil surface by diffusion and/or convection.
The volatilization of pesticides in category I is time-dependent, limited by soilresistance. Once the category I pesticides reach the soil surface, however, theybehave as though there is no boundary layer resistance in the air above the soil. Therefore, in the absence of evaporation, the concentration of category I pesticides at

4-20
Jv1 ' Co
DaG
KH (N&2)10/3 % DwL
210/3
N2Bt [DbfocKoc % 2 % (N & 2)KH]
(1)
the soil surface increases with time. The rate of volatilization of category I pesticides isgiven by equation (1):
where:
Jv1 = rate of pesticide volatilization (g/m2/d)Co = initial pesticide concentration = 1 g/m3
DGa = gaseous diffusion coefficient in air = 0.43 m2/d
KH = Henry's constant (m3/m3)N = soil porosity = 0.5 m3/m3
2 = soil volumetric water content = 0.3 m3/m3
DL
w= liquid diffusion coefficient for water through soil =
4.3 x 10⁻⁵ m2/dt = time after application = 30 dDb = bulk soil density = 1350 kg/m3
foc = organic carbon fraction = 0.0125Koc = organic carbon partition coefficient (m3/kg)
The values given for DGa, N, 2, DL
w, Db, and foc can be used as default values if the actualvalues are unknown. Henry's Law constants can be found in Suntio, et al., (Reference22) for 96 pesticides. Organic carbon partition coefficients for selected pesticides areavailable in Reference 18.
The volatilization of category III pesticides is dependent on the thickness of theboundary layer of air above the soil surface. However, as the category III pesticidesproceed through the soil to the surface, they behave as though there is no soilresistance. Therefore, in the absence of evaporation, the concentration of Category IIIpesticides decreases at the surface with time. The rate of volatilization of category IIIpesticides (Jv2) is given by equation (2):

4-21
Jv2 '
Co DaG
KH
d[Db focKoc % 2 % (N & 2) KH](2)
All of the parameters for equation (2) were presented in equation (1), with the exceptionof the boundary layer thickness, d. A value of 0.005 m can be used as a default valuefor d if the actual value is unknown.
Category II pesticides have properties that create soil and boundary layerresistance of approximately similar size. As a result, they display behavior intermediatebetween these two extremes. For category II pesticides, both volatilization equationsare equivalent, and, therefore, the volatilization of category II pesticides can berepresented by either equation. For the purpose of the AP-42, the equation forcategory I pesticides was used for category II pesticides, because the time afterpesticide application is more certain than the thickness of the boundary layer, whichmay be different for category II pesticides.
The rate of volatilization was obtained for Categories I and II pesticides byintegrating equation (1) over the 30-day time interval. For Category III pesticides,equation (2) was used to estimate the rate of volatilization.
Emission factors were estimated for the AIs using the volatilization ratescalculated from the model and the application rate of 1 kilogram per hectare (kg/ha)given in the model description. Because vapor pressure is a key chemicalcharacteristic controlling AI vapor behavior, the emission factors for the AIs wereaveraged and presented over three AI vapor pressure ranges. Table 4-2 presents thevapor pressures for 90 selected AIs, including those for which emission factors werecalculated. Table 4-3 presents the emission factors as a function of AI vapor pressurefor the time interval from application up to 30 days after application of the pesticideformulation.

4-22
TABLE 4-2. SELECTED ACTIVE INGREDIENT VAPOR PRESSURESa
Active ingredientVapor pressure
mmHg at 20E to 25EC
1,3-Dichloropropene 29
2,4-D acid 8.0 x 10!6
Acephate 1.7 x 10!6
Alachlor 1.4 x 10!5
Aldicarb 3.0 x 10!5
Aldoxycarb 9 x 10⁻⁵
Amitraz 2.6 x 10!6
Amitrole (aminotriazole) 4.4 x 10!7
Atrazine 2.9 x 10!7
Azinphos-methyl 2.0 x 10!7
Benefin (benfluralin) 6.6 x 10!5
Benomyl < 1.0 x 10!10
Bifenox 2.4 x 10!6
Bromacil acid 3.1 x 10!7
Bromoxynil butyrate ester 1.0 x 10!4
Butylate 1.3 x 10!2
Captan 8.0 x 10!8
Carbaryl 1.2 x 10!6
Carbofuran 6.0 x 10!7
Chlorobenzilate 6.8 x 10!6
Chloroneb 3.0 x 10⁻³
Chloropicrin 18
Chlorothalonil 1.0 x 10⁻³b
Chlorpyrifos 1.7 x 10!5
Clomazone (dimethazone) 1.4 x 10!4
Cyanazine 1.6 x 10!9
Cyromazine 3.4 x 10!9
DCNA (dicloran) 1.3 x 10!6
DCPA (dacthal; chlorthal-dimethyl) 2.5 x 10!6
Diazinon 6.0 x 10!5
Dichlobenil 1.0 x 10!3
Dicofol 4.0 x 10!7
Dicrotofos 1.6 x 10!4
Dimethoate 2.5 x 10!5
Dinocap 4.0 x 10!8
Disulfoton 1.5 x 10!4
Diuron 6.9 x 10!8
Endosulfan 1.7 x 10!7
EPTC 3.4 x 10!2

4-23
TABLE 4-2. (continued)
Active ingredientVapor pressure
mmHg at 20E to 25EC
Ethion 2.4 x 10!6
Ethoprop (ethoprophos) 3.8 x 10!4
Fenamiphos 1.0 x 10!6
Fenthion 2.8 x 10!6
Fluometuron 9.4 x 10!7
Fonofos 3.4 x 10!4
Isofenphos 3.0 x 10!6
Lindane 3.3 x 10!5
Linuron 1.7 x 10!5
Malathion 8.0 x 10!6
Methamidophos 8.0 x 10!4
Methazole 1.0 x 10!6
Methiocarb (mercaptodimethur) 1.2 x 10!4
Methomyl 5.0 x 10!5
Methyl parathion 1.5 x 10!5
Metolachlor 3.1 x 10!5
Metribuzin < 1.0 x 10!5
Mevinphos 1.3 x 10!4
Molinate 5.6 x 10!3
Naled 2.0 x 10!4
Norflurazon 2.0 x 10!8
Oxamyl 2.3 x 10!4
Oxyfluorfen 2.0 x 10!7
Parathion (ethyl parathion) 5.0 x 10!6
PCNB 1.1 x 10!4
Pendimethalin 9.4 x 10!6
Permethrin 1.3 x 10!8
Phorate 6.4 x 10!4
Phosmet 4.9 x 10!7
Profenofos 9.0 x 10!7
Prometon 7.7 x 10!6
Prometryn 1.2 x 10!6
Propachlor 2.3 x 10!4
Propanil 4.0 x 10!5
Propargite 3.0 x 10!3
Propazine 1.3 x 10!7
Propoxur 9.7 x 10!6
Siduron 4.0 x 10!9

4-24
TABLE 4-2. (continued)
Active ingredientVapor pressure
mmHg at 20E to 25EC
Simazine 2.2 x 10!8
Tebuthiuron 2.0 x 10!6
Terbacil 3.1 x 10!7
Terbufos 3.2 x 10!4
Thiobencarb 2.2 x 10!5
Thiodicarb 1.0 x 10!7
Toxaphene 4.0 x 10!6
Triallate 1.1 x 10!4
Tribufos 1.6 x 10!6
Trichlorfon 2.0 x 10!6
Trifluralin 1.1 x 10!4
Triforine 2.0 x 10!7
Note: This table contains vapor pressure values for 90 active ingredients inpesticides. Additional data can be found in Reference 17.
aReference 17.bThis value is an estimate.

4-25
TABLE 4-3. EMISSION FACTORS FOR ACTIVE INGREDIENTS AS AFUNCTION OF APPLICATION METHOD AND VAPOR PRESSURE
Vapor Pressure (mmHg at 20E to 25EC)a
Emission factorb,c
kg/Mg lb/ton
Surface application (SCC 24-61-800-001)
10-4 to 10-6
>10-4350580
7001,160
Soil incorporationd (SCC 24-61-800-002)
<10-6
10-4 to 10-6
>10-4
2.72152
5.442
104
aSee Table 4-2 or reference 17 for vapor pressures of specific AIs.bEmission factors expressed as equivalent weight of AI volatilized per unit weight of AIapplied. All emissions are uncontrolled.
cEmission factor applicable for the 30 day period following application.dReferences 18-21 (particularly reference 19).
4-26
No emission factors were estimated after 30 days because after that time,degradation processes, such as hydrolysis and microbial degradation, can have a majorimpact on the loss of AI so that volatilization may not be the primary loss mechanism. (Note that in Table 4-1 the data do not extend beyond 30 days). The use ofequations (1) and (2) may not be appropriate to estimate volatilization rates overextended periods of time.
4.3.2.2 Emissions Due to Inert VOC Ingredients—
Many of the materials used as inert ingredients in pesticide formulations areclassified as VOCs. During the application of the pesticides and for a period of timesubsequent to the application, the VOCs are volatilized into the atmosphere. Thedegree of volatilization with time is a function of many factors. Among the morepredominant are the vapor pressure of the specific component, the moisture content ofthe soil, air temperature, and wind speed. While the precise degree of VOC loss duringapplication is not known, a review of the data in Table 4-1 ndicates that a substantialportion, probably greater than 50 percent, of the pesticide formulation is lost uponapplication and during the subsequent 7 days. Many of the liquid inert ingredients inpesticide formulations have vapor pressures much higher than those of the activeingredients, which typically have vapor pressures in the range of 10!3 to 10!6mmHg atambient temperatures. These inert ingred-ients are the major contributors to the VOCemissions that occur within the first 30 days after the application of agriculturalpesticides. In the AP-42, it is assumed that 100 percent of the VOCs present in theinert ingredients volatilize within those 30 days.
Information on the percentage of total inert ingredients in a specific formulationcan be obtained from the product label, which denotes the percentage of AI in theproduct within the container and the percentage of inert ingredients. However, not allinert ingredients are VOCs. Most liquid formulations contain amounts of water as aportion of the inert ingredients. The percentage of water may range from severalpercent to greater than 95 percent. Solid formulations typically contain inert ingredientssuch as talc, finely ground clay, ground corn cobs, and other solid, nonvolatilecomponents. Although solid formulations are composed almost entirely of nonliquidconstituents, small quantities of liquid organic compounds are contained in the matrix. The compounds are often incorporated as carriers, stabilizers, surfactants, oremulsifiers. After field application, these compounds are susceptible to volatilization

4-27
from the formulation. If information on the content of VOCs in the inert ingredientportion of the formulation cannot be obtained from the label or the manufacturer, anaverage percentage of the VOC content of the inert portion in typical formulation typescan be found in Table 4-4. These data show the VOC content as a percentage of theinert portion. These estimated average percent values can be used as default values ifthe actual data cannot be obtained.
These estimated average VOC percentages were calculated by analyzing theinert formulations of approximately 9,000 products registered in the State of California. The nonvolatile portions of the inert formulations were subtracted out and the remaining(assumed) volatile portions averaged across each formulation type. The list ofnonvolatile ingredients was compiled by review of nearly 3,200 individual ingredients inCalifornia's chemical data base. This cursory review, conducted by staff in thePesticide Registration Branch of the California Department of Pesticide Regulation,determined if a component was volatile or nonvolatile. No attempt was made toestablish the degree of volatility. Of the 3,200 ingredients, 981 were identified as beingnonvolatile or exempt (e.g., selected CFCs are exempt). Many inert ingredients werenot identifiable as to their chemical composition and, by default, were categorized asvolatile. This may explain the rather high averages calculated for many of the solidformulation types. An inert ingredient contribution factor to VOC emissions wascalculated for each individual product. Using a unique factor for each product allows amore accurate estimate of emissions because of variations in reported individualproduct usage. The formulation averages are only used when inert formulationinformation is unavailable. This estimation methodology is conservative, assuming thateach ingredient, unless excluded as nonvolatile or exempt, is 100 percent volatilized.23
4.3.3 Use of the Algorithm
The algorithm is applied in a six-step procedure as follows:
1. Determine the application method and the quantity of pesticide product ofconcern that will be or has been applied (aerial application is not covered bythe algorithm).
2. Determine the type of formulation used.
3. Determine the specific AI (or AIs) in the formulation.

4-28
TABLE 4-4. AVERAGE VOC CONTENT OF PESTICIDE INERT INGREDIENTPORTION, BY FORMULATION TYPEa
Formulation typeAverage VOC content
of inert portion, %b
Oils 66
Solution/liquid (ready-to-use) 20
Emulsifiable concentrate 56
Aqueous concentrate 21
Gel, paste, cream 40
Pressurized gas 29
Flowable (aqueous) concentrate 21
Microencapsulated 23
Pressurized liquid/sprays/foggers 39
Soluble powder 12
Impregnated material 38
Pellet/tablet/cake/briquette 27
Wettable powder 25
Dust/powder 21
Dry flowable 28
Granule/flake 25
Suspension 15
Paint/coatings 64
aSource: Reference 23.bWeight percent of VOC in inert portion of the formulation.

4-29
4. Determine the percentage of the AI (or each AI) present.
5. Determine the VOC content of the formulation.
6. Perform calculations of emissions.
Information for these steps can be found as follows:
! Item 1—The quantity can be found either directly from the weight purchasedor used for a given application, or alternately by multiplying the applicationrate (e.g., pounds/acre) times the number of units (acres) treated.
! Items 2, 3, and 4—This information is presented on the labels of all pesticidecontainers. Alternatively, it can be obtained from the manufacturer, end-useformulator, or a local distributor. If the trade name of the pesticide and thetype of formulation are known, the specific AI in the formulation can beobtained from the Farm Chemicals Handbook. Table 4-5 presents the
specific AIs found in several common trade name formulations. Informationon the various formulations for specific AIs applied in individual States may beavailable from the National Agricultural Statistics Service, U. S. Department ofAgriculture, Washington, D.C. This service compiles numerous statistics onpesticide usage in individual States and may provide assistance indetermining annual quantities of specific AIs used by crop by State and thetype of formulations used in specific States.
! Item 5—The percent VOC content of the inert ingredient portion of theformulation can be requested from the manufacturer or end-use formulator. Alternatively, an estimated average VOC content of the inert portion forseveral common types of formulations is given in Table 4-4.
! Item 6—Emissions are calculated separately for AIs and inert VOCs and thensummed, as described and illustrated below.
4.3.3.1 Emissions Due to Active Ingredients—The total quantity of AI applied to the crop can be calculated from the percent
content of the AI in the formulation and the total quantity of applied formulation. Determine the vapor pressure of the specific AI at 20-25EC from Table 4-2,reference 17, or other sources.

4-30
Table 4-3 presents emission factors for AIs within specified vapor pressureranges. Find the vapor pressure range in Table 4-3 corresponding to the vaporpressure of the specific AI and determine the emission factor for the AI. Based on thetotal quantity of applied AI (determined in the first paragraph), use the emission factorto determine the total quantity of AI emissions 30 days after application. This table isnot applicable for emissions due to the use of fumigants because these gaseous orliquid products are highly volatile and would be rapidly discharged to the atmosphere. Fumigants, such as methyl bromide and 1,3-dichloropropene (1,3-D or Telone®), areno longer used in several states.

4-31
TABLE 4-5. TRADE NAMES FOR SELECTED ACTIVE INGREDIENTSa,b
Trade namesc Active ingredientd
INSECTICIDES
AC 8911 PhorateAcephate-met MethamidophosAlkron® Ethyl ParathionAlleron® Ethyl ParathionAphamite® Ethyl ParathionBay 17147 Azinphos-methylBay 19639 DisulfotonBay 70143 CarbofuranBay 71628 MethamidophosBenzoepin EndosulfanBeosit® EndosulfanBrodan® ChlorpyrifosBugMaster® CarbarylBW-21-Z PermethrynCarbamine® CarbarylCarfene® Azinphos-methylCekubaryl® CarbarylCekudifol® DicofolCekuthoate® DimethoateCGA-15324 ProfenofosChlorpyrifos 99% ChlorpyrifosChlorthiepin® EndosulfanComite® PropargiteCorothion® Ethyl ParathionCrisulfan® EndosulfanCrunch® CarbarylCuracron ProfenofosCuraterr® CarbofuranCyclodan® EndosulfanCygon 400® DimethoateD1221 CarbofuranDaphene® DimethoateDazzel® DiazinonDenapon® CarbarylDevicarb® CarbarylDevigon® DimethoateDevisulphan® EndosulfanDevithion® Methyl ParathionDiagran® Diazinon

4-32
TABLE 4-5. (continued)
Trade namesc Active ingredientd
Methyl Methyl Parathion
Metiltriazotion Azinphos-methyl
Nipsan® Diazinon
Niran® Ethyl Parathion
Nivral® Thiodicarb
NRDC 143 Permethryn
Ortho 124120 Acephate
Orthophos® Ethyl Parathion
Panthion® Ethyl Parathion
Paramar® Ethyl Parathion
Paraphos® Ethyl Parathion
Parathene® Ethyl Parathion
Parathion Methyl Parathion
Parathion Ethyl Parathion
Parawet® Ethyl Parathion
Partron M® Methyl Parathion
Penncap-M® Methyl Parathion
Phoskil® Ethyl Parathion
Piridane® Chlorpyrifos
Polycron® Profenofos
PP 557 Permethryn
Pramex® Permethryn
Prokil® Cryolite
PT265® Diazinon
Qamlin® Permethryn
Rampart® Phorate
Rhodiatox® Ethyl Parathion
S276 Disulfoton
SD 8530 Trimethacarb
Septene® Carbaryl
Sevin 5 Pellets® Carbaryl
Soprathion® Ethyl Parathion
Spectracide® Diazinon
SRA 5172 Methamidophos
Stathion® Ethyl Parathion
Tekwaisa® Methyl Parathion
Temik® Aldicarb
Tercyl® Carbaryl
Thimul® Endosulfan

4-33
TABLE 4-5. (continued)
Trade namesc Active ingredientd
Dicarbam® Carbaryl
Dicomite® Dicofol
Dimethogen® Dimethoate
Dimet® Dimethoate
Dizinon® Diazinon
DPX 1410 Oxamyl
Dyzol® Diazinon
E-605 Ethyl Parathion
Ectiban® Permethryn
Endocide® Endosulfan
Endosol® Endosulfan
ENT 27226 Propargite
ENT27164 Carbofuran
Eradex® Chlorpyrifos
Ethoprop Ethoprop
Ethoprophos Ethoprop
Ethylthiodemeton Disulfoton
Etilon® Ethyl Parathion
Fezudin Diazinon
FMC-5462 Endosulfan
FMC-33297 Permethryn
Fonofos Dyfonate
Force® Tefluthrin
Fosfamid Dimethoate
Furacarb® Carbofuran
G-24480 Diazinon
Gardentox® Diazinon
Gearphos® Methyl Parathion
Golden Leaf Tobacco Spray® Endosulfan
Hexavin® Carbaryl
Hoe 2671 Endosulfan
Indothrin® Permethryn
Insectophene® Endosulfan
Insyst-D® Disulfoton
Karbaspray® Carbaryl
Kayazinon® Diazinon
Kayazol® Diazinon
Kryocide® Cryolite
Lannate® LV Methomyl

4-34
TABLE 4-5. (continued)
Trade namesc Active ingredientd
Trimetion® Dimethoate
UC 51762 Thiodicarb
UC 27867 Trimethacarb
Uniroyal D014 Propargite
Yaltox® Carbofuran
None listed Dicrotophos
None listed Terbufos
HERBICIDES
A-4D 2,4-D
AC 92553 Pendimethalin
Acclaim Fenoxaprop-ethyl
Acme MCPA Amine 4® MCPA
Aljaden® Sethoxydim
Amiben® Chloramben
Amilon®-WP Chloramben
Amine® MCPA
Aqua-Kleen® 2,4-D
Arrhenal® DSMA
Arsinyl® DSMA
Assure® Quizalofop-ethyl
Avadex® BW Triallate
Banlene Plus® MCPA
Banvel® Dicamba
Barrage® 2,4-D
Basagran Bentazon
Bay 30130 Propanil
Bay DIC 1468 Metribuzin
Bay 94337 Metribuzin
Benefex® Benefin
Benfluralin Benefin
Bentazon Bentazon
Bethrodine Benefin
BH® MCPA MCPA
Bioxone® Methazole
Blazer® Aciflurofen
Bolero® Thiobencarb
Border-Master® MCPA
Brominex® Bromoxynil
C-2059 Fluometuron

4-35
TABLE 4-5. (continued)
Trade namesc Active ingredientd
Checkmate® Sethoxydim
Chloroxone® 2,4-D
Classic® Chlorimuron-ethyl
Clomazone Clomazone
Command® Clomazone
CP50144 Alachlor
Crisuron® Diuron
Croprider® 2,4-D
Dacthal® DCPA
Dailon® Diuron
Depon® Fenoxaprop-ethyl
Dextrone® Paraquat
Di-Tac® DSMA
Diater® Diuron
DMA DSMA
DMA-100® DSMA
DPA Propanil
DPX-Y6202 Quizalofop-ethyl
EL-110 Benefin
EL-161 Ethalfluralin
Emulsamine® 2,4-D
Esgram® Paraquat
Excel® Fenoxaprop-ethyl
EXP-3864 Quizalofop-ethyl
Expand® Sethoxydim
Far-Go® Triallate
Farmco Diuron® Diuron
Farmco Atrazine Gesaprim® Atrazine
Fervinal® Sethoxydim
Ferxone® 2,4-D
Furore® Fenoxaprop-ethyl
Fusilade 2000 Fluazifop-p-butyl
G-30027 Atrazine
G-34161 Prometryn
G-34162 Ametryn
Gamit® Clomazone
Genate Plus® Butylate
Glyphosate Isopropylamine Salt Glyphosate
Goldquat® 276 Paraquat

4-36
TABLE 4-5. (continued)
Trade namesc Active ingredientd
Higalcoton® Fluometuron
Hoe 002810 Linuron
Hoe-023408 Diclofop-methyl
Hoe-Grass® Diclofop-methyl
Hoelon® Diclofop-methyl
Illoxan® Diclofop-methyl
Kilsem® MCPA
Lasso® Alachlor
Lazo® Alachlor
Legumex Extra® MCPA
Lexone® 4L Metribuzin
Lexone® DF® Metribuzin
Linorox® Linuron
LS 801213 Aciflurofen
M.T.F.® Trifluralin
Magister® Clomazone
Mephanac® MCPA
Merge 823® MSMA
Methar® 30 DSMA
Mezopur® Methazole
Monosodium methane arsenate MSMA
Nabu® Sethoxydim
Option® Fenoxaprop-ethyl
Oxydiazol Methazole
Paxilon® Methazole
Pillarquat® Paraquat
Pillarxone® Paraquat
Pillarzo® Alachlor
Pilot® Quizalofop-ethyl
Plantgard® 2,4-D
Pledge® Bentazon
PP 005 Fluazifop-p-butyl
Primatol Q® Prometryn
Probe Methazole
Prop-Job® Propanil
Propachlor Propachlor
Prowl® Pendimethalin
Rattler® Glyphosate
RH-6201 Aciflurofen

4-37
TABLE 4-5. (continued)
Trade namesc Active ingredientd
Saturno® Thiobencarb
Saturn® Thiobencarb
Scepter® Imazaquin
SD 15418 Cyanazine
Sencor® 4 Metribuzin
Sencor® DF Metribuzin
Shamrox® MCPA
Sodar® DSMA
Sonalan® Ethalfluralin
Squadron® Imazaquin
Squadron® Pendimethalin
Strel® Propanil
Surpass® Vernolate
Targa® Quizalofop-ethyl
Target MSMA® MSMA
Telok® Norflurazon
Tigrex® Diuron
Total® Paraquat
Toxer® Paraquat
Trans-Vert® MSMA
Tri-4® Trifluralin
Tri-Scept® Imazaquin
Tributon® 2,4-D
Trifluralina 600® Trifluralin
Trinatox D® Ametryn
Tritex-Extra® Sethoxydim
Tunic® Methazole
Unidron® Diuron
VCS 438 Methazole
Vegiben® Chloramben
Vernam 10G Vernolate
Vernam 7E Vernolate
Vonduron® Diuron
Weed-Rhap® MCPA
Weed-B-Gon® 2,4-D
Weedatul® 2,4-D
Weedtrine-II® 2,4-D
Whip® Fenoxaprop-ethyl
WL 19805 Cyanazine
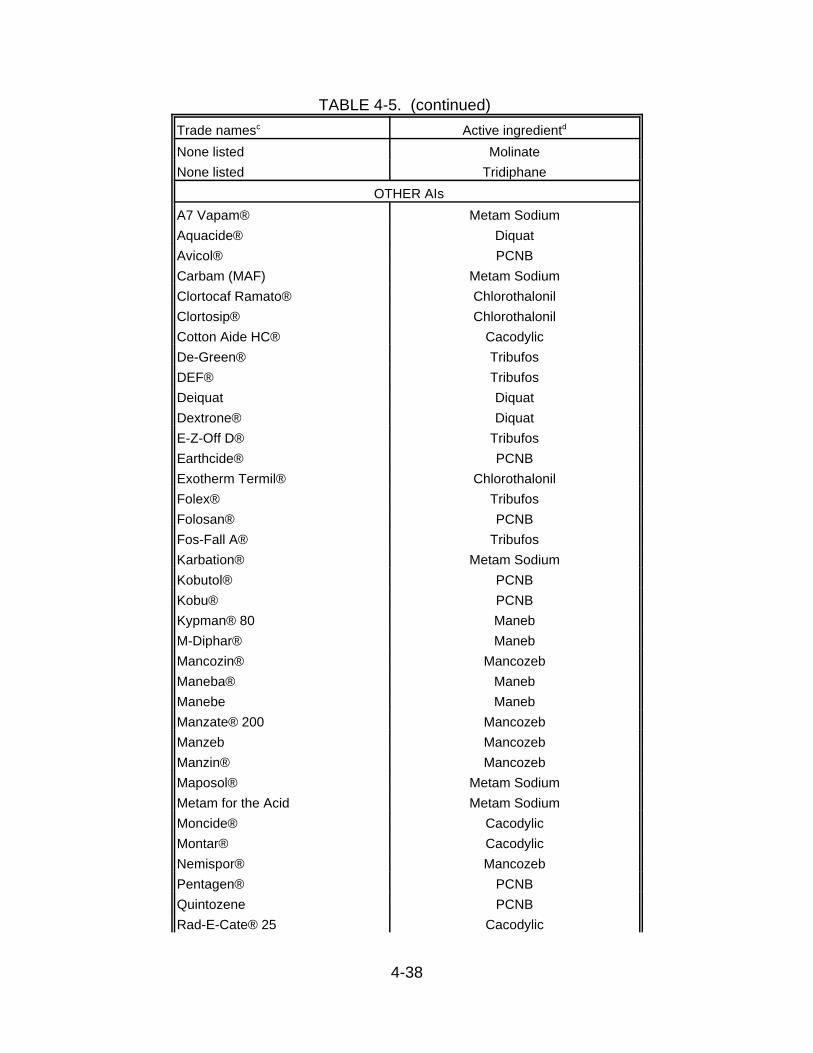
4-38
TABLE 4-5. (continued)
Trade namesc Active ingredientd
None listed Molinate
None listed Tridiphane
OTHER AIs
A7 Vapam® Metam Sodium
Aquacide® Diquat
Avicol® PCNB
Carbam (MAF) Metam Sodium
Clortocaf Ramato® Chlorothalonil
Clortosip® Chlorothalonil
Cotton Aide HC® Cacodylic
De-Green® Tribufos
DEF® Tribufos
Deiquat Diquat
Dextrone® Diquat
E-Z-Off D® Tribufos
Earthcide® PCNB
Exotherm Termil® Chlorothalonil
Folex® Tribufos
Folosan® PCNB
Fos-Fall A® Tribufos
Karbation® Metam Sodium
Kobutol® PCNB
Kobu® PCNB
Kypman® 80 Maneb
M-Diphar® Maneb
Mancozin® Mancozeb
Maneba® Maneb
Manebe Maneb
Manzate® 200 Mancozeb
Manzeb Mancozeb
Manzin® Mancozeb
Maposol® Metam Sodium
Metam for the Acid Metam Sodium
Moncide® Cacodylic
Montar® Cacodylic
Nemispor® Mancozeb
Pentagen® PCNB
Quintozene PCNB
Rad-E-Cate® 25 Cacodylic

4-39
TABLE 4-5. (continued)
Trade namesc Active ingredientd
SMDC Metam Sodium
Soil-Prep® Metam Sodium
Sopranebe® Maneb
Superman® Maneb F Maneb
Terrazan® PCNB
Tersan 1991® Benomyl
TriPCNB® PCNB
Tubothane® Maneb
Weedtrine-D® Diquat
Ziman-Dithane® Mancozeb
None listed Dimethipin
None listed Ethephon
None listed Thiadiazuron
aSelected pesticides used on major field crops found in Agriculture ChemicalUsage 1991 Field Crops Summary, USDA, March 1992.
bSource: Reference 24.cTrade names can be found in alphabetized order in reference 24.dCommon name. Chemical name can be found in reference 24.

4-40
4.3.3.2 Emissions Due to Inert Ingredients—The total quantity of emissions due to the VOC in the inert ingredient portion of
the formulation can be obtained by using the percent of the inert portion contained inthe formulated product, the percent of the VOCs contained in the inert portion, and thetotal quantity of formulation applied to the crop. First, multiply the percentage of inertsin the formulation by the total quantity of applied formulation to obtain the total quantityof inert ingredients applied to the crop. Second, multiply the percent of VOC in the inertportion by the total quantity of inert ingredient applied to obtain the total quantity of VOCinert ingredients. If the VOC content for the formulation is not known, use a defaultvalue from Table 4-4. The emission factor for VOC inert ingredients is assumed to be100 percent within 30 days after application of the formulation.
4.3.3.3 Total Emissions—Add the total quantity of emissions due to the AI as calculated in 4.3.3.1 to the
total quantity of VOC inert ingredients volatilized as calculated in 4.3.3.2. The sum ofthese quantities represents the total emissions resulting from the application of thepesticide formulation.
4.3.4 Example Estimation
A total of 3,629 kilograms (kg), or 8,000 pounds, of Spectracide® weresurface-applied to cropland, and an estimate is desired of the total quantity ofemissions within 30 days after application.
1. The active ingredient in Spectracide® is diazinon (reference 22, or Table 4-5). Information from the pesticide container states that the formulation is anemulsifiable concentrate containing 58 percent active ingredient and42 percent inert ingredient.
2. The total quantity of AI applied is
0.58 * 3,629 kg lb = 2,105 kg (4,640 lb) of diazinon applied
2,105 kg = 2.105 megagrams (Mg); 1 Mg = 1.1 tons
2,105 Mg * 1.1 tons/Mg = 2.32 tons of diazinon applied
From Table 4-2, the vapor pressure of diazinon is 6 x 10!5mmHg. UsingTable 4-3, the emission factor for AIs with vapor pressures between 1 x 10!6
and 1 x 10!4 during a 30-day interval after application is 350 kg/Mg
4-41
(700 lb/ton) applied. The estimated total quantity of diazinon volatilized is737 kg (1,624 lb) over the 30-day interval.
3. From the label, it can be determined that the inert content is 42 percent andTable 4-4 shows that the average VOC content of the inert portion ofemulsifiable concentrates is 56 percent.
Total quantity of emissions due to inert VOC ingredients:0.42 * 3,629 kg * 0.56 = 854 kg (1,882 lb) of VOC inert ingredients
One hundred percent of the VOC inert ingredients emissions is assumed tovolatilize within 30 days.
4. The total quantity of emissions during this 30-day interval is the sum of theemissions due to VOC inert ingredients and AI. In this example, the totalquantity of emissions is 854 kg (1,882 lb) plus 737 kg (1,624 lb), or 1,591 kg(3,506 lb).
REFERENCES FOR SECTION 4
1. A. W. Taylor et al., "Volatilization of Dieldrin and Heptachlor Residues from FieldVegetation," Journal of Agricultural and Food Chemistry, 25(3):542-548, 1977.
2. J. Maybank et al., "Spray Drift from Agricultural Pesticide Applications," Journal ofthe Air Pollution Control Association, 28(10):1009-1014, 1978.
3. G. H. Willis et al., "Seasonal Disappearance and Volatilization of Toxaphene andDDT from a Cotton Field," Journal of Environmental Quality, 12(1):80-85, 1983.
4. U. Kiigemagi and L. C. Terriere, "Losses of Organophosphorus Insecticides DuringApplication to the Soil," Bulletin of Environmental Contamination and Toxicology,6(4):336-342, 1971.
5. W. R. Bohn, "The Disappearance of Dimethoate from Soil," Journal of EconomicEntomology, 37(6):798-799, 1964.
6. A. W. Taylor et al., "Volatilization of Dieldrin and Heptachlor from a Maize Field."Journal of Agricultural and Food Chemistry, 24(3):625-631, 1976.
7. D. E. Glotfelty et al., "Volatilization of Surface-Applied Pesticides from Fallow Soil,"Journal of Agricultural and Food Chemistry, 32:638-643, 1984.
8. M. M. Cliath et al., "Volatilization of S-Ethyl-N,N-Dipropylthiocarbamate from Waterand Wet Soil During and After Flood Irrigation of an Alfalfa Field," Journal ofAgricultural and Food Chemistry, 28:610-613, 1980.

4-42
9. R. A. Gray and A. J. Weierich, "Factors Affecting the Vapor Loss of EPTC fromSoils," Weeds, 13:141-145, 1965.
10. G. W. Ware et al., "Pesticide Drift IV. On-Target Deposits from Aerial Applicationof Insecticides," Journal of Economic Entomology, 63(6):1982-1983, 1970.
11. R. Grover et al., "Fate of 2,4-D Iso-Octyl Ester After Application to a Wheat Field,"Journal of Environmental Quality, 14(2):203-210, 1985.
12. G. H. Willis et al., "Toxaphene Volatilization from a Mature Cotton Canopy,"Agronomy Journal, 72:627-631, 1980.
13. M. Majewski et al., "Field Comparison of an Eddy Accumulation and anAerodynamic-Gradient System for Measuring Pesticide Volatilization Fluxes,"Environmental Science and Technology, 27(1):121-128, 1993.
14. L. J. Ross et al., "Volatilization, Off-Site Deposition, and Dissipation of DCPA inthe Field," Journal of Environmental Quality, 19:715-722, 1990.
15. A. W. White et al., "Trifluralin Volatilization Losses from a Soybean Field." Journalof Environmental Quality, 6(1):105-110, 1977.
16. Alternative Control Technology Document: Control of VOC Emissions from theApplication of Agricultural Pesticides, Report No. EPA-453/R-92-011,U.S. Environmental Protection Agency, Research Triangle Park, NC, March 1993.
17. R. D. Wauchope et al., "The SCS/ARS/CES Pesticide Properties Database forEnvironmental Decision-Making," Reviews of Environmental Contamination andToxicology, G. W. Ware, ed., Vol. 123, Springer-Verlag, NY, 1992.
18. W. A. Jury et al., "Use of Models for Assessing Relative Volatility, Mobility, andPersistence of Pesticides and Other Trace Organics in Soil Systems," HazardAssessment of Chemicals:Current Developments, 2:1-43, 1983.
19. W, A. Jury et al., "Behavior Assessment Model for Trace Organics in Soil: I. ModelDescription," Journal of Environmental Quality, 12(4):558-564, 1983.
20. W. A. Jury et al., "Behavior Assessment Model for Trace Organics in Soil: II.Chemical Classification and Parameter Sensitivity," Journal of EnvironmentalQuality, 13(4):567-572, 1984.
21. W. A. Jury et al., "Behavior Assessment Model for Trace Organics in Soil: III.Application of Screening Model," Journal of Environmental Quality, 13(4):573-579,1984.

4-43
22. L. R. Suntio et al., "Critical Review of Henry's Law Constants for Pesticides,"Reviews of Environmental Contamination and Toxicology, 103:1-59, 1988.
23. California Environmental Protection Agency, Department of Pesticide Regulation,Sacramento, CA. Written communication to D. Safriet, U. S. EnvironmentalProtection Agency, Research Triangle Park, NC. December 6, 1993.
24. Farm Chemicals Handbook, 1992, Meister Publishing Company, Willoughby, OH 44094.
25. Agricultural Chemical Usage: 1991 Field Crops Summary, U.S. Department ofAgriculture, Washington, DC, March 1992.

4-44
OTHER LITERATURE SURVEYED
The following documents were surveyed, but were not cited in Section 4 for oneof the following reasons: (a) they were used for general guidance on pesticidevolatilization rates; (b) they did not contain field measurements; or (c) more recentsimilar field measurements were available on the pesticide.
! Methods for Assessing Area Source Emissions in California, Emission InventoryBranch of the State of California Air Resources Board, September 1991.
! D. E. Glotfelty et al., "Distribution of Several Organophosphorus Insecticides andTheir Oxygen Analogues in a Foggy Atmosphere," Environmental ScienceTechnology, 24(3):353-357, 1990.
! Final Report: Air Pollution Emissions Associated with Nonsynthetic HydrocarbonApplications for Pesticidal Purposes in California, Volume 2, ARB ContractNo. A7-173-30, prepared for the California Air Resources Board by EurekaLaboratories (Sacramento, CA), April 1980.
! S. Leung et al., Air Pollution Emissions Associated with Pesticide Applications inFresno County, ARBA7-047-30, prepared for the California Air Resources Board, byEureka Laboratories, December 1978.
! B. C. Turner et al., "Volatilization of Microencapsulated and Conventionally AppliedChloropropham," Agronomy Journal, 70:933-937, 1978.
! W. F. Spencer et al., "Pesticide Volatilization," Residue Reviews, 49:1-47, 1973.
! G. H. Willis et al., "Volatilization of Dieldrin from Fallow Soil as Affected by DifferentSoil Water Regimes," Journal of Environmental Quality, 1(2):193-196, 1972.
! J. H. Caro et al., "Measurement of Pesticide Concentrations in Air Overlying aTreated Field," pp. 72-77. In B. Westley (ed.), Proceedings of InternationalSymposium on Identification and Measurement of Environmental Pollutants, NaturalResources Council of Canada, Ottawa, April 1972.
! G. H. Willis et al., "Volatilization of Soil-Applied DDT and DDD from Flooded andNonflooded Plots," Pesticides Monitoring Journal, 4(4):204-208, 1971.
! G. S. Hartley, "Evaporation of Pesticides," In Pesticidal Formulations Research,Physical and Colloidal Chemical Aspects, Advanced Chemical Series, 86(115),1969.
5-1
SECTION 5
PROPOSED AP-42 SECTION 9.2.2
[See instead current AP-42 Section 9.2.2.]