emission development strategy 2050
TRANSCRIPT

December 2018
SOUTH AFRICA’S LOW-
EMISSION
DEVELOPMENT
STRATEGY 2050

2
TABLE OF CONTENTS
1 INTRODUCTION ...................................................................................................................................................... 6
2 THE INTERNATIONAL CONTEXT .............................................................................................................................. 8
2.1 South Africa Ratified to the UNFCCC ..................................................................................................................... 8
2.2 Copenhagen Accord, 2009 ................................................................................................................................... 9
2.3 The “Paris Agreement” and Nationally Determined Contributions ................................................................................ 9
3 SOUTH AFRICA’S APPROACH TO ADDRESSING CLIMATE CHANGE ........................................................................ 10
3.1 Current State of Affairs ...................................................................................................................................... 10
3.2 National Development Plan 2030......................................................................................................................... 12
3.3 National Climate Change Response Policy ........................................................................................................... 13
3.4 Implementation of climate change responses through Sustainable Development Goals ................................................ 13
3.5 Climate Change Mitigation System ...................................................................................................................... 14
3.6 Climate Change Bill ........................................................................................................................................... 15
4 LONG-TERM VISION OF SOUTH AFRICAN LEDS/VISION STATEMENT ...................................................................... 16
5 MEASURES TO DRIVE LOW CARBON DEVELOPMENT IN THE ENERGY SECTOR ..................................................... 17
5.1 Energy Sector Overview .................................................................................................................................... 17
5.2 Energy Supply Sectors ...................................................................................................................................... 19
5.2.1 The emissions associated with energy supply .............................................................................. 19
5.2.2 Measures to address the energy supply related emissions ....................................................... 20
5.2.2.1 Integrated Resource Plan ............................................................................................................. 20
5.2.3 Renewable Energy ............................................................................................................................ 21
5.2.4 Measures to address liquid fuels emissions .................................................................................... 22
5.3 Energy Demand Sectors Measures ...................................................................................................................... 23
5.3.1 Emissions associated with the energy demand ........................................................................... 23
5.3.2 Measures to address the energy demand related emissions ................................................... 24
5.4 Building Climate Resilience in the Energy Sector ................................................................................................... 29
5.5 Building Climate Resilience in the Transport Sector ................................................................................................ 30
6 MEASURES TO DRIVE LOW CARBON DEVELOPMENT IN THE INDUSTRY SECTOR ................................................... 31
6.1 Industry Sector Overview ................................................................................................................................... 31
6.2 Emissions associated with industry sector ............................................................................................................. 32
6.3 Measures to address industry sector emissions ..................................................................................................... 33
6.4 Building Climate Resilience in the Industry Sector .................................................................................................. 35
7 MEASURES TO DRIVE LOW CARBON DEVELOPMENT IN THE AFOLU SECTOR ........................................................ 36
7.1 AFOLU Sector Overview .................................................................................................................................... 36
7.2 The emissions associated AFOLU sector .............................................................................................................. 38
3
7.3 AFOLU Sector Measures ................................................................................................................................... 39
7.4 Building Climate Resilience in the AFOLU Sectors ................................................................................................. 40
8 MEASURES TO DRIVE LOW CARBON DEVELOPMENT IN THE WASTE SECTOR ....................................................... 42
8.1 Waste Sector Overview ..................................................................................................................................... 42
8.2 Emission associated with the Waste sector ........................................................................................................... 43
8.3 Measures in the Waste Sector ............................................................................................................................ 44
8.4 Building Climate Resilience in the Waste Sector .................................................................................................... 45
9 CROSS-CUTTING MEASURES TO DRIVE LOW CARBON DEVELOPMENT IN SOUTH AFRICA...................................... 47
9.1 Carbon Dioxide Vehicle Emission Tax, 2010 ......................................................................................................... 47
9.2 Carbon Tax ...................................................................................................................................................... 47
10 RESEARCH, DEVELOPMENT AND INNOVATION TO SUPPORT THE LOW CARBON DEVELOPMENT ........................... 48
10.1 Research Driving Low Carbon Development ......................................................................................................... 48
11 “JUST TRANSITION” TO LOW CARBON DEVELOPMENT” ......................................................................................... 51
12 BUILDING A CLIMATE/LOW CARBON DEVELOPMENT CULTURE .............................................................................. 52
13 CLIMATE FINANCE................................................................................................................................................ 53
14 INSTITUTIONAL ARRANGEMENTS FOR THE SOUTH AFRICAN LEDS ....................................................................... 56
15 PROVINCIAL AND LOCAL GOVERNMENT ............................................................................................................... 58
16 UPDATING OF THE SOUTH AFRICAN LEDS ............................................................................................................ 59
17 REFERENCES ...................................................................................................................................................... 59

4
LIST OF FIGURES
Figure 1: GHG Emissions per Key Sector (2012)……………………………………………………………11
Figure 2: South Africa’s GHG Emissions Trends from 2000 – 2012 (Mt CO2e)………………………….11
Figure 3: Industrial sector GHG Emissions between 2000 to 2012………………………………………...33
Figure 4: The Contribution of Each of Land-Cover Type in South Africa
in terms of Spatial Area……………………………………………………………………………..37
Figure 5: AFOLU Sector Emissions (average between 2000 – 2012)……………………………………..39
Figure 6: Waste Sector GHG Emissions (average between 2000 – 2012)………………………………..44
Figure 7: International Climate Finance Support South Africa has received from 2000 – 2014………...55

5
LIST OF TABLES
Table 1: Energy efficiency goals outlined in the NEES for each sector (DOE, 2016)…………………….25
Table 4: Institutional Arrangements to Address Climate Change Response Actions……………………..56

6
1 INTRODUCTION
Robust scientific evidence shows that the earth’s climate system is changing as a result of anthropogenic
greenhouse gas (GHG) emissions. Concentrations of GHGs in the earth’s atmosphere have been rising steadily
since the industrial revolution circa 1760, mainly as a result of the burning of fossil fuels, industrial processes,
deforestation and agricultural activities. Already in the 19th century, scientists discovered the radiative properties
of GHGs and their ability to cause global warming. Since then, an extensive body of scientific research from
climate scientists worldwide has confirmed the relationship between human-induced GHG emissions and higher
global average surface temperatures (IPCC, 2007; IPCC, 2014).
Globally on a business-as-usual (BAU) trajectory, temperatures are likely to increase significantly by more than
2°C above pre-industrialised levels, which is considered the critical limit for risking irreversible damage to the
planet. These damages range from, but are not limited to, significant rises in sea level, ocean acidification, loss
of biodiversity, extreme weather events, fresh water shortages, spreading of infectious diseases and heightened
risks of human depredation and conflict.
Along with other developing nations, South Africa is particularly vulnerable to the impacts of climate change.
Under unmitigated GHG emissions scenarios, significant warming of up to 5 – 8°C is projected over the interior
of the country of up to 5 – 8°C by the end of this century (DEA, 2013). This will lead to drier conditions in the west
and south of the country and wetter conditions in the east. Rainfall patterns will also become more variable and
unpredictable. If left unaddressed, climate change is likely to come at a significant cost to the economy and
society. This includes impacts on water resources, food production and increased vulnerabilities of impoverished
communities. For this reason, the South African government regards climate change as a considerable threat to
the country and its socio-economic development and has the potential to undo or undermine many of the
advances made in recent years.
Climate change being a global challenge, requires a coordinated solution through a concerted and cooperative
efforts from all countries. In August 1997, South Africa joined the majority of countries in the international
community in ratifying the United Nations Framework Convention on Climate Change (UNFCCC) – with the view
to make its fair contribution towards the global effort to tackle the challenge posed by climate change.
In December 2015, a total of 195 participating countries including South Africa negotiated and adopted the Paris
Agreement during the 21st session of the Conference of the Parties (COP 21) of the UNFCCC. (UNFCCC, 2015).
7
Article 4.19 of the Paris Agreement encourages its signatories to formulate and communicate long-term low GHG
emission development strategies (LEDS) to the UNFCCC by 2020, mindful of Article 2 of the Paris Agreement
and taking into account their common but differentiated responsibilities and respective capabilities, in the light of
different national circumstances.
South Africa’s Low-Emission Development Strategy (SA LEDS) 2050
South Africa’s Low-Emission Development Strategy (SA LEDS) 2050 is based on years of work on climate change
in the country. To support SA’s climate change response, the country published a National Climate Change
Response Strategy in 2004 (DEA, 2004). This was followed by extensive scientific research and analyses to
inform SA’s policy approach on climate change.
The SA LEDS 2050 aims to succinctly build upon this foundation and articulate the path going forward in order to
place the country on a low-carbon trajectory, while at the same time ensuring broader socio-economic
development. This SA LEDS 2050 has been developed within the context of an objective, which can drive change
through co-benefits such as job creation and socio-economic upliftment. The Strategy narrates how various
sectors of the economy would implement policies and measures to reduce emissions up to 2050 horizon. While
principally focused on low-carbon development, the strategy will also take into account how mitigation options
may affect or be affected by adaptation measures and potential combined effects of these interventions.
The SA LEDS 2050 should be seen as a dynamic and flexible document. The strategy takes cognisance of the
extensive body of work that has already been developed within the country over the last two decades and focuses
on how South Africa can implement what has already been defined in its transitions to a low-emission and climate
resilient society and economy. These include measures that the government is already implementing through a
comprehensive set of strategies, policies and sector plans within the key sectors of the economy. The full
execution of these measures, will, among others, depend on international support, including technology transfer,
skills and capacity building as well as financial support.
Research, technology development and transfer would be critical for realising the country’s climate change and
developmental goals. Thus, the South African LEDS recognises this and outlines the research, technology
development and transfer needs as the country transit to the low carbon emissions development.

8
South Africa’s transition towards a low-carbon development necessitates an ongoing evaluation of the potential
impact of various measures being implemented have on the country’s socio-economic development. In order to
further increase and harness the opportunities that the transition to low-carbon development will bring, the South
African government intends to further build on existing programmes, which have increased employment
(particularly for the youth) and facilitated skills and knowledge transfer as well as capacity building in the most
vulnerable areas (“Just Transition). To understand the impact of climate change on jobs, both positive and
negative, and climate change responses by sector and location, South Africa would want to urgently finalise the
National Employment Vulnerability Assessment (NEVA), and thereafter Sector Job Resilient Plans (SJRPs). To
build a sustainable low carbon development culture, South Africa will continue to implement education, training
and public awareness programmes on climate change and its effects to promote and facilitate scientific, technical
and managerial skills as well as public access to information, public awareness of and participation in addressing
climate change.
The implementation of all the climate actions that South Africa will undertake in executing the SA LEDS 2050 will
necessitate effort to mobilise finance for the funding of mitigation and adaptation measures
The SA LEDS 2050 will be updated at regular intervals in response to social, economic and policy developments
over time. The implementation will therefore be regularly updated, in keeping with the Paris Agreement, national
circumstances at the time and reflecting the learning process.
2 THE INTERNATIONAL CONTEXT
2.1 South Africa Ratified to the UNFCCC
Having ratified both the United Nations Framework Convention on Climate Change (UNFCCC) and its Kyoto
Protocol, in 1997 and 2002, respectively, South Africa committed to continue to meaningfully engage in the
multilateral negotiations to further strengthen and enhance the international response to climate change. The
Government specifically aims to continue its efforts to strengthen and ensure the full implementation of the
UNFCCC through additional multi-lateral rules-based and legally-binding international agreements. South Africa
believes that these should effectively limit the average global temperature increase to below a maximum of 2°C
above preindustrial levels. In so doing, South Africa will strive to ensure that such agreements are inclusive, fair
and effective; reflect a balance between adaptation and mitigation responses; and recognise that solving the
climate problem will only be possible if developing countries’ priorities of eradicating poverty and promoting

9
sustainable development are taken into consideration. This is the sprit in which the South African LEDS has been
developed.
2.2 Copenhagen Accord, 2009
As a responsible global citizen with moral obligations under the UNFCCC and its Kyoto Protocol, South Africa
committed to contributing its fair share to global GHG mitigation efforts in order to keep the temperature increase
well below 2°C. In this regard, on 6 December 2009, the President announced that South Africa will implement
mitigation actions that will collectively result in a 34% and a 42% deviation below its “Business As Usual”
emissions growth trajectory by 2020 and 2025 respectively. In accordance with Article 4.7 of the UNFCCC, the
extent to which this outcome can be achieved depends on the extent to which developed countries meet their
commitment to provide financial, capacity-building, technology development and technology transfer support to
developing countries. With financial, technology and capacity-building support, this level of effort will enable South
Africa’s GHG emissions to peak between 2020 and 2025, plateau for approximately a decade and decline in
absolute terms thereafter (peak, plateau and decline (PPD) emission trajectory range).
2.3 The “Paris Agreement” and Nationally Determined Contributions
South Africa submitted its first Nationally Determined Contribution (NDC) in September 2015, which considers
both developmental needs and climate change imperatives (DEA, 2015). The NDC contains both the country’s
adaptation and mitigation responses to climate change. The mitigation component of the NDC transitions from “a
deviation from business as usual” commitment to a peak, plateau and decline (PPD) emission trajectory range.
Based on national policy, the NDC reaffirmed the country’s commitment for GHG emissions to peak between
2020 to 2025, plateau between 2026 to 2035 and decline from 2036 onwards. This strategic policy direction and
international undertaking has informed a National GHG Emissions Trajectory Range, projected to 2050, to be
used as the benchmark against which the efficacy of mitigation action will be measured. The Trajectory Range
informed what is envisioned as the South African LEDS long-term emission reduction objective.
The Paris Agreement, 2015 sets the twin goal of limiting global average temperature increase above pre-industrial
levels to well below 2°C, and to pursue strong efforts to limit the increase to 1.5°C. To fulfil their obligations under
the Paris agreement, signatories are required to communicate their NDCs to the UNFCCC every five years,
outlining country-specific climate change goals, taking notice of national circumstances and capabilities.

10
Article 4.19 of the Paris Agreement calls on signatories to formulate and communicate long-term low GHG
emission development strategies (LEDS), mindful of Article 2 of the Paris Agreement and taking into account their
common but differentiated responsibilities and respective capabilities, in the light of different national
circumstances. Additionally, Conference of Parties Decision 1/CP.21, paragraph 35, invites parties to
communicate, by 2020, to the secretariat mid-century, long-term low GHG emission development strategies in
accordance with Article 4.19, of the Paris Agreement, and requests the secretariat to publish on the UNFCCC
website Parties’ low GHG emission development strategies as communicated. South Africa’s LEDS is being
developed to also facilitate the implementation of the mitigation part of South Africa’s NDC and its timeframes are
aligned with that of the NDC (will be reviewed every five years).
3 SOUTH AFRICA’S APPROACH TO ADDRESSING CLIMATE CHANGE
3.1 Current State of Affairs
South Africa’s GHG emissions is 1.1 percent of the global emissions, whereas the country’s share of global GDP
is only 0.6 percent (UCT, 2017). The latest National Greenhouse Gas Emission Inventory (2012) shows that
South Africa’s total emissions increased from approximately 434 Mt CO2e in 2000 to 518 Mt CO2e in 2012 (DEA,
2017c). This is equivalent to a total increase of approximately 19 percent, or 1.6 percent annually over this period.
With 68 percent, the energy sector accounted for the lion share of the country’s overall emissions in 2012. Industry
accounted for 13 percent, transport for 9 percent, agriculture, forestry and other land use (AFOLU) for 6 percent
and the waste for 4 percent – See Figure 1 below:

11
Figure 1: GHG Emissions per Key Sector (2012)
Sources: DEA (2017c)
The waste sector, transport and energy contributed the most to emissions growth between 2000 and 2012. GHG
emissions within the waste sector increased by 78 percent, emissions from the transport sector by 32 percent
and those from the energy sector by 28 percent over this period. The industrial sector emission remained roughly
stable and AFOLU decreased by 32 percent.
Figure 2 – South Africa’s GHG Emissions Trends from 2000 – 2012 (Mt CO2e)
Source: DEA (2017c)
67.8
12.89.2
6 4.2
Energy Industry Transport AFOLU Waste

12
To reduce the rise in GHG emissions and achieve meaningful reductions, the government of South Africa has
implemented a comprehensive set of strategies, policies and sector plans within key sectors of the economy.
These include, among others, Integrated Resource Plan (IRP), Energy Efficiency Strategy, the Industrial Policy
Action Plan (IPAP), the Green Transport Strategy (GTS), the Climate Change Adaptation and Mitigation Plan
(CCAMP) for the South African Agricultural and Forestry Sectors and National Waste Management Strategy
(NWMS). Together, these policies should drive far-reaching change throughout the economy and society and
further the country’s low-carbon development agenda. Thus, the South African LEDS, therefore focusses on these
existing and planned policies and measures being implemented or planned for implementation by government.
3.2 National Development Plan 2030
The overarching objective of the National Development Plan 2030 (NDP, 2030) is to eliminate poverty and reduce
inequality by 2030. The plan recognises that South Africa's development is affected by what happens in the region
and the world. Chapter 5 of the NDP seeks to provide high level guidance to ensure that by 2030 South Africa is
an environmentally sustainable society, with an expanded low-carbon economy and reduced emissions while at
the same time reducing poverty, unemployment and social inequities. Chapter 5 provides a set of guiding
principles, which demand that the transition be just, ethical, sustainable, transformative while taking a strategic,
regional and ecosystems approach during a managed transition.
The National Development Plan also outlines various other climate change mitigation goals and proposed actions
to meet the country’s environmental sustainability and resilience needs. These include:
• Achieve the peak, plateau and decline trajectory for GHG emissions, with the peak around 2025;
• By 2030, an economy-wide carbon price should be entrenched;
• Zero emission building standards by 2030; and
• Absolute reductions in the total volume of waste disposed to landfill each year.
Furthermore, the National Development Plan also advocates for co-benefit goals which include increasing energy
security and enhancing socio-economic and environmentally sustainable growth. The focus of the South African
LEDS and its implementation will be done with the intentions to also fulfil NDP objectives.

13
3.3 National Climate Change Response Policy
In 2011, the South African government published a National Climate Change Response Policy (NCCRP) which
is government’s comprehensive policy framework for responding to climate change, providing a strategic
approach to both mitigation and adaptation. It presents the vision for an effective climate change response and
the long-term transition to a climate-resilient, equitable and internationally competitive lowr-carbon economy and
society. This vision is premised on government’s commitment to sustainable development and a better life for all.
The Response Policy outlines a strategic response to climate change within the context of South Africa’s broader
national development goals, which include economic growth, international economic competitiveness, sustainable
development, job creation, improving public and environmental health, and poverty alleviation. The Policy
culminated from an iterative and participatory policy development process that was started in October 2005 –
involved all stakeholders, including national departments, provincial and local governments, parastatals,
academia, research institutions, business, civil society and labour.
The Response Policy highlights the challenges facing development in South Africa brought on by the physical
effects of climate change, while recognising the role to be played by the country in reducing emissions. The two
main objectives of the Policy are to:
• Effectively manage inevitable climate change impacts through interventions that build and sustain South
Africa’s social, economic and environmental resilience and emergency response capacity; and
• Make a fair contribution to the global effort to stabilise greenhouse gas concentrations in the atmosphere
at a level that avoids dangerous anthropogenic interference with the climate system, within a timeframe
that enables economic, social and environmental development to proceed in a sustainable manner.
3.4 Implementation of climate change responses through Sustainable Development Goals
South Africa subscribes to the Sustainable Development Goals (SDGs) and would implement these Goals as it
transitions to a low-carbon development. These SDG goals and targets cover a broad range of sustainable
development issues that are in line with how South Africa addresses climate change. Examples are: ending
poverty and hunger, improving health and education, making cities more sustainable, combating climate change,
and protecting oceans and forests. In addition, Goal 7 of the SDGs is “Affordable and Clean Energy” and has

14
targets such as access to modern energy services, increase share of renewable energy, double improvement of
energy efficiency, etc. All these measures/interventions form part of the country’s plan as it transition to a low-
carbon development and they will be addressed in a more holistic manner. South Africa believes that there is a
very close alignment between the National Climate Change Policy Responses and the 17 sustainable
development goals and as such the implementation of either the objectives must always be done or configured
together.
3.5 Climate Change Mitigation System
The overarching climate change policy that will determine South Africa’s low-carbon development is the post-
2020 mitigation system. The development of this mitigation system is currently underway and this will include a
range of measures as contemplated in the NCCRP. The system is designed in such a manner that achieves the
overall national objective, of the long-term emissions trajectory range for the whole economy to peak between
2020 and 2025, plateau between 2026 and 2035, and decline thereafter. This is in keeping with our international
commitments submitted under the Paris Agreement of 2015 in the form of an NDC.
The system is introduced in phases. Phase one (2016-2020) is voluntary as there is no legal basis yet to set
emission limits for sectors or companies. The second and subsequent phases (i.e. the post-2020 period) will
become mandatory as and when climate change response legislation in a form of the Climate Change Bill/Act is
formally approved by government.
The post-2020 mitigation system includes Sectoral Emission Targets (SETs) for key economic sectors and
Carbon Budgets (CB), which allocate a certain amount of carbon space to individual companies. A variety of other
measures are contemplated to support and/or complement the CB system, including a national carbon tax (CT),
which is set to enter into force in the near future. With these instruments in place, the country should be able to
reduce emissions in line with overall national goal and contributing towards South Africa’s NDC.
The SETs will be determined for three rolling five-year periods. National government departments (i.e. so-called
SET departments) will be allocated responsibility to ensure that emissions remain within the limits of the first five-
year period. These departments will be tasked with developing and implementing Policies and Measures (PAMs)
to ensure emissions from relevant activities within the sector remain within SET limits.

15
The subsequent two five-year SETs serve to provide a signal to sectors regarding what carbon space will be
available to them, and all three future SETs (i.e. two that have already been determined and one new SET for the
third five-year period) will be updated at the end of every five-year SET period. The SETs are aligned with
emissions categories in the national GHG inventory according to the IPCC (2006) guidelines. Their stringency will
be based on an in-depth assessment of the mitigation potential, best available mitigation options, science,
evidence and a full assessment of the costs and benefits, as specified in the NCCRP.
In addition to these overall targets for sector emission, the CBs will set a maximum volume of emissions from
certain activities that individual entities are allowed to emit over three rolling five-year periods. By assigning a CB
to an entity, a signal is provided as to the degree of GHG mitigation that is required within a specific time period.
Furthermore, by providing entities or companies with an understanding of how the budgets are likely to be
assigned in future phases in line with the overall SETs, as well as how this will be impacted by the shape of the
trajectory, they are sensitised to how mitigation requirements may change in the future. The system thereby
provides an opportunity for companies to plan ahead and adapt before the actual carbon space is allocated and
becomes binding.
3.6 Climate Change Bill
The South African government is in a process of developing a Climate Change Bill (CCB). Upon adoption, the Bill
will form the legislative foundation for the country’s mitigation system referred to above. The Bill provides for future
review and determination of the national greenhouse gas emissions trajectory; determination of sectoral
emissions targets for emitting sectors and subsectors; determination of a threshold for the purposes of the
allocation of carbon budgets to emitting companies. Furthermore, the Bill makes provision for the development of
plans to phase down or phase out the use of synthetic greenhouse gases – to support the implementation of the
Kigali Amendments to the Montreal Protocol.
The Bill/Act will provide for regulating actions that are to be undertaken as South Africa implements its LEDS.
16
4 LONG-TERM VISION OF SOUTH AFRICAN LEDS/VISION STATEMENT
The overall strategic approach for South Africa’s climate change response is needs driven and customised;
developmental; transformational, empowering and participatory; dynamic and evidence-based; balanced and cost
effective; and integrated and aligned. It is therefore important that the long-term vision of South African LEDS
2050 takes these principles into consideration, while also taking cognisance of the country’s international climate
change commitments and aspirations.
The vision for the SA LEDS 2050 takes into account core messages from a climate change, developmental and
socio-economic perspectives – from the following national and international commitments:
• UNFCCC – to prevent concentrations of GHG in the atmosphere at a level that would result in
dangerous anthropogenic interference with the climate system and urge countries to respond in
accordance with their common but differentiated responsibilities and respective capabilities;
• Paris Agreement – to limit the global average temperature increase above pre-industrial levels to well
below 2°C, and to pursue efforts to limit the increase to 1.5°C and the communication by Countries, by
2020, their mid-century LEDS to the global community;
• NDC – to confirm the peak, plateau and decline GHG emissions trajectory range whereby South Africa’s
emissions by 2025 and 2030 will be in a range between 398 and 614Mt CO2-eq;
• NDP – to eliminate poverty and reduce inequality by 2030, recognising that South Africa is not only a
contributor to GHG emissions, but also particularly vulnerable to the effects of climate change
specifically when it concerns the poor, women and children;
• NCCRP – to make a fair contribution to avoiding dangerous anthropogenic interference with the climate
system, within a timeframe that enables economic, social and environmental development to proceed
in a sustainable manner;
• NSSD (National Strategy on Sustainable Development) – to formulate a sustainability vision for the
country in which South Africa aspires to be a sustainable, economically prosperous and self-reliant
nation state that safeguards its democracy by meeting the fundamental human needs of its people.

17
The SA LEDS 2050 vision as distilled from the above summarised documents is as follows:
“Putting South Africa on a low-carbon growth path while making a fair contribution to the global effort to limit the
average temperature increase”.
Objectives of the South African LEDS
Mitigate the threats posed by climate change;
Support the implementation of policies and measures to reduce GHG emissions across sectors of the
economy and sustainable development goals in an integrated manner;
Provide strategic guidance as to which measures will be implemented to reduce GHG emissions in the
short, medium and long-term;
Provide a high-level plan on how South Africa would transition to a lower carbon development economy
in a “just transition” manner;
Building the low carbon development culture;
To mobilise finance for the funding of programmes to help South Africa achieve a low carbon
development;
5 MEASURES TO DRIVE LOW CARBON DEVELOPMENT IN THE ENERGY SECTOR
5.1 Energy Sector Overview
Coal is a predominant energy resource in South Africa. In 2014, the country’s total primary energy supply was
approximately 5,784 Petajoules (PJ), with fossil-fuels (i.e. coal, crude oil petroleum products and natural gas)
supplying about 87 percent of the country’s energy needs (DoE, 2015). According to the 2014 Energy
Sustainability Index, developed by the World Energy Council, South Africa is ranked 83rd on the Energy
Sustainability Index out of 129 countries. The low performance in environmental sustainability is due to the
electricity sector’s heavy reliance on coal and hence its high emission rates, while increasing petroleum prices,
coupled with rising electricity tariffs, informed the low score on energy equity (WEC, 2014).
18
Integrated Energy Planning
The country’s energy planning is primarily based on the Integrated Energy Plan (IEP). The IEP presents the
overall strategy for electricity, liquid fuels (i.e. petrol, diesel, and paraffin) and gas for the country. The plan
analyses current energy demand and consumption trends within the different sectors of the economy and uses
this to project the country’s future energy requirements.
Electricity
While the majority of households in South Africa are electrified, energy poverty is still a significant challenge. As
much as six million households are still without access to electricity (Stats SA, 2017a). Increasing access is a key
priority for the South African government. The Integrated Resource Plan (IRP) is the primary guiding document
informing the development of the South African electricity sector. It identifies the preferred generation
technologies (and assumed energy efficiency demand side management interventions) required to meet expected
electricity demand. Most of the electricity is generated from coal. In recent years, there has been an increasing
recognition of the potential for renewable energy sources to not only contribute to meeting future demand, but to
also reduce the current deficit in energy access mainly through off-grid rural renewable energy installations.
Liquid Fuels
South Africa's liquid fuels requirements are met through local refining of imported crude oil, sourced mainly from
the Middle East and other African countries. While the country is a net importer of crude oil, it has well-developed
refining capacity from which it produces liquid fuels such as petrol, diesel, residual fuel oil, paraffin and jet fuel.
Apart from the production of liquid fuels, crude oil is used to produce a variety of petrochemical products such as
lubricants, bitumen and solvents. In addition to imported crude oil, a large portion of the country’s liquid fuels
requirements are met through synthetic fuel produced from coal-to-liquids (CTL) and gas-to-liquids (GTL)
processes. Inevitably, being a net crude oil importer leaves South Africa vulnerable to price fluctuations and
volatility on global oil markets.
Gas
Natural gas plays a relatively minor role in the primary energy supply. Local production is mainly from the
Bredasdorp Basin, which lies offshore to the country’s southern coast line. This basin supplies natural gas to

19
PetroSA’s Mossel Bay GTL facility. Apart from Bredasdorp Basin, the bulk of the country’s natural gas demand is
met through imports from Mozambique’s Temane and Pande gas fields. The gas is imported via a high-pressure
pipeline and supplied to industrial and commercial customers mainly within the country’s Gauteng Province.
Renewable energy
In parallel to capacity expansion from within the national utility a number of Independent Power Producers (IPPs)
has entered the electricity market predominately for the generation of renewable energy. The relative number of
renewables has been growing from 0.3% to 5.2% over the last decade. The main contributor to the growth in the
contribution of renewables is the Renewable Energy Independent Power Producer Procurement Programme
(REIPPP). Due to South Africa’s location, geography and size, multiple renewable energy resources are available.
South Africa’s long coastline provides favourable conditions for wind power and the semi-arid climate and flat
terrain receives high irradiation making it ideal for solar power. Biomass opportunities are available along the east
coast which is tropical and characterised by large wood and sugar plantations. Small-scale hydropower is also a
possibility.
5.2 Energy Supply Sectors
5.2.1 The emissions associated with energy supply
5.2.1.1 Electricity generation
Projections show an increased industrial demand for electricity from 2020 to 2030, the residential sector
(movement between income groups, electrification rates and moving from biomass) and by the electrification of
transport after 2030. The low demand growth seen in South Africa over the last decade, coupled with new coal
capacity coming online, means that there is a limited requirement for new build until after 2025.
Given that a number of South Africa’s current coal-fired power stations will be retired between 2030 and 2050,
large investments in additional generation capacity will be needed in order to meet the projected electricity
demand and sustain economic growth. While coal will still be a part of the country’s electricity mix in 2050, the
anticipated additions of significant low-carbon generation capacity to the country’s current electricity generation
base will substantially lower the country’s GHG emissions.

20
5.2.1.2 Liquid supply
South Africa has six main liquid fuel producers: Sapref, Sasol-Secunda, Enref, Natref, Chevref and PetroSA
(SAPIA, 2017). PetroSA and Sasol-Secunda produce synthetic fuels from gas and coal, respectively, while the
other producers are crude oil refineries. Limited information is available on the actual production volumes and
production by type of liquid fuel. Information for the Natref refinery shows that petroleum products produced by
the refinery included jet fuel, diesel, heavy fuel oil and petrol, accounting for 23% 36%, 4% and 37% respectively.
Liquefied coal emits twice as much carbon dioxide as burning oil. Coal to Liquid technology also emits large
amounts of sulphur dioxide, which is a threat to human health.
5.2.2 Measures to address the energy supply related emissions
5.2.2.1 Integrated Resource Plan
Government is already in the process of diversifying the country’s electricity generation mix and promoting the
use of renewable energy technology as well as other low-carbon technologies in line with the mandate provided
in the Integrated Resource Plan (IRP). The IRP is the primary guiding document informing the development of
the South African electricity sector. It identifies the preferred generation technologies (and assumed energy
efficiency demand side management interventions) required to meet expected electricity demand in the country.
The plan is being updated to reflect changing macroeconomic realities as well as the technological progress of
electricity generation and energy efficiency options. The IRP then takes a closer look at the country’s long-term
electricity demand and supply needs and determines the preferred mix of electricity generation sources (least-
cost options) which can meet future electricity demand projections. The plan also takes into account the important
role that energy-efficiency and demand-side interventions need to play not only in managing electricity demand,
but also in ensuring that the electricity generated is efficiently consumed.
The 2010 IRP is being updated and its update in a form of IRP 2018 just published for public comments
highlights a higher share of renewable energy technologies in the energy mix for the future – phasing down
the electricity capacity generated from coal.

21
Interventions
Implement 2500 MW hydro by 2030
Implement 1000 MW for PV and 1600 MW for wind annually for the period up to 2030
Implement 200 MW embedded generation, annually
5.2.3 Renewable Energy
Renewable Energy Independent Power Producers Procurement Programme
The increase in the share of renewable energy in the electricity mix in 2050 will continue to be driven through the
Renewable Energy Independent Power Producers Programme (REIPPP). The REIPPP is a competitive tender
process that is designed to incentivise renewable energy projects development. Government recently reaffirmed
its support for the programme by signing 27 more IPP contracts with renewable energy project developers. The
contracts were signed and mostly related to solar and wind projects expected to be developed in the near future.
Through the programme’s competitive bidding process for renewable energy capacity, a total of 102 independent
power producers (IPPs) have been selected as preferred bidders since its inception in 2011 and 6,376 MW in
renewable energy capacity has been procured from various technologies in the programme’s six bidding rounds
(IPPO, 2016). The bulk of this capacity has been procured from wind (i.e. 3,365 MW) and solar PV (i.e. 2,322
MW) projects, with the remainder being from solar CSP (i.e. 600 MW), biomass (i.e. 52 MW), small hydro (i.e. 19
MW) and landfill gas (i.e. 18 MW). At the moment, 51 IPP projects are operational and they are collectively adding
2, 738 MW to country’s national grid.
Eskom Renewable Energy Programme
In conjunction to the REIPPP, Eskom has an active research programme focussed on renewable energy
development. Eskom’s efforts in this regard have mainly been centred around the development of wind energy,
pumped storage and CSP projects. In 2013/2014, the company developed the Ingula Pumped Storage Scheme
near Van Reenen in the province of KwaZulu-Natal, which upon completion will be Africa’s largest pumped
storage scheme and the 14th largest in the world. The project comprises of four 333 MW pump turbines, three of

22
which are already operational, receiving water from a dam with a capacity to hold 22 million cubic metres (GCIS,
2017).
In addition to the pumped-storage power station, in 2015 Eskom developed the Sere Wind Farm which is currently
feeding 100 MW into the national grid. Plans to expand these projects and the commitment to develop new
renewable energy initiatives, demonstrates the organisation’s commitment to securing the country’s energy
supply in a sustainable manner, using a diverse mix of energy sources (Eskom, 2017).
5.2.4 Measures to address liquid fuels emissions
5.2.4.1 Biofuels Strategy
The Biofuels Industrial Strategy of the Republic of South Africa (2007) outlines Government’s approach to policy,
regulations and incentives for the development of a biofuel sector in the country. The strategy proposes a 2%
penetration level of biofuels in the national liquid fuel supply (400 million litres per annum), within five years of its
publication. While the biofuels strategy is an important component of South Africa’s response to climate change,
the strategy focusses on creating employment in the biofuels value chain, particularly in underdeveloped areas.
In support of the strategy, regulations were published in 2012 relating to the mandatory blending of bio-ethanol
or biodiesel with petroleum petrol and petroleum diesel, respectively, to produce a biofuel blend that may be sold
in South Africa. In particular, the regulations address the purchase process; specify the blending ratios for both
types of biofuel and list the type of records to be kept by licensees. The Regulations allow for the blending of
biofuels to the effect that the allowed minimum concentration of the biofuel in the final blended biofuel complies
with (i) the minimum concentration to be allowed for biodiesel blending, mainly 5% by volume; and (ii) the
permitted range for bio-ethanol blending, namely from 2% by volume up to 10% by volume.
Intervention
Undertake feasibility studies on the biofuels pricing framework that will inform incentives for production
of biofuels

23
5.3 Energy Demand Sectors Measures
5.3.1 Emissions associated with the energy demand
Preliminary projections done by the Energy Research Centre on the energy demand by various sectors suggest
that industry, transport and residential sectors are high energy-use sectors in South Africa (DEA, 2018d):
Overall GHG emissions in the commercial sector are likely to grow from 1.96 Megatonnes CO2-eq in 2015 to 2.74
Megatonnes CO2-eq in 2050. This is driven by GDP growth in the sector, though GHG emissions growth is lower
than the growth in energy use. Growth in GHG emissions is offset by the higher use of electricity and higher end-
use efficiency.
Residential sector GHG emissions declined from 2.02 Mt CO2-eq in 2015 to 1.29 Mt CO2-eq in 2050. Useful
energy demand increased over the period in the residential sector. This is driven by an increase in the number
of households classified as middle and high income, a higher electrification rate across the country and
increased use of electricity within households. By 2050, 99% of households will be electrified (grid-
connected).
The GHG emissions (both combustion and process emissions) from the industry sector grow from 57.8 Mt
CO2-eq in 2015 to 141.2 Mt CO2-eq in 2050. This is driven by an overall increase in demand for energy services
in industry of around 60% to 2050. The increase in energy demand by industry is dominated by direct coal
use (which dominates GHG emissions by 2050 in the entire energy system of South Africa) and electricity
use. Decarbonisation of the electricity supply would therefore offset higher energy use in industry, even as
direct coal use increases.
Looking at the transport sector, aviation fuel demand will grow in proportion with GDP growth. For the rest
of the transport sector, there is an increase in demand for transport services over the period up to 2050. In
the passenger transport sector, demand for private vehicle travel approximately doubles by 2050 while public
transport growth remains near constant (ERC, 2018). Similarly, road freight sector activity approximately
doubles with activity dominated by heavy road vehicles. The share of railed corridor freight remains constant
at approximately 9% up to 2050.

24
Energy GHG emissions from the agriculture sector are likely to grow from 2.48 Mt CO2-eq in 2015 to 5.26 Mt
CO2-eq in 2050. The sector grows at 4%, marginally above the annual average growth rate over the period to
2050. The increased sector growth results in a rise in the sector’s demand for electricity, diesel and coal, and
in its direct GHG emissions from the combustion of diesel and coal. Direct GHG emissions increase by about
3% per annum on average. Given that the GHG emissions from fuel combustion in agriculture are minute,
the sector therefore is likely to reach about 2% of South Africa’s energy combustion GHG emissions by 2050,
compared to 0.6% in 2015.
5.3.2 Measures to address the energy demand related emissions
5.3.2.1 Energy Efficiency
Government has put a number of interventions that are aimed at promoting energy efficiency in various sectors
of the economy. First, being the National Energy Efficiency Strategy (2005). This is a key guiding document
developed by government to support the implementation of energy efficiency measures in South Africa. It was
the first strategy to focus explicitly on energy efficiency in South Africa and sets a national energy efficiency target
(12% improvement by 2015) to be achieved through various enabling instruments and interventions. Important to
highlight from the implementation of this Strategy is that the cumulative, national energy efficiency savings of at
least 23% occurred between 2000 and 2012. These energy efficiency savings surpassed the target of 12%
outlined in the National Energy Efficiency Strategy.
Building on the National Energy Efficiency Strategy (2005), government is finalizing the post-2015 National
Energy Efficiency Strategy – which outlines a set of goals for energy efficiency improvements across the
economy. Table 1 below captures the proposed energy efficiency goals for various sectors/subsector. If
implemented, these would contribute towards reducing South Africa’s greenhouse gas emissions.

25
Table 1: Energy efficiency goals outlined in the NEES for each sector (DOE, 2016)
Sector/subsector Goal
Public buildings sector 50% reduction in specific energy consumption (measured as GJ
annual energy consumption per m2 of occupied floor area).
Municipal services 20% reduction in the energy intensity (measured as energy
consumption per capita of population served) of municipal service
provision. The specific services included are street lighting, traffic
lights, water supply and waste water treatment.
30% reduction in the fossil fuel intensity of municipality vehicle fleets
(measured as total fossil fuel consumption by municipal vehicles per
capita of population served).
Residential sector 33% reduction in the average specific energy consumption of new
household appliances purchased in South Africa
20% reduction in the average specific energy consumption of the
residential building stock
Commercial sector 37% reduction in the specific energy consumption (measured as GJ
annual energy consumption per m2 of lettable/habitable floor area)
Industry sector 16% reduction in the weighted mean specific energy consumption for
the manufacturing industry
40 PJ cumulative total annual energy saving from specific energy
saving interventions undertaken by in the mining subsector
Agriculture sector A saving of approximately 3% of total sector-wide electricity
consumption
1 PJ verified electricity saving from officially supported projects.
Transport sector 20% reduction in the average vehicle energy intensity (measured in
MJ/km) of the South African road vehicle fleet
Utilities (electricity)
sector
Reduce overall average distribution losses to below 8% nationally
Annual 10 PJ electricity generation from grid-connected cogeneration
and waste-heat recovery plant
The preliminary analysis undertaken by DEA (DEA, 2018d) reveals that greatest energy consumption impact of
the NEES is observed in electricity use by the industrial subsectors, followed by the commercial sector. The main
driver of the impact on GHG emissions from the NEES is therefore from avoided electricity-related GHG
emissions, particularly before 2030, where electricity is largely derived from coal.
26
Intervention
Full implementation of Post-2015 NEES measures
5.3.2.2 Solar Water Heaters (SWH)
The SWH programme envisages the installation of 1.25 million SWHs by 2019. The National Development Plan
introduces a second milestone year of 2030 with the goal of an additional 5 million SWHs being installed by this
point. The preliminary analysis suggests that the SWH programme will reduce the demand for energy, primarily
electricity, from middle- and high-income households. In response, the electricity sector would reduce production.
The SWH avoids GHG emissions (0.1% of 2050 emissions) from electricity and paraffin use in households for
water heating. In response, the electricity sector reduces production and hence also employment. The lower
demand for electricity results in slightly less electricity investment towards 2025, thus freeing up capital for other
sectors, and so there is no discernible impact on economic growth.
Intervention
Installation of 5 million SWHs by 2030
5.3.2.3 National Building Regulations and Buildings Standards Act
To further efforts to decrease the energy consumption and the associated GHG emissions of new commercial
and residential buildings, the South African government has implemented energy efficiency and energy
consumption standards within the country’s National Building Regulations and Buildings Standards Act. These
standards have been instituted by the South African Bureau of Standards (SABS) and include the South African
National Standard (SANS) 204 and SANS 10400-XA (GIZ-SALGA, 2015). The standards prescribe energy
efficiency requirements of new buildings and stipulate the maximum energy demand and the maximum annual
energy consumption for various kinds of buildings in various climate zones across the country.

27
Intervention
Tightening of the building standards up to 2030
5.3.2.4 Appliance Labelling
In 2016, South Africa launched an energy efficient label for domestic appliances in a bid to promote energy
savings in the country. The South African Energy Efficiency Label would be attached to all appliances that meet
the minimum energy performance standards (MEPS) so that consumers have a choice when buying appliances.
The label would include information on the energy consumption level of appliances. Appliances programme would
include air conditioners, washing machines, electric ovens, refrigerators, electric geysers, audio and video
equipment, dishwashers and electric lamps.
A campaign called Appliance Check would also be introduced to raise awareness of the use of the label and the
benefits of using energy efficient appliances.
Interventions
Introduction of energy endorsement label
Feasibility study on scrappage scheme for appliances
Transform the market for household appliances in favour of more energy efficiency models
5.3.2.5 Promotion of Clean Mobility
The South African government has recently completed its Green Transport Strategy (GTS), for the 2018 – 2050
period (DoT, 2018). The GTS provides the strategic way forward for the transport sector regarding the reduction
of GHG emissions, the contribution of transport into the green economy and the promotion of sustainable mobility.
The Strategy aims to reduce the transport sector greenhouse gas emissions by at least 5%.
Going back to 2007, the Public Transport Strategy sets out an action plan for accelerated modal shits and for the
development of integrated rapid public transport networks (DoT, 2007). Since then, the successful implementation
of the bus rapid transport (BRT) system in Johannesburg has led to it being adapted and implemented in other

28
major South African cities, including Cape Town, Nelson Mandela Bay, Rustenburg, Ekurhuleni and Tshwane.
Tshwane has also become the first African city to operate a fleet of BRT buses, which function on compressed
natural gas (CNG). The latter is a much cleaner alternative to diesel, not only in terms of GHG emissions, but
also in terms of emissions of local air pollutants. The future rollout of this fuel switching initiative in other major
South African cities, coupled with a further shift from private vehicles usage to public transport, is expected to
considerably drive down GHG emissions from road transport. To accelerate the implementation of the Public
Strategy, government has also developed the Public Transport Turnaround Plan – which gets periodically
reviewed and updated.
A large proportion of the country’s population still rely on minibus taxis to meet their transport needs. Government
has been engaging with the industry on the introduction of initiatives such as the adoption of cleaner fuels such
as compressed biogas (CBG) and compressed natural gas (CNG), which traditionally has never been a
consideration for taxi owners and operators.
The use of fuel economy norms and standards for fuel efficiency and GHG emissions of vehicles will continue.
Baseline studies on the adoption of more stringent fuel standards towards the future are currently being
undertaken.
The progressive shift of freight transport from rail to road over past years, has resulted in road-based freight
transport accounting for almost 76 percent of the total. This shift is the result of constraints in the country’s rail
sector, which has led Transnet to develop a Road-to-Rail Strategy. Essentially, the Strategy aims to create a
more balanced and appropriate market between road and rail freight transport, and thereby reduce overloading
of the road network and road infrastructure deterioration. The Mitigation Potential Analysis (MPA) 2014 identified
this modal shift in the freight sector as one of the most beneficial greenhouse gas mitigation measures, making
this a national priority of Government.
Interventions
Incentivise the manufacturing of electric vehicles in South Africa - both the local and export markets
Draft regulations providing a conducive environment for public and quasi-public transportation to be
converted to cleaner dual-fuel vehicles

29
Draft regulations requiring refineries to meet new standards and norms for cleaner fuels
Develop guidelines for the procurement of vehicles throughout government to procure efficient
vehicles, using clean technologies
Finalise the feasibility of a local manufacturer of EV batteries / fuel cell batteries at a reduced cost
Expand electric charging stations powered by photo-voltaic panels by 40 per annum: accessible to
general public
Draft regulations requiring 10% of Municipal bus fleets converted to cleaner technologies or cleaner
fuel
Develop regulatory regime for annual taxing of vehicles based on their emission standards through car
licensing renewal system and new car sales
Develop a regulatory policy on congestion charges
Re-introduce road freight permits reflecting load capacity of freight vehicles.
Develop green standards and guidelines for construction of low-carbon climate resilient road
infrastructure, including bus lanes, EV charger points, Bio Gas/NCG/LNG stations
5.4 Building Climate Resilience in the Energy Sector
The vulnerability of South Africa’s energy system to unavoidable climate change impacts relates most to the risk
of damage to electricity generation technologies and energy supply infrastructure. While the scenario modelling
and energy demand and supply projections made within the IEP and IRP focus more on mitigation measures, the
plans highlight the need for climate resilient energy infrastructure planning in South Africa’s current and future
energy planning.
Electricity transmission and distribution infrastructure may face considerable degradation as a result of more
extreme weather events. The prevalence and intensity of lightning storms and veld fires in South Africa are both
projected to increase, which may result in grid failure. The efficiency of transmission lines also decreases when
ambient temperatures are too high. Energy infrastructure in coastal areas faces significant risks in terms of
potential saltwater damage from rising sea-levels.

30
Renewable energy technologies are also vulnerable to the impacts associated with a changing climate. While an
increase in solar radiation and wind intensities may favour solar and wind energy technologies, extreme, and
unpredictable, heat or wind bursts may pose challenges to these technologies. It is therefore important that
renewable energy systems are designed to withstand the impact of extreme weather events.
Climate resilience considerations guide the options presented in the IEP and IRP, with regard to the country’s
future generation mix. The risks the sector faces with regard to the water-energy nexus are also recognised in
these policies. While most focus has traditionally been on climate mitigation and reducing GHG emissions, there
is now a growing recognition of the need to adapt to and develop resilience capacity to unavoidable climate
change impacts. For example, there are companies that are already using cooling technologies that use air rather
than water in their generation plants. This is in response to South Africa’s limited freshwater resources and the
potential for more frequent and severe droughts, as is already the case in certain parts of the country.
5.5 Building Climate Resilience in the Transport Sector
Much attention with regard to climate change impacts in the transport sector, has been on mitigating the potential
for these impacts, rather than focussing on adaptation and resilience measures to cope with these impacts (DEA,
2017d). The vulnerability of this sector to climate-impacts relates to physical transportation infrastructure (i.e.
buildings, pipelines, roads and railways). This infrastructure has generally not been built to handle highly variable
or extreme weather conditions. Floods, excessively high temperatures or storm surges can cause buckling,
cracking and erosion of roads, cracks in underground pipelines, the collapse of bridges or disruptions in the
operations of ports.
Looking to the future, specific measures and developments in the sector will need to be implemented to enhance
the resilience of transport infrastructure against potential climate impacts. To this end, the Green Transport
Strategy proposes the following main measures which will ensure that the transport infrastructure is resilient to
harsh climatic conditions:
• Constructing low-carbon and climate resilient road transport infrastructure (i.e. bus lanes, railways and
non-motorised transport infrastructure), which tackle climate change by both reducing emissions as well
as adapting to its inevitable impacts;

31
• Developing strategies that build climate resilience into urban and rural integrated transit planning and
systems
• Creating standards and guidelines for climate-resilient materials for construction, maintenance and
upgrading of road networks in the country.
Taken together, these measures should ameliorate the negative impacts of climate change on transport system
and prevent significant damage from occurring.
6 MEASURES TO DRIVE LOW CARBON DEVELOPMENT IN THE INDUSTRY SECTOR
6.1 Industry Sector Overview
Given its abundant mineral wealth, South Africa’s economy is largely developed from a mining and manufacturing
base, with heavy industry making the country highly energy-intensive. The country’s economy has recently been
shifting towards more service-oriented activities. Nevertheless, the industrial sector remains a major factor and
contributor to the country’s GDP.
In 2017, mining contributed 8 percent to South Africa’s GDP (Stats SA, 2017b). As such, these industries
contribute significantly to economic production and job creation and form a key aspect of South Africa’s socio-
economic development objectives. South Africa is major producer of coal, iron ore, gold, manganese, chrome,
platinum, and diamonds. Non-ferrous metals and stainless steel roughly accounts for about a third of all the
country’s manufactured products output. In terms of non-ferrous metal production, the country produces
significant amounts of aluminium, copper, brass, lead, zinc and tin.
The South African chemical industry contributed around 5 percent to the country’s GDP in 2017 and is dominated
by the synthetic coal and natural gas-based liquid fuels industry, as well as the petrochemicals industry. South
Africa has the largest chemical industry in Africa and is the world leader in coal-based synthetic fuel and gas-to-
liquids (GTL) technologies. Other chemicals produced in South Africa include ammonia, nitric acid, carbide,
titanium oxide and carbon black. Overall, the chemicals sector contribution to the industry sector’s total GHG
emissions is minor, at only 2 percent in 2012.
Having liberalised its markets at the end of apartheid, manufacturing industries in South Africa, which have
traditionally been more commodity focussed, have struggled to remain competitive against more diversified
manufacturing industries in countries such as China, Vietnam and Bangladesh (Bhorat and Rooney, 2017). This

32
situation has improved in recent years - the sector has become more diversified and efficient. For example, South
Africa’s automotive assembly and components industry now accounts for about 10 percent of all the country’s
manufacturing exports, and globally ranks among the leading industries of its kind for the manufacture and export
of vehicles and components (Brand SA, 2011). Most of the major multinational vehicle manufacturers are
represented in South Africa with the country exporting vehicles to over 70 countries, including Australia, the
European Union, Japan, the United States and a range of countries on the African continent.
6.2 Emissions associated with industry sector
The industrial sector accounts for the largest share of South Africa’s total energy demand and consumption. This
is due mainly to the high energy-intensity of its industries, particularly the metal producing industry. This makes
the sector a major contributor to the country’s total GHG emissions, being only second to the energy sector.
Overall, GHG emissions from the industrial sector rose slightly by 0.2 percent from 2000 to 2012 period (DEA,
2017c). While emissions in the minerals and metals subsectors rose substantially, while those in chemicals and
manufacturing and construction subsectors declined. The latter was primarily due to the overall decline in the
South Africa’s manufacturing output and share in the economy over the years.

33
Figure 3: Industry sector GHG Emissions between 2000 to 2012
The metal as well as manufacturing industries accounted for almost 90 percent of the total emissions in the
industry sector over the period 2000 – 2012. The mineral industry contributed 6 percent, while the chemicals
industries accounted for less than 3 percent of total emissions. The contributions of product use as substitutes
for ozone depleting substances (ODS) and non-energy products derived from fuels and solvents use were small
with 1 percent and less than 1 percent, respectively.
6.3 Measures to address industry sector emissions
By its very nature, industrial activity cuts across a wide range of sectors. From a climate change perspective, this
is reflected in the wide spectrum of government departments that have initiated climate change mitigation
interventions geared towards reducing GHG emissions and energy intensities in the industry sector.
To streamline industrial development, the National Industrial Policy Framework (NIPF) represents the broad
framework governing all industrial policy interventions in South Africa, and articulates the overarching approach
Metal Industry45%Manufacturing
Industries and Construction
44%
Mineral Industry7%
Chemical Industry2%
Product Uses as Substitutes for ODS
2%
Non-Energy Products from Fuels and
Solvent Use0%

34
to industrial development (DTI, 2007). On its basis, the Department of Trade and Industry (dti) developed the first
IPAP in 2007. The IPAP presents the implementation plan and outlines South Africa’s national industrial effort,
with involvement from key stakeholders and economic partners. The most recent revision of the IPAP provides
updates on key focus areas within the industrial sector, of which green industry investment is an important one.
The dti has been instrumental in driving the development of sustainable infrastructure and the use of green
technologies in the industry sector, through the provision of various incentives and financial assistance to
companies for green project development. This is mainly through the Capital Projects Feasibility Programme, the
Critical Infrastructure Programme and the Manufacturing Competitiveness Enhancement Programme.
To further support industrial energy efficiency, the South African Industrial Energy Efficiency (IEE) programme
was developed to focus on the promotion and implementation of energy management systems and energy
systems optimisation in companies. In its first phase, which ran from 2010 – 2015, the project assisted
participating industrial companies to reduce energy use by 1,220 GWh and save a total of R1.7 billion in energy
costs (NCPC, 2015). The second phase of the project commenced in 2016 and will run until 2019. To date, the
IEE Programmme has produced 2,140 GWh in cumulative energy savings and 2 Mt CO2e in avoided GHG
emissions through various energy management and energy systems optimisation projects in participating
companies.
Furthermore, South Africa’s national utility, Eskom, implemented the Integrated Demand Management (IDM)
Programme, partly to mitigate its environmental impact (Eskom, 2016). It consists of several incentive-based
mechanisms aimed at achieving electricity demand reductions in the industrial, commercial and residential
sectors. Various energy efficiency and demand-side reduction interventions have been implemented in the above
sectors as a result of the programme, including light-emitting diode (LED) installations, heat pumps installations,
SWH installations and efficiency improvements to various machineries and equipment (Eskom, 2016). The
programme has so far resulted in cumulative energy savings of over 58,000 GWh and avoided CO2e emissions
in the order of 59 Mt. The sector has also reduced a lot of emissions through the implementation of the National
Energy Efficiency Strategy (NEES), 2005 and will continue to do so with the implementation of the Post-2015
NEES.

35
South Africa supports mitigation initiatives that use low carbon technologies through the provision of various tax
rebates through the Income Tax Act of South Africa:
Section 12B allows companies to deduct, from their taxable income, the cost incurred from investing in
assets that are used directly for the production of renewable energy;
Section 12I offers support for both capital investment and training related to Greenfield (new) and
Brownfield (expansions or upgrades) projects within South Africa’s manufacturing sector. Qualifying
projects are called “Industrial Policy Projects”.
Section 12K provides for tax exemptions on proceeds gained from the disposal of certified emission
reductions derived from activities registered with the Clean Development Mechanism. The tax window
runs up to 31 December 2020, in line with termination of the second commitment period of the Kyoto
Protocol;
Section 12L provides for a tax incentive as a result of the implementation of efficiency initiatives and it
came into operation on 1 November 2013. Since its inception, major benefits in terms of energy savings,
tonnes of CO2-eq avoided and tax rebates were realised by mining (more than 85%), followed by
manufacturing subsectors; and
Section 37B allows companies to deduct the costs, incurred due to expenditures on environmental
pollution control and monitoring equipment and/or disposal sites, from their taxable revenues.
Interventions
Implementation of Phase 2 carbon budget
Implementation of carbon tax
Continue to incentivise energy efficiency measures
6.4 Building Climate Resilience in the Industry Sector
The vulnerability of the industry sector and its related sub-sectors to climate impacts relates mainly to feedstock
supply-side uncertainties, increased trade exposure and changes in consumer spending (DEA, 2017d). A
combination of multiple climate change effects, both within and across different sectors, could create supply-side

36
uncertainty for industries and businesses whose raw materials or inputs, such as agricultural products and energy,
may be negatively affected by climate change. This disrupts supply-chains. At the same time, if consumers are
increasingly stressed by climate change and feeling the effects on their livelihoods, this may reduce consumer
spending as more income is spent on security nets, such as saving and insurance, creating demand-side volatility.
Apart from the above economic vulnerabilities, climate-related risks in the minerals, manufacturing and
construction industries are linked to water availability. All these industries rely heavily on water for their production
processes. The mining sector’s vulnerability to reduced water availability is further complicated by its own
contribution to the degradation of available water resources, in the form of effluent discharge from mining
operations, which causes acid mine drainage. More rainfall, and especially heavy rainfall events, would likely
exacerbate the problem of increased surface runoff, acid rock drainage or acid mine drainage. Flash floods and
heavy water runoff can also cause scouring in mining areas, as well as heavy erosion and further degradation.
In recognising these vulnerabilities, a number of companies such as Eskom and Anglo American have already
developed in-house strategies aimed at increasing the resilience of their operations against ongoing climate
change (see e.g. Braun and Fournier, 2016; Anglo American, 2016). Others are being encouraged to develop
such strategies.
7 MEASURES TO DRIVE LOW CARBON DEVELOPMENT IN THE AFOLU SECTOR
7.1 AFOLU Sector Overview
Over 90 percent of South Africa’s 1.22 million km2 surface is rural land that is home to 19 million people which is,
approximately 35 percent of the national population. The land includes a broad diversity of ecological and socio-
economic systems, ranging from extensive commercial crop production, to small-scale livestock farming on
communal land, homesteads in peri-urban areas and large-scale conservation areas of global importance.
Due to a broad range of climatic and ecological drivers, the land cover of South Africa is dominated by more open
ecosystems in the form of shrublands covering approximately 40 percent, savanna woodlands of approximately
33 percent and grasslands of approximately 27 percent. In comparison, the extent of natural forests is small,
covering less than 0.5 percent of South Africa’s land area (GeoTerraImage, 2013). The contribution of each of
land-cover type in South Africa in terms of terrestrial carbon stocks is illustrated in in the figure below. Savanna

37
and grasslands, which comprise 47 percent of the total area account for approximately 63 percent of the total
terrestrial carbon stocks of 7,170 teragrams (Tg).
Figure 4 – The Contribution of Each of Land-Cover Type in South Africa in Terms of Spatial Area
Source: DEA (2013); Scholes et al. (2013)
Although agriculture, forestry and other forms of land-use contribute a fairly small fraction of South Africa’s
economy, there is often a great emphasis on the sector in national policy due to the importance of creating rural
employment and skill development opportunities.
South Africa has both indigenous forests as well as exotic forest plantations. South African indigenous forests
occupy an area of approximately 326,000 hectares and occur as an archipelago of patches scattered along the
eastern and southern escarpment mountain ranges and coastal lowlands. Indigenous forest occurs in many small
to medium-size patches. 80 percent of patches are smaller than 50 hectares (Berliner, 2009), although some
individual patches may exceed several thousand hectares.
South African Forest Plantations occupy a net area of approximately 1,224 million hectares, or 1.0 percent of the
overall land area.
29
18
28
5
20 1
12
1 2 2

38
At a national scale, 8 percent of the country’s land area, which is often located in semi-natural high altitude mesic
grasslands and contributes 50 percent of the water in rivers, which is vital to downstream urban centres and
industry. Yet these areas are often degraded and under continual pressure. It is in these areas that avoiding,
reducing and rehabilitation landscapes could result in a broad suite of climate change mitigation and rural
economic development outcomes. The soils below these high altitude mesic grasslands are one of the largest
stores of carbon across the country (Scholes et al., 2013). This in turn has led to a greater consideration of natural
resource management and the restoration of ecological infrastructure in many primary national policies and
strategies.
7.2 The emissions associated AFOLU sector
The AFOLU sector contributes approximately 9 percent to South Africa’s national annual GHG emissions. Within
the sector, the principal sources of emissions are enteric fermentation from livestock responsible for 42 percent
of emissions and nitrous oxide emissions from cultivated soils contributing 28 percent, including emissions from
the application of nitrogen fertiliser as well as animal urea and manure. The remaining sources of emissions, for
example, from the burning of grasslands, savanna and forestry and agriculture residues, liming and urea
application form comprise the balance of contributions of 28 percent.
Within South Africa, forest land is estimated to sequester approximately 32,882 Gg CO2e per year. In a South
African context, this definition includes tall coastal and scarp forests, plantations, as well as considerable areas
of woodland, thicket and dense savanna1. This amount reduces South Africa’s net emissions by approximately
5 percent. Much of the additional carbon sequestration occurs when open grasslands are converted to a ‘forest’
state as a result of bush encroachment, resulting in the accumulation of additional woody biomass over time.
Although some forest land was converted to grassland and cropland, carbon sequestration due to increase in
forest cover is over double the emissions from the clearance of forest land.
The diagram below provides a breakdown of the GHG emission within the AFOLU Sector over the period 2000 –
2012 including the relative increase/decrease per subsector.
1 Defined within the Marrakesh Accord, Forest Land includes all vegetation types having a minimum area of 0.05 hectares,
crown cover of 30 percent and a minimum height of 2 meters.

39
Figure 5 – AFOLU Sector Emissions (average between 2000 – 2012)
Source: DEA (2017c)
7.3 AFOLU Sector Measures
The importance of the AFOLU Sector is highlighted in the NDP 2030, which continually emphasises natural
resource management, rural employment opportunities, enhancement of agricultural value chains and renewable
energy.
Complementing the country’s pivotal national strategic policies, the Department of Agriculture, Forestry and
Fisheries has several strategies and plans under development to further initiatives for reducing in GHG emissions
in the AFOLU sector. The draft Climate Change Sector Plan for the South African Agricultural and Forestry
Sectors focuses on development of a mitigation plan for the forestry and agricultural sectors and includes the
development of policies, strategies and action plans, monitoring and evaluation, and the implementation of a
national Reducing Emissions from Deforestation and Forest Degradation (REDD+) program.
The draft Climate Change Sector Plan proposes the goal of afforesting 100,000 hectares of land in the Eastern
Cape and KwaZulu-Natal. The intention is to expand small-grower community-based forestry by 100 000 hectares
in these areas with the support of commercial forestry companies. This could amount to approximately 1.2 million
tonnes of carbon sequestered.
30.14
-11.12
23.24
-0.57
-15.00
-10.00
-5.00
-
5.00
10.00
15.00
20.00
25.00
30.00
35.00
Livestock Land Aggregate sources and
non-CO2 emissions
sources on land
Other
Mt
CO
2e

40
The DAFF Conservation Agriculture Policy of 2017 provides a sound basis for national and sector policy support
for conservation agriculture (CA). Current CA adoption by grain growers is between 20 – 30 percent at a national
scale. The Policy considers conservation agriculture farming methods including no-till, conservation till, precision
agriculture and meat production efficiency. GHG emission reduction occurs via two mechanisms. Firstly, and
most importantly, no-till and reduced tillage drastically reduce the number of tractor trips by reducing tillage
requirements, and substantial diesel consumption is thus reduced by approximately 50%. Secondly, no-till and
reduced tillage on average are estimated to increase yields by approximately 10%. They, thus require a smaller
area to be planted to obtain the same yield, and reduced fertiliser consumption produces lower GHG emissions.
Agroforestry could lead to the sequestration of atmospheric carbon in soils and biomass and the DAFF
Agroforestry Strategic Framework for South Africa 2017 presents a broad overview of the potential for agroforestry
in a South African context by providing a set of principles and strategic themes and goals. It recognises the carbon
sequestration potential role of agroforestry. Estimates range from 0.29 – 15.21 Mg of C/ha/year above ground
and 30-300 Mg C/ha below ground, up to one metre in depth (Nair et al, 2010).
Interventions
Promote conservation agriculture farming methods
Restoration of subtropical thicket, forests and woodlands
7.4 Building Climate Resilience in the AFOLU Sectors
Resilience to climate change is not only characterised by the physical ability of a crop or ecosystem to tolerate
climate change in a robust manner, but by the broader coupled socio-economic system in which the land-use
practice exists. For example, well-resourced farmers may be able to apply additional irrigation or other
technological solutions to enhance their crops ability to respond to changes in rainfall, frost events and extreme
temperatures. In contrast, a land custodian with few resources and little access to extension services is less able
to implement measures that ensure crop or livestock production is maintained under a changing climate.
The impact of predicted climate change on agricultural production in South Africa is commodity and location
specific. As noted in DEA (2013), the predicted impact on rainfed crops varies from minus 25 percent to plus 10
percent. In the western parts of the country, maize production is likely to decrease in extent and volume. A

41
predicted warmer and drier climate is also likely to lead to a decrease in the area suitable for viticulture and
negatively affect the amount of water that is available for the production of horticultural crops in the Western Cape.
In contrast, in the areas east of the escarpment, the production of subtropical fruit and sugarcane is expected to
increase by 10 percent to over 30 percent. However, a warmer climate can provide suitable conditions for pests
that have not had a considerable impact to date. As noted in DEA (2013), this is a clear climate change-related
threat that needs to be addressed.
The impact of climate change on livestock is less well known. An increasingly warmer and drier climate in the
central and western parts of the country is likely to place addition stress on animals and reduce the amount of
available forage material. In comparison, increased rainfall on the eastern seaboard and in KwaZulu-Natal may
raise the amount of available forage, but may in addition lead to an increased prevalence of pests.
Agriculture is estimated to currently consume in excess of 60 percent of South Africa’s surface water resources
and a further significant fraction of ground water. Furthermore, demand for irrigation is predicted to increase by
15 – 30 percent across the country. The ability to meet this need has to be considered in relation to other
competing needs for water in a region of the world that is predicted to become warmer and drier over time.
Commercial forestry plantations comprising eucalypt, pine and acacia species occur predominantly on the
Drakensburg Escarpment and eastwards to the coast where rainfall is high, and temperatures are moderate.
Warburton and Schulze (2006) in an assessment of the impact of climate change on commercial forestry
concluded that:
The climatically optimal areas for plantation forestry within KwaZulu-Natal are likely to decrease with
climate change, while areas within the Eastern Cape and Mpumalanga where temperatures are expected
to increase have the potential for expansion;
In marginal forestry areas, decreasing rainfall and increasing temperature will impact growth and yield
and increase the risk of fires, pests and diseases;
Plantation species are most susceptible to decreases in rainfall; and
Hybrid plantation species, especially pines are more resilient to the impacts of increases in temperature
and decreases in rainfall.

42
Plantation trees are grown for periods of 7 to 25 years before harvesting. This implies that there is a need for
long-term breeding strategies aimed at developing species adapted to adverse changes in climate and resistance
to new pests and diseases.
Unlike commercial forestry plantations, which are monocultures, indigenous forests comprise a wide range of
different species of different ages and sizes. This potentially provides greater resilience to climate change.
However, most indigenous forests occur in small to medium-size patches surrounded by grassland. Hotter drier
conditions will increase the risk of fire, which will gradually erode the boundaries of these forest patches.
In terms of the resilience of indigenous biomes and potential range shifts, it is expected that the fynbos of the
winter rainfall South-Western Cape will be significantly affected by climate change with up to a one-third reduction
in climatically suited areas. One scenario is the transition to more summer rainfall patterns, which allow grasslands
to invade. The succulent Karoo is projected to persist in the future, but to become more arid and hotter. The
grassland ecosystems of South Africa, which occur predominantly in the Highveld are the most threatened South
African biome with areas encroached upon by the savanna and Karoo biomes, as well as being segmented by
croplands, mining and urban areas. Although the grasses themselves are relatively resilient, it is the other species
within this biome that will be threatened by climate change. Savanna ecosystems are predicted to become hotter
while wetter in the east and drier in the west. As overall plant diversity is lower and individual species have large
ranges compared to other biomes, the savannas are considered more resilient to the direct effects of climate
change (Scholes et al., 2015).
An oddity that needs be considered in South African landscapes is the clearance of bush encroachment and
woody alien invasive species. Whereas these actions may result in a net release of carbon in the atmosphere in
many cases, the climate change adaptation benefit in the form of improved water services, increased landscape
production and the conservation of biodiversity, is generally viewed as more significant and important to the
country.
8 MEASURES TO DRIVE LOW CARBON DEVELOPMENT IN THE WASTE SECTOR
8.1 Waste Sector Overview
In South Africa, as in many countries worldwide, waste disposal and management are a growing concern as a
result of a growing population and economy, and rates of urbanisation. This has put immense pressure on solid
waste and waste water management facilities in the country. Waste streams are also becoming increasingly

43
diverse in their composition, which directly affects the complexity of the management processes that needs to be
applied.
The amount of waste landfilled in South Africa still significantly exceeds the amount that is diverted, either through
reuse or recycling. The recently published Draft South African State of Waste Report shows that around 109 Mt
of waste was generated in South Africa in 2017 (DEA, 2018b). Only about 11 percent of this was recycled, with
the remainder being disposed of at landfill.
Several landfills in the eight larger metropolitan areas which are, the main waste generation centres in the country,
are close to reaching their available air space or have already reached their limits. Rapid urbanisation and high
cost for building new engineered landfills has led to less suitable landfill space being available within municipal
confines. Moreover, the practice of landfilling is becoming more and more socially unacceptable. Thus,
appropriate space for new landfills is increasingly scarce and alternatives are being sought.
8.2 Emission associated with the Waste sector
While the waste sector only accounted for approximately 4 percent of South Africa’s total GHG emissions, the
sector showed the largest increase of 78 percent over the 2000 – 2012 period compared to the other key sectors
(DEA, 2017c). Emissions from solid waste disposal, essentially landfill methane emissions, accounted for an
average of 84 percent of the sector’s total GHG emissions, with the remainder of 16 percent coming from waste
water treatment works.

44
Figure 6 – Waste Sector GHG Emissions (average between 2000 – 2012)
Source: DEA (2017c)
8.3 Measures in the Waste Sector
Waste management activities in South Africa are legislated through the National Environmental Management:
Waste Act (NEM:WA) (DEA, 2009). To flesh out the NEM:WA and provide further policy direction in terms of
establishing fully integrated waste management practices in the country, the National Waste Management
Strategy (DEA, 2012). With it, the South African government officially endorsed the internationally accepted waste
management hierarchy of waste avoidance and reduction, re-use, recycling, recovery and disposal (in that order
of priority).
The NWMS is aligned with the NCCRP and provides for the mechanism to reduce GHG emissions emanating
from solid waste disposal and waste water treatment. In this regard, a number of the actions are being undertaken
to drive the reduction, reuse, recycling and recovery of waste and these actions are already having a considerable
positive environmental impact as far as lowering this sector’s GHG emissions. These are centred around:
• Reducing the quantity of recyclable waste sent to landfill, through the implementation of separation at
source programmes in metropolitan municipalities;
• Encouraging the establishment of material recovery facilities (MRFs) for separation after the waste has
been collected; and
84%
16%
Solid Waste Disposal Waste Water Treatment and Discharge

45
• Promoting development of waste-to-energy (WtE) solutions over and above current projects and
initiatives.
By encouraging recycling, the demand for the production of virgin materials and associated GHG emissions is
reduced. Recycled glass, papers and metals generally require significantly less energy inputs than production
from scratch. Moreover, WtE projects have a double effect of reducing a GHGs by preventing methane emissions
generated in landfills or from wastewater treatment and also providing energy by generating electricity and heat,
thus displacing demand for coal-based electricity from the national utility or other fuel inputs.
The Informal waste pickers are being involved in the formal waste management structures. The recovery of
valuable post-consumer recyclables by the informal waste sector saved municipalities between ZAR 310 and
ZAR 748 million in landfill airspace in 2014 (Godfrey et al., 2016). The approach of involving informal waste
pickers contribute significantly to the livelihoods – and the upscale of this initiative has potential to the reduction
of GHG emissions.
Interventions
Promote and encourage waste avoidance and reduction, re-use, recycling and recovery
Promote development of waste to energy solutions
8.4 Building Climate Resilience in the Waste Sector
Waste management facilities are already impacted by weather events and the risk of more extreme weather
events (e.g. flooding) may substantially interrupt the provision of critical waste services, degrade waste
management and treatment infrastructure and amplify the negative environmental effects from landfilling. A
number of risks related to a changing climate have been identified, which makes the waste sector vulnerable to
potential climate impacts (DEA, 2017d):
• Higher rates of waste accumulation in domestic, commercial and industrial spaces, as a result of
flooding causing disruptions in the provision of waste services;

46
• Increased health risks (i.e. odour and dust) from waste, which cannot be collected due to disruptions in
waste removal and supply transportation networks;
• Degradation in the integrity and lifespan of designated waste management infrastructure such as
landfills and surrounding areas (i.e. buffer zones) as a result of flash flooding, which can lead to
uncontrollable waste dispersion and subsequent land and fluvial contamination; and
• Higher temperatures that lead to faster decomposition of the organic fractions in landfills and of
wastewater sludge, resulting in increased releases of methane emissions.
A Community Reforestation Project at the Buffelsdraai Landfill Site demonstrates a waste sector’s ability to
become more climate resilient. The project was developed by the eThekwini Municipality and forms part of the
city’s portfolio of adaptation and mitigation responses within its Municipal Climate Protection Programme.
The project launched in 2008, initially as a climate change mitigation initiative, but also demonstrated substantial
climate change resilience co-benefits (Douwes et al., 2015). The project revolved around the planting of forest
tree seeds in a 580-hectare area, within the 757-hectare buffer zone, surrounding the Buffelsdraai regional landfill
site. The seeds needed for the reforestation project were sourced from local people who collected and germinated
them in exchange for credit notes which were eligible for use in purchasing food, paying for school fees and so
forth. The project ran for a five-year period and resulted in approximately 650,000 trees being planted and the
restoration of the existing grasslands, woodlands, wetlands and riparian areas within the remaining portion of the
buffer zone.
The project was selected as one of the United Nations “Momentum for Change” initiatives, a platform where
projects are recognised for addressing climate change through climate resilient and low-carbon mechanisms,
while ensuring optimal benefits for local communities. Aside from a range of ecological climate resilience co-
benefits including improved biodiversity refuges, flood mitigation, sediment control, visual amenity, and fire-risk
reduction, the project also generated 50 full-time, 16 part-time and 389 temporary jobs for local community
members. The project serves as an example for building climate resilience in the waste management sector and
upscaling to other sites will further promote the country’s low-emission development agenda.
47
9 CROSS-CUTTING MEASURES TO DRIVE LOW CARBON DEVELOPMENT IN SOUTH AFRICA
9.1 Carbon Dioxide Vehicle Emission Tax, 2010
Since the 1st of September 2010 all new South African vehicles have been subject to a carbon emissions tax
instituted by government to increase the drive towards cleaner running and less polluting vehicles. Carbon
emissions are calculated according to the amount of carbon content that is in a litre of petrol or diesel divided by
the vehicle’s fuel economy. The emissions tax is aimed at vehicles that produce more than 120g/km and are
taxed at a rate of R75 + VAT for every g/km in excess of the 120g/km threshold.
9.2 Carbon Tax
The government published the Draft Carbon Tax Bill in 2017. The Carbon Tax Bill gives effect to the “polluter
pays” principle and aims to price carbon by internalising the external costs of emitting carbon. The tax rate is set
at R120 per tonne of CO2e produced. To allow businesses time for transition, a basic percentage-based threshold
of 60% will apply, below which tax is not payable. There are a number of other allowances proposed in the Bill.
These allow for maximum allowances of between 90% and 95% depending on the sector, with the minimum
allowance set at 60%.
Post-2020, the carbon tax and the carbon budgeting system will be aligned. This will be done by imposing a
higher tax rate as a penalty for emissions exceeding the carbon budget. This interface option will help to ensure
a credible price signal to encourage behaviour change over the medium to long term, emission reduction certainty
through a carbon budget, and provide the required regulatory policy certainty.

48
10 RESEARCH, DEVELOPMENT AND INNOVATION TO SUPPORT THE LOW CARBON DEVELOPMENT
The successful implementation of the SA LEDS 2050 builds on the premise that research and development (R&D)
capacity underpinning the country’s innovation environment, continues to develop along the same trajectory.
Technology development and transfer are critical requirements for realising the country’s climate change and
developmental goals.
As reported in the first biennial report to Cabinet on the state of climate change science and technology in South
Africa (ASSAF, 2017), the climate change science research community in South Africa is productive,
internationally well respected and growing. It comprises of a diverse, multi-actor institutional landscape. The
research community is largely guided by the priorities set by national government and in particular the Department
of Science and Technology (DST), as the national department responsible for provision of leadership, an enabling
environment and resources for science, technology and innovation. With 17 percent of funding for the South
African climate change research and technology development system coming from international sources, some
influence also exists through international research agendas.
Based on extensive review of various aspects of the National System of Innovation (NSI), as well as consultation
with a wide range of role players such as relevant government departments, civil society, business and academia,
the Department of Science and Technology has recently published the Draft 2018 White Paper on Science,
Technology and Innovation (STI) for further stakeholders’ inputs. The Draft 2018 White Paper on STI emphasises
the core themes of inclusivity, transformation, and partnerships. The Draft recognises the important role that the
STI would play in mitigating and adapting to climate change impacts.
10.1 Research Driving Low Carbon Development
DST (2007) defines five grand challenge areas addressing an array of social, economic, political, scientific and
technological benefits. Two of the five areas are relevant to climate change are:
Energy security, which focusses on the challenge to meet South Africa’s medium-term energy supply
requirements, while at the same time developing a safe, clean, affordable and reliable energy supply.

49
The long-term innovation focus lies on clean-coal technologies, nuclear energy, renewable energy and
the promise of the hydrogen economy; and
Global change science, which focusses on climate change science and strengthening South Africa’s
leading role on the continent in terms of understanding and projecting changes in the climate and its
impact, including changes in weather patterns.
While global change science focusses on researching the scientific principles behind climate change and
assessing the impact, energy security includes climate change mitigation activities in the energy sector. Major
R&D thrusts include clean coal, renewable energy, hydrogen and energy storage.
The Hydrogen South Africa (HySA) Programme, Renewable Energy Hub and Spokes Initiative, Biofuels
Demonstration Programme and the Energy Storage Research Development and Innovation Platform have a
major role to play in the space of research, development and innovation in the country. Developing local research
and development initiative (RDI) capacity in the targeted areas will create an enabling environment for localisation
of technologies in key areas with local renewable energy potential, playing on the strengths of the country and
moving the low carbon development agenda forward.
The 15-year HySA RDI Strategy was launched in 2008. During the initial phase, substantial local research and
development capacity has been established, followed by working towards the demonstration of fuel cell
technology and the development of products for local and international markets. Ultimately, the aim is to make
South Africa a global player in fuel cell technology with a market share of 25 percent by 2020. Three centres of
competence have been developed: HySA Catalysis (i.e. platinum catalysts), HySA Infrastructure (i.e. hydrogen
production, storage and distribution) and HySA Systems (system integration) hosted by local universities and
research organisations. The centres have made considerable progress towards prototyping, demonstration and
commercialisation.
The Renewable Energy Hub and Spokes initiative focusses on developing national technical capacity in wind,
solar photovoltaic and solar thermal. Research capacity is built at various universities throughout the country. The
universities involved are Stellenbosch, Fort Hare, Nelson Mandela Metropolitan, Pretoria and Cape Town.
Research focusses on specific key components, as well as the system design and production.
To delink biofuel production from the food industry, DST supports research around the development of late
generation technologies in support of the national biofuels strategy. This is coordinated via the National Research
Foundation Research Chairs and the Technology Innovation Agency – Biofuels Demonstration Programme. The

50
current work supported includes the use of coal fines together with algae to produce a 10 percent blended
feedstock through pyrolysis. This work provides the opportunity to use low quality discard coal (i.e. dust and fines),
which accrues at 60 Mt per annum. The technology could comply with the blending criteria set out in the Draft
Position Paper on the South African Biofuels Regulatory Framework and contribute to the objective to blend in at
least 2 percent of biofuels. Coalgae could potentially exceed this target and links directly to the identified research
need to establish biomass and fossil fuel synergies (DEA, 2017e).
Regarding energy storage, DST established the Lithium Ion Battery Programme to initiate the development of
advanced energy storage technologies which play an essential role regarding the integration of solar and wind
power. Advanced storage systems can improve power quality by controlling frequency variations, handle peak
loads and reduce costs by enabling utilities to postpone infrastructure expansion.
The focus of the programme is on manganese beneficiation as well as power-to-gas for renewable energy
storage, using hydrogen gas under the HySA Programme. The activities will be centred on the development of
competence and infrastructure for the South Africa energy storage industry. This is in line with the identified
research need going forward, to increase the research focus on energy storage solutions suitable for small and
large-scale renewable energy applications (DEA, 2017e).
To bridge the gap from today until the old fossil-fuel based infrastructure is replaced, Carbon Capture and Storage
(CCS) is also being part of the government’s flagship programme. With CCS technology CO2 from flue gasses or
other sources can be captured, treated, pressurised and stored in geological formations deep underground. The
South African centre for CCS hosted by SANEDI manages this programme and is now in the process of preparing
a geological storage pilot. A CCS demonstration is planned for 2020 and commercial deployment for 2025. CCS
could potentially eliminate the release of CO2 to the atmosphere of many existing coal-fired power plants as well
as from other heavy industries like iron and steel, cement and coal gasification.
Interventions
Further research on clean coal technologies, hydrogen & fuel cell and energy storage
51
11 “JUST TRANSITION” TO LOW CARBON DEVELOPMENT”
South Africa’s transition towards low-carbon development necessitates an ongoing evaluation of the potential
impact that various measures being implemented have on socio-economic development. With climate change
already affecting the livelihoods of many South Africans, it is important that interventions implemented do not
directly or indirectly exacerbate the impacts, particularly on the most vulnerable communities.
The South African government recognises that any current and future climate change response requires a holistic
consideration of the costs and benefits of such responses on the lives of ordinary South Africans. Essentially, this
means that actions geared at reducing the country’s GHG emissions and combating climate change need to be
conducted in a manner, which is just and sustainable for all citizens. As such, all measures implemented should
be aligned with the fulfilment of the country’s developmental objectives, which include alleviating poverty and
reducing inequality, creating sustainable jobs and increasing the provision of basic services to all South Africans.
For example, millions of people are employed in energy-intensive industries, which will need to undergo significant
restructuring as we transition to a low carbon economy. While the progressive shift to a low carbon economy
green economy will bring a number of new employment opportunities, so too will these jobs require new skills
and areas of expertise.
Having said this, some actions undertaken to combat climate change and lower the country’s GHG emissions are
already creating opportunities in a number of sectors. A good example is the REIPPPP. Since its inception, the
programme has created a significant number of jobs, contributed to Broad-Based Black Economic Empowerment
and preferential procurement (transformation) objectives and driven private sector investment into the country’s
energy sector (Eberhard and Naude, 2017).
The National Employment Vulnerability Assessment (NEVA) and Sector Jobs Resilience Plans (SJRPs) will be
the key policy instruments to manage the transition to a low-carbon economy (DEA, 2011). There is ongoing work
to look at interventions to ensure that the transition to a low carbon economy does not result in net job losses.
The NEVA will systematically utilise a broad approach in assessing the employment characteristic of various
economic sectors, by delving deeper into the various industries comprising these sectors and the employment
categories/types within each. The employment vulnerability assessments will form the basis of the SJRP, which
will be tailored to address the job losses in each sector.

52
In line with the NCCRP principles, mitigation actions that can uplift the socio-economic status of low-income
segments of the population, whilst reducing GHG emissions will be prioritised. also, the National Planning
Commission (NPC) is leading work on possible pathways to achieve the just transition. as part of this work, the
NPC is facilitating discussions nationally so the end-state (vision) can be co-created by all South Africans.
Interventions
Develop and implement SJRPs
Development of low carbon vision (end-state by 2050)
12 BUILDING A CLIMATE/LOW CARBON DEVELOPMENT CULTURE
To build a culture that embraces low carbon development, South Africa aims to develop and implement education,
training and public awareness programmes on climate change and its effects. The aim of this programme will be
to change the behaviour of South Africans. Some of the programmes include:
South African MY2050 Calculator (MY2050.environment.gov.za), which is interactive tool where the
user can investigate ways how South Africa can reach its low carbon goals by 2050 while learning about
climate and energy. Different supply and demand options of the South African energy system can be
modified to explore the limits and possibilities of their choices in terms of energy supply and observe the
relative impacts different demand and supply activities have on emissions.
Fundisa for Change. Fundisa for Change is a collaborative programme formed specifically to enhance
transformative environmental learning through teacher education. It was established as a partnership
programme involving many of South Africa's major environmental organisations, including state,
parastatal, NGO and private companies, which have an interest in teacher education. Fundisa’s core
objective is to strengthen the teaching of environmental concepts, including climate change, in schools.
This avenue is used to continue to advocate low carbon development path that South Africa has chosen.
Journalist Training, in collaboration with the Deutsche Gesellschaft für Internationale Zusammenarbeit
(GIZ), South Africa through the Department of Environmental Affairs is developing and presenting a

53
training programme for print, social media and TV journalists on the topic of climate change and
sustainable development. The main objective of the programme is to build capacity and improve skills of
journalists in covering climate change in their reporting.
Intervention
Continue and enhance implementation of educational tools
13 CLIMATE FINANCE
The implementation of climate interventions will require funding support to ensure scaling up and sustainability of
some of the programmes.
The National Climate Change Response Policy recognises that achieving South Africa’s climate change response
goals, will require a massive and comprehensive mobilisation of financial, human and technical resources. For
now, South Africa’s adaptation investment needs are estimated for the period 2020 – 2050 to be in the range of
US$ 0.2 billion -$US 50.0 billion with a median value of $US50 billion over the 30 year period. The cost of
adaptation is likely to increase in future years as the frequency of extreme events increase. Analysis of the
incremental costs of mitigation actions indicates that significant finance and investment will be required in the
long-term, estimated in the order of $US 1,353 billion for the period 2020 – 2050.
South Africa has committed to mobilising the resources necessary for an effective climate change response
covering both mitigation and adaptation, at all relevant scales and; drawing on private and public sectors
resources. South Africa’s Climate Finance Strategy is being developed and it comprises a comprehensive suite
of measures to create and maintain a long-term funding framework for mitigation and adaptation actions.
South Africa’s resource mobilisation strategy is informed by the mainstreaming of climate change into the fiscal
planning, budgetary process and decision-making across all sectors of society, including government, private
sector and civil society.

54
Domestic Climate Finance Support
The South African government has invested approximately USD 11.7 billion in the form of grants and USD 71.8
million in the form of loans to support climate change related programmes from 2008 to 2014 (DEA, 2018a). The
grants and loans have been allocated for the implementation of various projects broadly aiming to:
Increase energy efficiency and demand-side management interventions in energy-intensive sectors;
Increase the development and implementation of green economy projects which are capable of
demonstrating social, economic and environmental impact; and
Capacitate municipalities in terms of disaster preparedness as well as ongoing infrastructure expansion
projects.
The South African government has also created funds specifically for climate change initiatives. These include
the Green Fund managed by the Development Bank of Southern Africa (DBSA) and DEA as well as the Green
Industries Fund managed by the IDC.
International Climate Finance Support
Over and above the financial support the South African government has dedicated to various low-carbon
initiatives, the country has received significant bilateral and multilateral financial support from various countries
and international bodies. A breakdown of the total international financial support South Africa has received from
2000 is a total of USD 294.7 million in bilateral and multilateral grants from various countries including Germany,
Norway, Switzerland and the United Kingdom (DEA, 2018a). In terms of loans, South Africa has received almost
USD 3 billion in the form of bilateral and multilateral loans from countries such as France and international
development bodies such as the European Investment Bank and the World Bank.

55
Figure 7: International Climate Finance Support South Africa has received from 2000 - 2014
Source: DEA (2018c)
The various sources of grants and loans the country has received thus far have been from countries which have
long standing cooperation projects with South Africa on themes such as such as clean energy development and
energy efficiency capacity building (e.g. Norway and Germany), as well as development finance institutions which
have seen value in financing domestic projects which the South Africa government has implemented in
conjunction with external partners such as UNIDO (e.ge The IEE Project).
In addition to the various international funds, the country continues to receive non-monetised support from
developed countries in the form of technical support and capacity building (DEA, 2018a).
Intervention
Develop and implement Climate Change Finance Strategy
1,152
156
1,826
139
-
200
400
600
800
1,000
1,200
1,400
1,600
1,800
2,000
Bilateral Loans Bilateral Grants Multilateral Loans Multilateral Grants
Mill
ion
USD

56
14 INSTITUTIONAL ARRANGEMENTS FOR THE SOUTH AFRICAN LEDS
The DEA is the central coordinating and policy making authority with respect to climate change response in South
Africa. The integration of climate change planning and action between the different levels of government is
directed by the NCCRP. Table 2 provides an overview of the domestic institutional arrangements in place to
coordinate the country’s low carbon development path.
Table 2 Institutional Arrangements to Address Climate Change Response Actions
Structure Function
Parliament and Portfolio
Committees
Oversee and monitor the implementation of the national climate change
responses
Make laws to support climate change responses in the country
The Inter-Ministerial Committee
on Climate Change (IMCCC)
The Minister of the
Environment and Minister
responsible for planning
monitoring and Evaluation in
the Presidency co-chair
meetings
Executive level committee that will coordinate and align climate change
response efforts, including statutory and regulatory needs
Forum of South African Directors-
General clusters
South African Directors-General clusters based on their different mandates
will guide national climate change responses – represent various sectors
Intergovernmental Committee on
Climate Change (IGCCC)
Consists of the relevant
national, provincial
departments and local
government
Operationalise cooperative governance on the climate change issues
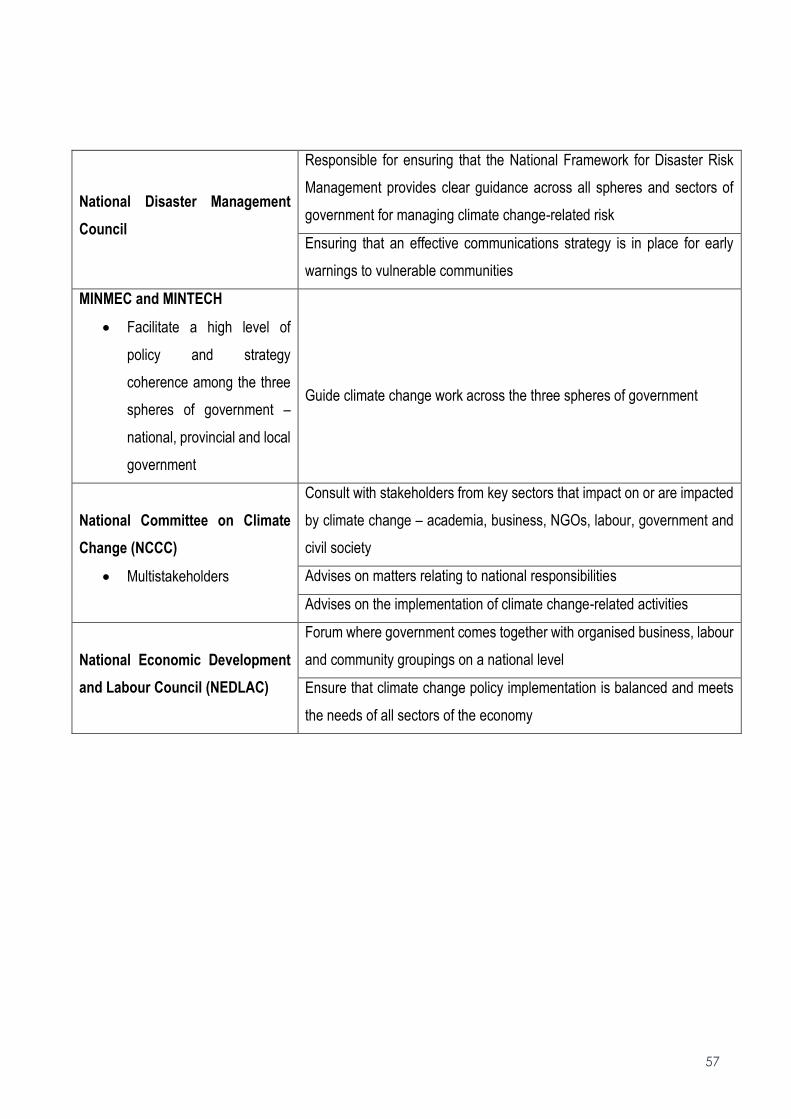
57
National Disaster Management
Council
Responsible for ensuring that the National Framework for Disaster Risk
Management provides clear guidance across all spheres and sectors of
government for managing climate change-related risk
Ensuring that an effective communications strategy is in place for early
warnings to vulnerable communities
MINMEC and MINTECH
Facilitate a high level of
policy and strategy
coherence among the three
spheres of government –
national, provincial and local
government
Guide climate change work across the three spheres of government
National Committee on Climate
Change (NCCC)
Multistakeholders
Consult with stakeholders from key sectors that impact on or are impacted
by climate change – academia, business, NGOs, labour, government and
civil society
Advises on matters relating to national responsibilities
Advises on the implementation of climate change-related activities
National Economic Development
and Labour Council (NEDLAC)
Forum where government comes together with organised business, labour
and community groupings on a national level
Ensure that climate change policy implementation is balanced and meets
the needs of all sectors of the economy

58
15 PROVINCIAL AND LOCAL GOVERNMENT
South Africa has three levels of government (i.e. national, provincial and local). The autonomy of each of the
levels of government is guaranteed by the Constitution.
The draft Climate Change Bill empowers the provinces to establish Provincial Committee on Climate Change –
where sectors and local government engage on climate change responses within the provinces. Also provinces
and municipalities are required to prepare implementations plans informed by their specific needs.
Intervention
Development and implementation of provincial and local climate change implementation plans

16 UPDATING OF THE SOUTH AFRICAN LEDS
The South Africa LEDS must be viewed as dynamic and should be updated at regular intervals based on new
emerging information or relevant body of work. As a matter of principle, the South African LEDS will be reviewed
at least every five years or at an earlier date, should there be massive change in sectoral or national
plans/programmes that can result in a big structural changes/growth/ decay of the economy.
17 REFERENCES
Anglo American. (2016). Climate Change: Our Plans, Policies and Progress. Johannesburg: Anglo American.
ASSAf. (2017). First Biennial Report on the State of Climate Change: Science and Technology in South Africa.
Pretoria: Academy of Science of South Africa.
Berliner, D.D. 2009. Systematic Conservation Planning for South Africa’s Forest Biome: An assessment of the
conservation status of South Africa’s forests and recommendations for their conservation. PhD dissertation,
University of Cape Town
Bhorat, H. and Rooney, C. (2017). State of Manufacturing in South Africa. Development Policy Research Unit.
Cape Town: University of Cape Town.
Brand SA, 2011. https://www.brandsouthafrica.com
DAFF. (2017). Conservation Agriculture Policy of 2017. Pretoria: Department of Agriculture, Forestry and
Fisheries.
DAFF. (2017). Agroforestry Strategic Framework for South Africa. Pretoria: Department of Agriculture, Forestry
and Fisheries
DEA. (2004). A National Climate Change Response Strategy for South Africa. Pretoria: Department of
Environmental Affairs.
DEA. (2009). National Environmental Management: Waste Act (No. 59 of 2008). Government Gazette, No.
32000. Pretoria: Republic of South Africa.
DEA. (2011). National Climate Change Response White Paper. Pretoria: Department of Environmental Affairs.

60
DEA. (2012). National Waste Management Strategy. Government Gazette, No. 35306. Pretoria: Republic of
South Africa.
DEA. (2013). Long-Term Adaptation Scenarios Phase One – Technical Report. Pretoria: Department of
Environmental Affairs.
DEA. (2015). South Africa’s Intended Nationally Determined Contribution. Pretoria: Department of
Environmental Affairs.
DEA. (2017a). South Africa’s Biennial Update Report. Pretoria: Department of Environmental Affairs.
DEA. (2017b). GHG National Inventory Report South Africa 2000 – 2012. Pretoria: Department of
Environmental Affairs.
DEA. (2017c). GHG National Inventory Report South Africa 2000 – 2012. Pretoria: Department of
Environmental Affairs.
DEA. (2017d). Draft National Climate Change Adaptation Strategy. Pretoria: Department of Environmental
Affairs.
DEA. (2017e). Draft South Africa’s Third National Communication under the UNFCCC. Pretoria: Department of
Environmental Affairs.
DEA. (2018a). South Africa State of Waste Report – Draft Report. Pretoria: Department of Environmental
Affairs.
DEA, (2018d). The estimation of the individual and the total effect of policies in South Africa. Pretoria:
Department of Environmental Affairs.
DoE. (2015). Energy Balances 2015. [Online]. Pretoria: Department of Energy. Available at:
http://www.energy.gov.za/files/media/Energy_Balances.html [Accessed on 21 June 2018].
DOE. (2005). National Energy Efficiency Strategy. Department of Energy. Pretoria: Republic of South Africa
DoE. (2016), Draft Post-2015 National Energy Efficiency Strategy. Government Gazette, No. 40515.
Department of Energy. Pretoria: Republic of South Africa.
DOE. (2018), Draft Integrated Resource Plan 2018. Government Gazette, No. 41865. Department of Energy.
Pretoria: Republic of South Africa.
DoT. (2007). Public Transport Strategy. Pretoria: Department of Transport.
61
DoT. (2018). Draft Green Transport Strategy: 2017 – 2050. Government Gazette, No. 41064. Pretoria:
Department of Transport.
Douwes, E., Rouget, M., Diederichs, N., O’Donoghue, S. and Roy, K. (2015). Buffelsdraai Landfill Site
Community Reforestation Project. Durban: XIV World Forestry Congress.
DST. (2007). Innovation towards a Knowledge-based Economy: Ten-year Plan for South Africa (2008- 2018).
Pretoria: Department of Science and Technology.
DTI. (2007). National Industrial Policy Framework. Pretoria: Department of Trade and Industry.
Eberhard, A. and Naude, R. (2017). The South African Renewable Energy IPP Procurement Programme:
Success Factors and Lessons. Cape Town: Graduate School of Business, University of Cape Town.
(ERC, 2018). South African Times Model. Cape Town. University of Cape Town
Eskom. (2016). Effective Management of Energy Demand. [Online] Johannesburg: Eskom. Available at:
http://www.eskom.co.za/sites/idm/Business/Documents/EskomAdvisoryService14042016.pdf [Accessed 21
June 2018].
Eskom. (2017). Eskom Integrated Report: Enabling Economic Growth. Johannesburg: Eskom.
Government Communication and Information System. (2017). South Africa Yearbook 2016/2017 on Energy:
Pretoria: Republic of South Africa
GeoTerraImage. (2013). Modelling of Land-Cover Change in South Africa (2001 – 2010) in Support of Green
House Gas Emissions Reporting: Summary report and metadata. Johannesburg: Wits Commercial Enterprise.
GIZ-SALGA. (2015). Energy Efficiency in New Buildings: GIZ-SALGA Renewable Energy Case Study Series.
Pretoria: The South Africa Local Government Association.
Prof Linda Godfrey. 2016. Integrating informal waste pickers into the economy. Council for Scientific and
Industrial Research: Republic of South Africa.
Hargreaves et al, 2003. Public Attitudes to Environmental Change: a selective review of theory and practice:
United Kingdom
IPCC. (2014). Climate Change 2014: Synthesis Report. Contributions of Working Groups I, II and III to the Fifth
Assessment Reporting of the Intergovernmental Panel on Climate Change. Geneva: Intergovernmental Panel
on Climate Change.
62
IPCC. (2006). Guidelines for National Greenhouse Gas Inventories. Japan: Institute for Global Environmental
Strategies.
IPPO. (2016). Market Overview and Current Levels of Renewable Energy Deployment in South Africa –
Stakeholder Consultation Workshop. Pretoria: Independent Power Producers office.
Nair et al. 2010. Carbon Sequestration in Agroforestry Systems. Adv Agron 108: 337-307
NCPC. (2015). South African Industrial Energy Efficiency Project. National Cleaner Production Centre. Pretoria,
South Africa.
NDP. (2011). National Development Plan Vision 2030. Pretoria. National Planning Commission
RSA. (1996). Constitution of the Republic of South Africa. Department of Justice. Pretoria, South Africa.
South Africa Petroleum Industry Association. 2017 Annual Report: Republic of South Africa
Scholes, R., von Maltitz, G., Archibald, S., Wessels, K., van Zyl, T., Swanepoel, D. and Steenkamp, K. (2013).
National Carbon Sink Assessment: First Estimate of Terrestrial Stocks and Fluxes. Pretoria.
Stats SA. (2017a). Mid-year Population Estimates: Statistical Release P0441. Pretoria: Statistics South Africa.
Stats SA. (2017b). Economic Sectors That Contribute to South Africa’s GDP: Statistical Release P0302.
Pretoria: Statistics South Africa.
UCT. (2017). South Africa and the G20: Where Do We Stand on Greenhouse Gas Emissions? [Online].
Available at: https://www.news.uct.ac.za/article/-2017-07-05-south-africa-and-the-g20-where-do-we-stand-on-
greenhouse-gas-emissions [Accessed 10 May 2018].
UNFCCC. (2015). Adoption of the Paris Agreements – 21st Conference of the Parties. Paris: United Nations.
Warburton and Schulze. (2006): Climate Change and the South African Commercial Forestry Sector. School of
Bioresources Engineering and Environmental Hydrology: University of KwaZulu-Natal, Pietermaritzburg, South
Africa
WEC. (2014). 2014 Energy Trilemma Index: Benchmarking the Sustainability of National Energy Systems.
London: World Energy Council.
WWF. (2013). An Introduction to South Africa’s Water Sources. Johannesburg: World Widelife Fund.