emerging trends in real estate 2018 - microsoft · recession bbb bond yield real estate cap rate...
TRANSCRIPT
Emerging Trends in Real Estate 2018
Navigating at Altitude
“We are in a long cycle, not in boom/bust. The key to the next few years is to expand horizons, market by market, property type by property type.”

Emerging Trends in Real Estate 2018
• Emerging Trends is the industry’s “most predictive forecast”
• 39th annual outlook• Based on personal interviews with over 1,000
individuals representing 590 organizations combined with an additional 1,600 online surveys
• 52 Market Focus Groups• Sponsored jointly by PwC and the Urban Land
Institute
Emerging Trends in Real Estate 20182
How do we feel about 2018?
Emerging Trends in Real Estate 20183
How would you characterize the expected profitability of your real estate business in 2018?
A. Good-ExcellentB. FairC. Abysmal-Poor
Emerging Trends in Real Estate 2018
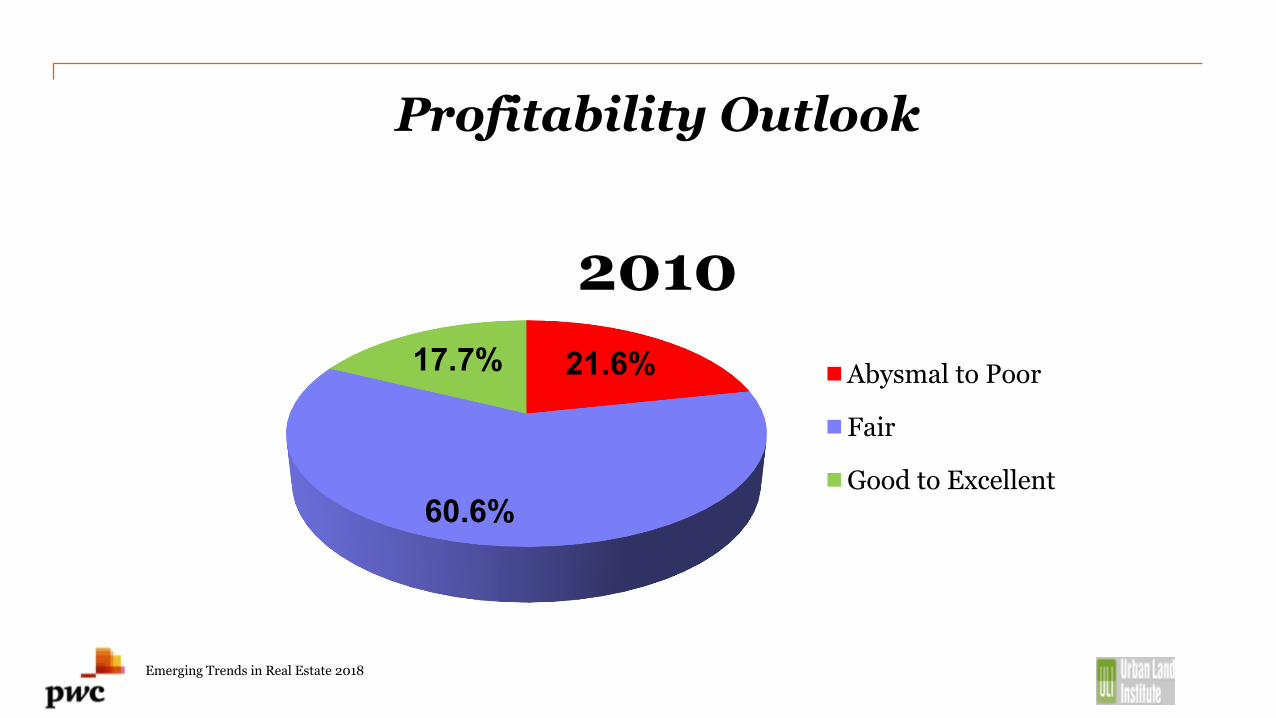
Profitability Outlook
21.6%
60.6%
17.7%
2010Abysmal to Poor
Fair
Good to Excellent
Emerging Trends in Real Estate 2018
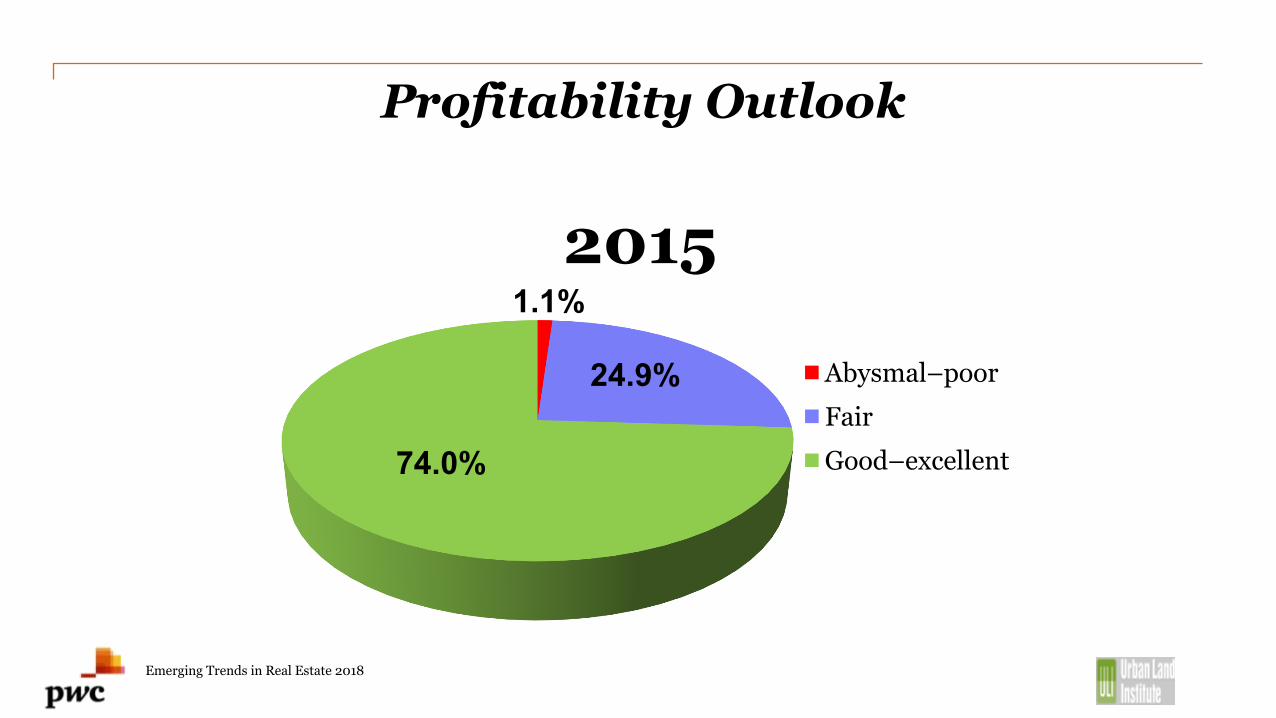
Profitability Outlook
1.1%
24.9%
74.0%
2015
Abysmal–poorFairGood–excellent
Emerging Trends in Real Estate 2018

1.9%
16.8%
81.3%
2017Abysmal -poorFair
Good -Excellent
Profitability Outlook
Emerging Trends in Real Estate 2018

Emerging Trends in Real Estate 2018
Profitability Outlook
1.1%
19.3%
79.6%
2018Abysmal–poorFairGood–excellent
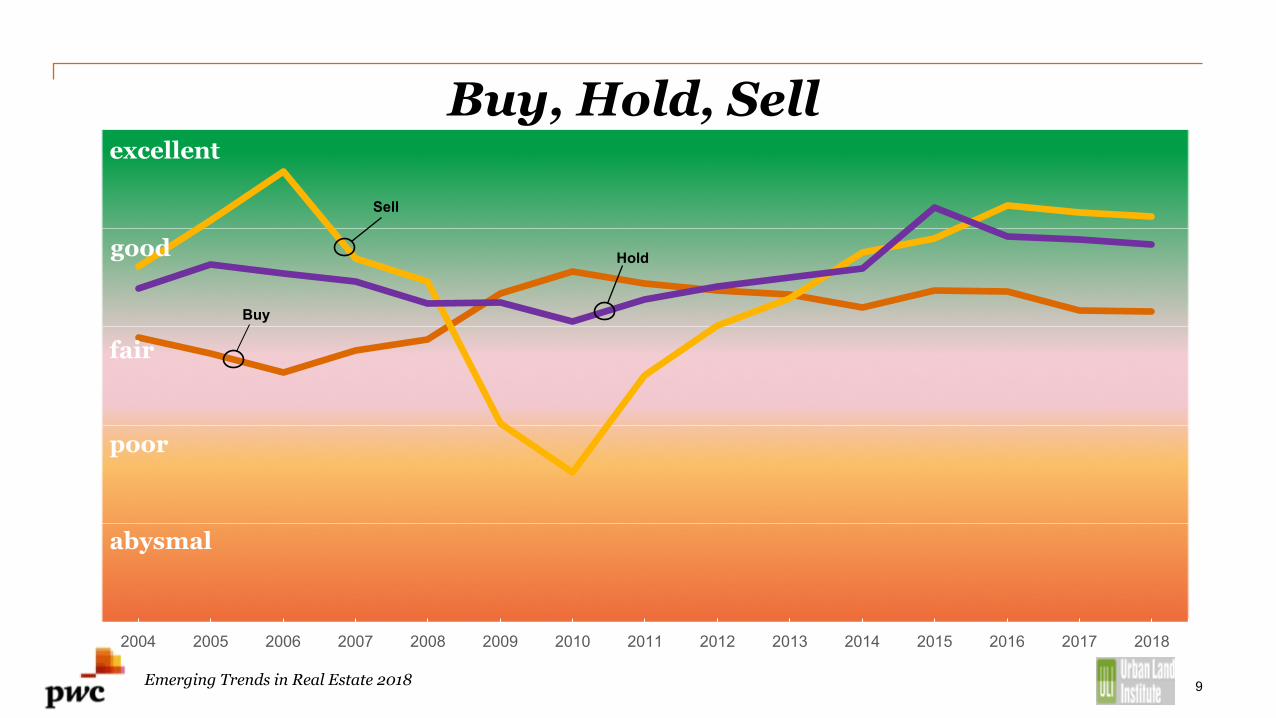
Buy, Hold, Sell
2004 2005 2006 2007 2008 2009 2010 2011 2012 2013 2014 2015 2016 2017 2018
good
Sell
Buy
9
excellent
fair
poor
abysmal
Hold
Emerging Trends in Real Estate 2018

What word would you use to describe the 2018 real estate market?
Emerging Trends in Real Estate 201810
#1
Top 5
#2
#3
#4
#5 Growing
Uncertain
Measured
Cautious
Competitive

Biggest Movers from 2017
16.7%
23.3%
24.1%
26.5%
37.5% Sanguine
Neutral
Troublesome
Frenzy
Treacherous
Emerging Trends in Real Estate 2018

PwC
Emerging Trends in 2017
12
Slow Glide to a
Soft Landing
Working Smarter and
Harder
Retail Transforms and Stores Remain
Procession of Generations: Gen Z
Don’t Forget the BoomersIt’s Different This Time…Isn’t it?
Housing at aTechnological Tipping Point

Long glide path to a soft landing
Emerging Trends in Real Estate 201813
“I hate ‘the what inning are we in’ question. It makes it seem like cycles have to end after a pre-set time has elapsed.”

Current expansion, slow by comparison but is it more sustainable?
1975 - 1980 - 59 months
1980 - 1981 - 13 months
1982 - 1990 - 93 months
1991 - 2001 - 121 months
2001 - 2007 - 74 months
2009 to Current - 101 months…
0.0%
0.5%
1.0%
1.5%
2.0%
2.5%
3.0%
3.5%
4.0%
4.5%
0.0% 1.0% 2.0% 3.0% 4.0% 5.0% 6.0%
Annu
al E
mpl
oym
ent G
row
th
Annual Real GDP Growth
GDP and employment growth during past recoveries and expansions
Source: NBER, Bureau of Economic Analysis, Bureau of Labor Statistics14
Size of bubble corresponds to length of expansion
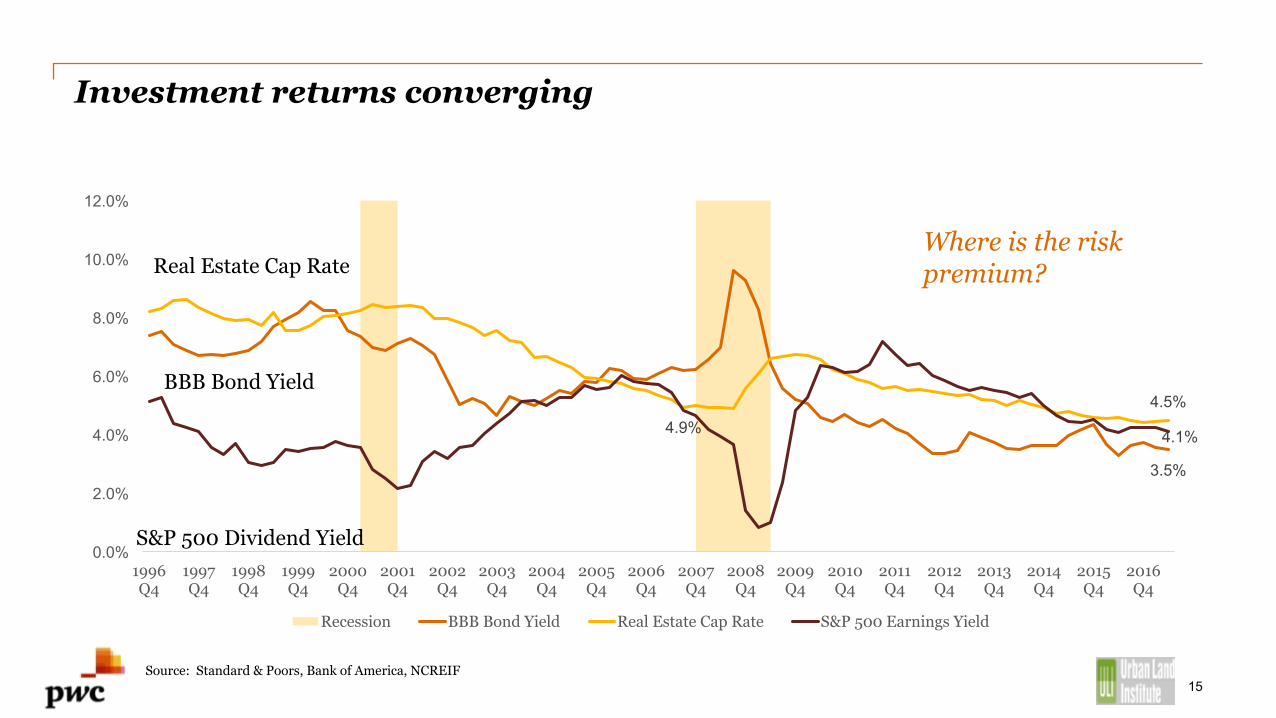
Investment returns converging
3.5%
4.9%4.5%
4.1%
0.0%
2.0%
4.0%
6.0%
8.0%
10.0%
12.0%
1996 Q4
1997 Q4
1998 Q4
1999 Q4
2000 Q4
2001 Q4
2002 Q4
2003 Q4
2004 Q4
2005 Q4
2006 Q4
2007 Q4
2008 Q4
2009 Q4
2010 Q4
2011 Q4
2012 Q4
2013 Q4
2014 Q4
2015 Q4
2016 Q4
Recession BBB Bond Yield Real Estate Cap Rate S&P 500 Earnings Yield
Real Estate Cap Rate
S&P 500 Dividend Yield
Where is the risk premium?
Source: Standard & Poors, Bank of America, NCREIF15
BBB Bond Yield

Working harder and working smarter
Emerging Trends in Real Estate 201816
“…Real estate facilities are not just overhead, but a way to improve not just employee happiness and engagement, but also productivity.”

Not the “Gig” economy, but the “Freelance” economy
Freelancing in America Report, 2017 17

Efficiency of US office stock
15.2%
7.6%8.6%
12.9%
24.0%
12.7%15.0%
4.0%
0.00%
5.00%
10.00%
15.00%
20.00%
25.00%
30.00%
1940s 1950s 1960s 1970s 1980s 1990s 2000s 2010s
Percent of Office Inventory by Decade ConstructedWhich makes what we said two years ago more relevant
Source: U.S. Energy Information Administration, CoStar18

Improvement over acquisition?
0.0%
0.5%
1.0%
1.5%
2.0%
2.5%
1990
Q4
1991
Q4
1992
Q4
1993
Q4
1994
Q4
1995
Q4
1996
Q4
1997
Q4
1998
Q4
1999
Q4
2000
Q4
2001
Q4
2002
Q4
2003
Q4
2004
Q4
2005
Q4
2006
Q4
2007
Q4
2008
Q4
2009
Q4
2010
Q4
2011
Q4
2012
Q4
2013
Q4
2014
Q4
2015
Q4
2016
Q4
Office cap ex as a % of market valueOffice capital expenditures may need to increase to meet changing tenant demand
Source: NCREIF 19
4Qtr moving average
30-year average
Best Bet!Income over
potential appreciation
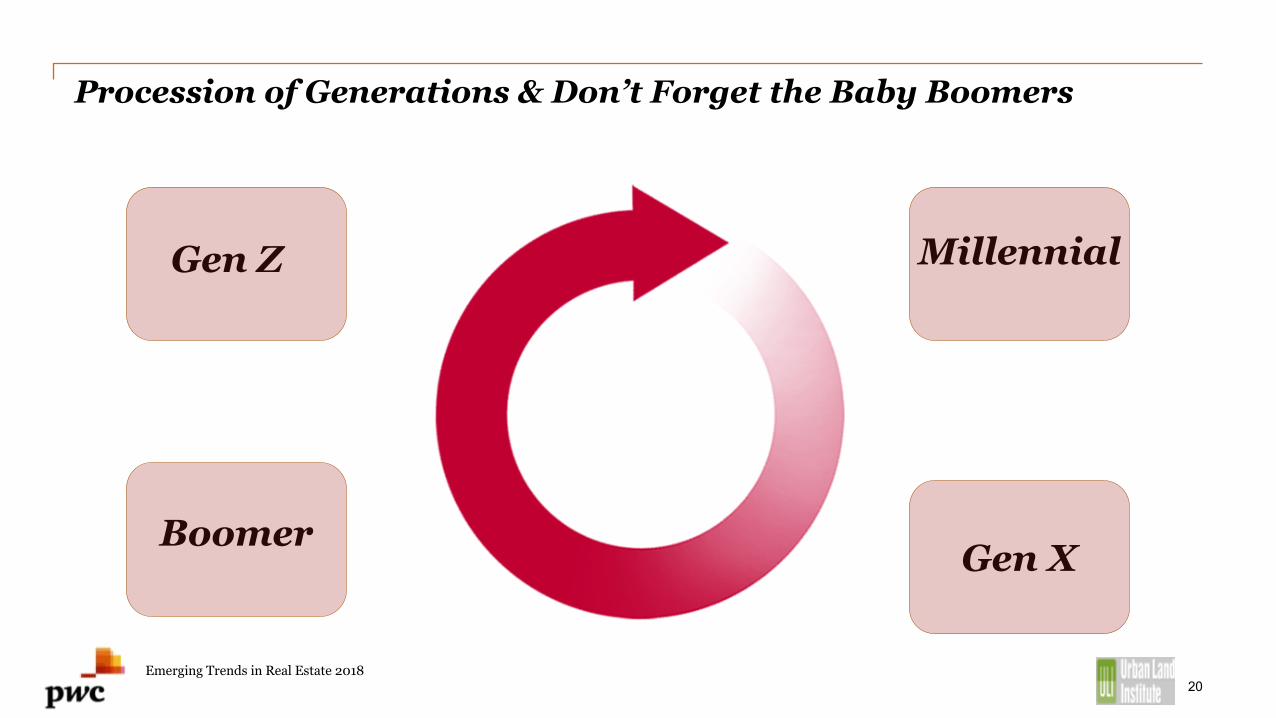
Procession of Generations & Don’t Forget the Baby Boomers
Emerging Trends in Real Estate 201820
Gen Z Millennial
Gen XBoomer
21
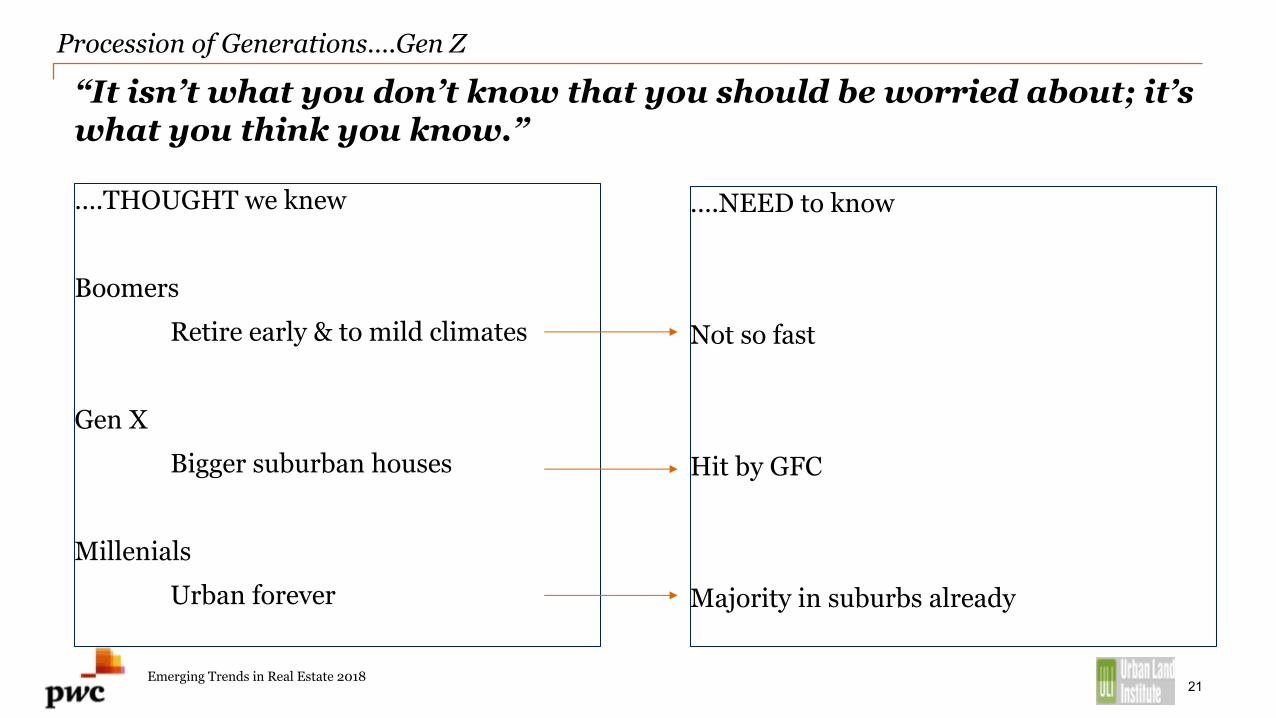
….THOUGHT we knew
BoomersRetire early & to mild climates
Gen XBigger suburban houses
MillenialsUrban forever
“It isn’t what you don’t know that you should be worried about; it’s what you think you know.”
….NEED to know
Not so fast
Hit by GFC
Majority in suburbs already
Procession of Generations….Gen Z
Emerging Trends in Real Estate 2018

Boomers plan to stay in the workforce longer
26.0% 26.0% 26.0%
35.0%
28.0%
33.0% 32.0%
17.0%
23.0%26.0%
28.0% 28.0%26.0% 27.0%
0.0%
5.0%
10.0%
15.0%
20.0%
25.0%
30.0%
35.0%
40.0%
2011 2012 2013 2014 2015 2016 2017
Planned Retirement Age
Age 65 to 69 Age 70 or older
Source: Insured Retirement Institute, "Boomer Expectations for Retirement 2017"22

More older workers in the workplace…
0 2,000,000 4,000,000 6,000,000 8,000,000 10,000,000 12,000,000
2024
2014
2004
1994
Labor force ages 65 to 74
labor force participation rate
Source: Bureau of Labor Statistics23
17.2%
21.9%
26.2%
29.9%
Best Bet!Senior housing
gains momentum

The Next Trend: Gen Z
Ø Born 1995 to Present Ø 0 to 22 years oldØ 25.9% of America’s Population Ø Boomers are 23.6%Ø Millennials are 24.5%ØGrowing up in a post 9/11 WorldØ+ 50% increase in the multiracial youth
population since 2000ØLive in Multigenerational householdsØ80% know about human impact on the
planet/76% are concerned about the impact
Ø17 Jobs and 15 homes in a life time
Emerging Trends in Real Estate 2018

Housing at a tipping point
Emerging Trends in Real Estate 201825
“I’ve been hearing talk about how technology will transform the way builders build homes. Now, I look at what’s been happening, and for the first time ever, I’m thinking it’s more than talk”

Higher sales prices won’t guarantee more new homes
Seattle
Austin
Salt Lake City
Raleigh/DurhamDallas/Fort Worth
Fort LauderdaleLos Angeles
San Jose
Nashville
Boston
MiamiMinneapolis/St. Paul
Atlanta
0.0%
10.0%
20.0%
30.0%
40.0%
50.0%
60.0%
70.0%
80.0%
0.0% 20.0% 40.0% 60.0% 80.0% 100.0% 120.0% 140.0% 160.0% 180.0%
% c
hang
e in
hou
sing
uni
ts (2
000-
2018
f)
% change in housing price index (2000 – 2018f)
Source: US Census Bureau, IHS Insight26
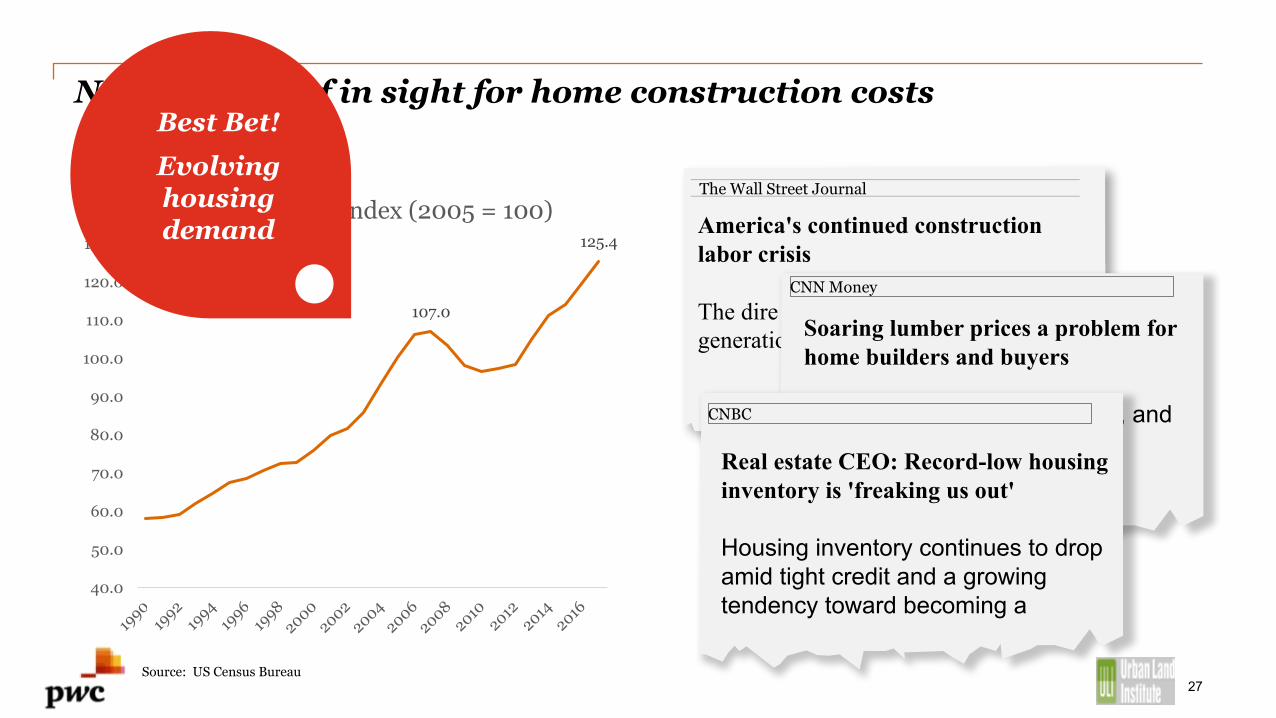
Not much relief in sight for home construction costs
107.0
125.4
40.0
50.0
60.0
70.0
80.0
90.0
100.0
110.0
120.0
130.0
New Home Price Index (2005 = 100)
Source: US Census Bureau27
America's continued construction labor crisis
The dire need to recruit the next generation of skilled workers
The Wall Street Journal
Soaring lumber prices a problem for home builders and buyers
The price of lumber is soaring, and home builders are worried.
CNN Money
CNBC
Real estate CEO: Record-low housing inventory is 'freaking us out'
Housing inventory continues to drop amid tight credit and a growing tendency toward becoming a
Best Bet!Evolving housing demand
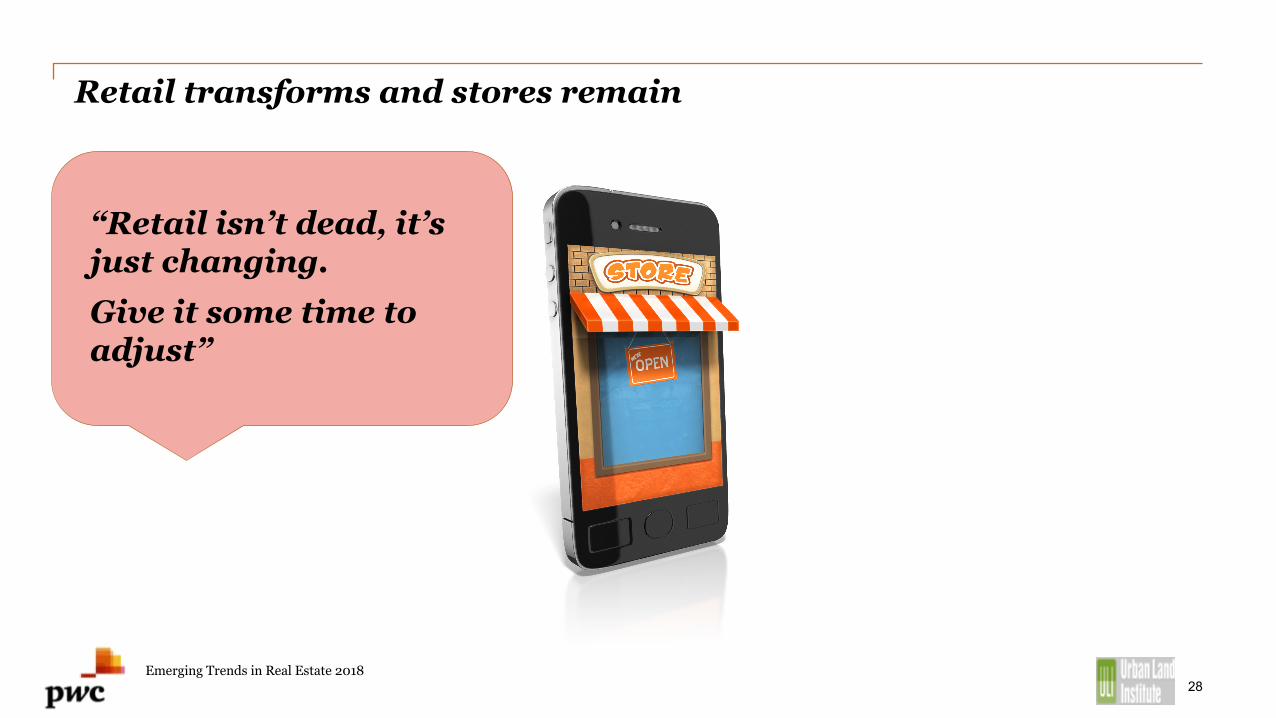
Retail transforms and stores remain
Emerging Trends in Real Estate 201828
“Retail isn’t dead, it’s just changing.Give it some time to adjust”
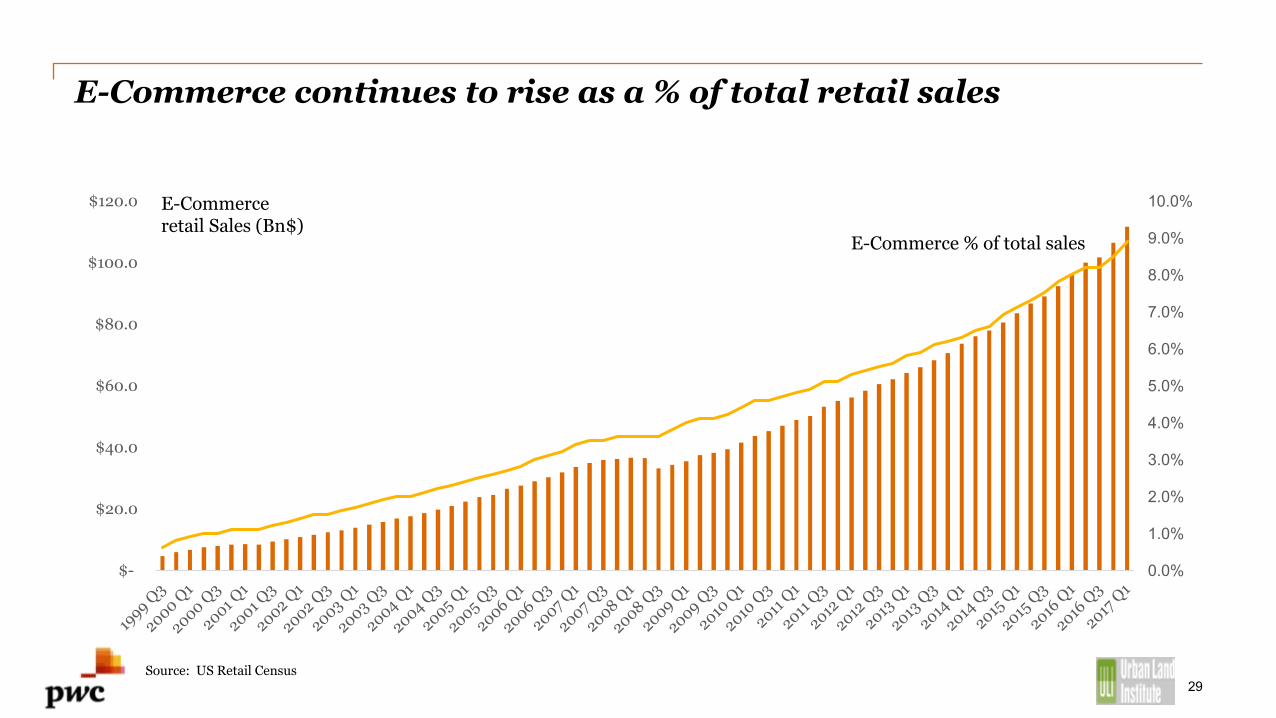
E-Commerce continues to rise as a % of total retail sales
0.0%
1.0%
2.0%
3.0%
4.0%
5.0%
6.0%
7.0%
8.0%
9.0%
10.0%
$-
$20.0
$40.0
$60.0
$80.0
$100.0
$120.0 E-Commerce retail Sales (Bn$)
E-Commerce % of total sales
Source: US Retail Census29

2016 retail sales distribution by channel (billions of $)
Electronic Shopping & Mail Order, $445.0
In-Store, $4,278.0
Online Sales Fulfilled from Store, $62.2
Source: US Census Retail Trade Sales Annual Report, ICSC Research30
Best Bet!Experiential
retail

The Top 10
2017 2018 Market4 1 Seattle1 2 Austin
18 3 Salt Lake City7 4 Raleigh/Durham2 5 Dallas/Fort Worth
35 6 Fort Lauderdale5 7 Los Angeles17 8 San Jose
6 9 Nashville
12 10 Boston
Markets to Watch
Emerging Trends in Real Estate 2018
Emerging Trends in Real Estate 2018
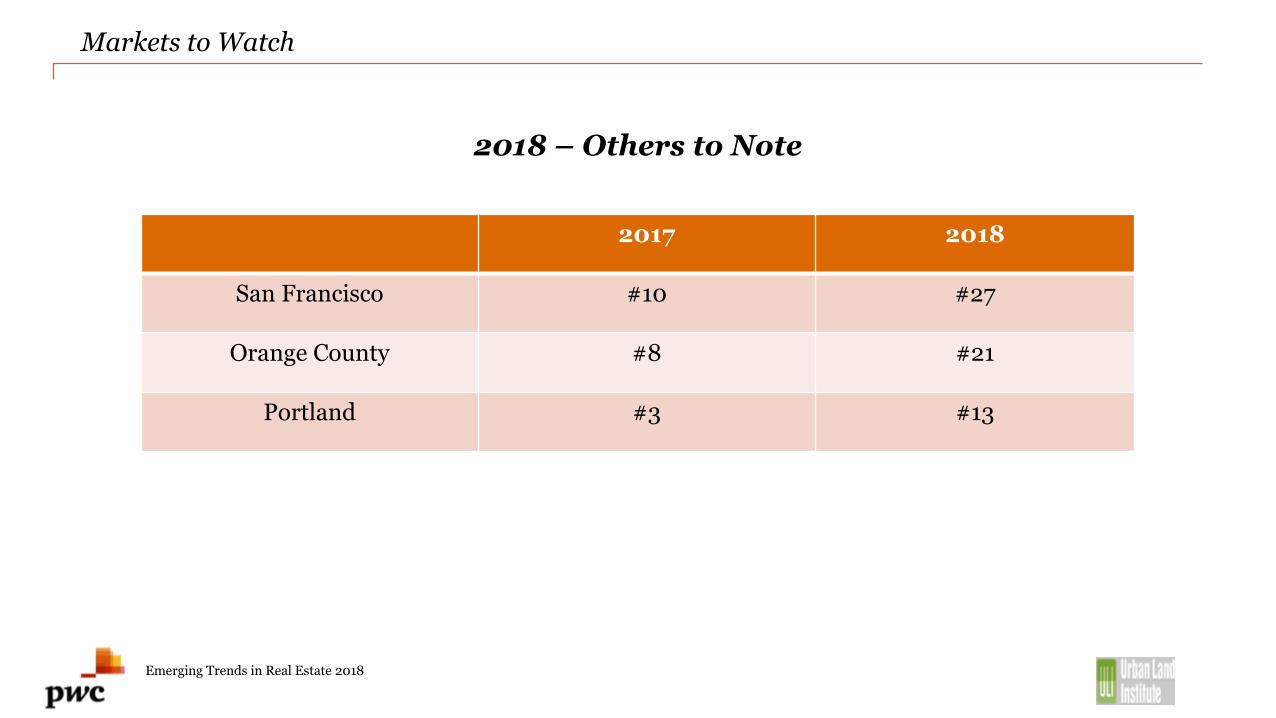
Markets to Watch
2018 – Others to Note
2017 2018
San Francisco #10 #27
Orange County #8 #21
Portland #3 #13

It’s different this time…Isn’t it? The market outlook
Emerging Trends in Real Estate 201833
# 1 Seattle
# 2 Austin
# 3 Salt Lake City
# 5 Dallas/Ft. Worth
# 4 Raleigh/Durham
# 6 Fort Lauderdale
# 7 Los Angeles
# 8 San Jose
# 9 Nashville
# 10 Boston
“Why deal with the uncertainty of a global market when there are opportunities in Salt Lake City
and San Antonio?”
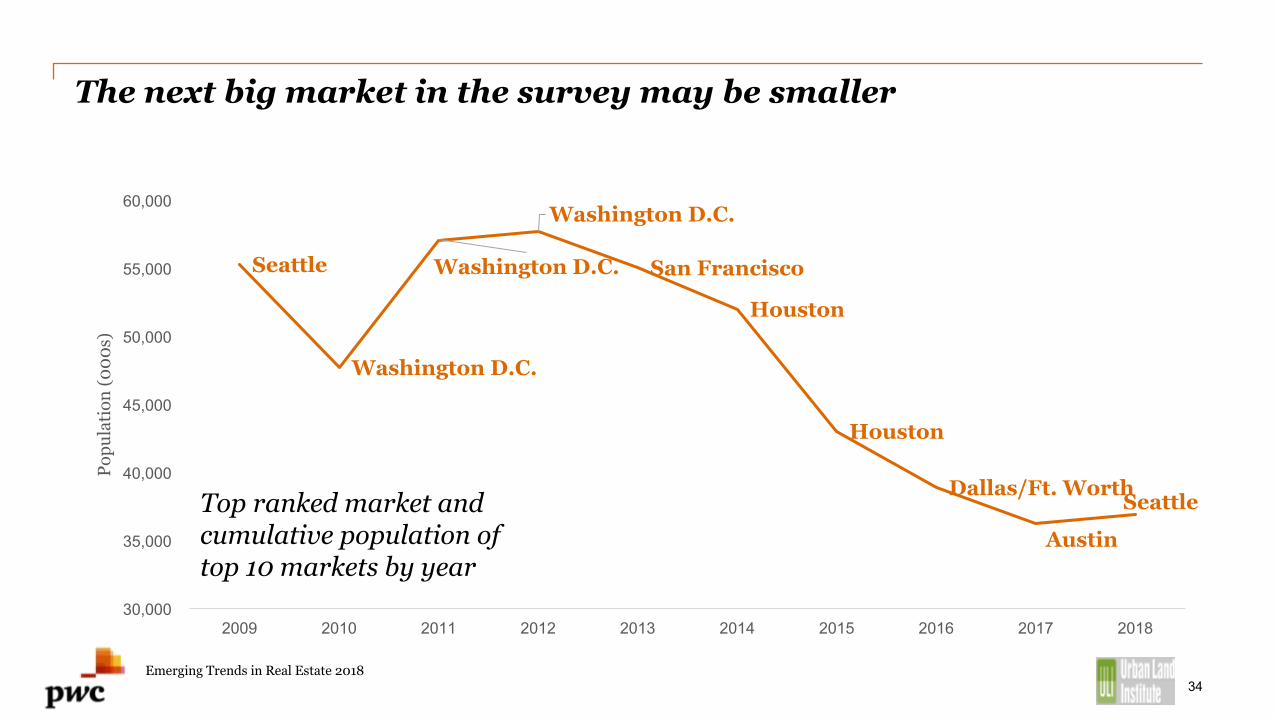
The next big market in the survey may be smaller
Seattle
Washington D.C.
Washington D.C.
Washington D.C.
San Francisco
Houston
Houston
Dallas/Ft. Worth
Austin
Seattle
30,000
35,000
40,000
45,000
50,000
55,000
60,000
2009 2010 2011 2012 2013 2014 2015 2016 2017 2018
Popu
latio
n (0
00s)
Top ranked market and cumulative population of top 10 markets by year
Emerging Trends in Real Estate 201834
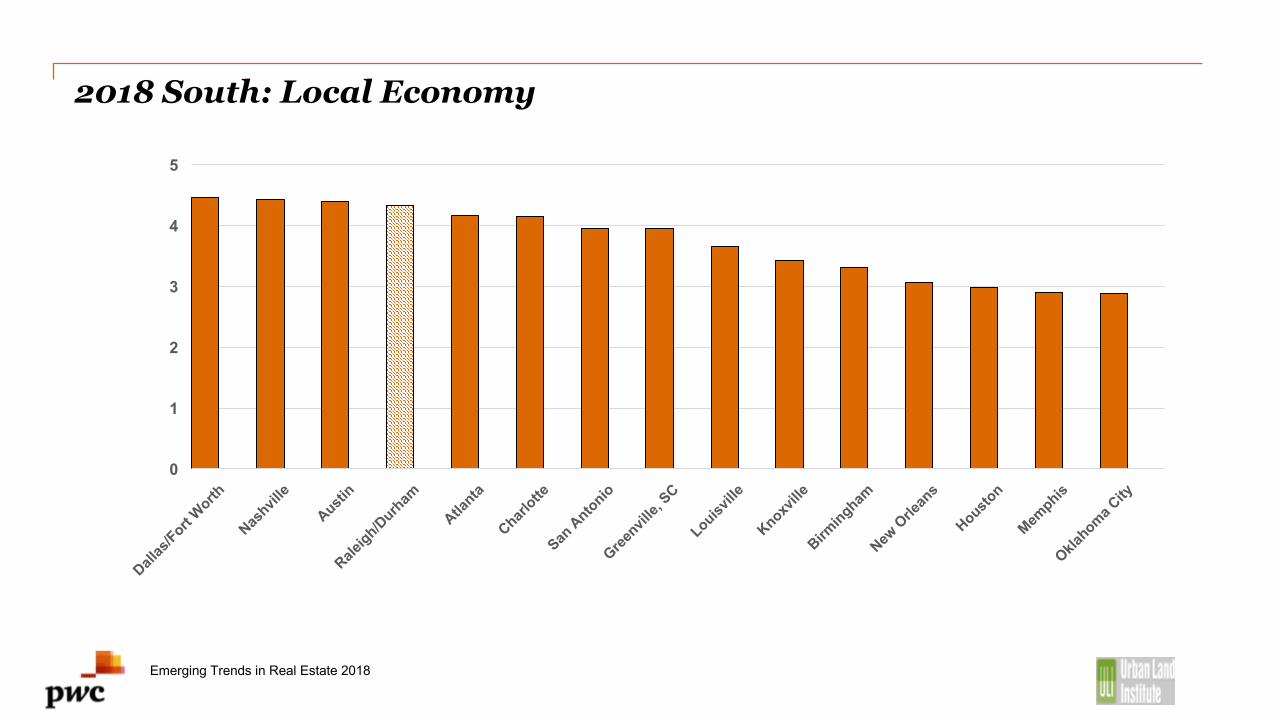
2018 South: Local Economy
Emerging Trends in Real Estate 2018
0
1
2
3
4
5

2018 South: Investor Demand
Emerging Trends in Real Estate 2018
0
1
2
3
4
5

2018 Sector Outlook: Raleigh/Durham
Emerging Trends in Real Estate 2018
0
1
2
3
4
5
Housing Office Multifamily Hotel Retail Industrial
Raleigh/Durham National
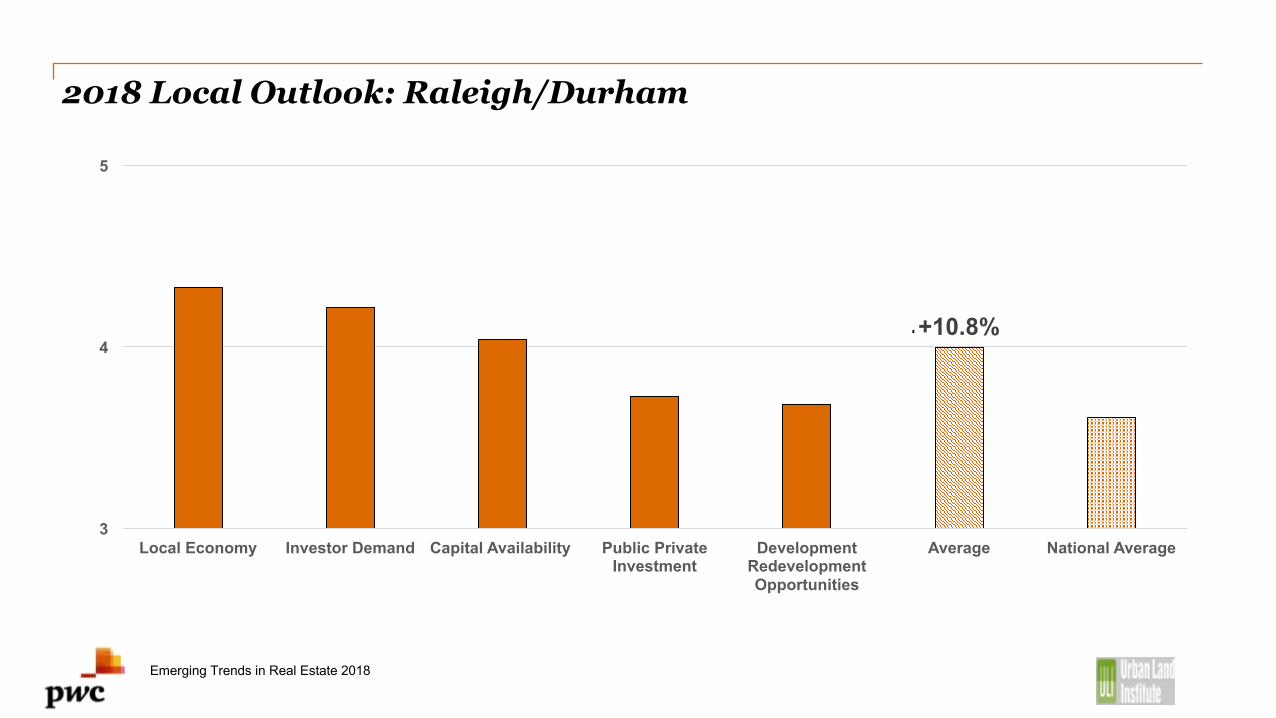
2018 Local Outlook: Raleigh/Durham
Emerging Trends in Real Estate 2018
+14%+10.8%
3
4
5
Local Economy Investor Demand Capital Availability Public Private Investment
Development Redevelopment Opportunities
Average National Average
Thank you, and now our panel!
Download your copy ofEmerging Trends in
Real Estate 2018
uli.org/et18pwc.com/us/etre
Emerging Trends in Real Estate 2018 39
2018 Real Estate TrendsNovember 8, 2017