emerging markets with strong dividends...emerging markets with strong dividends frank holmes, ceo...
TRANSCRIPT

usfunds.com 1.800.US.FUNDS July 2013 • 13-385
Emerging Markets with Strong Dividends Frank Holmes, CEO and Chief Investment Officer
usfunds.com July 2013 13-385
usfunds.com
2
Performance and Results Oriented
Winner of 29 Lipper performance awards, certificates and top rankings since 2000
(Four out of 13 U.S. Global Investors Funds received Lipper performance awards from 2005 to 2008, six out of 13 received certificates from 2000 to 2007,
and two out of 13 received top rankings from 2009 to 2010.)
Investment leadership results in performance

usfunds.com July 2013 13-385
usfunds.com
Fund Recognition: 2 Funds in the Top 12 Percent for 10-Year Period
33

usfunds.com July 2013 13-385
usfunds.com
Fund Recognition: Lipper Leaders
4
Lipper ratings for Preservation reflect funds’ historical loss avoidance relative to other funds within the same asset class, as of 6/30/2013. Preservation ratings are relative, rather than absolute, measures, and funds named Lipper Leaders for Preservation may still experience losses periodically; those losses may be larger for equity and mixed equity funds than for fixed income funds. Lipper ratings for Tax Efficiency reflect funds’ historical success in postponing taxable distributions relative to peers as of 6/30/2013.Tax Efficiency offers no benefit to in tax-sheltered accounts such as investors retirement plans. Past performance does not guarantee future results.
Global Emerging Markets Fund
Near-Term Tax Free Fund

usfunds.com July 2013 13-385
usfunds.com
5
Based on Risk-Adjusted Return

usfunds.com July 2013 13-385
usfunds.com
Focus on Education
6
43 MFEA STAR Awards for Excellence in Education

usfunds.com July 2013 13-385
usfunds.com
Branding – Education
7
Investor Alert and Advisor Alert are key communication tools
Our original, award-winning educational content is in high demand from investors via email, website, social media platforms, apps

usfunds.com July 2013 13-385
usfunds.com
Are YOU Reading U.S. Global’s Investor Alert? Jim Cramer Is.
8
Tweeted to his loyal 600,000 readers

usfunds.com July 2013 13-385
usfunds.com
Thailand Stock Market vs. S&P 500
9

usfunds.com July 2013 13-385
usfunds.com
Thailand Stock Market Up 42 Percent Under New Prime Minister
10
usfunds.com July 2013 13-385
usfunds.com
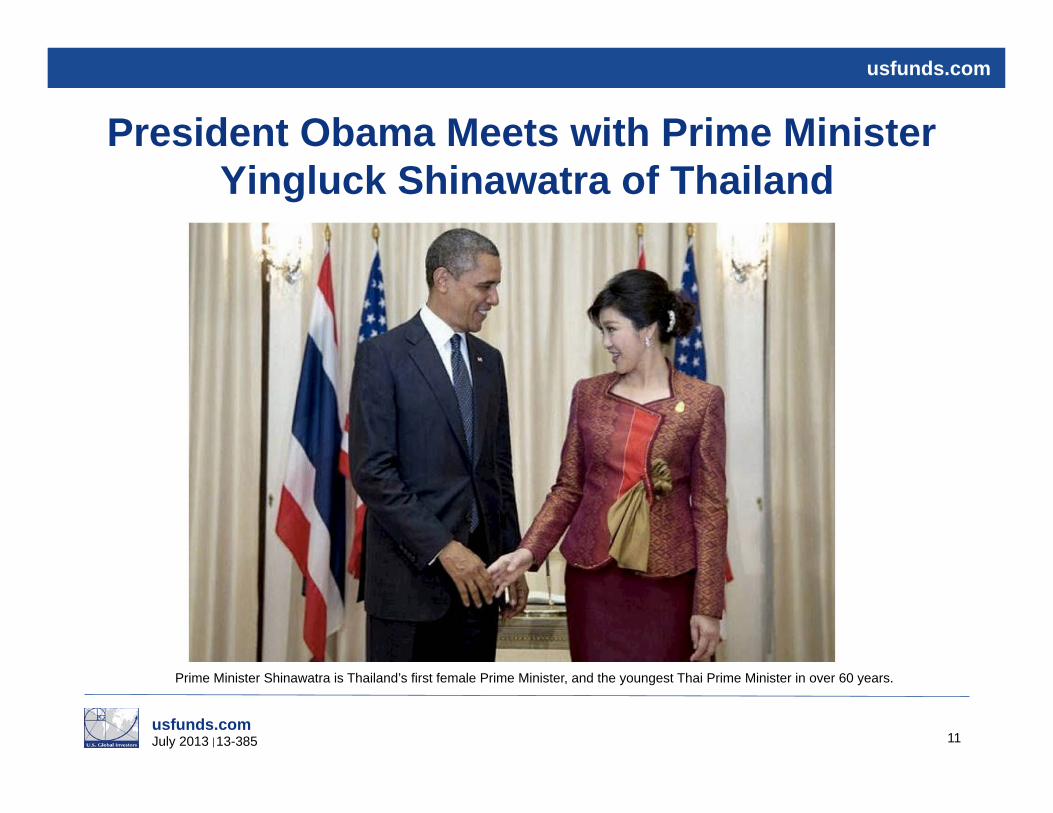
President Obama Meets with Prime Minister Yingluck Shinawatra of Thailand
11
Prime Minister Shinawatra is Thailand’s first female Prime Minister, and the youngest Thai Prime Minister in over 60 years.

usfunds.com July 2013 13-385
usfunds.com
President Obama Meets with Prime Minister Yingluck Shinawatra of Thailand
12
Prime Minister Shinawatra is Thailand’s first female Prime Minister, and the youngest Thai Prime Minister in over 60 years.

usfunds.com July 2013 13-385
usfunds.com
President Obama Meets with Prime Minister Yingluck Shinawatra of Thailand
13
Prime Minister Shinawatra is Thailand’s first female Prime Minister, and the youngest Thai Prime Minister in over 60 years.

usfunds.com July 2013 13-385
usfunds.com
President Obama Meets with Prime Minister Yingluck Shinawatra of Thailand
14
Prime Minister Shinawatra is Thailand’s first female Prime Minister, and the youngest Thai Prime Minister in over 60 years.

usfunds.com July 2013 13-385
usfunds.com
15

usfunds.com July 2013 13-385
usfunds.com
Metaphor: Tipping Points, Melting Points H2O is Like Money
16
Ice Turns to Water at 32º, but Still H2O
usfunds.com July 2013 13-385
usfunds.com
17
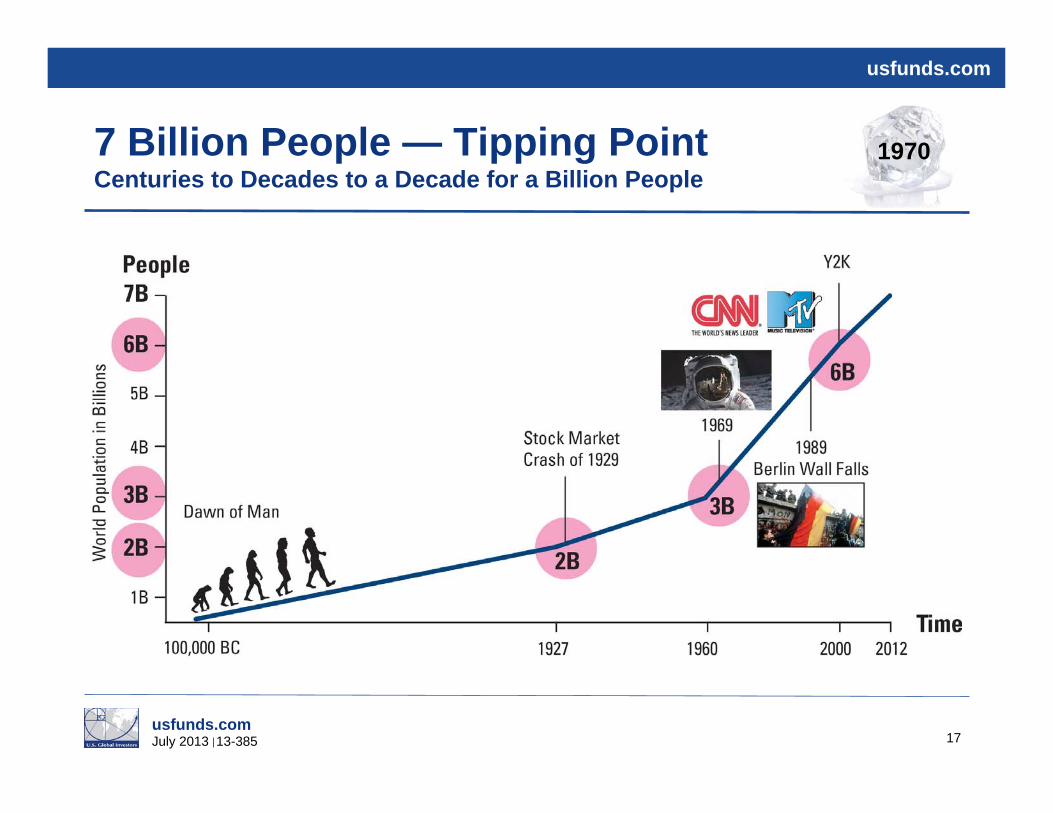
7 Billion People — Tipping Point Centuries to Decades to a Decade for a Billion People
1970

usfunds.com July 2013 13-385
usfunds.com
18
Government Policy Model — Precursor for Change
President Barack Obama Ben Bernanke, Chairman of the Federal Reserve

usfunds.com July 2013 13-385
usfunds.com
19
Emerging World Holds 50% of the Global Population, Just 22% of GDP

usfunds.com July 2013 13-385
usfunds.com
Compare E7 vs G7 Money Supply Growth Emerging World s Money Supply is Robust
20
usfunds.com July 2013 13-385
usfunds.com
21
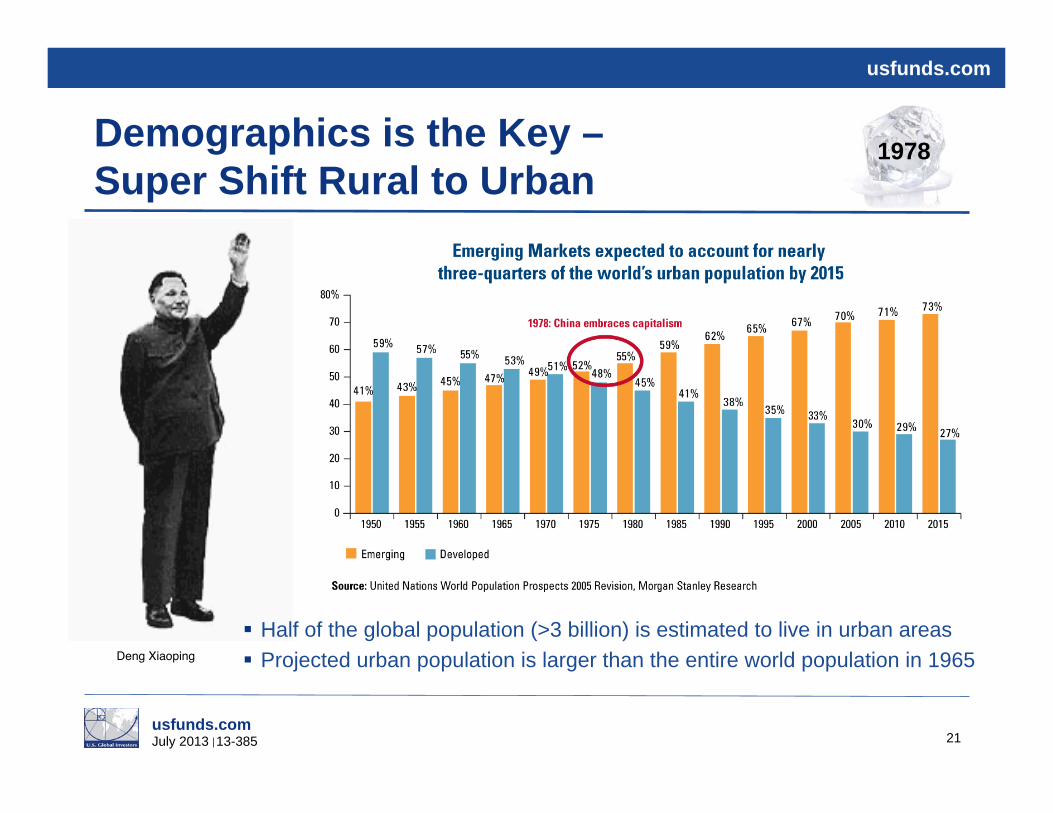
Demographics is the Key – Super Shift Rural to Urban
Half of the global population (>3 billion) is estimated to live in urban areas Projected urban population is larger than the entire world population in 1965 Deng Xiaoping
1978

usfunds.com July 2013 13-385
usfunds.com
Perpetual Global Central Bank Stimulus
22
usfunds.com July 2013 13-385
usfunds.com
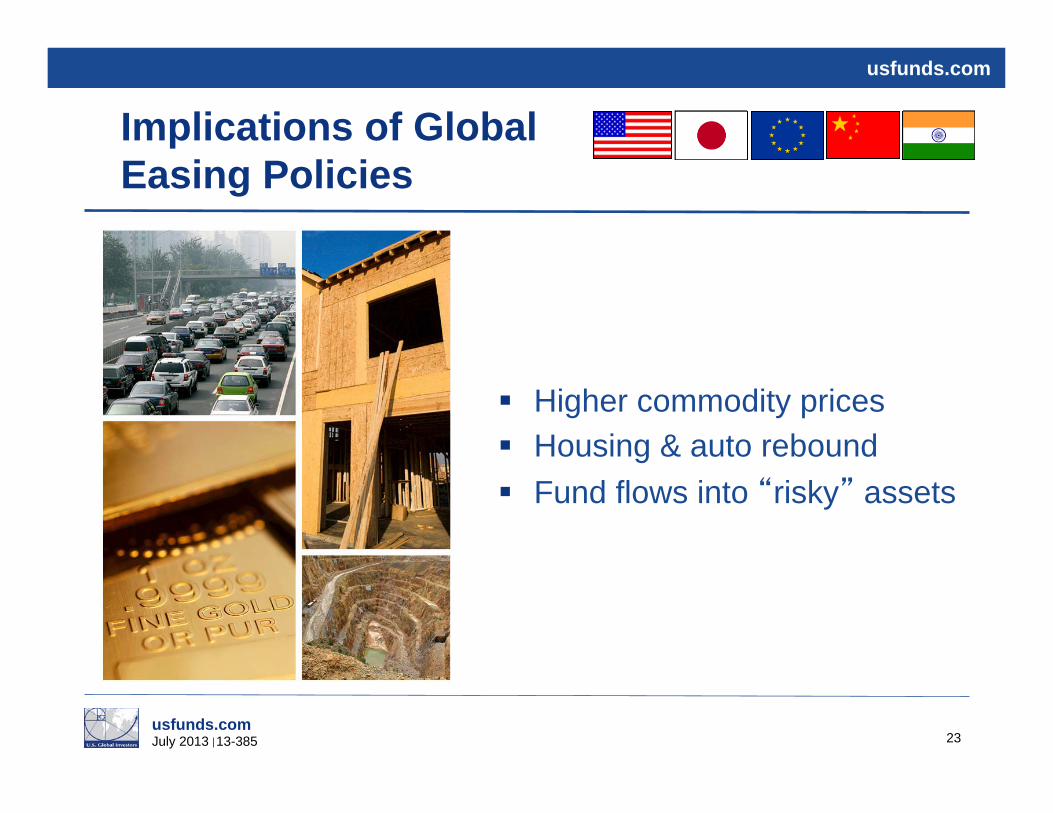
Implications of Global Easing Policies
Higher commodity prices Housing & auto rebound Fund flows into risky assets
23

usfunds.com July 2013 13-385
usfunds.com
Not Just the Fed: There s Been a Global Easing Cycle
24

usfunds.com July 2013 13-385
usfunds.com
G7 — Easy Money, Inflation in Check
25

usfunds.com July 2013 13-385
usfunds.com
E7— Emerging Markets Remain Attractive
26

usfunds.com July 2013 13-385
usfunds.com
Emerging Markets Have Higher Saving and Investment Rates than G7
27

usfunds.com July 2013 13-385
usfunds.com
E7 — Emerging Market Equities Offer Attractive Valuations
28

usfunds.com July 2013 13-385
usfunds.com
Predicted Increase in Centa-Millionaires from 2011 – 2016
29

usfunds.com July 2013 13-385
usfunds.com
30
American Dream Trade Massive Urbanization Trend in India and China
2020

usfunds.com July 2013 13-385
usfunds.com
China/India is 40% of the World Population but Only 20% of World GDP
31

usfunds.com July 2013 13-385
usfunds.com
China and India GDP Projected to Be Larger than G7 Countries’ GDPs
32

usfunds.com July 2013 13-385
usfunds.com
+$4 Trillion Infrastructure Spending Globally
33

usfunds.com July 2013 13-385
usfunds.com
34
Chindia – Rising Middle Class
Source: padanisaa.blogspot.com
2020

usfunds.com July 2013 13-385
usfunds.com
China GDP Will Almost Equal U.S. GDP by 2025
35

usfunds.com July 2013 13-385
usfunds.com
China’s Urban Residency Reform to Benefit Property Sales in Third Tier Cities
36

usfunds.com July 2013 13-385
usfunds.com
Official Urban Residence Status (Hukou) Lags Urban Population
37

usfunds.com July 2013 13-385
usfunds.com
High-Speed Rail is a Growth Opportunity for U.S. Companies
38
2014

usfunds.com July 2013 13-385
usfunds.com
Mobile Internet Adoption 4.5x Faster than Regular Internet in China
39

usfunds.com July 2013 13-385
usfunds.com
Accelerating Smartphone Penetration in China Should Benefit Handset Component Suppliers
40

usfunds.com July 2013 13-385
usfunds.com
Record Oil Demand in China
41

usfunds.com July 2013 13-385
usfunds.com
Chinese Economy: Bottomed Out?
42

usfunds.com July 2013 13-385
usfunds.com
Strong Dollar – Falling Commodity Prices
43

usfunds.com July 2013 13-385
usfunds.com
Price Reversal — Chinese Stocks Undervalued
44
Chinese Stocks Looking Like a Bargain October 22, 2012

usfunds.com July 2013 13-385
usfunds.com
China, The USD and Commodity Prices – High Correlation
45

usfunds.com July 2013 13-385
usfunds.com
Chinese Commodity Demand
46

usfunds.com July 2013 13-385
usfunds.com
China s GDP Growth Tends to Stabilize in Fifth Year of Leadership Transition Cycle
47

usfunds.com July 2013 13-385
usfunds.com
Asian Tigers
48

usfunds.com July 2013 13-385
usfunds.com
ASEAN Population vs. Trade Partner Countries/Regions
49
ASEAN is Association of Southeast Asian Nations
usfunds.com July 2013 13-385
usfunds.com
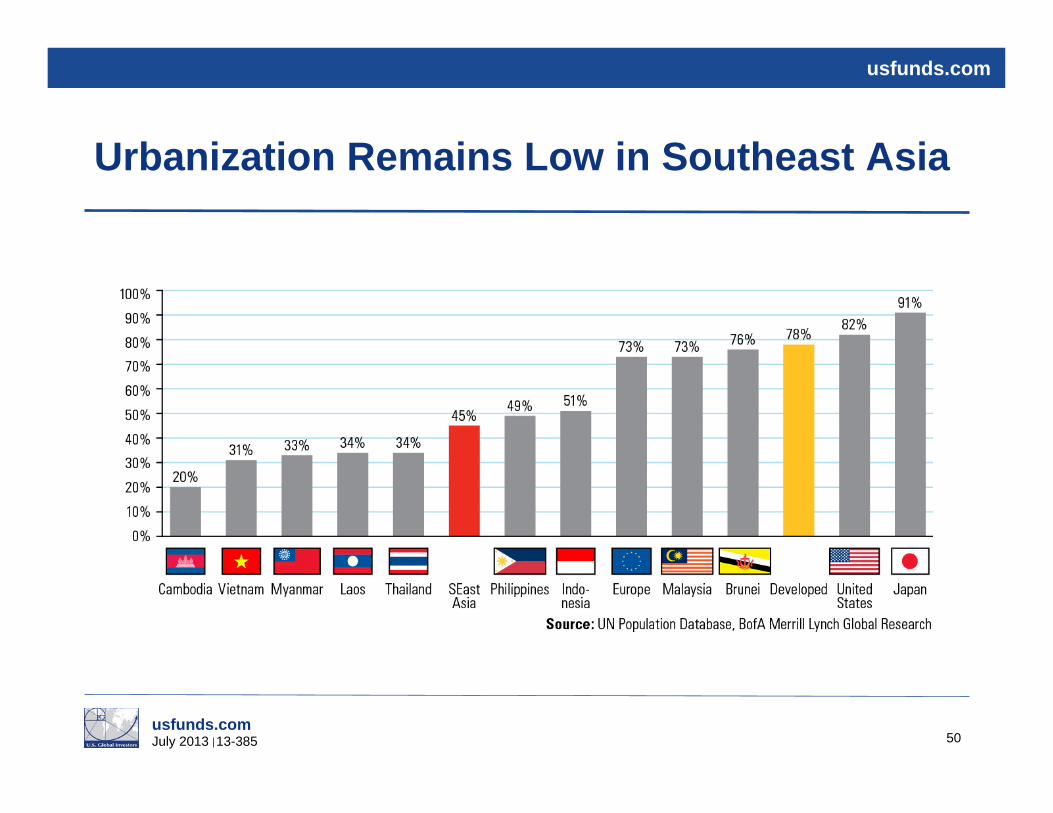
Urbanization Remains Low in Southeast Asia
50

usfunds.com July 2013 13-385
usfunds.com
Growing Labor Force in the ASEAN Area
51
ASEAN is Association of Southeast Asian Nations

usfunds.com July 2013 13-385
usfunds.com
Robust Growth of Visitor Arrivals in Southeast Asia to Benefit Tourism-Related Sectors
52

usfunds.com July 2013 13-385
usfunds.com
Eastern European Countries Among the Better Values
53

usfunds.com July 2013 13-385
usfunds.com
Growth in Turkey
54

usfunds.com July 2013 13-385
usfunds.com
Manufacturing Output in Turkey Stronger Than Europe
55

usfunds.com July 2013 13-385
usfunds.com
Turkish Stocks Still Attractive After the Selloff
56

usfunds.com July 2013 13-385
usfunds.com
Expected Rate Hikes Causing Correction in Turkish Stocks
57

usfunds.com July 2013 13-385
usfunds.com
Poland’s PMI Bouncing Back
58

usfunds.com July 2013 13-385
usfunds.com
Contrarian Investing Model — Buy Signal
59
usfunds.com July 2013 13-385
usfunds.com
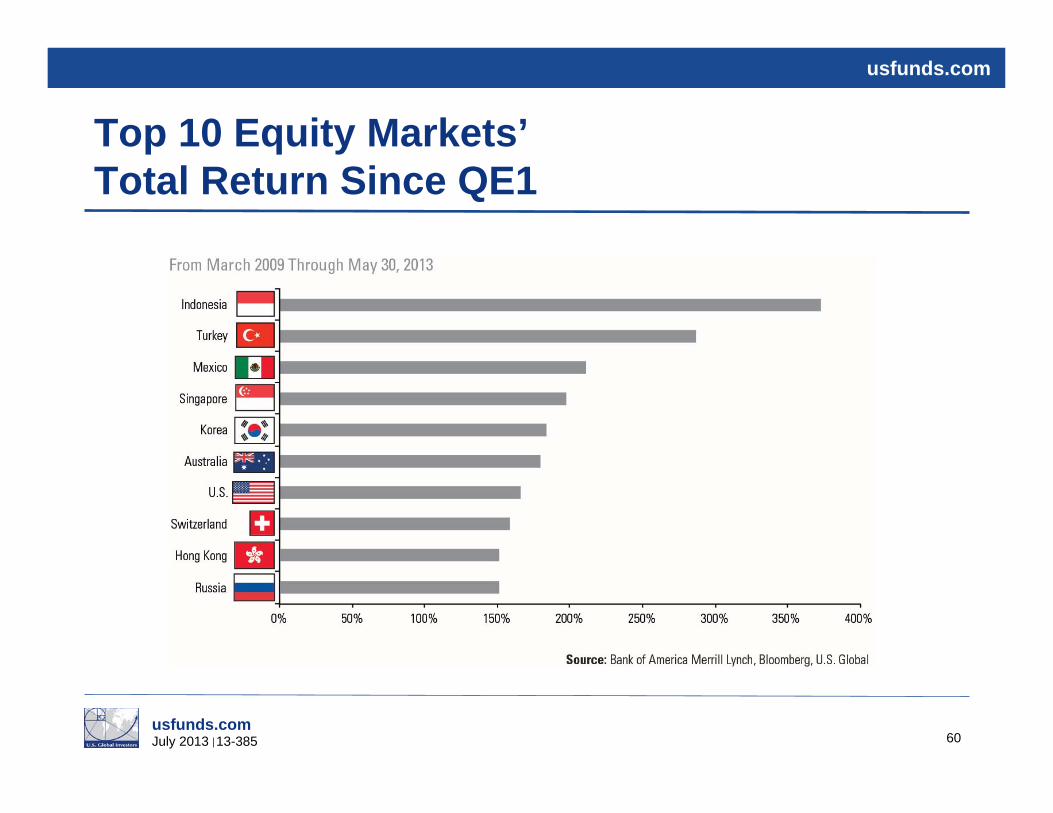
Top 10 Equity Markets’ Total Return Since QE1
60

usfunds.com July 2013 13-385
usfunds.com
Follow the Emerging Markets Money
61
usfunds.com July 2013 13-385
usfunds.com
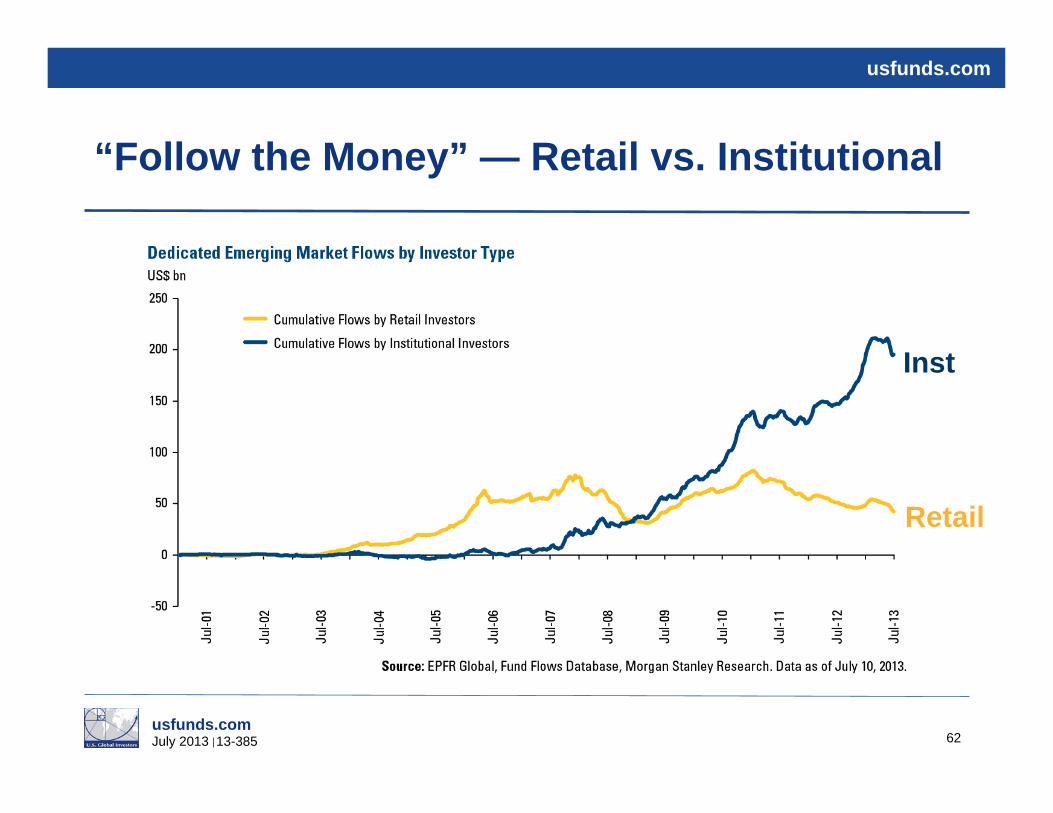
“Follow the Money” — Retail vs. Institutional
62
Retail
Inst

usfunds.com July 2013 13-385
usfunds.com
“Follow the Money” — Passive vs. Active
63
ETFs

usfunds.com July 2013 13-385
usfunds.com
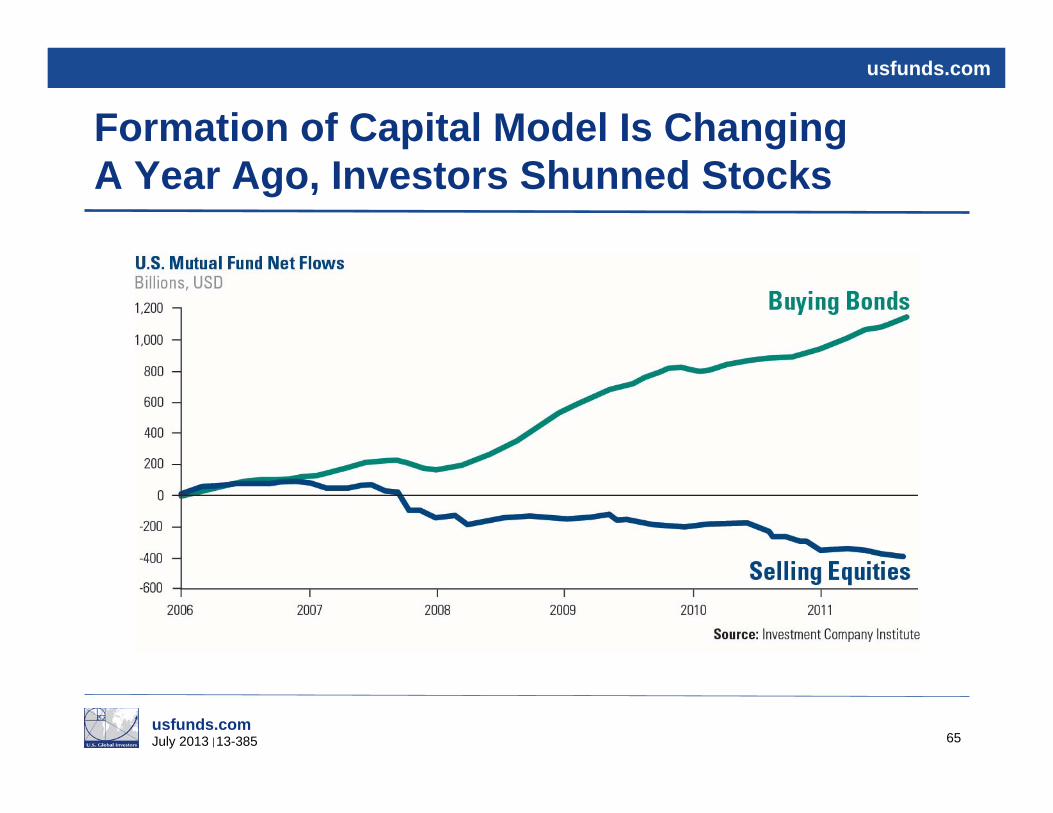
Formation of Capital Model Is Changing Fund Flows and Growth in Assets 2008-2012
64
Source: Investment Company Institute
usfunds.com July 2013 13-385
usfunds.com
Formation of Capital Model Is Changing A Year Ago, Investors Shunned Stocks
65
usfunds.com July 2013 13-385
usfunds.com
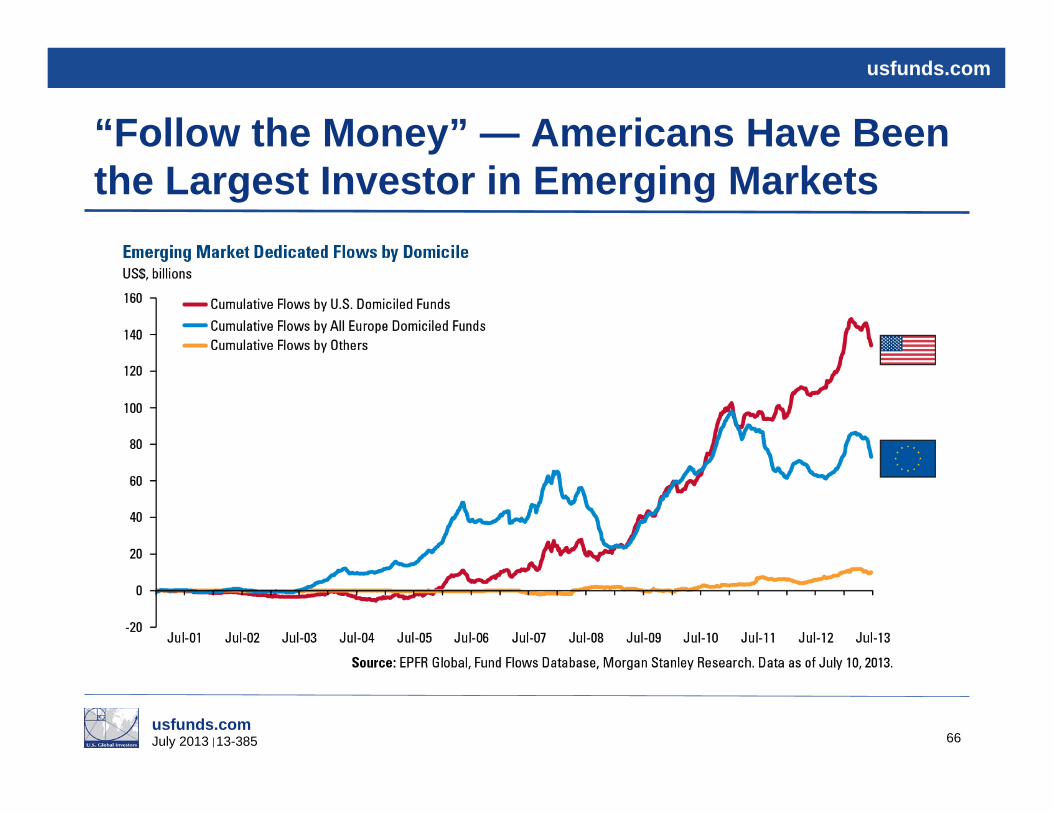
“Follow the Money” — Americans Have Been the Largest Investor in Emerging Markets
66

usfunds.com July 2013 13-385
usfunds.com
“Follow the Money” — China and Brazil Have Received the Bulk of Funds
67

usfunds.com July 2013 13-385
usfunds.com
Reasons for Active Management — Annual Rotation in Leadership
68
Past performance does not guarantee future results.

usfunds.com July 2013 13-385
usfunds.com
Global Resources Fund (PSPFX)
69
Average Dividend Yield of the Dividend-Paying Stocks and Bonds in the Fund as of 6/30/2013 Global Resources Fund 3.18%

usfunds.com July 2013 13-385
usfunds.com
Emerging Europe Fund (EUROX)
70
Average Dividend Yield of the Dividend-Paying Stocks and Bonds in the Fund as of 6/30/2013 Emerging Europe Fund 4.95%

usfunds.com July 2013 13-385
usfunds.com
Gold and Precious Metals Fund (USERX)
71
Average Dividend Yield of the Dividend-Paying Stocks and Bonds in the Fund as of 6/30/2013 Gold and Precious Metals Fund 4.01%

usfunds.com July 2013 13-385
usfunds.com
Global Emerging Market Fund (GEMFX)
72
Average Dividend Yield of the Dividend-Paying Stocks and Bonds in the Fund as of 6/30/2013 Global Emerging Markets Fund 6.08%

usfunds.com July 2013 13-385
usfunds.com
China Region Fund (USCOX)
73
Average Dividend Yield of the Dividend-Paying Stocks and Bonds in the Fund as of 6/30/2013 China Region Fund 2.15%

usfunds.com July 2013 13-385
usfunds.com
74
Come Visit Us at
Facebook: www.facebook.com/usfunds Linkedin: www.linkedin.com/company/u.s.-global-investors
Twitter: www.twitter.com/usfunds
Frank Talk: www.usfunds.com/franktalk
Investor Alert: www.usfunds.com/alert

usfunds.com July 2013 13-385
usfunds.com
Fund Performance
75

usfunds.com July 2013 13-385
usfunds.com
Disclosures
Please consider carefully a fund’s investment objectives, risks, charges and expenses. For this and other important information, obtain a fund prospectus by visiting www.usfunds.com or by calling 1-800-US-FUNDS (1-800-873-8637). Read it carefully before investing. Distributed by U.S. Global Brokerage, Inc. Foreign and emerging market investing involves special risks such as currency fluctuation and less public disclosure, as well as economic and political risk. By investing in a specific geographic region, a regional fund’s returns and share price may be more volatile than those of a less concentrated portfolio. Gold, precious metals, and precious minerals funds may be susceptible to adverse economic, political or regulatory developments due to concentrating in a single theme. The prices of gold, precious metals, and precious minerals are subject to substantial price fluctuations over short periods of time and may be affected by unpredicted international monetary and political policies. We suggest investing no more than 5% to 10% of your portfolio in these sectors. The Emerging Europe Fund invests more than 25% of its investments in companies principally engaged in the oil & gas or banking industries. The risk of concentrating investments in this group of industries will make the fund more susceptible to risk in these industries than funds which do not concentrate their investments in an industry and may make the fund’s performance more volatile. Because the Global Resources Fund concentrates its investments in a specific industry, the fund may be subject to greater risks and fluctuations than a portfolio representing a broader range of industries. Tax-exempt income is federal income tax free. A portion of this income may be subject to state and local income taxes, and if applicable, may subject certain investors to the Alternative Minimum Tax as well. Each tax free fund may invest up to 20% of its assets in securities that pay taxable interest. Income or fund distributions attributable to capital gains are usually subject to both state and federal income taxes. Bond funds are subject to interest-rate risk; their value declines as interest rates rise. The tax free funds may be exposed to risks related to a concentration of investments in a particular state or geographic area. These investments present risks resulting from changes in economic conditions of the region or issuer.
76

usfunds.com July 2013 13-385
usfunds.com
Disclosures
Morningstar Ratings are based on risk-adjusted return. The Morningstar Rating for a fund is derived from a weighted-average of the performance figures associated with its three-, five- and ten-year (if applicable) Morningstar Rating metrics. Past performance does not guarantee future results. For each fund with at least a three-year history, Morningstar calculates a Morningstar Rating™ based on a Morningstar Risk-Adjusted Return measure that accounts for variation in a fund’s monthly performance (including the effects of sales charges, loads, and redemption fees), placing more emphasis on downward variations and rewarding consistent performance. The top 10% of funds in each category receive 5 stars, the next 22.5% receive 4 stars, the next 35% receive 3 stars, the next 22.5% receive 2 stars and the bottom 10% receive 1 star. (Each share class is counted as a fraction of one fund within this scale and rated separately, which may cause slight variations in the distribution percentages.) The Lipper ratings are subject to change every month and are based on an equal-weighted average of percentile ranks for the Preservation and Tax Efficiency over three-, five-, and ten-year periods (if applicable). The highest 20% of funds in each peer group are named Lipper Leader or a score of 5, the next 20% receive a score of 4, the middle 20% are scored 3, the next 20% are scored 2, and the lowest 20% are scored 1. Near-Term Tax Free Fund, in Lipper’s Short-Intermediate Municipal Debt classification, received the following ratings for the 3-, 5-, and 10-year periods, respectively: Preservation: 5 (4530 funds), 5 (3928 funds) and 5 (2731 funds). Tax Efficiency: 5 (42 funds), 5 (34 funds) and 5 (26 funds). The Global Emerging Markets Fund, in Lipper’s Emerging Markets classification, received the following ratings for the 3- and 5-year periods, respectively. Tax Efficiency: 5 (355 funds) and 5 (259 funds). Lipper ratings are not intended to predict future results, and Lipper does not guarantee the accuracy of this information. More information is available at www.lipperweb.com. Lipper Leader Copyright 2013, Reuters, All Rights Reserved. The Bangkok SET Index is a capitalization-weighted index of all the stocks traded on the Stock Exchange of Thailand. The S&P 500 Stock Index is a widely recognized capitalization-weighted index of 500 common stock prices in U.S. companies. The Reuters/Jefferies CRB Index is an unweighted geometric average of commodity price levels relative to the base year average price. The Purchasing Manager’s Index is an indicator of the economic health of the manufacturing sector. The PMI index is based on five major indicators: new orders, inventory levels, production, supplier deliveries and the employment environment. The Istanbul Stock Exchange National 100 Index (XU100) is a capitalization-weighted index composed of National Market companies except investment trusts. The MSCI Emerging Markets Index is a free float-adjusted market capitalization index that is designed to measure equity market performance in the global emerging markets.
77

usfunds.com July 2013 13-385
usfunds.com
Disclosures
M1 Money Supply includes funds that are readily accessible for spending. M2 Money Supply is a broad measure of money supply that includes M1 in addition to all time-related deposits, savings deposits, and non-institutional money-market funds. M3 money supply is the broadest monetary aggregate, including physical currency, demand accounts, savings and money market accounts, certificates of deposit, deposits of eurodollars and repurchase agreements. Standard deviation is a measure of the dispersion of a set of data from its mean. The more spread apart the data, the higher the deviation. Standard deviation is also known as historical volatility. Holdings in the U.S. Global Investors Funds mentioned as a percentage of net assets as of 6/30/2013: General Electric 0.00%; McDonalds 0.00%; Starbucks (All American Equity Fund 2.49%)
78