emerging market bonds—beyond the headlines - vanguard · emerging market bonds— beyond the...
TRANSCRIPT
Connect with Vanguard > vanguard.com
Executive summary. In an environment characterized by low yields and muted return expectations from traditional fixed income investments, investors are turning to emerging market bonds. As the economic fundamentals of emerging countries improve, the credit quality of their debt has risen, as has investor confidence. The result has been attractive historical returns, declining spreads to U.S. Treasury bonds, and an expanding role in the global market portfolio. For investors, the historical record shows that adding emerging market bonds to a diversified portfolio would have improved total return. However, the trade-off has been greater volatility and increased sensitivity to global macro events. A key question, therefore, is whether the benefits of investing in emerging market bonds are adequate compensation for the risks involved.
Vanguard research May 2013
Emerging market bonds—Beyond the headlines
Authors
Christopher B. Philips, CFA
Joanne Yoon
Michael A. DiJoseph, CFA
Ravi G. Tolani
Scott J. Donaldson, CFA, CFP®
Todd Schlanger
2
1 Emerging market bonds are geographically located in the following general regions: Latin America, Eastern Europe, Africa, Russia, the Middle East, and Asia ex Japan.
2 The term hard currency refers to currency of a highly developed country that is widely accepted around the world as payment for goods and services.3 Brady bonds were named after U.S. Treasury Secretary Nicholas Brady, who, in an effort to promote a debt-reduction plan for the United States, introduced
Brady bonds in 1989, allowing banks to exchange debt of emerging or developing countries for tradable bonds.
This paper investigates the rationale for investing in emerging market bonds and the potential risks and challenges that should be considered. We focus primarily on sovereign debt, including, where possible, analyses of both hard-currency-denominated and local-currency-denominated debt. We show that higher risks have come with higher returns, a relationship we expect will continue. Ultimately, investors interested in adding emerging market bonds to their portfolios should be aware of the multifaceted risks and challenges that serve as compensation for the expected yield spread versus U.S. Treasuries.
Debt issued by emerging market governments, government agencies, and corporations can be broadly classified as emerging market bonds.1 Notably, a given issue may be denominated in a country’s home currency (identified hereafter as local currency emerging market bonds) or in a hard currency2 such as the U.S. dollar, the euro, or pound sterling. As we discuss later, there are benefits and risks to both the issuer and the investor in each type of denomination.
Emerging market countries first issued sovereign debt in hard currencies to attract investors in the early 1990s, with U.S. “Brady bonds”3 at the forefront. At that time, the economic and political instability of many countries, combined with fledgling local bond markets, made foreign investors unwilling to purchase bonds directly from the issuing countries in their local currency. Of course, issuing in U.S.
dollars was not a panacea, as the crises of the 1990s in Latin America, Asia, and Russia proved. For example, in the early 1990s, Mexico (along with other developing countries) was able to obtain financing in the international markets, building up a sizable debt load denominated in foreign currencies. For various reasons, much of it was left unhedged, creating the possibility for a mismatch between the countries’ liabilities and assets. Eventually, concerns about the banking system derailed the government’s support for the peso. After the peso was allowed to float, it depreciated sharply, further undermining the banking system and harming investor confidence.
Today, with stronger economies leading to improved credit ratings, liquid global investment markets, and investors expressing renewed confidence in emerging market debt, more governments are issuing debt in their own currencies (see Figure 1).
Notes on risk: All investing is subject to risk, including possible loss of principal. Stocks of companies based in emerging markets are subject to national and regional political and economic risks and to the risk of currency fluctuations. These risks are especially high in emerging markets. Bond funds are subject to interest rate risk, which is the chance bond prices overall will decline because of rising interest rates, and credit risk, which is the chance a bond issuer will fail to pay interest and principal in a timely manner or that negative perceptions of the issuer’s ability to make such payments will cause the price of that bond to decline. In a diversified portfolio, gains from some investments may help offset losses from others. However, diversification does not ensure a profit or protect against a loss in a declining market.
4 For additional information, see Burger, Warnock, and Warnock (2012) and World Bank and IFC (2012).
3
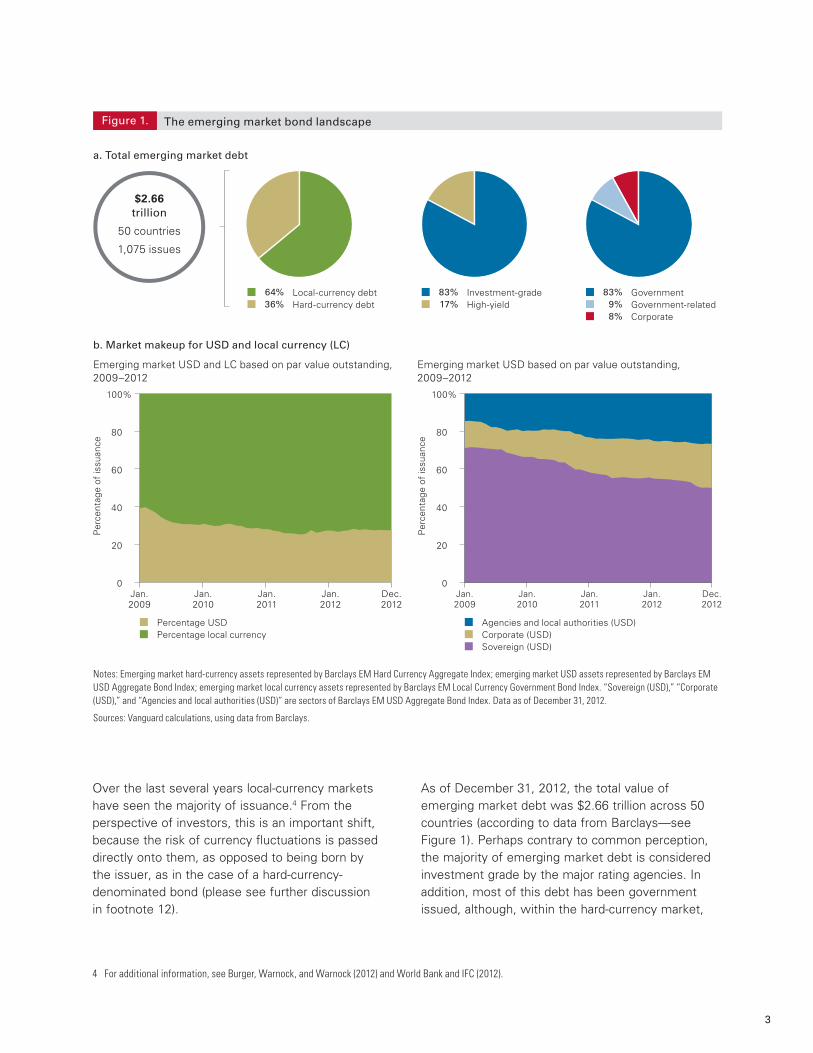
Over the last several years local-currency markets have seen the majority of issuance.4 From the perspective of investors, this is an important shift, because the risk of currency fluctuations is passed directly onto them, as opposed to being born by the issuer, as in the case of a hard-currency-denominated bond (please see further discussion in footnote 12).
As of December 31, 2012, the total value of emerging market debt was $2.66 trillion across 50 countries (according to data from Barclays—see Figure 1). Perhaps contrary to common perception, the majority of emerging market debt is considered investment grade by the major rating agencies. In addition, most of this debt has been government issued, although, within the hard-currency market,
Percentage USDPercentage local currency
Figure 1.
64% Local-currency debt36% Hard-currency debt
83% Investment-grade17% High-yield
83% Government9% Government-related8% Corporate
a. Total emerging market debt
Emerging market USD and LC based on par value outstanding,2009–2012
Emerging market USD based on par value outstanding, 2009–2012
b. Market makeup for USD and local currency (LC)
The emerging market bond landscape
Per
cent
age
of is
suan
ce
Per
cent
age
of is
suan
ce
$2.66trillion
50 countries
1,075 issues
0
20
40
60
80
100%
Notes: Emerging market hard-currency assets represented by Barclays EM Hard Currency Aggregate Index; emerging market USD assets represented by Barclays EM USD Aggregate Bond Index; emerging market local currency assets represented by Barclays EM Local Currency Government Bond Index. “Sovereign (USD),” “Corporate (USD),” and “Agencies and local authorities (USD)” are sectors of Barclays EM USD Aggregate Bond Index. Data as of December 31, 2012.
Sources: Vanguard calculations, using data from Barclays.
Jan.2009
Jan.2010
Jan.2011
Jan.2012
Dec.2012
0
20
40
60
80
100%
Jan.2009
Jan.2010
Jan.2011
Jan.2012
Dec.2012
Agencies and local authorities (USD)Corporate (USD)Sovereign (USD)
4
the proportion of corporate issues increased from approximately 14% of the market in January 2009 to 23% as of December 2012. Within the local-currency market, all of the issuers remain sovereign. For more information on the country exposures of emerging market bond indexes versus U.S. aggregate and global aggregate bond indexes, please see Appendix Figure A-1, on page 15.
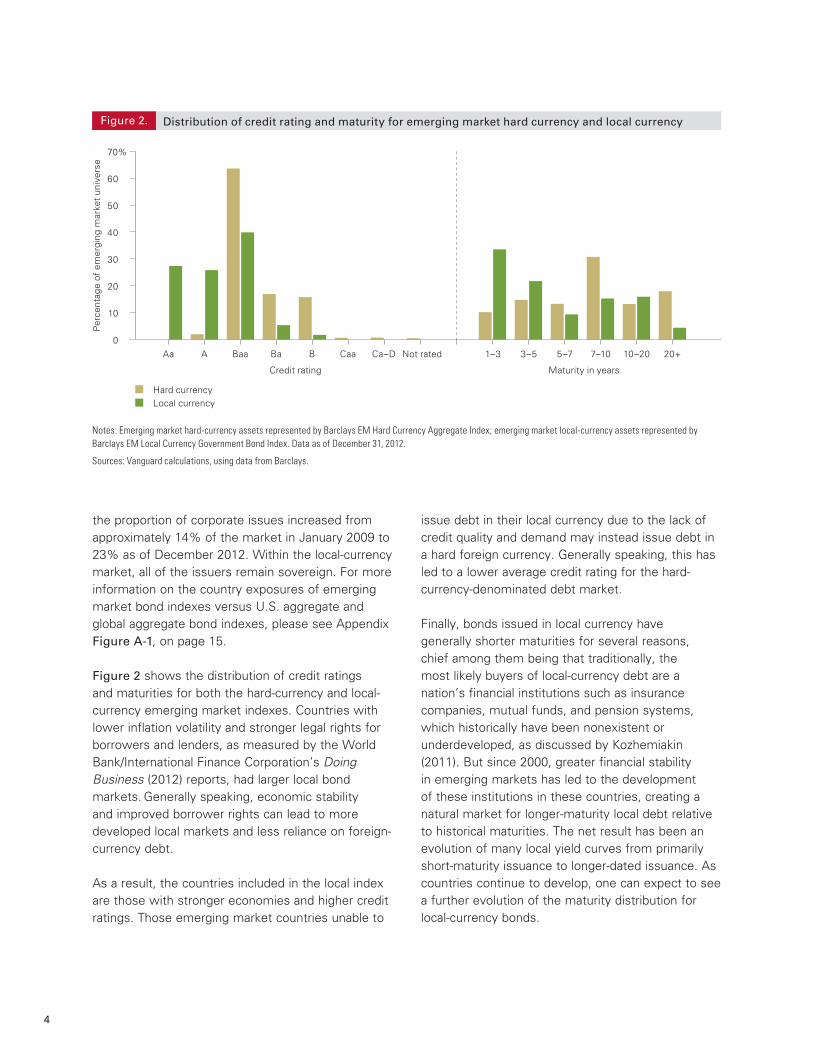
Figure 2 shows the distribution of credit ratings and maturities for both the hard-currency and local-currency emerging market indexes. Countries with lower inflation volatility and stronger legal rights for borrowers and lenders, as measured by the World Bank/International Finance Corporation’s Doing Business (2012) reports, had larger local bond markets. Generally speaking, economic stability and improved borrower rights can lead to more developed local markets and less reliance on foreign- currency debt.
As a result, the countries included in the local index are those with stronger economies and higher credit ratings. Those emerging market countries unable to
issue debt in their local currency due to the lack of credit quality and demand may instead issue debt in a hard foreign currency. Generally speaking, this has led to a lower average credit rating for the hard-currency-denominated debt market.
Finally, bonds issued in local currency have generally shorter maturities for several reasons, chief among them being that traditionally, the most likely buyers of local-currency debt are a nation’s financial institutions such as insurance companies, mutual funds, and pension systems, which historically have been nonexistent or underdeveloped, as discussed by Kozhemiakin (2011). But since 2000, greater financial stability in emerging markets has led to the development of these institutions in these countries, creating a natural market for longer-maturity local debt relative to historical maturities. The net result has been an evolution of many local yield curves from primarily short-maturity issuance to longer-dated issuance. As countries continue to develop, one can expect to see a further evolution of the maturity distribution for local-currency bonds.
Figure 2. Distribution of credit rating and maturity for emerging market hard currency and local currency
Per
cent
age
of e
mer
ging
mar
ket
univ
erse
Aa A Baa Ba B Caa Ca–D Not rated 1–3 3–5 5–7 7–10 10–20 20+
Credit rating Maturity in years
0
10
20
30
40
50
60
70%
Hard currencyLocal currency
Notes: Emerging market hard-currency assets represented by Barclays EM Hard Currency Aggregate Index; emerging market local-currency assets represented by Barclays EM Local Currency Government Bond Index. Data as of December 31, 2012.
Sources: Vanguard calculations, using data from Barclays.
5
Factors driving investor interest
Interest in emerging market bonds has continued to grow in the last few years. According to Morningstar, mutual funds and exchange-traded funds (ETFs) focused on emerging market debt took in $27.6 billion in 2012 and $63.9 billion cumulatively since the start of 2008. Only mutual funds and ETFs focused on corporate bonds (including high-yield bonds) and global bonds generated more investor interest than emerging market debt. We believe three factors have been the primary drivers of this influx of cash flow:
1. Higher yields relative to the traditional fixed income universe.
2. Strong relative fundamentals.
3. Attractive risk-and-return attributes.
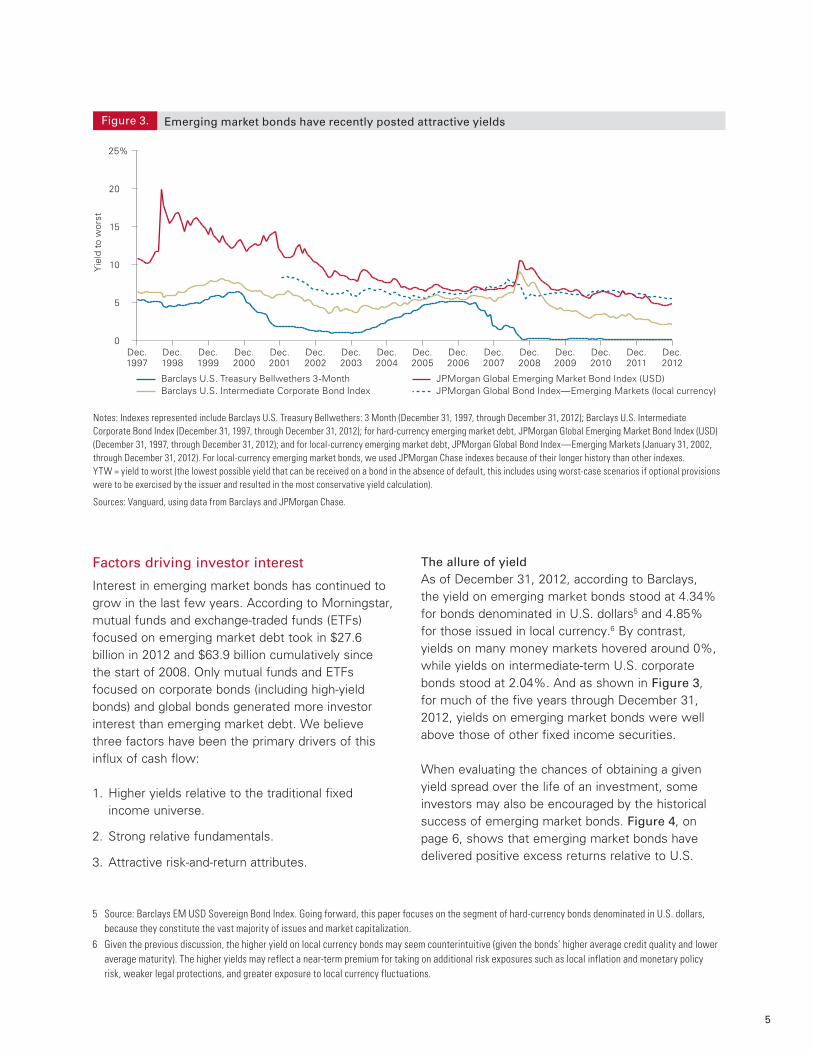
The allure of yieldAs of December 31, 2012, according to Barclays, the yield on emerging market bonds stood at 4.34% for bonds denominated in U.S. dollars5 and 4.85% for those issued in local currency.6 By contrast, yields on many money markets hovered around 0%, while yields on intermediate-term U.S. corporate bonds stood at 2.04%. And as shown in Figure 3, for much of the five years through December 31, 2012, yields on emerging market bonds were well above those of other fixed income securities.
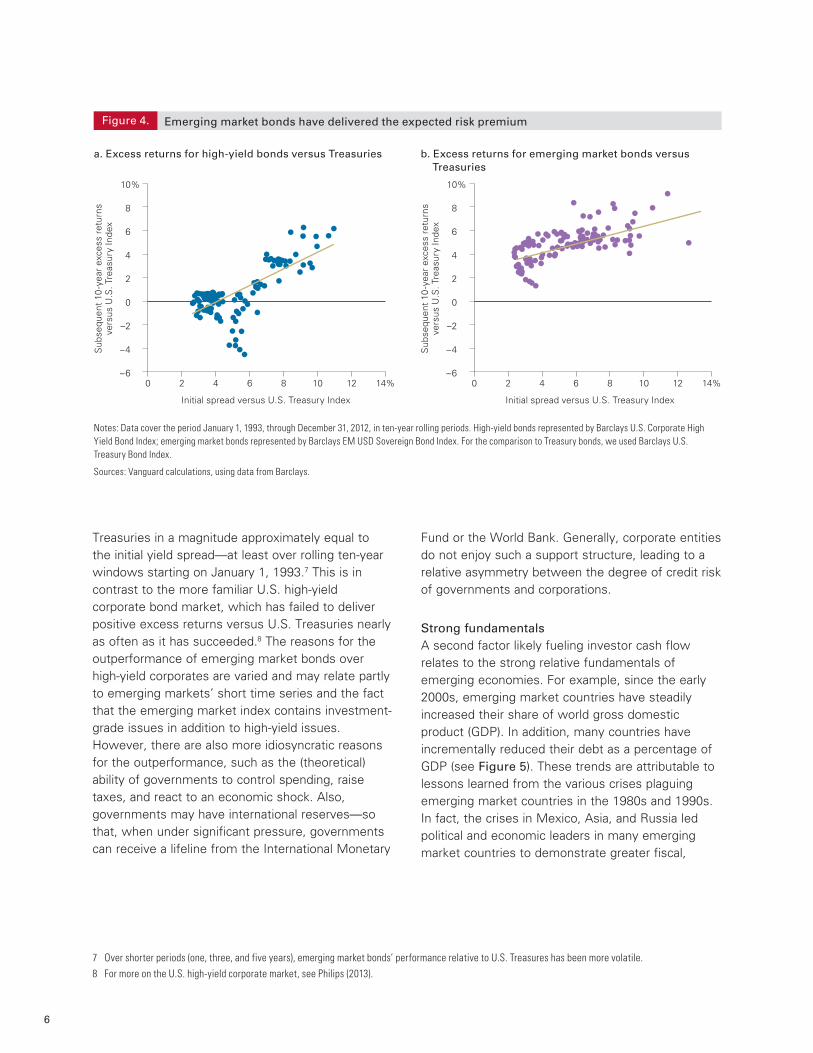
When evaluating the chances of obtaining a given yield spread over the life of an investment, some investors may also be encouraged by the historical success of emerging market bonds. Figure 4, on page 6, shows that emerging market bonds have delivered positive excess returns relative to U.S.
5 Source: Barclays EM USD Sovereign Bond Index. Going forward, this paper focuses on the segment of hard-currency bonds denominated in U.S. dollars, because they constitute the vast majority of issues and market capitalization.
6 Given the previous discussion, the higher yield on local currency bonds may seem counterintuitive (given the bonds’ higher average credit quality and lower average maturity). The higher yields may reflect a near-term premium for taking on additional risk exposures such as local inflation and monetary policy risk, weaker legal protections, and greater exposure to local currency fluctuations.
Figure 3.
Barclays U.S. Treasury Bellwethers 3-MonthBarclays U.S. Intermediate Corporate Bond Index
JPMorgan Global Emerging Market Bond Index (USD)JPMorgan Global Bond Index—Emerging Markets (local currency)
Emerging market bonds have recently posted attractive yields
Yie
ld t
o w
orst
25%
0
5
10
15
20
Notes: Indexes represented include Barclays U.S. Treasury Bellwethers: 3 Month (December 31, 1997, through December 31, 2012); Barclays U.S. Intermediate Corporate Bond Index (December 31, 1997, through December 31, 2012); for hard-currency emerging market debt, JPMorgan Global Emerging Market Bond Index (USD) (December 31, 1997, through December 31, 2012); and for local-currency emerging market debt, JPMorgan Global Bond Index—Emerging Markets (January 31, 2002, through December 31, 2012). For local-currency emerging market bonds, we used JPMorgan Chase indexes because of their longer history than other indexes. YTW = yield to worst (the lowest possible yield that can be received on a bond in the absence of default, this includes using worst-case scenarios if optional provisions were to be exercised by the issuer and resulted in the most conservative yield calculation).
Sources: Vanguard, using data from Barclays and JPMorgan Chase.
Dec.1997
Dec.1998
Dec.1999
Dec.2000
Dec.2001
Dec.2002
Dec.2003
Dec.2004
Dec.2005
Dec.2006
Dec.2007
Dec.2008
Dec.2009
Dec.2010
Dec.2011
Dec.2012
6
Treasuries in a magnitude approximately equal to the initial yield spread—at least over rolling ten-year windows starting on January 1, 1993.7 This is in contrast to the more familiar U.S. high-yield corporate bond market, which has failed to deliver positive excess returns versus U.S. Treasuries nearly as often as it has succeeded.8 The reasons for the outperformance of emerging market bonds over high-yield corporates are varied and may relate partly to emerging markets’ short time series and the fact that the emerging market index contains investment-grade issues in addition to high-yield issues. However, there are also more idiosyncratic reasons for the outperformance, such as the (theoretical) ability of governments to control spending, raise taxes, and react to an economic shock. Also, governments may have international reserves—so that, when under significant pressure, governments can receive a lifeline from the International Monetary
Fund or the World Bank. Generally, corporate entities do not enjoy such a support structure, leading to a relative asymmetry between the degree of credit risk of governments and corporations.
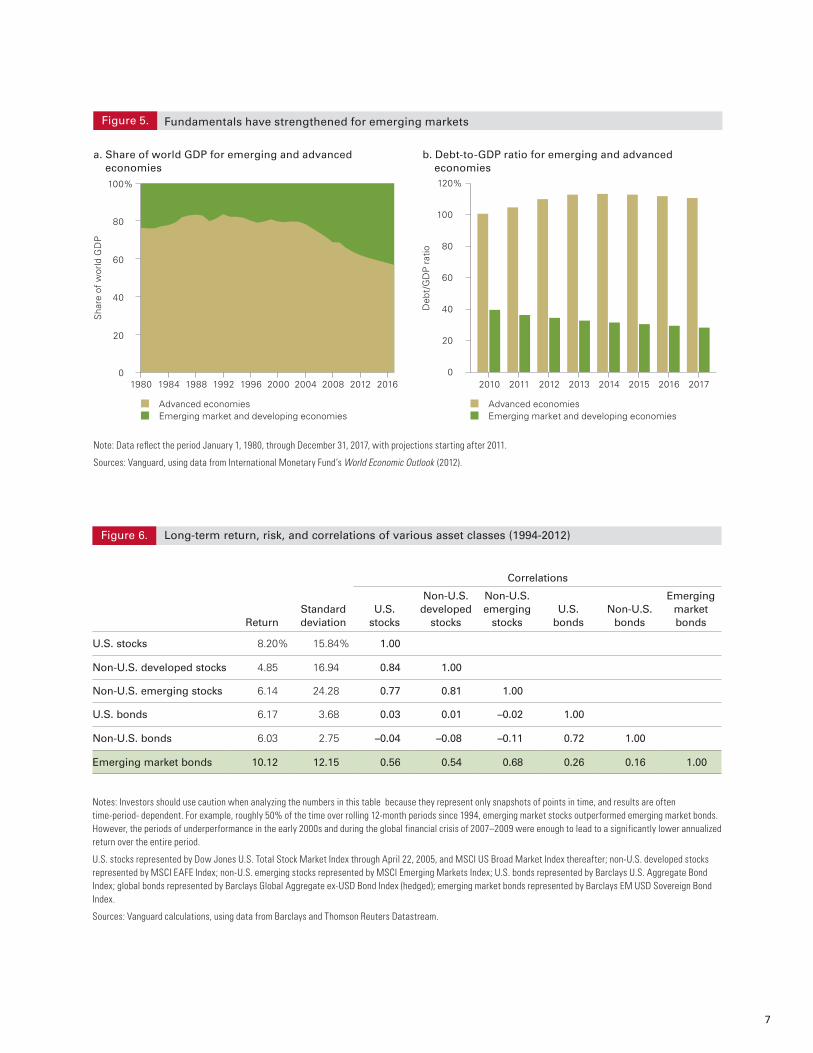
Strong fundamentalsA second factor likely fueling investor cash flow relates to the strong relative fundamentals of emerging economies. For example, since the early 2000s, emerging market countries have steadily increased their share of world gross domestic product (GDP). In addition, many countries have incrementally reduced their debt as a percentage of GDP (see Figure 5). These trends are attributable to lessons learned from the various crises plaguing emerging market countries in the 1980s and 1990s. In fact, the crises in Mexico, Asia, and Russia led political and economic leaders in many emerging market countries to demonstrate greater fiscal,
7 Over shorter periods (one, three, and five years), emerging market bonds’ performance relative to U.S. Treasures has been more volatile.8 For more on the U.S. high-yield corporate market, see Philips (2013).
Figure 4.
a. Excess returns for high-yield bonds versus Treasuries b. Excess returns for emerging market bonds versus Treasuries
Emerging market bonds have delivered the expected risk premium
Sub
sequ
ent
10-y
ear
exce
ss r
etur
nsve
rsus
U.S
. Tre
asur
y In
dex
Sub
sequ
ent
10-y
ear
exce
ss r
etur
nsve
rsus
U.S
. Tre
asur
y In
dex
Initial spread versus U.S. Treasury Index Initial spread versus U.S. Treasury Index
Notes: Data cover the period January 1, 1993, through December 31, 2012, in ten-year rolling periods. High-yield bonds represented by Barclays U.S. Corporate High Yield Bond Index; emerging market bonds represented by Barclays EM USD Sovereign Bond Index. For the comparison to Treasury bonds, we used Barclays U.S. Treasury Bond Index.
Sources: Vanguard calculations, using data from Barclays.
0 2 4 6 8 10 12 14%–6
–4
–2
0
2
4
6
8
10%
0 2 4 6 8 10 12 14%–6
–4
–2
0
2
4
6
8
10%
●●●●
●●●
●●●●●●●●●●
●●●●●●●●●●●●●●●●●●●●●●●●●●●●●●●●●●●●●
●●●● ●●
●●
●●●● ●● ●
●
●
●●
●●●
●
●
●●
●●
●●●●
●
●●●●●
●●
●●
●● ●●●
● ●● ●●●
●●●
●●
●●
●
●
●●●
●●
●●●●
●●●●●●●●●●●●●● ●●●●● ●
●●
●●
●●●●●●●●●●●
●●●●●●●●●●●●●●●●●● ●
●●●●
●● ●●● ●
●
●
●
●●
●●●●
●●●●●●●●●
●●●●●●● ●●●●
● ●●●● ●
●● ●
●●●●●● ●
●
●
●●
●●
●●
●
7
Figure 5.
a. Share of world GDP for emerging and advanced economies
b. Debt-to-GDP ratio for emerging and advanced economies
Fundamentals have strengthened for emerging markets
Note: Data re�ect the period January 1, 1980, through December 31, 2017, with projections starting after 2011.
Sources: Vanguard, using data from International Monetary Fund’s World Economic Outlook (2012).
Sha
re o
f w
orld
GD
P
100%
80
60
40
20
02016 20172010 2011 2012 2013 2014 2015 2016201220082004200019961992198819841980
Deb
t/G
DP
rat
io
0
20
40
60
80
100
120%
Advanced economiesEmerging market and developing economies
Advanced economiesEmerging market and developing economies
Notes: Investors should use caution when analyzing the numbers in this table because they represent only snapshots of points in time, and results are often time-period- dependent. For example, roughly 50% of the time over rolling 12-month periods since 1994, emerging market stocks outperformed emerging market bonds. However, the periods of underperformance in the early 2000s and during the global financial crisis of 2007–2009 were enough to lead to a significantly lower annualized return over the entire period.
U.S. stocks represented by Dow Jones U.S. Total Stock Market Index through April 22, 2005, and MSCI US Broad Market Index thereafter; non-U.S. developed stocks represented by MSCI EAFE Index; non-U.S. emerging stocks represented by MSCI Emerging Markets Index; U.S. bonds represented by Barclays U.S. Aggregate Bond Index; global bonds represented by Barclays Global Aggregate ex-USD Bond Index (hedged); emerging market bonds represented by Barclays EM USD Sovereign Bond Index.
Sources: Vanguard calculations, using data from Barclays and Thomson Reuters Datastream.
Long-term return, risk, and correlations of various asset classes (1994-2012)Figure 6.
Correlations
ReturnStandard deviation
U.S. stocks
Non-U.S. developed
stocks
Non-U.S. emerging
stocksU.S.
bondsNon-U.S.
bonds
Emerging market bonds
U.S. stocks 8.20% 15.84% 1.00
Non-U.S. developed stocks 4.85 16.94 0.84 1.00
Non-U.S. emerging stocks 6.14 24.28 0.77 0.81 1.00
U.S. bonds 6.17 3.68 0.03 0.01 –0.02 1.00
Non-U.S. bonds 6.03 2.75 –0.04 –0.08 –0.11 0.72 1.00
Emerging market bonds 10.12 12.15 0.56 0.54 0.68 0.26 0.16 1.00
8
monetary, and political discipline, contributing to the establishment of foreign reserves and stabilized inflation. Thus, central banks in these countries gained credibility, and many emerging markets experienced robust economic performance and financial market development. This led to rating upgrades, further inflows of capital, and rapidly improving credit markets.
Attractive return characteristicsThe third factor potentially driving investor interest today has been the strong historical performance of emerging market bonds (intimately linked, of course, with the historical yield environment). From 1994 through 2012, emerging market bonds outperformed equities, and with less risk.9 That said, emerging market bonds are still bonds, and when compared to U.S. bonds or global developed markets bonds, they showed significantly greater return volatility during the period just cited—a result of their substantial exposure to credit risk. In addition, emerging market
bonds have had higher correlations with equities than with fixed income, particularly with emerging market equities (see Figure 6, on page 7). As we will show, these characteristics are important when considering the role of emerging market bonds in a portfolio.
Risks and challenges of emerging market bonds
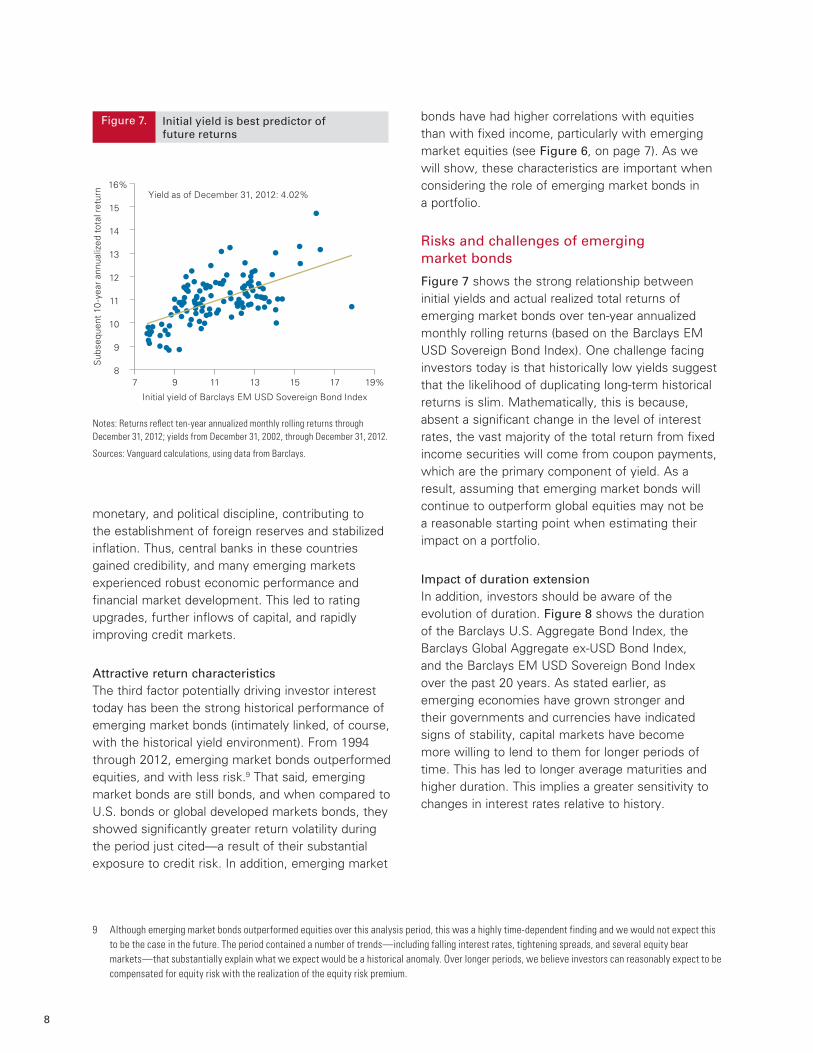
Figure 7 shows the strong relationship between initial yields and actual realized total returns of emerging market bonds over ten-year annualized monthly rolling returns (based on the Barclays EM USD Sovereign Bond Index). One challenge facing investors today is that historically low yields suggest that the likelihood of duplicating long-term historical returns is slim. Mathematically, this is because, absent a significant change in the level of interest rates, the vast majority of the total return from fixed income securities will come from coupon payments, which are the primary component of yield. As a result, assuming that emerging market bonds will continue to outperform global equities may not be a reasonable starting point when estimating their impact on a portfolio.
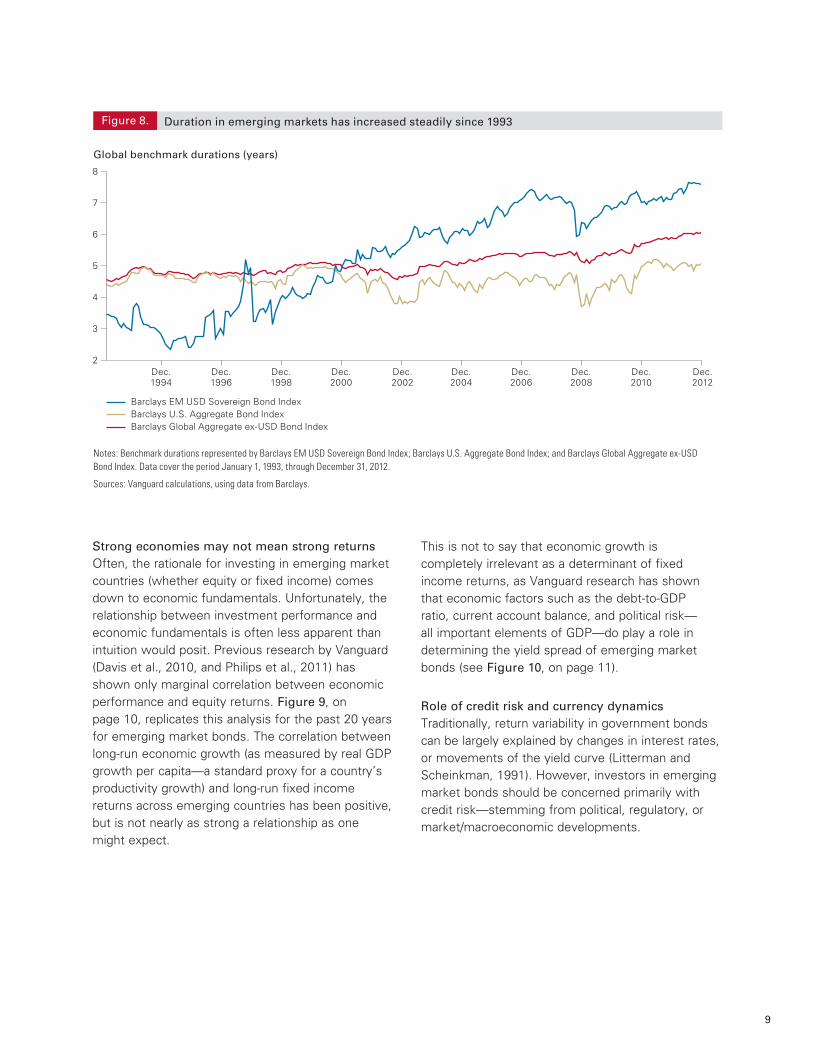
Impact of duration extensionIn addition, investors should be aware of the evolution of duration. Figure 8 shows the duration of the Barclays U.S. Aggregate Bond Index, the Barclays Global Aggregate ex-USD Bond Index, and the Barclays EM USD Sovereign Bond Index over the past 20 years. As stated earlier, as emerging economies have grown stronger and their governments and currencies have indicated signs of stability, capital markets have become more willing to lend to them for longer periods of time. This has led to longer average maturities and higher duration. This implies a greater sensitivity to changes in interest rates relative to history.
9 Although emerging market bonds outperformed equities over this analysis period, this was a highly time-dependent finding and we would not expect this to be the case in the future. The period contained a number of trends—including falling interest rates, tightening spreads, and several equity bear markets—that substantially explain what we expect would be a historical anomaly. Over longer periods, we believe investors can reasonably expect to be compensated for equity risk with the realization of the equity risk premium.
Figure 7.
Yield as of December 31, 2012: 4.02%
Initial yield is best predictor offuture returns
Initial yield of Barclays EM USD Sovereign Bond Index
Sub
sequ
ent
10-y
ear
annu
aliz
ed t
otal
ret
urn
7 9 11 13 15 17 19%8
9
10
11
12
13
14
15
16%
●●●●
●●●
●●●●●● ●
●
●●●●
●●●
● ●
●
●
●●
●●●●●●●●●
●
●
●●●●●●
●● ●●● ●●●
●
●
●● ●
●●●●
●● ●
●●●
●
●
●
●
●●●● ●
●●●
●●●●
●●
● ●●●
●●●
●
●●
●
●●●
●● ●
●
●●
●●●●●● ●●
●
●
●
●
●●
●
Notes: Returns re�ect ten-year annualized monthly rolling returns through December 31, 2012; yields from December 31, 2002, through December 31, 2012.
Sources: Vanguard calculations, using data from Barclays.
9
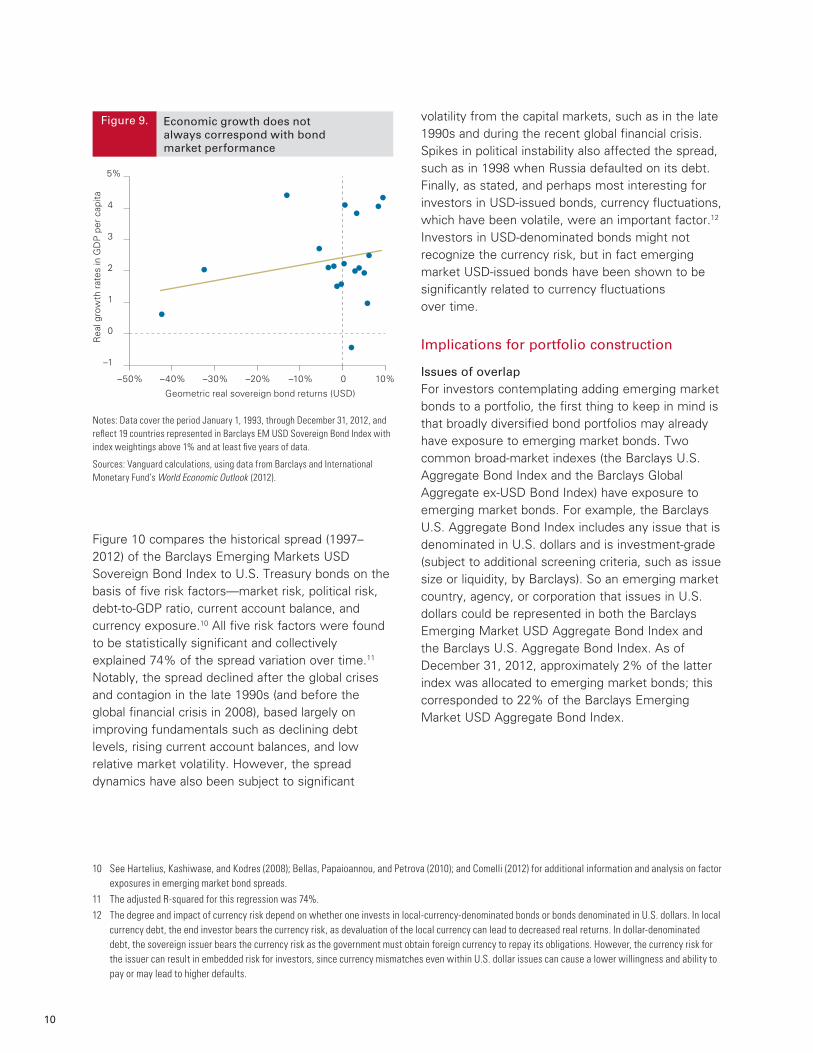
Strong economies may not mean strong returnsOften, the rationale for investing in emerging market countries (whether equity or fixed income) comes down to economic fundamentals. Unfortunately, the relationship between investment performance and economic fundamentals is often less apparent than intuition would posit. Previous research by Vanguard (Davis et al., 2010, and Philips et al., 2011) has shown only marginal correlation between economic performance and equity returns. Figure 9, on page 10, replicates this analysis for the past 20 years for emerging market bonds. The correlation between long-run economic growth (as measured by real GDP growth per capita—a standard proxy for a country’s productivity growth) and long-run fixed income returns across emerging countries has been positive, but is not nearly as strong a relationship as one might expect.
This is not to say that economic growth is completely irrelevant as a determinant of fixed income returns, as Vanguard research has shown that economic factors such as the debt-to-GDP ratio, current account balance, and political risk— all important elements of GDP—do play a role in determining the yield spread of emerging market bonds (see Figure 10, on page 11).
Role of credit risk and currency dynamicsTraditionally, return variability in government bonds can be largely explained by changes in interest rates, or movements of the yield curve (Litterman and Scheinkman, 1991). However, investors in emerging market bonds should be concerned primarily with credit risk—stemming from political, regulatory, or market/macroeconomic developments.
Figure 8.
Global benchmark durations (years)
Duration in emerging markets has increased steadily since 1993
Dec.2012
2
3
4
5
6
7
8
Notes: Benchmark durations represented by Barclays EM USD Sovereign Bond Index; Barclays U.S. Aggregate Bond Index; and Barclays Global Aggregate ex-USD Bond Index. Data cover the period January 1, 1993, through December 31, 2012.
Sources: Vanguard calculations, using data from Barclays.
Barclays EM USD Sovereign Bond IndexBarclays U.S. Aggregate Bond IndexBarclays Global Aggregate ex-USD Bond Index
Dec.2010
Dec.2008
Dec.2006
Dec.2004
Dec.2002
Dec.2000
Dec.1998
Dec.1996
Dec.1994
10
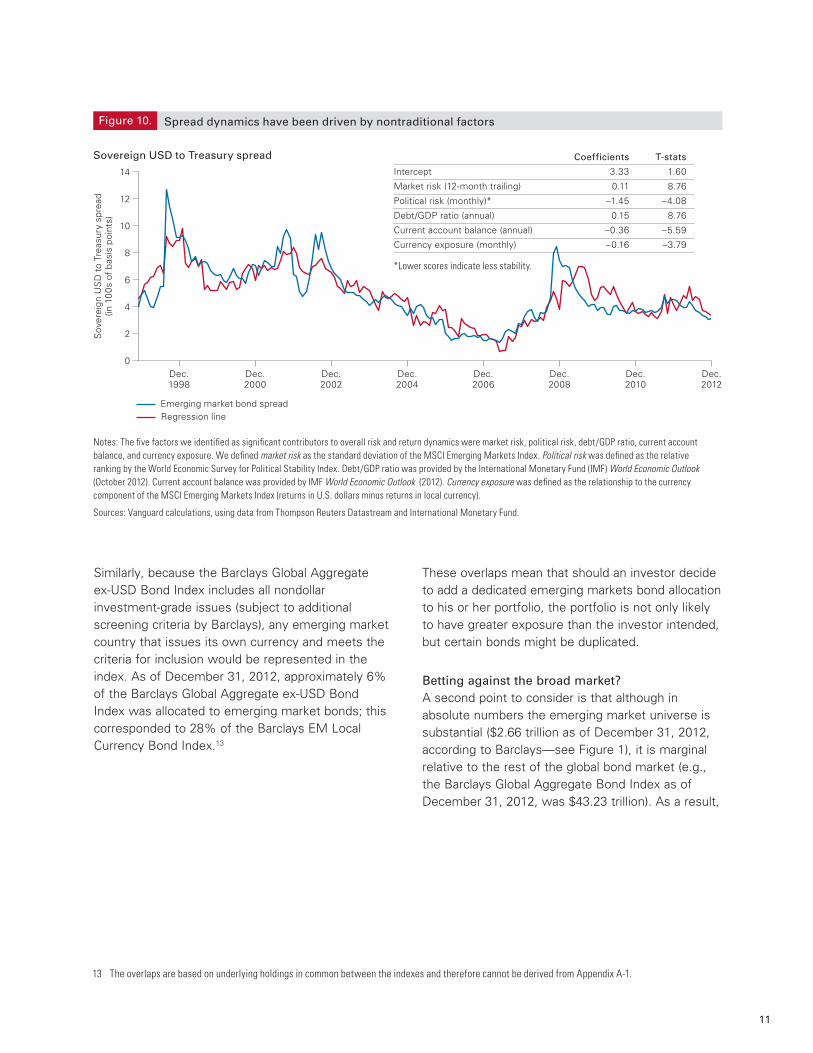
Figure 10 compares the historical spread (1997–2012) of the Barclays Emerging Markets USD Sovereign Bond Index to U.S. Treasury bonds on the basis of five risk factors—market risk, political risk, debt-to-GDP ratio, current account balance, and currency exposure.10 All five risk factors were found to be statistically significant and collectively explained 74% of the spread variation over time.11 Notably, the spread declined after the global crises and contagion in the late 1990s (and before the global financial crisis in 2008), based largely on improving fundamentals such as declining debt levels, rising current account balances, and low relative market volatility. However, the spread dynamics have also been subject to significant
volatility from the capital markets, such as in the late 1990s and during the recent global financial crisis. Spikes in political instability also affected the spread, such as in 1998 when Russia defaulted on its debt. Finally, as stated, and perhaps most interesting for investors in USD-issued bonds, currency fluctuations, which have been volatile, were an important factor.12 Investors in USD-denominated bonds might not recognize the currency risk, but in fact emerging market USD-issued bonds have been shown to be significantly related to currency fluctuations over time.
Implications for portfolio construction
Issues of overlapFor investors contemplating adding emerging market bonds to a portfolio, the first thing to keep in mind is that broadly diversified bond portfolios may already have exposure to emerging market bonds. Two common broad-market indexes (the Barclays U.S. Aggregate Bond Index and the Barclays Global Aggregate ex-USD Bond Index) have exposure to emerging market bonds. For example, the Barclays U.S. Aggregate Bond Index includes any issue that is denominated in U.S. dollars and is investment-grade (subject to additional screening criteria, such as issue size or liquidity, by Barclays). So an emerging market country, agency, or corporation that issues in U.S. dollars could be represented in both the Barclays Emerging Market USD Aggregate Bond Index and the Barclays U.S. Aggregate Bond Index. As of December 31, 2012, approximately 2% of the latter index was allocated to emerging market bonds; this corresponded to 22% of the Barclays Emerging Market USD Aggregate Bond Index.
10 See Hartelius, Kashiwase, and Kodres (2008); Bellas, Papaioannou, and Petrova (2010); and Comelli (2012) for additional information and analysis on factor exposures in emerging market bond spreads.
11 The adjusted R-squared for this regression was 74%.12 The degree and impact of currency risk depend on whether one invests in local-currency-denominated bonds or bonds denominated in U.S. dollars. In local
currency debt, the end investor bears the currency risk, as devaluation of the local currency can lead to decreased real returns. In dollar-denominated debt, the sovereign issuer bears the currency risk as the government must obtain foreign currency to repay its obligations. However, the currency risk for the issuer can result in embedded risk for investors, since currency mismatches even within U.S. dollar issues can cause a lower willingness and ability to pay or may lead to higher defaults.
Figure 9. Economic growth does not always correspond with bond market performance
Geometric real sovereign bond returns (USD)
5%
4
3
2
1
0
–1
–50% –40% –30% –20% –10% 0 10%
Notes: Data cover the period January 1, 1993, through December 31, 2012, and re�ect 19 countries represented in Barclays EM USD Sovereign Bond Index with index weightings above 1% and at least �ve years of data.
Sources: Vanguard calculations, using data from Barclays and International Monetary Fund’s World Economic Outlook (2012).
Rea
l gro
wth
rat
es in
GD
P p
er c
apita
●
●
●
●●
●
●
●
●
●
●●
●
●
●●
●
●
●
11
Similarly, because the Barclays Global Aggregate ex-USD Bond Index includes all nondollar investment-grade issues (subject to additional screening criteria by Barclays), any emerging market country that issues its own currency and meets the criteria for inclusion would be represented in the index. As of December 31, 2012, approximately 6% of the Barclays Global Aggregate ex-USD Bond Index was allocated to emerging market bonds; this corresponded to 28% of the Barclays EM Local Currency Bond Index.13
These overlaps mean that should an investor decide to add a dedicated emerging markets bond allocation to his or her portfolio, the portfolio is not only likely to have greater exposure than the investor intended, but certain bonds might be duplicated.
Betting against the broad market?A second point to consider is that although in absolute numbers the emerging market universe is substantial ($2.66 trillion as of December 31, 2012, according to Barclays—see Figure 1), it is marginal relative to the rest of the global bond market (e.g., the Barclays Global Aggregate Bond Index as of December 31, 2012, was $43.23 trillion). As a result,
13 The overlaps are based on underlying holdings in common between the indexes and therefore cannot be derived from Appendix A-1.
Figure 10.
Sovereign USD to Treasury spread
Spread dynamics have been driven by nontraditional factors
Sov
erei
gn U
SD
to
Trea
sury
spr
ead
(in 1
00s
of
basi
s po
ints
)
12
14
10
8
6
4
2
0Dec.2012
Notes: The �ve factors we identi�ed as signi�cant contributors to overall risk and return dynamics were market risk, political risk, debt/GDP ratio, current account balance, and currency exposure. We de�ned market risk as the standard deviation of the MSCI Emerging Markets Index. Political risk was de�ned as the relative ranking by the World Economic Survey for Political Stability Index. Debt/GDP ratio was provided by the International Monetary Fund (IMF) World Economic Outlook (October 2012). Current account balance was provided by IMF World Economic Outlook (2012). Currency exposure was de�ned as the relationship to the currency component of the MSCI Emerging Markets Index (returns in U.S. dollars minus returns in local currency).
Sources: Vanguard calculations, using data from Thompson Reuters Datastream and International Monetary Fund.
Emerging market bond spreadRegression line
Dec.2010
Dec.2008
Dec.2006
Dec.2004
Dec.2002
Dec.2000
Dec.1998
Coefficients T-stats
Intercept 3.33 1.60
Market risk (12-month trailing) 0.11 8.76
Political risk (monthly)* –1.45 –4.08
Debt/GDP ratio (annual) 0.15 8.76
Current account balance (annual) –0.36 –5.59
Currency exposure (monthly) –0.16 –3.79
*Lower scores indicate less stability.
12
almost any meaningful allocation to emerging market bonds would mean a substantial overweighting relative to global market capitalization. For example, a U.S. investor with an allocation of 60% equity/40% fixed income might have 20% of his or her fixed income exposure (8% of the total portfolio) in foreign bonds. If the investor then moved half of the fixed income exposure into emerging market bonds (4% of the total portfolio), the portfolio would have 33% of its foreign bonds allocated to emerging market bonds, well in excess of market capitalization (ignoring, for simplicity, potential overlap issues). In hindsight, such an overexposure may not be appropriate, but ex ante it does require the investor to assume that the market (that is, all global investors) is mispriced, resulting in an under-representation of emerging market bonds in the global portfolio.
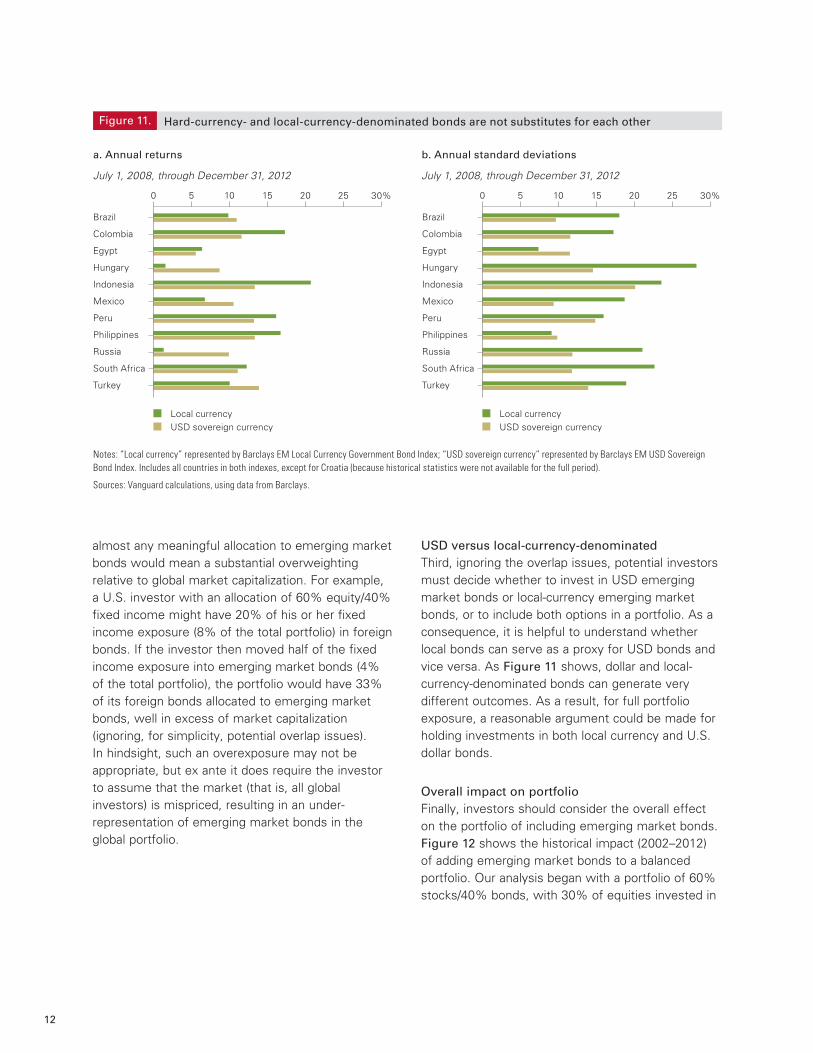
USD versus local-currency-denominatedThird, ignoring the overlap issues, potential investors must decide whether to invest in USD emerging market bonds or local-currency emerging market bonds, or to include both options in a portfolio. As a consequence, it is helpful to understand whether local bonds can serve as a proxy for USD bonds and vice versa. As Figure 11 shows, dollar and local-currency-denominated bonds can generate very different outcomes. As a result, for full portfolio exposure, a reasonable argument could be made for holding investments in both local currency and U.S. dollar bonds.
Overall impact on portfolioFinally, investors should consider the overall effect on the portfolio of including emerging market bonds. Figure 12 shows the historical impact (2002–2012) of adding emerging market bonds to a balanced portfolio. Our analysis began with a portfolio of 60% stocks/40% bonds, with 30% of equities invested in
Local currency
Figure 11.
USD sovereign currency
a. Annual returns
July 1, 2008, through December 31, 2012
b. Annual standard deviations
July 1, 2008, through December 31, 2012
Hard-currency- and local-currency-denominated bonds are not substitutes for each other
Turkey
South Africa
Russia
Philippines
Peru
Mexico
Indonesia
Hungary
Egypt
Colombia
Brazil
30%2520151050
Notes: “Local currency” represented by Barclays EM Local Currency Government Bond Index; “USD sovereign currency” represented by Barclays EM USD Sovereign Bond Index. Includes all countries in both indexes, except for Croatia (because historical statistics were not available for the full period).
Sources: Vanguard calculations, using data from Barclays.
Local currencyUSD sovereign currency
Turkey
South Africa
Russia
Philippines
Peru
Mexico
Indonesia
Hungary
Egypt
Colombia
Brazil
30%2520151050
13
14 Per recommendations in prior Vanguard research (Philips et al., 2012), the nondollar bond index was assumed to have the currency exposure hedged.
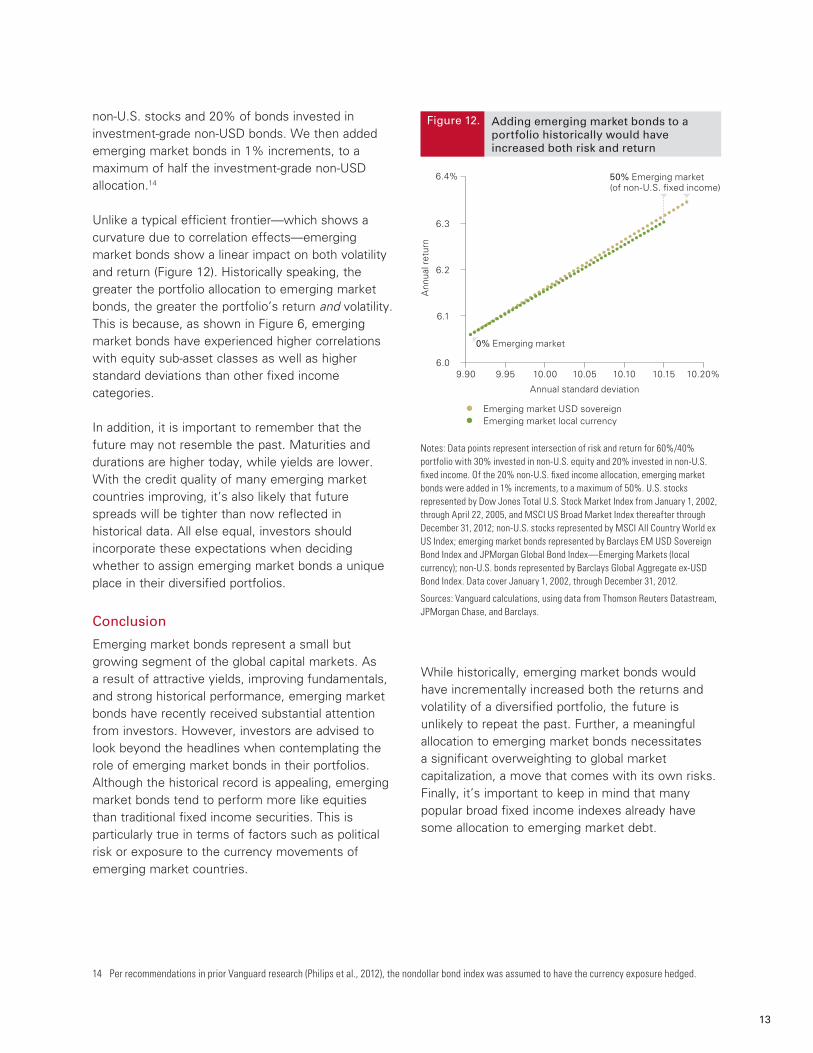
non-U.S. stocks and 20% of bonds invested in investment-grade non-USD bonds. We then added emerging market bonds in 1% increments, to a maximum of half the investment-grade non-USD allocation.14
Unlike a typical efficient frontier—which shows a curvature due to correlation effects—emerging market bonds show a linear impact on both volatility and return (Figure 12). Historically speaking, the greater the portfolio allocation to emerging market bonds, the greater the portfolio’s return and volatility. This is because, as shown in Figure 6, emerging market bonds have experienced higher correlations with equity sub-asset classes as well as higher standard deviations than other fixed income categories.
In addition, it is important to remember that the future may not resemble the past. Maturities and durations are higher today, while yields are lower. With the credit quality of many emerging market countries improving, it’s also likely that future spreads will be tighter than now reflected in historical data. All else equal, investors should incorporate these expectations when deciding whether to assign emerging market bonds a unique place in their diversified portfolios.
Conclusion
Emerging market bonds represent a small but growing segment of the global capital markets. As a result of attractive yields, improving fundamentals, and strong historical performance, emerging market bonds have recently received substantial attention from investors. However, investors are advised to look beyond the headlines when contemplating the role of emerging market bonds in their portfolios. Although the historical record is appealing, emerging market bonds tend to perform more like equities than traditional fixed income securities. This is particularly true in terms of factors such as political risk or exposure to the currency movements of emerging market countries.
While historically, emerging market bonds would have incrementally increased both the returns and volatility of a diversified portfolio, the future is unlikely to repeat the past. Further, a meaningful allocation to emerging market bonds necessitates a significant overweighting to global market capitalization, a move that comes with its own risks. Finally, it’s important to keep in mind that many popular broad fixed income indexes already have some allocation to emerging market debt.
Emerging market USD sovereign
Figure 12.
Emerging market local currency
Adding emerging market bonds to a portfolio historically would have increased both risk and return
Ann
ual r
etur
n
10.20%10.1510.1010.05
Annual standard deviation
10.009.959.90
6.4%
6.3
6.2
6.1
6.0
Notes: Data points represent intersection of risk and return for 60%/40% portfolio with 30% invested in non-U.S. equity and 20% invested in non-U.S. �xed income. Of the 20% non-U.S. �xed income allocation, emerging market bonds were added in 1% increments, to a maximum of 50%. U.S. stocks represented by Dow Jones Total U.S. Stock Market Index from January 1, 2002, through April 22, 2005, and MSCI US Broad Market Index thereafter through December 31, 2012; non-U.S. stocks represented by MSCI All Country World ex US Index; emerging market bonds represented by Barclays EM USD Sovereign Bond Index and JPMorgan Global Bond Index—Emerging Markets (local currency); non-U.S. bonds represented by Barclays Global Aggregate ex-USD Bond Index. Data cover January 1, 2002, through December 31, 2012.
Sources: Vanguard calculations, using data from Thomson Reuters Datastream, JPMorgan Chase, and Barclays.
0% Emerging market
50% Emerging market(of non-U.S. �xed income)
14
References
Bellas, Dimitri, Michael G. Papaioannou, and Iva Petrova, 2010. Determinants of Emerging Market Sovereign Bond Spreads: Fundamental vs. Financial Stress. IMF Working Paper No. WP/10/281. Washington, D.C.: International Monetary Fund.
Burger, John D., Francis E. Warnock, and Veronica Cacdac Warnock, 2012. Emerging Local Currency Bond Markets. Financial Analysts Journal 68(4): 73–93.
Comelli, Fabio, 2012. Emerging Market Sovereign Bond Spreads: Estimation and Back-Testing. IMF Working Paper No. WP/12/212. Washington, D.C.: International Monetary Fund.
Davis, Joseph H., Roger Aliaga-Díaz, C William Cole, and Julieann Shanahan, 2010. Investing in Emerging Markets: Evaluating the Allure of Rapid Economic Growth. Valley Forge, Pa.: The Vanguard Group.
Erb, Claude B., Campbell R. Harvey, and Tadas E. Viskanta, 2000. Understanding Emerging Market Bonds. Emerging Markets Quarterly (Spring): 17 pages.
Hartelius, Kristian, Kenichiro Kashiwase, and Laura E. Kodres, 2008. Emerging Market Spread Compression: Is It Real or Is It Liquidity? IMF Working Paper No. WP/08/10. Washington, D.C.: International Monetary Fund.
International Monetary Fund, 2012. World Economic Outlook: Coping with High Debt and Sluggish Growth, October 2012. Washington, D.C.: International Monetary Fund.
Kozhemiakin, Alexander, 2011. Emerging Markets Local Currency Debt: Capitalizing on Improved Sovereign Fundamentals. New York: BNY Mellon Asset Management.
Litterman, Robert, and José Scheinkman, 1991. Common Factors Affecting Bond Returns. Journal of Fixed Income (June): 54–61.
Philips, Christopher B., Roger Aliaga-Díaz, Joseph H. Davis, and Francis M. Kinniry Jr., 2011. Emerging Markets: Individual Country or Broad-Market Exposure? Valley Forge, Pa.: The Vanguard Group.
Philips, Christopher B., Joseph Davis, Andrew J. Patterson, and Charles J. Thomas, 2012. Global Fixed Income: Considerations for U.S. Investors. Valley Forge, Pa.: The Vanguard Group.
Philips, Christopher B., 2013. Worth the Risk? The Appeal and Challenges of High-Yield Bonds. Valley Forge, Pa.: The Vanguard Group.
The World Bank and International Finance Corporation, 2012. Doing Business 2012: Doing Business in a More Transparent World. Washington, D.C.: World Bank and International Finance Corporation.
15
CountryEM local-currency
governmentEM hard-currency
aggregate EM USD sovereign U.S. aggregateGlobal aggregate
ex USDTotal market value $1,695,715,684 $961,348,069 $445,816,609 $16,972,666,706 $25,321,367,208Emerging market percentage 100% 100% 100% 1.90% 4.88%Yield 4.85% 4.28% 4.02% 1.74% 1.64%Duration (years) 4.88 6.57 7.57 5.06 6.71Angola 0.12 0.25Argentina 2.17 1.41Azerbaijan 0.06Bahrain 0.57 1.06Belarus 0.20 0.43Belize 0.03 0.05Bolivia 0.05 0.11Brazil 13.84 18.57 10.45 0.56 0.06Bulgaria 0.28 0.29 0.01Chile 0.41 0.04 0.03Colombia 3.72 2.74 3.92 0.14Costa Rica 0.16 0.23Croatia 0.26 1.23 1.48 0.02Czech Republic 2.93 0.29Dominican Republic 0.26 0.55Ecuador 0.07 0.15Egypt 1.71 0.28 0.33El Salvador 0.54 1.16Gabon 0.10 0.21Georgia 0.06 0.13Ghana 0.09 0.20Guatemala 0.08 0.17Hungary 2.09 2.66 1.94 0.01Iceland 0.23 0.49India 2.59 0.00Indonesia 4.36 4.62 7.20Israel 3.06 0.08 0.23Ivory Coast 0.22 0.48Jamaica 0.55 0.27Jordan 0.08 0.16Kazakhstan 1.37Latvia 0.31 0.66 0.00Lebanon 1.15 2.49Lithuania 1.33 2.03 0.01Malaysia 5.14 0.35Mexico 7.54 13.29 9.71 0.55 0.60Mongolia 0.22 0.33Morocco 0.38 0.34 0.01Namibia 0.06 0.13Nigeria 0.06 0.14Pakistan 0.12 0.26Panama 1.04 2.24 0.06Peru 0.78 1.59 2.93 0.08Philippines 3.24 3.42 6.45 0.00Poland 6.93 0.10 0.65Romania 1.51 0.63 0.05Russia 5.21 15.67 10.38South Africa 5.62 1.81 2.24 0.08 0.45South Korea 24.00 0.18 1.68Senegal 0.06 0.13Serbia 0.42 0.90Sri Lanka 0.46 0.87Thailand 5.03 0.52 0.43Trinidad 0.07Turkey 4.14 7.30 11.06Ukraine 1.95 3.05Uruguay 0.68 1.48 0.03Venezuela 6.34 7.82Vietnam 0.21 0.45Zambia 0.08 0.17
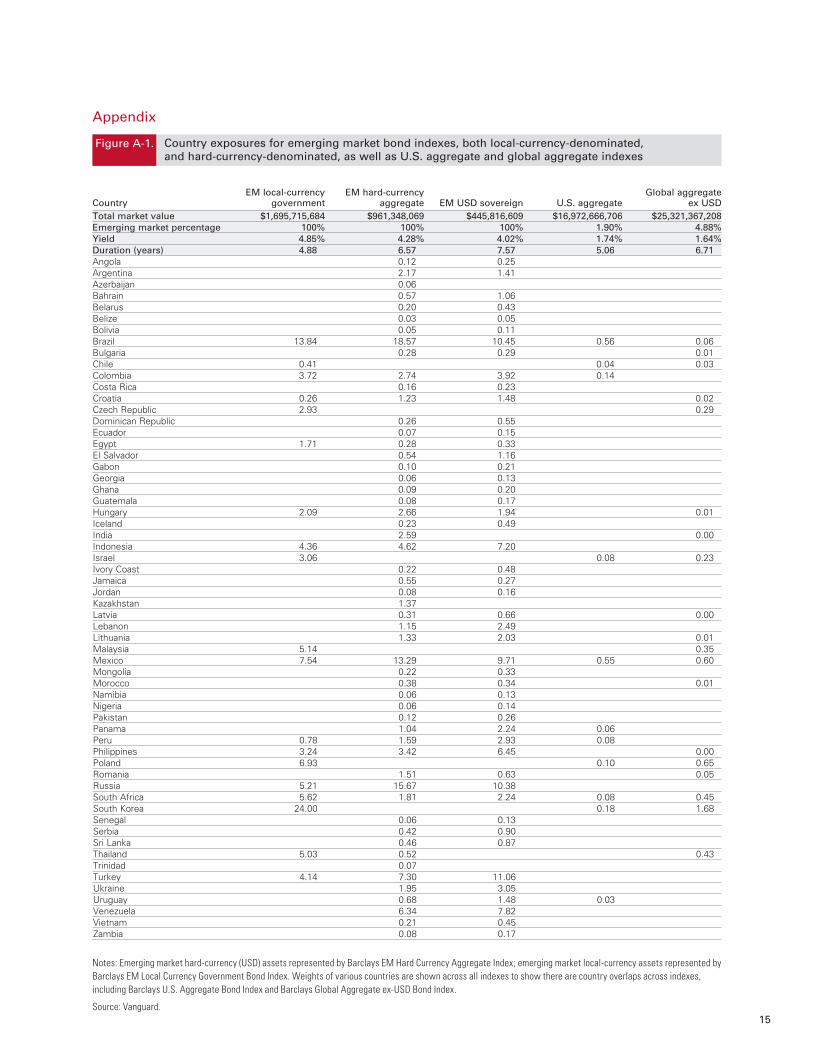
Notes: Emerging market hard-currency (USD) assets represented by Barclays EM Hard Currency Aggregate Index; emerging market local-currency assets represented by Barclays EM Local Currency Government Bond Index. Weights of various countries are shown across all indexes to show there are country overlaps across indexes, including Barclays U.S. Aggregate Bond Index and Barclays Global Aggregate ex-USD Bond Index.
Source: Vanguard.
Country exposures for emerging market bond indexes, both local-currency-denominated, and hard-currency-denominated, as well as U.S. aggregate and global aggregate indexes
Figure A-1.
Appendix
Vanguard research > Vanguard Center for Retirement Research Vanguard Investment Strategy Group
E-mail > [email protected]
For more information about Vanguard funds, visit vanguard.com or call 800-662-2739 to obtain a prospectus. Investment objectives, risks, charges, expenses, and other important information about a fund are contained in the prospectus; read and consider it carefully before investing.
CFA® is a trademark owned by CFA Institute.
P.O. Box 2600 Valley Forge, PA 19482-2600
© 2013 The Vanguard Group, Inc. All rights reserved. Vanguard Marketing Corporation, Distributor.
ICREMB 052013
Connect with Vanguard® > vanguard.com