emerging issues in food waste management persistent
TRANSCRIPT
EMERGING ISSUES IN FOOD WASTE MANAGEMENT
Persistent Chemical Contaminants
August 2021
U.S. Environmental Protection Agency Office of Research and Development
EPA/600/R-21/115

Persistent Chemical Contaminants i
Disclaimer This document has been reviewed in accordance with U.S. Environmental Protection Agency policy and approved for publication. Mention of trade names or commercial products does not constitute endorsement or recommendation for use.
Acknowledgements EPA would like to thank the following stakeholders for their valuable input on the draft report:
Tim Farnan, Minnesota Pollution Control Agency Laurie Gordon, Oregon Department of Environmental Quality Daniel Harper, Indiana Department of Environmental Management Mary Harrington, Washington State Department of Ecology Colleen Hetzel, Minnesota Pollution Control Agency Carla Hopkins, Maine Department of Environmental Protection Erica Kalve, California State Water Resources Control Board Mark King, Maine Compost School Wendy Linck, California State Water Resources Control Board Kevin Masterson, Oregon Department of Environmental Quality Kyle Pogue, CalRecycle Toby Primbs, Oregon Department of Agriculture Brianna St. Pierre, California State Water Resources Control Board
EPA would like to thank the following people for their independent peer review of the report:
Nanthi Bolan, University of New Castle, Australia Linda Lee, Purdue University, United States Frederick Michel, Jr., The Ohio State University, United States
This report was prepared by ICF Incorporated, L.L.C., for the U.S. Environmental Protection Agency, Office of Research and Development, under USEPA Contract No. 68HERC19D0003. The external peer review of the report was coordinated by Eastern Research Group, Inc., under USEPA Contract No. EP-C-17-017.
Cover Photograph courtesy of BioCycle

Persistent Chemical Contaminants ii
Executive Summary Food waste—defined as food that is produced for human consumption but not ultimately consumed by humans—is a major global environmental, social, and economic challenge. Recognizing the critical importance of reducing food loss and waste, in September 2015, the U.S. Environmental Protection Agency (EPA) and U.S. Department of Agriculture announced the U.S. Food Loss and Waste Reduction Goal to halve food loss and waste by 2030. One of EPA’s strategies to help meet this goal is to encourage diversion of food waste from landfills to composting and anaerobic digestion facilities to reduce methane emissions and recover value (e.g., nutrients or energy) from the food. However, stakeholders have expressed concerns about the levels of persistent chemical contaminants in products made from food waste streams, which may include items other than food waste, such as compostable and non-compostable food contact materials. To achieve the environmental benefits of diverting food waste from landfills on a large scale, EPA must better understand the contribution of food waste streams to persistent chemical contamination in compost and digestate, the potential risks to human health and the environment posed by land applying compost and digestate made from food waste, and the most effective strategies to prevent or mitigate the risks and communicate these findings to affected stakeholders.
This issue paper demonstrates that food waste streams are a source of per- and polyfluoroalkyl substances (PFAS) contamination in composts and digestates, with PFAS detected in food waste, food contact materials, and composts produced from food waste. While data on PFAS in food waste is limited, one study reported concentrations of three PFAS in the range of 0.11–1 µg/kg in samples collected from grocery stores, hospitals, schools, restaurants, retirement communicates, and residences. The presence of PFAS in food waste is further supported by multiple studies reporting PFAS in food (i.e., precursor of food waste) from non-contaminated areas, with concentrations generally <10 µg/kg. Seafood, followed by meat, may be important contributors to PFAS in food items, possibly due to bioaccumulation. Compared to PFAS concentrations in food contact materials, which ranged from <1 to 485 µg/kg, the limited data show that food contact materials may contribute more to overall PFAS levels in food waste streams.
Composts made from a variety of mixed feedstocks, such as food waste, green waste (leaves and grass), and manure, showed total PFAS levels ranging from 2.3 to 75 µg/kg. Comparison of composts made with and without food waste showed that food waste compost had higher PFAS levels than green waste compost. Comparing results across three studies, which originated from the same research group, PFAS concentrations in decreasing order were: biosolids-based products (i.e., treated biosolids, composted biosolids) > food waste compost > green waste compost ≈ other organic composts. An additional study on composts in Europe also showed that kitchen waste compost had higher PFAS concentrations than green waste compost. Furthermore, the limited data also showed that PFAS concentrations were higher in composts with compostable food packaging and that compostable food contact materials have higher PFAS concentrations that non-compostable samples. No data on digestates were identified that would enable the determination of whether food waste digestates would have higher, similar, or lower PFAS concentrations compared with digestates produced from other feedstocks.
There are currently no standards for PFAS in composts or digestates; however, guidelines and standards have been recently adopted by some cities and states to prohibit PFAS in food packaging and some manufacturers have begun voluntary phase-out of the PFAS 6:2 FTOH in food contact materials. Compostable food contact materials certified by the Biodegradable Products Institute may no longer contain intentionally added fluorinated chemicals. These guidelines and standards should lead to decreased PFAS levels in food waste streams. In addition, states have begun to implement protective measures regarding PFAS in compost, such as screening composts made from biosolids (Maine) or requiring collection and treatment of contact water from composting sites that accept food waste (Minnesota).
Much remains unknown about the risks to human health and the environment posed by the land application of food waste compost and anaerobic digestate containing PFAS. When present in land-applied biosolids, PFAS have the potential to be taken up by plants and crops and/or leach into groundwater, which can be consumed by

Persistent Chemical Contaminants iii
humans or used for agricultural purposes. Full risk assessments are not available, and the data needed to estimate with confidence the human health and environmental risks are very limited. Research on PFAS fate and transformation during composting and anaerobic digestion is needed. The limited data available show no clear trends when comparing PFAS concentrations in the feedstock with PFAS concentrations in the final product. This is further complicated by the potential presence of precursors in the feedstock.
Regardless of risks to human health and the environment and whether PFAS are actually present at levels of concern in composts and digestates made from food waste, concerns about contamination can, and have, affected the marketability and value of these products. Concern over PFAS contamination can also affect decisions and policies applicable to food waste collection, management, processing, and consequently, the reduction of food waste. Strategies to mitigate risks due to the land application of composts and digestates contaminated with PFAS include upstream solutions, such as phase-outs and bans; feedstock restrictions to avoid processing of waste streams likely to have the highest levels on PFAS; use restrictions for soil amendments (e.g., application as a landfill cover versus on farmland); and concentration limits for soil amendments.
For persistent herbicides, food waste streams are likely not a major source of contamination for the four persistent herbicides of interest—clopyralid, aminopyralid, picloram, and aminocyclopyrachlor. No studies were identified that reported concentrations of these four persistent herbicides in food waste or feedstock mixtures containing food waste; however, clopyralid has been detected in food samples in the United States. The detection of only clopyralid in food samples is consistent with the registered use sites of the four persistent herbicides, where only clopyralid had agricultural settings (e.g., fruits, vegetables, and cereal grains) as a registered use site. No studies were identified that investigated these four persistent herbicides in commercial composts, but documented cases of compost contaminated with clopyralid, aminopyralid, picloram, and/or aminocyclopyrachlor show that the source of contamination is green waste, manure, or hay. Food waste has not been indicated in any documented incident to date. The available data on two additional chemical contaminants—polychlorinated biphenyls (PCBs) and polycyclic aromatic hydrocarbons (PAHs)—in food waste and associated composts and digestates were briefly summarized in this issue paper but were not further discussed due to the lack of recent U.S. compost or digestate data and in the case of PCBs, due to the U.S. ban on PCBs.
PFAS contamination in food waste presents challenges for a broad range of stakeholders, including but not limited to those involved in waste management and recycling facilities, and those who purchase and intend to use compost and digestate as soil amendments. Additional research is needed to inform decisions and policies applicable to food waste collection, management, processing, and consequently, the reduction of food waste. Priority research needs include:
Research to obtain additional field data on PFAS species and concentrations in finished composts and digestates generated from food waste and used as soil amendments in the United States.
Research to obtain additional data on PFAS species and concentrations in food waste streams in the United States.
Research to assess exposure and potential risks to human health and the environment from land application of PFAS-contaminated compost and digestate produced from food waste.
Research to understand the comparative risks of different management options, including further research to determine the fate of PFAS through various wastewater and solids treatment processes.
Additional research needs include (i) development of a multilaboratory-validated analytical method to detect PFAS in solids; (ii) expansion of PFAS analytical methods to identify more compounds; (iii) research on PFAS fate and transformation during composting and anaerobic digestion; (iv) research to support determination of an acceptable PFAS limit for land-applied soil amendments; and (v) research on the long-term impacts and transformation of PFAS after land application of PFAS-contaminated soil amendments.

Persistent Chemical Contaminants iv
Table of Contents 1. INTRODUCTION .............................................................................................................................. 1 1.1. Scope .......................................................................................................................................... 2 1.2. Methods ....................................................................................................................................... 2
2. PER- AND POLYFLUOROALKYL SUBSTANCES............................................................................. 4 2.1. PFAS in Food Waste and Food Items .......................................................................................... 5 2.2. PFAS in Food Contact Materials ................................................................................................ 16 2.3. Comparison of PFAS Levels in Food versus Food Contact Materials ........................................ 19 2.4. PFAS in Compost ...................................................................................................................... 20 2.5. PFAS in Digestate ..................................................................................................................... 29 2.6. Effects of Composting or Anaerobic Digestion on PFAS Concentrations ................................... 29 2.7. Safety Thresholds and Standards for PFAS in Composting and Anaerobic Digestion ................ 31 2.8. Data Gaps for PFAS .................................................................................................................. 33 2.9. Summary of PFAS ..................................................................................................................... 34
3. PESTICIDES ................................................................................................................................... 35 3.1. Pesticides in Food Waste and Food Items ................................................................................. 35 3.2. Pesticides in Food Contact Materials ......................................................................................... 41 3.3. Comparison of Pesticide Levels in Food versus Food Contact Materials ................................... 41 3.4. Pesticides in Compost ............................................................................................................... 41 3.5. Pesticides in Digestate .............................................................................................................. 45 3.6. Effects of Composting or Anaerobic Digestion on Pesticide Concentrations .............................. 46 3.7. Safety Thresholds and Standards for Pesticides in Composting and Anaerobic Digestion ......... 47 3.8. Data Gaps for Pesticides ........................................................................................................... 47 3.9. Summary of Persistent Pesticides ............................................................................................. 48
4. OTHER PERSISTENT CHEMICAL CONTAMINANTS..................................................................... 49 4.1. Polychlorinated Biphenyls .......................................................................................................... 49 4.2. Polycyclic Aromatic Hydrocarbons ............................................................................................. 51
5. IMPLICATIONS OF PFAS ON MARKETABILITY AND USE OF FOOD WASTE COMPOST AND DIGESTATE .................................................................................................................................... 53
6. RISKS TO HUMAN HEALTH AND THE ENVIRONMENT DUE TO LAND APPLICATION OF PFAS-CONTAMINATED COMPOST OR DIGESTATE ............................................................................. 55
6.1. Regulations on Application of Biosolids ..................................................................................... 55 6.2. Risk Studies for Compost or Digestate ...................................................................................... 57 6.3. Comparison of Food Waste Management Options..................................................................... 58 6.4. Data Gaps and Needs ............................................................................................................... 61
7. STRATEGIES TO MITIGATE RISKS DUE TO LAND APPLICATION OF PFAS-CONTAMINATED COMPOST OR DIGESTATE........................................................................................................... 63
8. CONCLUSIONS AND RESEARCH GAPS ....................................................................................... 65 8.1. Conclusions ............................................................................................................................... 65 8.2. Research Gaps .......................................................................................................................... 67
9. REFERENCES ................................................................................................................................ 70
Persistent Chemical Contaminants v
APPENDIX A: LITERATURE SEARCH METHODOLOGY ................................................................... 86 A.1. Methodology for Peer-Reviewed Literature ................................................................................... 86 A.2. Methodology for Grey Literature ................................................................................................... 89
Tables Table 1. Concentrations of Per- and Polyfluoroalkyl Substances in Food from Example Studies (Range
Reported) ................................................................................................................................. 7 Table 2. Concentrations of Per- and Polyfluoroalkyl Substances in Various Composts ........................ 23 Table 3. Maximum Drinking Water Contaminant Levels for Select PFAS in U.S. States (μg/L) ............ 32 Table 4. FIFRA Tolerances for Persistent Herbicide Residues in Food, including Its Metabolites and
Degradates ............................................................................................................................ 38 Table 5. Examples of Compost Contamination by Clopyralid, Aminopyralid, and Picloram .................. 42 Table 6. Allowed Feedstocks and Prohibited Materials for Organic Composts ..................................... 54
Figures Figure 1. Concentrations of PFAS Detected in the Different Food Groups from Brazil, Saudi Arabia,
Serbia, and Spain .................................................................................................................. 15

Persistent Chemical Contaminants 1
1. INTRODUCTION The purpose of this issue paper is to inform policymakers, producers of food waste compost, and potential buyers of compost and digestate about the contribution of food waste streams to persistent chemical contamination in compost and digestate, relative to other common feedstocks, and the potential health and environmental risks posed by land applying compost and digestate made from food waste. The paper also identifies key research gaps, where data collection or original research may help stakeholders better understand the contribution of food waste to persistent chemical contamination in compost and digestate and determine solutions.
In this issue paper, food waste is defined as food that is produced for human consumption but not ultimately consumed by humans. Food waste streams may include items other than food waste, including compostable and non-compostable food contact materials.1 Over one-third of the food produced in the U.S. is never eaten, wasting the resources used to produce it and creating a myriad of environmental impacts. Food waste also presents lost opportunities to increase domestic and global food security, promote resource and energy conservation, foster productivity and economic efficiency, and address climate change. The U.S. Environmental Protection Agency (EPA) estimates that more food reaches landfills and incinerators than any other single material in our everyday trash, constituting more than 24 percent of landfilled municipal solid waste (MSW) and 22 percent of combusted MSW in 2018 (U.S. EPA, 2020j).
Recognizing the critical importance of reducing food waste, in September 2015, the EPA and U.S. Department of Agriculture (USDA) announced the U.S. 2030 Food Loss and Waste Reduction Goal to halve food loss and waste by 2030 (U.S. EPA, 2020m). One of EPA’s strategies to help the U.S. meet this goal is to encourage composting and anaerobic digestion of food waste, in order to recover valuable resources (e.g., nutrients or energy) from food waste and divert it from landfills. However, stakeholders, such as states, the compost industry, and its customers, have raised concerns about persistent chemical2 contaminants in compost and digestate being transferred to soil, leading to uptake by plants and crops, leaching into groundwater, and/or direct damage to plants and crops.
Persistent chemical contaminants (e.g., per- and polyfluoroalkyl substances (PFAS), pesticides (specifically persistent herbicides), polychlorinated biphenyls (PCBs), polycyclic aromatic hydrocarbons (PAHs)) have been detected in a variety of other composting and anaerobic digestion feedstock materials, including yard waste, manure, and sewage sludge as well as finished compost and digestate (Višniauskė et al., 2018; Benisek et al., 2015; Gomez-Canela et al., 2012; Kupper et al., 2008; Brandli et al., 2005). It is important to note that anaerobic digestates can also serve as a feedstock for composting. Processes that affect chemical contaminant concentrations in the final products can include solids reduction, dilution, transformation, and volatilization.
The presence of persistent chemical contaminants in composts and digestates has far-reaching implications for municipal food waste collection programs; the quality, safety, and ultimate use of compost and digestate; and, consequently, efforts to reduce food waste. In a 2019 survey of national and regional composting stakeholders, the presence of contaminants in compost was chosen as the second most important trend affecting the composting industry, with the first trend being landfill mandates that led to organics sent to composting and anaerobic digestion facilities. PFAS contamination was also individually chosen as a top 10 trend (Goldstein and Coker, 2020). Understanding potential health and environmental risks posed by persistent chemicals in food waste compost and digestate requires reliable data on the classes of chemical contaminants present and their associated physicochemical properties,3 their concentrations, and potential routes and levels of exposure. Accordingly, this issue paper reviews and summarizes the information available in the literature on:
________________ 1 Food contact materials may be included intentionally (as compostable materials would be) or unintentionally as a contaminant not removed during pre-processing. 2 Persistent chemicals are chemicals that are resistant to environmental degradation through chemical and biological processes and have the ability to bioaccumulate in living organisms. 3 Physicochemical properties can be obtained from databases such as EPA’s CompTox Chemistry Dashboard (U.S. EPA, 2021e) or estimated using software tools such as EPA’s EPI Suite (U.S. EPA, 2021f).

Persistent Chemical Contaminants 2
(i) The presence of persistent chemical contaminants in food waste streams and associated compost or digestate, including comparisons to concentrations in other waste streams,
(ii) The contaminant fate in composting or anaerobic digestion,
(iii) The effect of these contaminants on the marketability of the compost or digestate produced, and
(iv) A discussion on data needed to support a robust assessment of the risks associated with land application of compost or digestate produced from food waste.
After reviewing the available literature in each of the areas listed above, conclusions and research gaps are presented to guide future efforts.
1.1. Scope This issue paper focuses predominantly on PFAS and persistent herbicides, with a brief discussion of two other organic chemical contaminants—PCBs and PAHs. Inorganic chemical contaminants (e.g., heavy metals) were beyond the scope of this issue paper. The four classes of chemicals were selected based on data availability after a preliminary literature search on chemical contaminants in food waste compost or digestate. The potential adverse human health effects of certain PFAS, PCBs, and PAHs are well documented (Sinclair et al., 2020; U.S. EPA, 2020n; Kim et al., 2017; ATSDR, 2009), as is crop and garden damage from unintended persistent herbicides. Other sources of these contaminants such as personal care products and pharmaceuticals are not considered in this issue paper as they are outside the scope of food waste. A separate EPA issue paper discusses the impacts of plastic contamination in food waste streams (EPA 600-R-21-001, August 2021).
1.2. Methods The information summarized in this issue paper includes both peer-reviewed literature and gray (non-peer-reviewed) literature from science and technical reports, theses, and dissertations pertinent to chemical contaminants and food waste, composts, and digestates. For example, the organic recycling e-magazine BioCycle provided articles, case studies, and interviews from composting stakeholders (Coker, 2020a, b; Dawson, 2020; Goldstein and Coker, 2020; Beecher and Brown, 2018a, b; Goldstein, 2018; BioCycle, 2017; Coker, 2015, 2zz013; Goldstein, 2013); PFAS in food contact materials (defined in this issue paper as materials and articles that come into contact with food, specifically food packaging and food serviceware) was reported by the nonprofit organizations, Toxic-Free Future and Safer Chemicals, Healthy Families (Dickman et al.; Schreder and Dickman, 2018) and the Center for Environmental Health (Chiang et al., 2018); contaminant concentrations in composts and digestates were measured by the Waste & Resources Action Programme (WRAP, 2011, 2010), a UK-based nonprofit organization; and risk assessments were conducted on behalf of European environmental agencies (wca environment Ltd., 2019; Wood, 2019). Citation searching identified additional references. This issue paper focused on U.S. data, with international data used when insufficient U.S. data could be found in the literature. All data presented in this issue paper are from the United States or Europe, unless otherwise noted.
Food waste is rarely processed alone, therefore most of the available research reports contaminant concentrations in compost produced from feedstock mixtures. Because composting requires a specific carbon-to-nitrogen ratio, with an optimal moisture content of 60%, food waste is mixed with bulking agents, such as sawdust and yard waste (Risse and Faucette, 2017). Similarly, while mono-digestion using food waste as a sole feedstock is possible, co-digestion of food waste with sewage sludge, manure, or other waste streams is common (Banks et al., 2018).

Persistent Chemical Contaminants 3
Papers with potential data on PFAS and pesticides concentrations in compost and digestate were primarily derived from feedstock mixtures containing food waste. The use of feedstock mixtures does not allow for a definitive determination of PFAS and pesticide concentrations in food waste streams or associated products; however, a comparison of composts and digestates made with and without food waste, when other components of the feedstock mixture are similar, supports a determination of (i) the presence of PFAS and pesticides in food waste and (ii) whether food waste compost/digestate would contain higher or lower concentrations of PFAS and pesticides compared with composts made from other feedstock sources.
When no literature was identified that reported concentrations in food waste or allowed for PFAS or pesticide concentrations to be estimated, a brief search was performed on contaminant concentration in food. The data presented on contaminant concentrations from other feedstocks (i.e., not food waste or mixtures with food waste) represent example studies and not a comprehensive review of all data available. Comparisons across studies should be viewed with caution as different studies can use different sampling techniques and analytical methods.
Persistent Chemical Contaminants 4
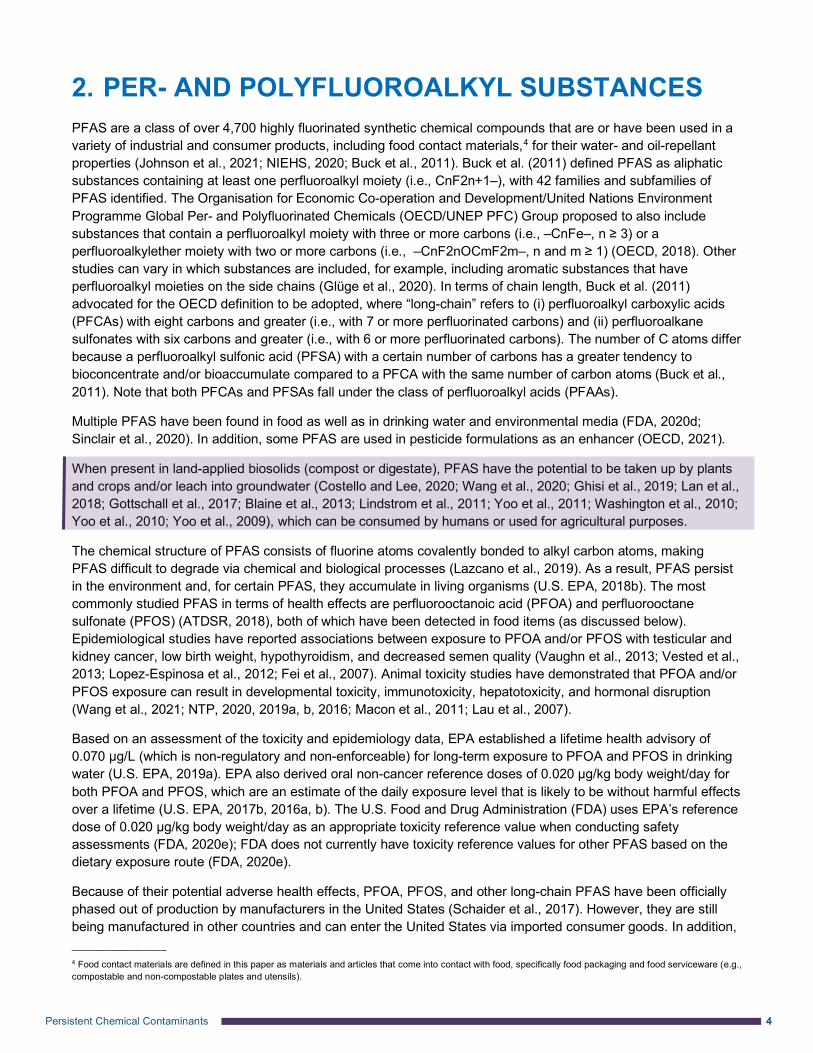
2. PER- AND POLYFLUOROALKYL SUBSTANCES PFAS are a class of over 4,700 highly fluorinated synthetic chemical compounds that are or have been used in a variety of industrial and consumer products, including food contact materials,4 for their water- and oil-repellant properties (Johnson et al., 2021; NIEHS, 2020; Buck et al., 2011). Buck et al. (2011) defined PFAS as aliphatic substances containing at least one perfluoroalkyl moiety (i.e., CnF2n+1–), with 42 families and subfamilies of PFAS identified. The Organisation for Economic Co-operation and Development/United Nations Environment Programme Global Per- and Polyfluorinated Chemicals (OECD/UNEP PFC) Group proposed to also include substances that contain a perfluoroalkyl moiety with three or more carbons (i.e., –CnFe–, n ≥ 3) or a perfluoroalkylether moiety with two or more carbons (i.e., –CnF2nOCmF2m–, n and m ≥ 1) (OECD, 2018). Other studies can vary in which substances are included, for example, including aromatic substances that have perfluoroalkyl moieties on the side chains (Glüge et al., 2020). In terms of chain length, Buck et al. (2011) advocated for the OECD definition to be adopted, where “long-chain” refers to (i) perfluoroalkyl carboxylic acids (PFCAs) with eight carbons and greater (i.e., with 7 or more perfluorinated carbons) and (ii) perfluoroalkane sulfonates with six carbons and greater (i.e., with 6 or more perfluorinated carbons). The number of C atoms differ because a perfluoroalkyl sulfonic acid (PFSA) with a certain number of carbons has a greater tendency to bioconcentrate and/or bioaccumulate compared to a PFCA with the same number of carbon atoms (Buck et al., 2011). Note that both PFCAs and PFSAs fall under the class of perfluoroalkyl acids (PFAAs).
Multiple PFAS have been found in food as well as in drinking water and environmental media (FDA, 2020d; Sinclair et al., 2020). In addition, some PFAS are used in pesticide formulations as an enhancer (OECD, 2021).
When present in land-applied biosolids (compost or digestate), PFAS have the potential to be taken up by plants and crops and/or leach into groundwater (Costello and Lee, 2020; Wang et al., 2020; Ghisi et al., 2019; Lan et al., 2018; Gottschall et al., 2017; Blaine et al., 2013; Lindstrom et al., 2011; Yoo et al., 2011; Washington et al., 2010; Yoo et al., 2010; Yoo et al., 2009), which can be consumed by humans or used for agricultural purposes.
The chemical structure of PFAS consists of fluorine atoms covalently bonded to alkyl carbon atoms, making PFAS difficult to degrade via chemical and biological processes (Lazcano et al., 2019). As a result, PFAS persist in the environment and, for certain PFAS, they accumulate in living organisms (U.S. EPA, 2018b). The most commonly studied PFAS in terms of health effects are perfluorooctanoic acid (PFOA) and perfluorooctane sulfonate (PFOS) (ATDSR, 2018), both of which have been detected in food items (as discussed below). Epidemiological studies have reported associations between exposure to PFOA and/or PFOS with testicular and kidney cancer, low birth weight, hypothyroidism, and decreased semen quality (Vaughn et al., 2013; Vested et al., 2013; Lopez-Espinosa et al., 2012; Fei et al., 2007). Animal toxicity studies have demonstrated that PFOA and/or PFOS exposure can result in developmental toxicity, immunotoxicity, hepatotoxicity, and hormonal disruption (Wang et al., 2021; NTP, 2020, 2019a, b, 2016; Macon et al., 2011; Lau et al., 2007).
Based on an assessment of the toxicity and epidemiology data, EPA established a lifetime health advisory of 0.070 µg/L (which is non-regulatory and non-enforceable) for long-term exposure to PFOA and PFOS in drinking water (U.S. EPA, 2019a). EPA also derived oral non-cancer reference doses of 0.020 µg/kg body weight/day for both PFOA and PFOS, which are an estimate of the daily exposure level that is likely to be without harmful effects over a lifetime (U.S. EPA, 2017b, 2016a, b). The U.S. Food and Drug Administration (FDA) uses EPA’s reference dose of 0.020 µg/kg body weight/day as an appropriate toxicity reference value when conducting safety assessments (FDA, 2020e); FDA does not currently have toxicity reference values for other PFAS based on the dietary exposure route (FDA, 2020e).
Because of their potential adverse health effects, PFOA, PFOS, and other long-chain PFAS have been officially phased out of production by manufacturers in the United States (Schaider et al., 2017). However, they are still being manufactured in other countries and can enter the United States via imported consumer goods. In addition, ________________ 4 Food contact materials are defined in this paper as materials and articles that come into contact with food, specifically food packaging and food serviceware (e.g., compostable and non-compostable plates and utensils).

Persistent Chemical Contaminants 5
new PFAS continue to be developed as substitutes, some of which may exhibit similar behavior and properties to existing PFAS (Cousins et al., 2019; ATDSR, 2018). While long-chain PFAS are officially phased out, they are being replaced with short-chain PFAS which may have similar harmful effects on humans and the environment.
To address PFAS in the environment and to protect public health, EPA has identified both short-term and long-term goals and actions, including moving forward on regulations for PFAS in drinking water and in the environment and proposed collection of new PFAS data to better understand occurrence and prevalence in drinking water (U.S. EPA, 2020g, 2019d). EPA also seeks to improve detection and measurement methods for PFAS. EPA has two approved laboratory methods for drinking water, Method 537.1 and 533, that can measure a total of 29 PFAS, with Method 533 focusing on short chain PFAS (U.S. EPA, 2020h, 2019b).
Currently there is no multilaboratory-validated analytical method for the detection of PFAS in solids (e.g., food waste, composts, digestates) although there are standardized methods within organizations for PFAS testing in soil and solid matrices (e.g., the state of California and the U.S. Department of Defense both have Environmental Laboratory Accreditation Programs that allow laboratories to be accredited for PFAS testing in non-drinking water matrices) (California Water Boards Environmental Laboratory Accreditation Program (ELAP), 2019; DoD and DoE, 2019). There is an American Society for Testing and Materials (ASTM) standard for determining perfluorinated compounds in soil (standard D7968-17a)(ASTM International, 2017); however, most laboratories use a modified version of Method 537 for PFAS detection in solids (Coker, 2020a). EPA is developing CWA Method 1600, in collaboration with the U.S. Department of Defense, to measure PFAS in fish tissues, biosolids, soils, sediments, and non-drinking water aqueous matrices (e.g., surface water, groundwater, wastewater influent/effluent, landfill leachate) (U.S. EPA, 2021o, 2019c).
It should be noted that the PFAS discussed in this section (e.g., PFOA, PFOS) are identified through targeted analyses but “emerging” PFAS continue to be identified through nontargeted analyses. For example, recent studies in New Jersey have detected several chloroperfluoropolyether carboxylates (ClPFPECA), which are new PFAS to replace legacy PFAS, in soil and surface water (McCord et al., 2020; Washington et al., 2020). One such ClPFPECA was reviewed by the European Food Safety Authority (EFSA) for use in food contact materials, where EFSA concluded there is no safety concern for the consumer if the substance is to be used under specified conditions (EFSA, 2010). With emerging PFAS being identified, it remains a challenge to know what to test for during environmental monitoring.
2.1. PFAS in Food Waste and Food Items Only one study was identified that measured PFAS concentrations in food waste. In a report prepared for the Environmental Research and Education Foundation, 25 samples of food waste from Massachusetts and Vermont were tested for 17 PFAS. The food waste samples were collected from grocery stores, hospitals, schools, restaurants, retirement communities, and residences. Of the 25 samples, perfluorobutanoic acid (PFBA) was detected in 14 samples (0.11–1 µg/kg), perfluorohexane sulfonate (PFHxS) was detected in 2 samples (0.11–0.15 µg/kg), and perfluorononanoic acid (PFNA) was detected in 1 sample (0.28 µg/kg) (MacRae et al., 2020). No studies were identified that reported PFAS concentrations in mixtures of food waste with other wastes (e.g., yard waste).
PFAS have been detected in food items in the United States and other countries, suggesting that food waste would also likely contain PFAS. PFAS contamination in food occurs through (i) interaction with food contact materials that contain PFAS, (ii) the use of contaminated water (e.g., irrigation water) and/or soil to grow crops, or (iii) the use of food processing equipment contaminated with PFAS (U.S. EPA, 2018b). Another possible pathway is the use of PFAS-containing water for food processing or preparation.
Studies on food contact materials have reported the migration of PFAS, including PFOA, PFBA, perfluorohexanoic acid (PFHxA), PFNA, and fluorotelomer alcohols (FTOHs), from materials such as microwave

Persistent Chemical Contaminants 6
popcorn bags and paper bowls into foods and food simulants5 (Zabaleta et al., 2020; Li et al., 2019; Yuan et al., 2016; Begley et al., 2005), leading to PFAS contamination of food. The level of migration depends on several factors, including the PFAS chain length, contact time, and temperature (Zabaleta et al., 2020). The studies summarized below are not an exhaustive list of studies reporting PFAS concentrations in food but rather a sample of studies to demonstrate that PFAS have been measured in food items.
Food in the United States
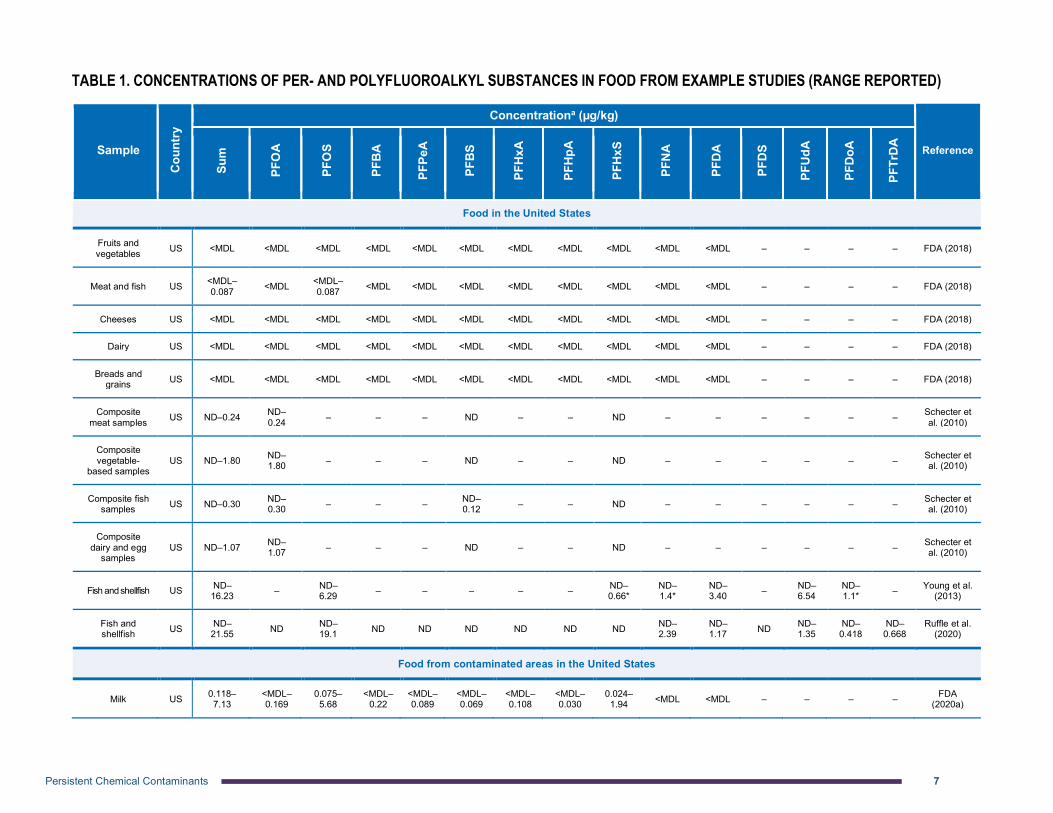
The range of PFAS concentrations reported in food studies within the United States are contained within Table 1. In general, food packaging was not tested as part of these studies, unless otherwise noted.
As part of the 2018 U.S. Total Diet Study, FDA tested for 16 PFAS in food samples purchased in 2017 (and analyzed in 2019) from U.S. grocery stores. Determination of whether the foods were produced in the U.S. or imported was not provided. Results from the limited sampling showed that in the first two sets of U.S. Total Diet Study samples, PFOS was detected in two out of 91 samples in the first set and in one out of 88 samples in the second set. The concentration of PFOS ranged from 0.083 to 0.087 µg/kg and was found only in meat and seafood samples (i.e., ground turkey and tilapia in a fresh, frozen, natural state). No PFAS were detected in samples of produce, dairy, and grain products (FDA, 2020d).
In a 2009 market basket survey, 31 composite food samples (formed from 10 individual food samples for each food type) were purchased from five grocery stores in Texas and tested for 11 PFAS (Schecter et al., 2010). PFOS, PFHxA, perfluoroheptanoic acid (PFHpA), PFNA, perfluorodecanoic acid (PFDA), perfluorooctanesulfonamide (PFOSA), perfluorodecane sulfonate (PFDS), and perfluorododecanoic acid (PFDoA) were not detected. PFOA was detected in 55% of composite samples – in almost all meat products (<0.02–0.24 µg/kg wet weight (ww)) and fish (<0.05–0.30 µg/kg ww), in only butter (1.07 µg/kg ww) from the diary and egg samples tested, and in some vegetable-based samples (<0.02–1.80 µg/kg ww, with the maximum corresponding to olive oil). Perfluorobutane sulfonate (PFBS) and PFHxS were only detected in cod at 0.12 and 0.07 µg/kg ww, respectively (Schecter et al., 2010).
In a study of retail fish and shellfish purchased in the United States, 10 PFAS—which were all PFAAs —were tested for. Of the 46 samples, 11 (corresponding to shrimp, striped bass, and crab) contained detectable concentrations of PFOS, PFNA, PFDoA, PFDA, PFHxS, or perfluoroundecanoic acid (PFUdA) (Young et al., 2013). PFOS was the most frequently detected PFAS, found in nine samples, and was generally found in higher concentrations than the other PFAS, with a maximum concentration of 6.29 µg/kg in crab homogenate. Maximum concentrations of PFUdA and PFDA were 6.54 and 3.40 µg/kg, respectively, and were also found in the same crab homogenate sample (Young et al., 2013). In another market basket study on fish and shellfish purchased in the United States, Ruffle et al. (2020) also showed that PFOS was the predominant PFAS detected. Of the 70 samples analyzed, up to 10 PFAS (out of 26 analyzed) were detected in 21 samples, with total PFAS levels ranging from 0.45 to 21.55 µg/kg (Ruffle et al., 2020). The 10 PFAS detected were all long-chain PFAS, which is consistent with literature reporting bioaccumulation of some long-chain compounds in meat and seafood (Vestergren et al., 2013; Houde et al., 2011). In Ruffle et al. (2020), fish and shellfish were purchased and packaged at the fish counter and samples of the fish wrapping material and the polyethylene bag used to store the fish samples were also tested for the presence of PFAS. All 26 PFAS analyzed were not detected in the four samples of wrapping paper and the polyethylene bag, indicating that the PFAS measured in the fish and shellfish samples were not due to contamination by packaging materials.
________________ 5 A simulant is a chemical with characteristics similar to a food group (e.g., watery, acidic, alcoholic, milk, oil and fat, or dry food).
Persistent Chemical Contaminants 7
TABLE 1. CONCENTRATIONS OF PER- AND POLYFLUOROALKYL SUBSTANCES IN FOOD FROM EXAMPLE STUDIES (RANGE REPORTED)
Sample
Coun
try
Concentrationa (µg/kg)
Reference
Sum
PFO
A
PFO
S
PFBA
PFPe
A
PFBS
PFHx
A
PFHp
A
PFHx
S
PFNA
PFDA
PFDS
PFUd
A
PFDo
A
PFTr
DA
Food in the United States
Fruits and vegetables US <MDL <MDL <MDL <MDL <MDL <MDL <MDL <MDL <MDL <MDL <MDL – – – – FDA (2018)
Meat and fish US <MDL–0.087 <MDL <MDL–
0.087 <MDL <MDL <MDL <MDL <MDL <MDL <MDL <MDL – – – – FDA (2018)
Cheeses US <MDL <MDL <MDL <MDL <MDL <MDL <MDL <MDL <MDL <MDL <MDL – – – – FDA (2018)
Dairy US <MDL <MDL <MDL <MDL <MDL <MDL <MDL <MDL <MDL <MDL <MDL – – – – FDA (2018)
Breads and grains US <MDL <MDL <MDL <MDL <MDL <MDL <MDL <MDL <MDL <MDL <MDL – – – – FDA (2018)
Composite meat samples US ND–0.24 ND–
0.24 – – – ND – – ND – – – – – – Schecter et al. (2010)
Composite vegetable-
based samples US ND–1.80 ND–
1.80 – – – ND – – ND – – – – – – Schecter et al. (2010)
Composite fish samples US ND–0.30 ND–
0.30 – – – ND–0.12 – – ND – – – – – – Schecter et
al. (2010)
Composite dairy and egg
samples US ND–1.07 ND–
1.07 – – – ND – – ND – – – – – – Schecter et al. (2010)
Fish and shellfish US ND–16.23 – ND–
6.29 – – – – – ND–0.66*
ND–1.4*
ND–3.40 – ND–
6.54 ND–1.1* – Young et al.
(2013)
Fish and shellfish US ND–
21.55 ND ND–19.1 ND ND ND ND ND ND ND–
2.39 ND–1.17 ND ND–
1.35 ND–0.418
ND–0.668
Ruffle et al. (2020)
Food from contaminated areas in the United States
Milk US 0.118–7.13
<MDL–0.169
0.075–5.68
<MDL–0.22
<MDL–0.089
<MDL–0.069
<MDL–0.108
<MDL–0.030
0.024–1.94 <MDL <MDL – – – – FDA
(2020a)
Persistent Chemical Contaminants 8
Sample
Coun
try
Concentrationa (µg/kg)
Reference
Sum
PFO
A
PFO
S
PFBA
PFPe
A
PFBS
PFHx
A
PFHp
A
PFHx
S
PFNA
PFDA
PFDS
PFUd
A
PFDo
A
PFTr
DA
Cheese US <MDL–0.833 – <MDL–
0.833 – <MDL <MDL <MDL <MDL <MDL <MDL <MDL – – – – FDA (2020a)
Milk US 12.700–32.2 – 12.7–
32.2 – – – – – – – – – – – – IATP (2020)
Produce US <MDL–1.11
<MDL–0.237
<MDL–0.144
<MDL–0.566
<MDL–0.117
<MDL–0.129
<MDL–0.0986
<MDL–0.0469 <MDL <MDL–
0.029 <MDL – – – – FDA (2020a)
Produce US NR ND–0.26
ND–0.38
ND–33.0
ND–0.77
ND–0.065
ND–0.22 – ND–
0.066 – – – – – – Scher et al. (2018)
Wild-caught fish fillets US 13–100 ND–0.3 11–90 – – ND–
0.3 ND ND–6.8 ND ND ND–2.4 – ND–1.7
ND–2.3 – Ye et al.
(2008a)
Wild-caught whole fish
homogenates US 5.90–
1,270 ND–2.10
ND–1,250 – – ND–
0.64 ND–18.4
ND–4.03
ND–8.14
ND–5.89
ND–9.01 – ND–
48.0 ND–4.13 – Ye et al.
(2008b)
Wild-caught whole fish US 6.20–
85.4 – 2.53–66.3 – – – – – – – – – – – – Fair et al.
(2019)
Wild-caught fish fillet US 2.99–
36.7 – 0.43–30.0 – – – – – – – – – – – – Fair et al.
(2019)
Food from outside the United States
Meat products CA 0.5*–7.2 ND–2.6 0.5*–2.7 – – – – ND – ND–4.5 ND – ND ND – Tittlemier et
al. (2007)
Fish CA 1.3*–2.6 ND 1.3*–2.6 – – – – ND – ND ND – ND ND – Tittlemier et
al. (2007)
Pizza CA 2.0* 0.74* ND – – – – 2.0* – ND ND – ND ND – Tittlemier et
al. (2007)
Microwave popcorn CA 3.6 3.6 0.98* – – – – 1.5* – ND ND – ND ND – Tittlemier et
al. (2007)

Persistent Chemical Contaminants 9
Sample
Coun
try
Concentrationa (µg/kg)
Reference
Sum
PFO
A
PFO
S
PFBA
PFPe
A
PFBS
PFHx
A
PFHp
A
PFHx
S
PFNA
PFDA
PFDS
PFUd
A
PFDo
A
PFTr
DA
Vegetables
BE <MQL–0.136
<MQL–0.016
<MQL–0.0258 – – – <MQL–
0.052 <MQL – <MQL <MQL – <MQL <MQL <MQL Herzke et al. (2013)
CZ <MQL–0.114
<MQL–0.0297
<MQL–0.0063* – – – <MQL–
0.0378 <MQL–0.046 – <MQL–
0.0101* <MQL–0.0043* – <MQL <MQL <MQL Herzke et
al. (2013)
IT <MQL–0.121
<MQL–0.121
<MQL–0.0502 – – – <MQL–
0.0122 <MQL–0.0066* – <MQL <MQL – <MQL <MQL <MQL Herzke et
al. (2013)
NO <MQL–0.131
<MQL–0.0882 <MQL – – – <MQL–
0.0344 <MQL–0.0899 – <MQL–
0.0122 <MQL – <MQL <MQL <MQL Herzke et al. (2013)
Foodstuffs–(i) cereals, (ii) pulses and
starchy roots, (iii) tree nuts, oil crops, and vegetable oils, (iv) vegetables and fruits, (v)
meat and meat products, (vi) milk, animal fats, dairy
products, and eggs, (vii) fish and seafood,
and (viii) candies or
coffee
BR NR ND–0.750
ND–0.234
ND–0.834 ND ND–
0.486 ND–0.388 ND ND–
0.523 ND ND–0.228 ND ND ND ND Pérez et al.
(2014)
SA NR ND–1.245
ND–15.0
ND–0.422
ND–0.153
ND–0.490
ND–5.512 ND ND ND–
0.430 ND ND ND ND–0.375 ND Pérez et al.
(2014)
RS NR ND–0.700
ND–2.70
ND–1.40
ND–0.776
ND–0.460 ND ND ND ND–
0.430 ND–0.490
ND–0.205 ND ND–
1.40 ND Pérez et al. (2014)
ES NR ND–8.00
ND–14.5
ND–5.70
ND–28.0
ND–13.0
ND–2.90
ND–0.240 ND ND–
13.0 ND–2.20
ND–0.250 ND ND ND Pérez et al.
(2014)
US = United States; CA = Canada; BE = Belgium; CZ = Czech Republic; IT = Italy; NO = Norway; BR = Brazil; SA = Saudi Arabia; RS = Serbia; ES = Spain. – = not analyzed; MDL = method detection limit; ND = not detected; MQL = method quantitation limit; NR = not reported. MDLs for the different PFAS ranged from 0.020 to 0.107 µg/kg for lettuce, 0.021 to 0.090 µg/kg for meat products, 0.197 to 0.901 µg/kg for cheese, 0.007 to 0.042 µg/kg for milk, and 0.020 to 0.090 µg/kg for bread for FDA (2018) and FDA (2020a); from 0.01 to 0.05 µg/kg for composite meat samples, 0.02 to 0.5 µg/kg for composite vegetable-based samples, 0.04 to 0.09 µg/kg for composite fish samples, and 0.02 to 0.09 µg/kg for composite dairy and egg samples Schecter et al. (2010); from 0.31 to 1.28 µg/kg for Young et al. (2013); from 0.412 to 0.947 µg/kg for Ruffle et al. (2020); were not reported for IATP (2020); from 0.003 to 0.029 µg/kg for Scher et al. (2018); from 0.5 to 6 µg/kg for Tittlemier et al. (2007); and from 0.005 to 0.613 µg/kg for Pérez et al. (2014). MQLs for the different PFAS ranged from 0.2 to 1.0 µg/kg for Ye et al. (2008a); from 0.2 to 10.0 µg/kg for Ye et al. (2008b); from 0.06 to 0.88 µg/kg for Fair et al. (2019); and from 0.002 to 0.050 µg/kg for Herzke et al. (2013). * = indicates when studies reported a concentration that was above the MDL but below the MQL. a Chemical acronyms: PFOA = perfluorooctanoic acid; PFOS = perfluorooctane sulfonate; PFBA = perfluorobutanoic acid; PFPeA = perfluoropentanoic acid; PFBS = perfluorobutane sulfonate; PFHxA = perfluorohexanoic acid; PFHpA = perfluoroheptanoic acid; PFHxS = perfluorohexane sulfonate; PFNA = perfluorononanoic acid; PFDA = perfluorodecanoic acid; PFDS = perfluorodecane sulfonate; PFUdA = perfluoroundecanoic acid; PFDoA = perfluorododecanoic acid; PFTrDA = perfluorotridecanoic acid; PFTeDA = perfluorotetradecanoic acid; PFHxDA = perfluorohexadecanoic acid; PFHpS = perfluoroheptanesulfonic acid; PFPeS = perfluoropentanesulfonic acid; NaDONA = sodium dodecafluoro-3H-4, 8- dioxanonanoate; HFPO-DA = 2,3,3,3-Tetrafluoro-2-(1,1,2,2,3,3,3- heptafluoropropoxy) propanoic acid (GenX); 11Cl-PF3OUdS = 11-chloroeicosafluoro-3-oxaundecane-1- sulfonic acid; 9Cl-PF3ONs = potassium 9-chlorohexadecafluoro-3- oxanonane-1-sulfonate; 4:2 FTS = 4:2 fluorotelomer sulfonate; 6:2 FTS = 6:2 fluorotelomer sulfonate; 8:2 FTS = 8:2 fluorotelomer sulfonate; PFODA = perfluorooctadecanoic acid; PFNS = perfluorononane sulfonic acid; PFOSA = perfluorooctane sulfonamide; MeFOSAA = N-methyl Perfluorooctane sulfonamido acetic acid; EtFOSAA = N-ethyl Perfluorooctane sulfonamido acetic acid; FHEA = perfluorohexylethanoicacid; FOEA = perfluoroocty-lethanoic acid; FDEA = perfluorodecylethanoicacid.

Persistent Chemical Contaminants 10
TABLE 1. CONCENTRATIONS OF PER- AND POLYFLUOROALKYL SUBSTANCES IN FOOD FROM EXAMPLE STUDIES (RANGE REPORTED) (CONTINUED)
Sample Co
untr
y
Concentrationa (µg/kg)
Reference
PFTe
DA
PFH
xDA
PFH
pS
PFPe
S
NaD
ON
A
HFP
O-D
A
11C
l-PF3
OU
dS
9Cl-P
F3O
Ns
4:2
FTS
6:2
FTS
8:2
FTS
PFO
DA
PFN
S
PFO
SA
MeF
OSA
A
EtFO
SAA
FHEA
FOEA
FDEA
Food in the United States
Fruits and vegetables US – – <MDL <MDL <MDL <MDL <MDL <MDL – – – – – – – – – – – FDA (2018)
Meat and fish US – – <MDL <MDL <MDL <MDL <MDL <MDL – – – – – – – – – – – FDA (2018)
Cheeses US – – <MDL <MDL <MDL <MDL <MDL <MDL – – – – – – – – – – – FDA (2018)
Bottled water US – – <MDL <MDL <MDL <MDL <MDL <MDL – – – – – – – – – – – FDA (2018)
Dairy US – – <MDL <MDL <MDL <MDL <MDL <MDL – – – – – – – – – – – FDA (2018)
Breads and grains US – – <MDL <MDL <MDL <MDL <MDL <MDL – – – – – – – – – – – FDA (2018)
Composite meat
samples US
– – – – – – – – – – – – – – – – – – – Schecter et
al. (2010)
Composite vegetable-
based samples
US
– – – – – – – – – – – – – – – – – – – Schecter et al. (2010)
Composite fish samples US – – – – – – – – – – – – – – – – – – – Schecter et
al. (2010)
Composite dairy and egg
samples US
– – – – – – – – – – – – – – – – – – – Schecter et
al. (2010)
Fish and shellfish US – – – – – – – – – – – – – – – – – – – Young et al.
(2013)
Fish and shellfish US
ND ND ND ND – – – – ND ND–1.68 ND ND ND ND–
0.762 ND ND – – – Ruffle et al. (2020)

Persistent Chemical Contaminants 11
Sample
Coun
try
Concentrationa (µg/kg)
Reference
PFTe
DA
PFH
xDA
PFH
pS
PFPe
S
NaD
ON
A
HFP
O-D
A
11C
l-PF3
OU
dS
9Cl-P
F3O
Ns
4:2
FTS
6:2
FTS
8:2
FTS
PFO
DA
PFN
S
PFO
SA
MeF
OSA
A
EtFO
SAA
FHEA
FOEA
FDEA
Food from contaminated areas in the United States
Milk US – – <MDL–0.239
<MDL–0.076 <MDL <MDL <MDL <MDL – – – – – – – – – – – FDA (2020a)
Cheese US – – <MDL <MDL <MDL <MDL <MDL <MDL – – – – – – – – – – – FDA (2020a)
Milk US – – – – – – – – – – – – – – – – – – – IATP (2020)
Produce US – – <MDL <MDL <MDL <MDL–0.224 <MDL <MDL – – – – – – – – – – – FDA (2020a)
Produce US – – – – – – – – – – – – – – – – – – – Scher et al. (2018)
Wild-caught fish fillets US – – – – – – – – – – – – – – – – – – – Ye et al.
(2008a)
Wild-caught whole fish
homogenates US
– – – – – – – – – – – – – – – – – – – Ye et al.
(2008b)
Wild-caught whole fish US – – – – – – – – – – – – – – – – – – – Fair et al.
(2019)
Wild-caught fish fillet US – – – – – – – – – – – – – – – – – – – Fair et al.
(2019)
Food from outside the United States
Meat products CA ND – – – – – – – – – – – – – – – – – – Tittlemier et
al. (2007)
Fish CA ND – – – – – – – – – – – – – – – – – – Tittlemier et al. (2007)
Pizza CA ND – – – – – – – – – – – – – – – – – – Tittlemier et al. (2007)
Microwave popcorn CA ND – – – – – – – – – – – – – – – – – – Tittlemier et
al. (2007)

Persistent Chemical Contaminants 12
Sample
Coun
try
Concentrationa (µg/kg)
Reference
PFTe
DA
PFH
xDA
PFH
pS
PFPe
S
NaD
ON
A
HFP
O-D
A
11C
l-PF3
OU
dS
9Cl-P
F3O
Ns
4:2
FTS
6:2
FTS
8:2
FTS
PFO
DA
PFN
S
PFO
SA
MeF
OSA
A
EtFO
SAA
FHEA
FOEA
FDEA
Vegetables
BE <MQL – – – – – – – – – – – – – – – – – – Herzke et al. (2013)
CZ <MQL – – – – – – – – – – – – – – – – – – Herzke et al. (2013)
IT <MQL – – – – – – – – – – – – – – – – – – Herzke et al. (2013)
NO <MQL – – – – – – – – – – – – – – – – – – Herzke et al. (2013)
Foodstuffs - (i) cereals, (ii)
pulses and starchy roots, (iii) tree nuts, oil crops, and
vegetable oils, (iv)
vegetables and fruits, (v)
meat and meat
products, (vi) milk, animal fats, dairy
products, and eggs, (vii) fish and
seafood, and (viii) candies
or coffee
BR ND ND – – – – – – – – – ND – ND–0.228 – – ND ND ND Pérez et al.
(2014)
SA ND ND – – – – – – – – – ND – ND–0.580 – – ND ND ND Pérez et al.
(2014)
RS ND ND – – – – – – – – – ND – ND–2.10 – – ND–
0.946 ND ND Pérez et al. (2014)
ES
ND ND – – – – – – – – – ND – ND–5.30 – – ND–
7.00 ND–0.079 ND Pérez et al.
(2014)
US = United States; CA = Canada; BE = Belgium; CZ = Czech Republic; IT = Italy; NO = Norway; BR = Brazil; SA = Saudi Arabia; RS = Serbia; ES = Spain. – = not analyzed; MDL = method detection limit; ND = not detected; MQL = method quantitation limit. * indicates when studies reported a concentration above the MDL but below the MQL. MDLs for the different PFAS ranged from 0.020 to 0.107 µg/kg for lettuce, 0.021 to 0.090 µg/kg for meat products, 0.197 to 0.901 µg/kg for cheese, 0.007 to 0.042 µg/kg for milk, and 0.020 to 0.090 µg/kg for bread for FDA (2018) and FDA (2020a); from 0.01 to 0.05 µg/kg for composite meat samples, 0.02 to 0.5 µg/kg for composite vegetable-based samples, 0.04 to 0.09 µg/kg for composite fish samples, and 0.02 to 0.09 µg/kg for composite dairy and egg samples Schecter et al. (2010); from 0.31 to 1.28 µg/kg for Young et al. (2013); from 0.412 to 0.947 µg/kg for Ruffle et al. (2020); were not reported for IATP (2020); from 0.003 to 0.029 µg/kg for Scher et al. (2018); from 0.5 to 6 µg/kg for Tittlemier et al. (2007); and from 0.005 to 0.613 µg/kg for Pérez et al. (2014). MQLs for the different PFAS ranged from 0.2 to 1.0 µg/kg for Ye et al. (2008a); from 0.2 to 10.0 µg/kg for Ye et al. (2008b); from 0.06 to 0.88 µg/kg for Fair et al. (2019); and from 0.002 to 0.050 µg/kg for Herzke et al. (2013). a PFOA = perfluorooctanoic acid; PFOS = perfluorooctane sulfonate; PFBA = perfluorobutanoic acid; PFPeA = perfluoropentanoic acid; PFBS = perfluorobutane sulfonate; PFHxA = perfluorohexanoic acid; PFHpA = perfluoroheptanoic acid; PFHxS = perfluorohexane sulfonate; PFNA = perfluorononanoic acid; PFDA = perfluorodecanoic acid; PFDS = perfluorodecane sulfonate; PFUdA = perfluoroundecanoic acid; PFDoA = perfluorododecanoic acid; PFTrDA = perfluorotridecanoic acid; PFTeDA = perfluorotetradecanoic acid; PFHxDA = perfluorohexadecanoic acid; PFHpS = perfluoroheptanesulfonic acid; PFPeS = perfluoropentanesulfonic acid; NaDONA = sodium dodecafluoro-3H-4, 8- dioxanonanoate; HFPO-DA = 2,3,3,3-Tetrafluoro-2-(1,1,2,2,3,3,3- heptafluoropropoxy) propanoic acid (GenX); 11Cl-PF3OUdS = 11-chloroeicosafluoro-3-oxaundecane-1- sulfonic acid; 9Cl-PF3ONs = potassium 9-chlorohexadecafluoro-3- oxanonane-1-sulfonate; 4:2 FTS = 4:2 fluorotelomer sulfonate; 6:2 FTS = 6:2 fluorotelomer sulfonate; 8:2 FTS = 8:2 fluorotelomer sulfonate; PFODA = perfluorooctadecanoic acid; PFNS = perfluorononane sulfonic acid; PFOSA = perfluorooctane sulfonamide; MeFOSAA = N-methyl Perfluorooctane sulfonamido acetic acid; EtFOSAA = N-ethyl Perfluorooctane sulfonamido acetic acid; FHEA = perfluorohexylethanoicacid; FOEA = perfluorooctylethanoic acid; FDEA = perfluorodecylethanoicacid.
Persistent Chemical Contaminants 13
Food from PFAS-contaminated Areas in the United States
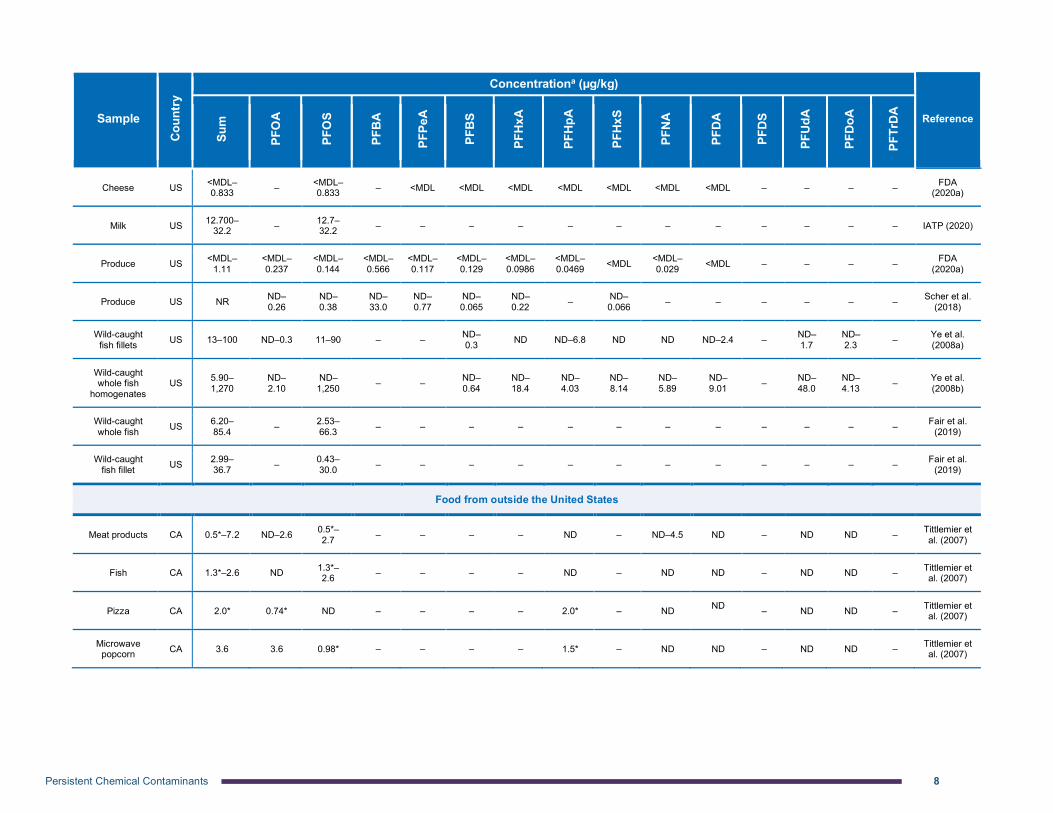
Additional studies from the United States measured the levels of PFAS in food items collected from areas with known sources of PFAS releases (Table 1). Results showed that PFAS concentrations were higher than concentrations in food purchased for retail/market basket studies. For example, milk and cheese samples collected in 2018–2020 from two dairy farms with groundwater contaminated by a nearby Air Force Base were analyzed for 16 PFAS with concentrations in Table 1 reported in µg/kg (for milk samples, µg/kg are roughly equivalent to µg/L). On Farm A, all 22 samples contained at least one of 10 PFAS (PFOA, PFOS, PFBA, perfluoroheptane sulfonic acid (PFHpS), perfluoropentanoic acid (PFPeA), PFHxA, PFHxS, PFHpA, PFBS, and perfluoropentane sulfonic acid (PFPeS)), with PFOS and PFHxS detected in all samples. Concentrations of PFOS were the highest at 0.881–5.68 µg/kg. PFHxS concentrations ranged from 0.024 to 1.94 µg/kg, while other PFAS had concentrations <0.24 µg/kg. These concentrations were “determined to be a potential human health concern and all milk from that farm was discarded…” (FDA, 2020d, 2019b). Corresponding cheese samples from Farm A showed a PFOS concentration of 0.833 µg/kg in one sample (out of two samples), whereas the single milk sample from Farm B showed PFOS and PFHxS concentrations of 0.075 and 0.043 µg/kg, respectively (FDA, 2020d). More recently, another dairy farm in Maine was found to have PFOS concentrations in milk ranging from 12.7 to 32.2 µg/kg, which is 60 to 150 times higher than Maine’s action level for determining when food is considered adulterated and removed from sale (IATP, 2020; Miller, 2020).
In a separate analysis by FDA of produce samples, 20 samples were collected in 2018 from a farm near a PFAS production plant and analyzed for 16 PFAS. Sixteen of the 20 samples showed detectable levels of PFAS, with PFOA the most frequently detected in 14 samples at concentrations of 0.013–0.237 µg/kg. Other PFAS detected were PFOS, PFBA, PFPeA, PFHxA, PFHpA, PFBS, PFNA, and hexafluoropropylene oxide dimer acid (HFPO-DA or GenX). Scher et al. (2018) collected samples in 2010 of outdoor tap water, soil, and the mature, edible portions of home-grown produce (e.g., tomato, pepper, cucumber, squash) irrigated with contaminated water. All seven PFAS tested (PFBA, PFPeA, PFHxA, PFOA, PFBS, PFHxS, and PFOS, which were all PFAAs) were detected in at least one sample of produce, with PFBA the predominant PFAS detected in 98% of samples at a median concentration of 0.675 µg/kg. These results were compared to produce grown in areas without groundwater contamination, where the median PFBA concentration was 0.068 µg/kg (Scher et al., 2018).
Several studies of wild caught fish detected PFAS in water bodies with known PFAS contamination. Ye et al. (2008a) tested for 10 PFAS (all PFAAs) and found that all 21 common carp fillets collected downstream in the Minneapolis-St.Paul area in 2006 contained PFOS at concentrations of 11–90 µg/kg. PFDA, PFUdA, and PFDoA were detected in >86 percent of samples at concentrations of 0.3–2.4 µg/kg; PFBS, PFOA, and PFHpA were also detected in 5, 10, and 24 percent of samples, respectively. In another study by Ye et al. (2008b), 60 whole fish homogenate samples from the Ohio, Missouri, and upper Mississippi Rivers were collected in 2005 and analyzed for 10 PFAS (all PFAAs). Fifty-nine samples were found to have at least one PFAS, with PFOS the most frequently detected at 82 percent of samples and an overall median concentration of 37.4 µg/kg. Overall median concentrations of PFHxS, PFDA, PFNA, and PFHxA were 0.36, 0.82, 0.30, and 3.71 µg/kg, respectively (Ye et al., 2008b). Fair et al. (2019) investigated the concentrations of 11 PFAS (all PFAAs) in 39 whole fish and 37 fillets collected in 2014 from the estuarine area in Charleston, South Carolina. Ten PFAS were detected in at least one sample for whole fish (with PFDS not detected) while nine PFAS were detected in at least one sample for fish fillets (PFHxS and PFHxA were not detected). PFOS was the predominant PFAS detected. Concentrations in whole fish were found to be 2–3 times higher than fish fillets, with total mean PFAS concentrations ranging from 12.7 to 33.0 µg/kg ww in whole fish and from 6.20 to 12.7 µg/kg ww in fish fillets (Fair et al., 2019).
Persistent Chemical Contaminants 14
Food Outside the United States
The presence of PFAS in U.S. food items is consistent with results reported in studies from other countries (Table 1). In the Canadian Total Diet Study, 54 solid food composite samples collected from 1992 to 2004 were analyzed for nine PFAS, all of which were PFAAs. The samples consisted of meat or other animal-derived food items or items that were stored in packaging treated with grease-resistant coatings. Nine samples, comprised of fish, meat, pizza, and microwave popcorn, contained at least one PFAS, ranging from 0.5 to 4.5 µg/kg. PFOS was detected the most frequently (seven samples), followed by PFOA (three samples), PFHpA (two samples), and PFNA (one sample) (Tittlemier et al., 2007). Food packaging was not separately tested but the authors indicated that the PFAS concentrations measured likely reflect both the environmental exposure and food-packaging sources (Tittlemier et al., 2007).
Herzke et al. (2013) reported concentrations of PFAS in vegetables purchased from retail stores in 2011 from Belgium, Czech Republic, Italy, and Norway, and compared their results to other European studies on PFAS in vegetables. The vegetables included samples from the categories “vegetables and vegetable products,” “starchy roots and tubers,” and “legumes, nuts and oil seeds.” The inclusion of starchy roots and tubers is important to note because accumulation of PFAS depends on chain-length, with short-chain PFAS accumulating in leafy vegetables and fruits while long-chain PFAS stay in the roots (Ghisi et al., 2019; Herzke et al., 2013).
PFOA and PFHxA were detected in vegetables from all four countries at mean concentrations of 0.0019–0.025 µg/kg and 0.0029–0.0099 µg/kg, respectively. PFOS was detected in vegetables from Belgium, Czech Republic, and Italy at mean concentrations ranging from 0.00066 to 0.0057 µg/kg, whereas PFNA, PFDA, PFDoA, and PFHxS were detected in vegetables from one or two countries with mean concentrations below 0.00027 µg/kg (Herzke et al., 2013). Herzke et al. (2013) found that their results were comparable with other European studies in Sweden, Norway, and the Netherlands, with the exception of vegetables from Spain and Belgium that had higher concentrations of PFOA (0.37–0.67 µg/kg), PFUdA (0.14 µg/kg), and PFOS (0.10–6.18 µg/kg). However, even the highest PFAS concentration reported of 6.18 µg/kg in potatoes is still within the range of concentrations reported from U.S. food items. In addition, Herzke et al. (2013) tested both fresh vegetables and processed vegetable products, such as pre-packaged lettuce mix, pre-packaged and minced frozen spinach, and pre-packaged ready-to-cook pommes frites, to determine whether industrial handling had an effect on PFAS concentrations. No effect of industrial handling was found in the study (Herzke et al., 2013).
While the limited results from the U.S. Total Diet Study, which examined various food groups, suggest that in the United States, seafood and meat may be primary contributors to PFAS among food items purchased from retail stores, other food groups may have higher PFAS concentrations depending on geography. In a study of 283 food items purchased from supermarkets and retail stores in Brazil, Saudi Arabia, Spain, and Serbia (Figure 1), PFAS concentrations were measured in the following food groups: (i) cereals, (ii) pulses and starchy roots, (iii) tree nuts, oil crops, and vegetable oils, (iv) vegetables and fruits, (v) meat and meat products, (vi) milk, animal fats, dairy products, and eggs, (vii) fish and seafood, and (viii) candies or coffee (Pérez et al., 2014). Details on the origin of the foods tested were not reported. Total PFAS concentrations were <3 µg/kg for all food groups in all countries. As seen in Figure 1, fresh fish and seafood were the primary source of PFAS in Brazil, Spain, and Serbia, with no fish samples analyzed in Saudi Arabia. Pérez et al. (2014) noted that the presence of PFOS, PFOA, PFOSA, and PFNA in fish and seafood may be due, in part, to bioaccumulation through the aquatic food chain. Meat and meat products were also an important source of PFAS in all countries.

Persistent Chemical Contaminants 15
While some food groups had negligible contributions in some countries, each food group was an important contributor to PFAS levels in at least one country. For example, vegetables and fruit showed minimal to negligible contributions in three countries but was detected at almost 0.5 µg/kg in Serbia. Similarly, tree nuts, oil crops, and vegetable oils showed total PFAS levels lower than 0.5 µg/kg in three countries, but a concentration of almost 1.5 µg/kg in Saudi Arabia. In Serbia, pulses and starchy roots had the second highest total PFAS levels, after fish, and were higher than meat and meat products. In general, PFOS, PFOA, and PFOSA were present in fish and seafood; PFOS, PFOA, PFBA, PFPeA, and PFHxA were most common in milk, dairy products, and eggs; and PFOA, PFOS, and PFBA were the most frequently detected PFAS in meat and meat products. While food packaging was not tested, Pérez et al. (2014) noted that the presence of certain PFAS may be due to migration from food packaging materials.
FIGURE 1. CONCENTRATIONS OF PFAS DETECTED IN THE DIFFERENT FOOD GROUPS FROM BRAZIL, SAUDI ARABIA, SERBIA, AND SPAIN Reproduced from (Pérez et al., 2014).

Persistent Chemical Contaminants 16
Summary of PFAS in Food Waste and Food Items
One study was identified that reported PFAS concentrations in food waste, with at least one PFAS detected in 14 out of 25 samples at concentrations of 0.11–1 µg/kg. The likelihood of PFAS present in food waste is further supported by the many studies that measured PFAS in food items. Concentrations of PFAS in food items from non-contaminated areas are generally in the 0.1 to 10 µg/kg range, with higher levels seen in food items collected from areas with known sources of PFAS. Seafood, followed by meat, may be important contributors to PFAS in food items, possibly due to bioaccumulation. For context, in the United States, meat, poultry and fish represent 12 percent of retail and consumer food waste, by weight (Buzby et al., 2014).
Market basket studies generally did not test the packaging material of the food items sampled although one study did examine the wrapping material used to package fish and shellfish and reported that none of the 26 PFAS analyzed were detected (Ruffle et al., 2020). Another study tested fresh vegetables and compared them to processed vegetable products and found no effect of industrial handling on PFAS concentrations (Herzke et al., 2013). Other food groups such as vegetables may also contribute to PFAS in food items, depending on the country and origin of the food (e.g., whether crops were grown with contaminated soil/water).
Additionally, PFAS occurrence data depend on which PFAS are analyzed in a study. Long-chain PFAS are reported to bioaccumulate in seafood, meat, and the roots of vegetables (Ghisi et al., 2019; Herzke et al., 2013; Vestergren et al., 2013; Houde et al., 2011), while short-chain PFAS are reported to accumulate in leafy vegetables and fruits (Ghisi et al., 2019; Herzke et al., 2013). Overall, food waste represents a source of PFAS for composting and anaerobic digestion facilities, although this is partly dependent on the facility. For example, some composting facilities do not accept meat, seafood, dairy products, or eggs as these items can create odor problems and attract rodents and flies (U.S. EPA, 2020e), and therefore may have lower concentrations of PFAS in their feedstock.
2.2. PFAS in Food Contact Materials PFAS are often used in food contact materials due to their resistance to grease, heat, oil, and water. As such, food contact materials are a potential source of PFAS in food waste streams through the following pathways:
(i) PFAS may migrate into the food and consequently be present in the food waste;
(ii) PFAS can be present in compostable food contact materials intended for composting included in the food waste stream; or
(iii) PFAS can be present in non-compostable food contact materials contaminating the food waste stream.
Food Contact Materials Used in the United States The presence of PFAS in food packaging has been reported in the literature, with Schaider et al. (2017) having identified 27 different PFAS in 20 samples of U.S. fast-food packaging consisting of wrappers and paperboard samples. PFOA, PFPeA, PFHxA, PFBS, and 2H-perfluoro-2-octenoic acid (FHUEA) were the most commonly detected PFAS, present in 5 or more of the 20 samples. The other 22 PFAS were detected less frequently, in 1–3 samples. Total fluorine was also measured using particle-induced γ-ray emission (PIGE) spectroscopy. Higher levels of total fluorine compared to measured PFAS indicated the presence of volatile PFAS, PFAS polymers, newer replacement PFAS, or other fluorinated compounds that were not quantified. The authors also noted that the PIGE method may not be sensitive enough to identify all samples with intentionally added PFASs (Schaider et al., 2017).

Persistent Chemical Contaminants 17
Similarly, in a report by nonprofit organizations Toxic-Free Future and Safer Chemicals, Healthy Families (Schreder and Dickman, 2018), total fluorine was quantified by PIGE and used as an indicator of likely treatment of food contact paper with PFAS. High fluorine levels—defined in the study as total fluorine counts per microcoulomb of beam6 >450 on at least one surface, and which indicate likely treatment with PFAS or other fluorinated compounds—were detected in 10 out of 78 food contact papers from five major U.S. grocery chains and their subsidiaries, with take-out containers and bakery or deli papers as the most common items in which fluorine was detected. Cook-at-home food trays (e.g., microwaveable pasta tray) and baking/cooking supplies (e.g., parchment paper) did not contain fluorine in the samples tested. A follow-up study by the Mind the Store campaign and Toxic-Free Future (Dickman et al., 2020) tested for total fluorine in 29 food packaging samples from six fast-food chains located in three states using an ion-selective electrode. Fourteen samples contained fluorine above the study-adopted threshold level of 100 ppm (equivalent to 100,000 µg/kg), with paper bags (e.g., French fry bag) and molded fiber bowls and trays (e.g., salad bowls, compartmentalized tray for kids’ meals) most frequently testing above the threshold level, which was indicative of PFAS treatment. On the other hand, all paperboard containers sampled had fluorine levels below the threshold level. These results were consistent with those reported by the Center for Environmental Health, where 138 disposable plates, bowls, clamshells, and multi-compartment food trays, representing 39 manufacturers/brands, were tested for total fluorine content using PIGE (Chiang et al., 2018). Products made from molded fiber, such as wheat fiber, blend of plant fibers, silver grass, and sugarcane waste, consistently tested as fluorinated (containing at least one surface with total fluorine counts ≥500 microcoulomb of beam), while products made from clay-coated paper/paperboard, bamboo, clear polylactic acid, paper-lined with polylactic acid, palm leaf, paper with unknown coatings, and uncoated paper consistently tested as having low to low levels of fluorine (Chiang et al., 2018).
In another study, FTOHs as well as PFCAs such as PFOA, PFBA, PFDA, PFHxA, and PFNA were measured in food contact materials made in the United States (Yuan et al., 2016). Six FTOHs (6:2, 8:2, 10:2, 12:2, and 14:2 FTOH) were found in microwave popcorn bags at median concentrations ranging from 0.12 µg/kg (14:2 FTOH) to 485 µg/kg (6:2 FTOH); 16:2 FTOH was not detected in any microwave popcorn bag sample. Of the 19 tableware samples tested (e.g., paper plates, paper bowls, and paper lunch boxes), only 6:2 FTOH was detected in 11 percent of samples. No PFCAs were detected in any of the U.S.-manufactured microwave popcorn bags or paper tableware (Yuan et al., 2016). It is important to note that the extraction methods used in Yuan et al. (2016), in which samples were extracted were methanol, can lead to hydrolysis of FTOH precursors. Dasu et al. (2010) found hydrolysis was enhanced by an order of magnitude when acetonitrile and methanol were used, compared to less polar solvents such as methyl-t-butyl ether and ethyl acetate. It should also be noted that within the United States, fluorotelomer-based polymers can contain up to 2% by dry weight (dw) of unreacted monomers, which can include FTOHs (Washington et al., 2014; U.S. EPA, 1997).
Food Contact Materials Used Outside the United States
Studies of food contact materials made in other countries showed similar findings. In Yuan et al. (2016), 57 out of 69 food contact materials made in China (categorized as paper tableware, microwave popcorn bags, cupcake cups, paper cups, paper boxes, paper bags) contained at least one FTOH, with the detection frequency ranging from 30 to 77 percent for all seven FTOHs and median concentrations ranging from below the method quantification limit (16:2 FTOH and 18:2 FTOH) to 1.23 µg/kg (8:2 FTOH). Fifteen PFCAs were detected in food contact materials from China, with PFOA the most frequently detected at 90 percent and having the highest median concentration of 1.72 µg/kg (Yuan et al., 2016). In a study of food contact materials from Thailand, PFOA and PFOS were detected in over 30 (out of 34) samples from instant food cups, fast-food and dessert containers, baking paper, beverage cups, and microwave popcorn bags. The average concentrations of PFOA and PFOS across all samples extracted by methanol were 5.9 and 10.1 µg/kg, respectively (Poothong et al., 2012). Long-chain polyfluoroalkyl phosphate diesters (diPAPs), a likely precursor of PFOA, have also been measured in food contact materials from Canada and Denmark, with levels up to 600–9,000 µg/kg (Trier et al., 2017; Trier et al.,
________________ 6 Total fluorine counts per microcoulomb of beam can be converted into nanomoles of F per area (cm2). Depending on the material type, this is then converted into µg/kg.
Persistent Chemical Contaminants 18
2011). D'eon and Mabury (2011) demonstrated that rats administered 8:2 mono or diPAPs by gavage were able to biotransform polyfluoroalkyl phosphate esters into PFOA, where PAPs are expected to first transform to their corresponding FTOH and subsequently oxidize to form PFOA (D'eon and Mabury, 2011; D'Eon and Mabury, 2007).
Compostable Food Contact Materials
Among the abovementioned studies, only Yuan et al. (2016) distinguished between compostable and non-compostable food contact materials, with no mention of compostability properties in the other studies. Paper tableware made of sugarcane and reed pulp fiber were labeled as “degradable,” “compostable,” and “eco-friendly” in Yuan et al. (2016). Of the 19 paper tableware samples manufactured in the United States, only one sample was compostable, while 17 samples were made from ivory board (a highly finished paperboard coated on both sides) and one sample was made from plastic. The concentration of 6:2 FTOH in the single compostable sample was 499 µg/kg, which was considerably higher than the concentration in samples made from ivory board or plastic (which ranged from below the method quantification limit to 2.97 µg/kg). Similar results were obtained using food contact materials made in China, with higher concentrations of FTOHs observed in compostable paper tableware as compared with polystyrene-based materials and polyethylene-coated greaseproof paper (Yuan et al., 2016).
The effect of compostable food packaging on PFAS concentrations in compost was assessed through a comparison between composts with and without compostable food packaging in Choi et al. (2019). Analysis of 10 U.S. composts showed that in general, PFAS concentrations (where all PFAS quantified were PFAAs) were higher in composts with compostable food packaging. Total PFAS loads ranged from 31 to 75 µg/kg dw in composts #1–7 (with compostable food packaging) and from 2.3 to 7.4 µg/kg dw in composts #8–10 (without compostable food packaging). A comparison of the composts made with and without compostable food packaging showed that, in general, concentrations of PFBA, PFPeA, PFBS, PFHxA, PFOA, PFNA, and PFDA were higher when compostable food packaging was present. Of the seven composts with compostable food packaging, PFHxA was the PFAS with the highest concentration, with levels ranging from 10.52 to 49.84 µg/kg dw, as compared to concentrations of 0.38–1.07 µg/kg dw in the three composts without compostable food packaging. This suggests that food packaging can be a significant source of PFAS. A direct analysis on the contribution of compostable food packaging to PFAS levels in compost was not possible because the other components of the feedstock were not identical for the composts with and without food packaging.
Recent Food Packaging Policies and Guidelines
Recent actions to decrease PFAS levels in food packaging should lead to decreased levels in compost made from food waste streams. The Biodegradable Products Institute (BPI)—North America’s leading certifier of compostable products and packaging—set a total fluorine limit of 100 ppm (equivalent to 100,000 µg/kg) and a requirement that there be no intentionally added fluorinated chemicals in order for a compostable product to be BPI-certified. Measuring total fluorine is a cost-effective method to identify food packaging that have been intentionally treated with PFAS (Supply Chains Solutions Center, 2021). The BPI certification limit came into effect on January 1, 2020; however, this limit does not apply to conventional paper products that can be accepted by composting facilities (BPI, 2020; Beecher and Brown, 2018b).
Some states are evaluating whether to eliminate or reduce the use of PFAS in all food contact materials. Safer States, a nongovernmental organization, summarized the legislative efforts as of January 2020 related to PFAS and found that 13 states (AZ, CT, IA, HI, MA, MN, NH, NY, NJ, NC, RI, VA, VT) were considering increased restrictions or bans on PFAS (Salter, 2020). Policies prohibiting the sale of food packaging containing PFAS have been adopted in Maine in 2019 (Public Law c. 277, (State of Maine, 2019)) and Washington State in 2018 (RCW 70A.222.070, (State of Washington, 2019))—which would take effect in both states as early as 2022 if safer alternatives were identified—and in New York in December 2020 (S8817, (State of New York, 2020b)), to take effect in December 2022. Individual cities have also taken action, with San Francisco becoming the first city to ban PFAS in compostable single-use food serviceware, effective as of January 1, 2020 (SFBOS, 2018). In
Persistent Chemical Contaminants 19
addition to cities and states introducing legislation to ban PFAS in food packaging, several bills have also been introduced to Congress related to PFAS in food packaging. The National Defense Authorization Act for Fiscal Year 2020 also prohibits the use of PFAS in food packaging for military meals ready-to-eat (MREs) effective October 1, 2021 (Public Law No. 116-92, (United States Congress, 2020)).
Production of some specific PFAS is also being phased out. PFOA has now been phased out of production by manufacturers in the United States; however, PFOA may continue to be detected because mono and diPAPs, which are likely precursors of PFOA, have been found in food contact materials from Canada and Denmark (Trier et al., 2017; Trier et al., 2011; D’eon and Mabury, 2007). The potential human health effects of PFAS have also driven some manufacturers to a voluntary phase-out of 6:2 FTOH in food contact materials. FDA announced that three manufacturers committed to a three-year phase-out of their sales of compounds containing 6:2 FTOH, beginning in 2021. At the end of three years, FDA estimated that an additional 18 months would be needed before 6:2 FTOH-containing materials were no longer available on the market (FDA, 2020c). The FDA announcement did not discuss whether manufacturers would replace 6:2 FTOH with another PFAS to obtain the grease-proofing properties common to food packaging.
More recent data are needed to determine the effect of the abovementioned actions on the magnitude of PFAS contamination in compost and digestate from food contact materials. With PFAS as emerging chemicals of interest, it is expected that new guidelines and standards will continue to be proposed and adopted by a variety of governments and organizations, leading to changes in usage of individual PFAS in food contact materials.
Summary of PFAS in Food Contact Materials
PFAS have been detected in food contact materials (e.g., paper plates, paper bowls, microwave popcorn bags, fast-food wrappers and paperboards) either by direct quantification or by measuring for total fluorine, where a threshold of 100 ppm (equivalent to 100,000 µg/kg) total fluorine was used to determine likely treatment with PFAS. The studies reviewed generally did not report on the compostability of these materials, although one study found that concentrations of FTOHs were higher in compostable paper plates and bowls compared with non-compostable samples from the United States and China (Yuan et al., 2016). This finding was supported by a comparison of composts made with and without compostable food packaging, where PFBA, PFPeA, PFBS, PFHxA, PFOA, PFNA, and PFDA concentrations were higher when compostable food packaging was present (Choi et al., 2019). Based on the limited data available, food packaging may be a significant source of PFAS in food waste streams. In response to concerns about PFAS, cities and states have adopted or are considering the adoption of policies prohibiting PFAS in food packaging and some manufacturers have also begun voluntary phase-out of 6:2 FTOH in food contact materials.
2.3. Comparison of PFAS Levels in Food versus Food Contact Materials
In food waste streams that contain both food and food contact materials, the primary source of PFAS depends on several factors, such as the food groups present in the feedstock, the source of the food (e.g., if the food originated from a contaminated site), and the types of food contact materials. The limited data available suggest that PFAS in U.S. food items purchased from retail stores are found primarily in seafood and meat products and generally have concentrations <10 µg/kg, with the following PFAS detected: PFOS, PFUdA, PFDA, PFHxS, PFNA, and PFDoA. These values were similar to results reported in food items from Canada and European countries.
A wide range of PFAS concentrations is reported in the literature for food contact materials, with median concentrations ranging from <1 to 485 µg/kg. Based upon the limited data available, fluorotelomer alcohols are the primary PFAS found in food contact materials made in the United States (Yuan et al., 2016) with the exception of PFOA in microwave popcorn bags detected at concentrations of 6–290 µg/kg (Begley et al., 2005). In Yuan et
Persistent Chemical Contaminants 20
al. (2016), the single compostable sample (before composting)—paper tableware made from sugarcane and reed pulp fiber—had a 6:2 FTOH concentration of 499 µg/kg.
These limited data suggest that in food waste streams containing both food waste and food contact materials, the latter may potentially contribute more to the overall PFAS levels on a per weight basis. This may be particularly applicable in locations where composting facilities do not accept food items that have been shown to contain PFAS (e.g., seafood, meat) due to odor problems and issues with rodents and flies (U.S. EPA, 2020e). However, with new guidelines, standards, and policies being adopted or introduced to ban PFAS in food packaging, PFAS content in food contact materials will likely decrease.
2.4. PFAS in Compost Composts made from food waste contain other materials such as yard waste, bedding, manure, wood chips, or sawdust to achieve an optimal moisture content and carbon-to-nitrogen ratio, and to improve porosity (Risse and Faucette, 2017). To determine the effect of food waste streams on PFAS levels in compost, comparisons need to be drawn between composts made with and without food waste streams. If possible, comparisons should also be made between food waste streams that contain and do not contain compostable food contact materials. Note that the composting process results in contact water—water that comes into contact with the compost pile—which may also contain PFAS. This is further discussed in Section 2.7.
Composts from Food Waste in the United States
Choi et al. (2019) investigated 10 U.S. municipal organic solid waste composts from Washington, Oregon, California, Massachusetts, and North Carolina that differed in feedstock, composting technique, and whether compostable food packaging was accepted—eight of these composts were made from feedstocks containing food waste (sample IDs 1–7 and 9 in Table 2). Table 2 presents the mean concentration of 17 PFAS, which were all PFAAs, in these composts as well as the feedstock used for each compost; the percentage of each component (e.g., municipal food waste, yard waste) in the feedstock was not provided (Choi et al., 2019).
The sum of the 17 PFAS (∑17 PFAS) mean concentrations from the 10 municipal organic solid waste composts (Choi et al., 2019) ranged from 2.3 to 75 µg/kg dw. PFOA and PFOS were detected in all composts, even though these PFAS have been phased out in the United States. PFBA, PFPeA, PFHxA, PFHxS, and PFDS were detected in all 10 samples. PFUdA and perfluorohexadecanoic acid (PFHxDA) were not detected in any sample, and PFHpA and perfluorooctadecanoic acid (PFODA) were detected in only one sample. While only 17 PFAS were quantified, other PFAS and/or precursors may be present. Using nontarget screening, Choi et al. (2019) found that PFAA precursors were present in three composts.
Table 2 shows that the compost produced from a backyard compost bin containing food waste, yard trimmings, and unbleached coffee filters (see sample ID #9 in Table 2) had higher levels of PFAS relative to composts (#8 and #10) made from just green waste7 (leaves and grass from municipalities). Total PFAS loads were 7.4 µg/kg dw in the backyard waste compost, whereas the green waste compost had a maximum of 3.7 µg/kg dw. The limited data suggest that food waste compost may contain higher levels of PFAS than green waste compost. PFOA, PFOS, PFBA, PFPeA, PFHxA, PFDA, and PFDoA were all higher in the backyard waste compost compared with the green waste compost. However, given that the green waste composts were produced at commercial facilities while the backyard compost was produced at a residence, the extent of decomposition may have been different, which can affect concentration. Note that while the Table 2 results of Choi et al. (2019) measured PFAS concentrations in the <2 mm fraction of dry material (i.e., samples were sieved to obtain homogenous samples and analysis was conducted on the <2 mm fraction), the >2 mm fraction was also analyzed for a subset of compost samples (#1–5 and 7) and similar results were obtained.
Choi et al. (2019) reported data for composts made from residential and commercial food waste (Table 2); ________________ 7 Green waste is defined in this issue paper to include municipal/residential leaves, grass, plants, or yard trimmings and is synonymous with yard waste.

Persistent Chemical Contaminants 21
however, it was not possible to determine which type of food waste would have higher concentrations of PFAS. The feedstocks used for these composts (compost #7 for commercial; composts #1, #3, #4, #5, and #6 for a mixture of residential and commercial) all contained other waste streams and the composition of the feedstock was not specified (i.e., it was not known what percentage of the feedstocks were from food waste versus the percentage from horse manure, wood shavings, and/or yard waste).
Data were not available to determine whether there are specific categories of food waste that are the major contributors to PFAS concentrations in compost. Studies that measured PFAS levels in food and yard waste composts did not specify the food groups present or their percentage in the feedstock. While seafood and meat were found to be primary contributors of PFAS in food items, not all composting facilities accept these items because they can create odor problems and attract rodents and flies (U.S. EPA, 2020e). Dairy products (e.g., butter, milk, sour cream, yogurt) and eggs may not be composted for the same reason. It is unknown whether facilities in the abovementioned studies accepted these food types.
Composts from Food Waste Outside the United States
The results of Choi et al. (2019) are similar to those reported in a study by Brandli et al. (2007a) on Swiss composts (Table 2). While the Brandli et al. (2007a) main article only reported total concentrations of all measured PFAS in composts and digestates combined (with a range of 3.4–35 µg/kg dw, and a median of 6.3 µg/kg dw), data for each individual compost and digestate were available in the study’s supporting information. An analysis of the supporting information provided the sum of 12 PFAS mean concentrations to be 8.6 µg/kg dw for green waste composts and 16.3 µg/kg dw for composts made from a mixture of green waste and kitchen waste.8 Higher mean concentrations in the mixture of green waste and kitchen waste compost were also observed for each individual PFAS, with the exception of PFOSA, as shown in Table 2. In both the green waste compost and the mixture of green waste and kitchen waste compost, PFOS was the primary contributor, accounting for 35 and 48 percent, respectively, of the total PFAS. The results from this study suggest that kitchen waste compost has higher concentrations of PFAS than green waste compost, which is consistent with the results of Choi et al. (2019).
Composts from Other Feedstocks in the United States In a study by Lazcano et al. (2019), PFAS concentrations were measured in the <2 mm fraction of dry material from compost produced from Class B biosolids from wastewater treatment plants (WWTPs) in the United States and Canada (Table 2). The measurement of the <2 mm fraction of dry material allowed the results of Lazcano et al. (2019) to be compared with those of Choi et al. (2019); both studies also originated from the same research group. For comparison purposes, Lazcano et al. (2019) reported concentrations of 13 PFAS, which were all PFAAs, in composts made from biosolids, whereas Choi et al. (2019) reported concentrations of 17 PFAS in composts made from food and yard waste. Of the four additional PFAS in Choi et al. (2019), only PFPeA was detected in all 10 composts with mean concentrations of 0.4–8.6 µg/kg dw. A comparison of the two studies showed that overall PFAS levels were higher in compost made from biosolids (69–123 µg/kg dw) than in compost made from a mixture of food waste and yard waste (2.3–75 µg/kg dw). However, this trend does not necessarily hold when individual PFAS are examined. For example, mean PFOS concentrations were higher in biosolids compost (approximately 11 µg/kg dw) than in the food and yard waste composts (maximum of 1.7 µg/kg dw), but PFBA concentrations were similar in both types of compost.
A follow-up study by Lazcano et al. (2020) quantified the same 17 PFAS examined in Choi et al. (2019) and Lazcano et al. (2019) in U.S. commercially available biosolid-based products (i.e., heat-treated granular biosolids and composted and/or blended biosolids); organic composts (i.e., made from manure, mushroom, peat, and untreated wood); and one food and yard waste compost (Table 2). Biosolid-based products had the highest
________________ 8 Several studies cited in this issue paper use the term “kitchen waste” rather than “food waste.” The term “kitchen waste” was not defined in the studies. When describing studies and their results, we will use the same term as the study authors did. However, in our analysis of the data, we will treat the two data categories as synonymous and use the term “food waste” to capture both categories.

Persistent Chemical Contaminants 22
concentration of PFAS (9.0–199 µg/kg dw), followed by compost made from food waste and yard waste (18.5 µg/kg dw) and composts made from other organic materials (0.1–1.1 µg/kg dw). In the food and yard waste compost, PFHxA was the primary contributor at 8.4 µg/kg dw, followed by PFOA and PFDA at 4.1 and 1.7 µg/kg dw, respectively. Similar to Choi et al. (2019), nontarget screening also identified PFAA precursors such as sulfonamides, fluorotelomer sulfonates, and/or diPAPs in Lazcano et al. (2019).
Summary of PFAS in Composts
When results from Choi et al. (2019), Lazcano et al. (2019), and Lazcano et al. (2020) are taken together, the products organized in decreasing order of PFAS concentrations are: biosolids-based products (i.e., treated biosolids, composted biosolids) > food waste compost > yard waste compost ≈ other organic composts. The Brandli et al. (2007a) results suggested that PFAS concentrations in kitchen waste compost were higher than green waste compost, supporting the combined conclusions based on Choi et al. (2019), Lazcano et al. (2019), and Lazcano et al. (2020). These data suggest that food waste streams may be a primary contributor of PFAS in composts produced in part from food waste streams.
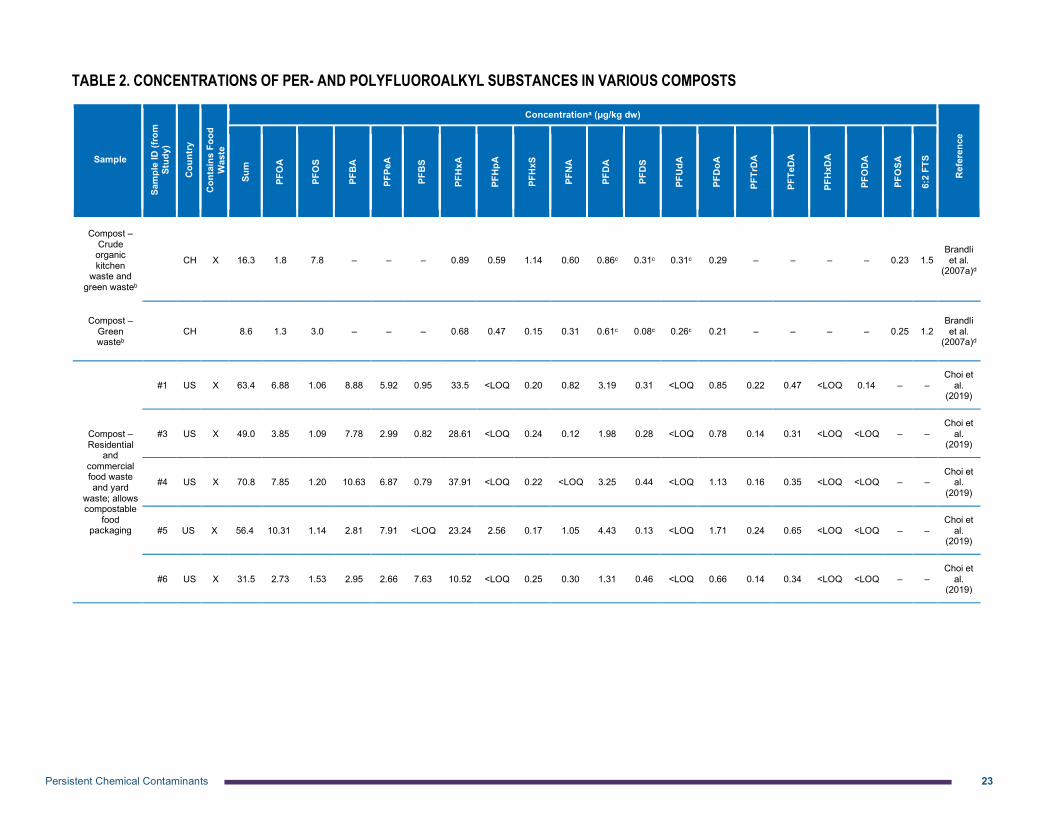
Persistent Chemical Contaminants 23
TABLE 2. CONCENTRATIONS OF PER- AND POLYFLUOROALKYL SUBSTANCES IN VARIOUS COMPOSTS
Sample Sa
mpl
e ID
(fro
m
Stud
y)
Cou
ntry
Con
tain
s Fo
od
Was
te
Concentrationa (µg/kg dw)
Ref
eren
ce
Sum
PFO
A
PFO
S
PFB
A
PFPe
A
PFB
S
PFH
xA
PFH
pA
PFH
xS
PFN
A
PFD
A
PFD
S
PFU
dA
PFD
oA
PFTr
DA
PFTe
DA
PFH
xDA
PFO
DA
PFO
SA
6:2
FTS
Compost – Crude organic kitchen
waste and green wasteb
CH X 16.3 1.8 7.8 – – – 0.89 0.59 1.14 0.60 0.86c 0.31c 0.31c 0.29 – – – – 0.23 1.5 Brandli et al.
(2007a)d
Compost – Green wasteb
CH 8.6 1.3 3.0 – – – 0.68 0.47 0.15 0.31 0.61c 0.08c 0.26c 0.21 – – – – 0.25 1.2 Brandli et al.
(2007a)d
Compost – Residential
and commercial food waste and yard
waste; allows compostable
food packaging
#1 US X 63.4 6.88 1.06 8.88 5.92 0.95 33.5 <LOQ 0.20 0.82 3.19 0.31 <LOQ 0.85 0.22 0.47 <LOQ 0.14 – – Choi et
al. (2019)
#3 US X 49.0 3.85 1.09 7.78 2.99 0.82 28.61 <LOQ 0.24 0.12 1.98 0.28 <LOQ 0.78 0.14 0.31 <LOQ <LOQ – – Choi et
al. (2019)
#4 US X 70.8 7.85 1.20 10.63 6.87 0.79 37.91 <LOQ 0.22 <LOQ 3.25 0.44 <LOQ 1.13 0.16 0.35 <LOQ <LOQ – – Choi et
al. (2019)
#5 US X 56.4 10.31 1.14 2.81 7.91 <LOQ 23.24 2.56 0.17 1.05 4.43 0.13 <LOQ 1.71 0.24 0.65 <LOQ <LOQ – – Choi et
al. (2019)
#6 US X 31.5 2.73 1.53 2.95 2.66 7.63 10.52 <LOQ 0.25 0.30 1.31 0.46 <LOQ 0.66 0.14 0.34 <LOQ <LOQ – – Choi et
al. (2019)

Persistent Chemical Contaminants 24
Sample
Sam
ple
ID (f
rom
St
udy)
Cou
ntry
Con
tain
s Fo
od
Was
te
Concentrationa (µg/kg dw)
Ref
eren
ce
Sum
PFO
A
PFO
S
PFB
A
PFPe
A
PFB
S
PFH
xA
PFH
pA
PFH
xS
PFN
A
PFD
A
PFD
S
PFU
dA
PFD
oA
PFTr
DA
PFTe
DA
PFH
xDA
PFO
DA
PFO
SA
6:2
FTS
Compost – Primarily
commercial food waste
(food scraps, coffee
grounds, lobster
shells), horse manure, and
wood shavings;
allows compostable
food packaging
#7 US X 74.9 3.64 0.35 12.04 6.83 <LOQ 49.84 <LOQ 0.08 <LOQ 1.24 0.12 <LOQ 0.50 0.08 0.17 <LOQ <LOQ – – Choi et
al. (2019)
Compost – Municipal food and
yard waste and wood products;
allows compostable
food packaging
#2 US X 37.4 2.54 1.23 3.51 8.59 1.23 17.65 <LOQ 0.25 <LOQ 1.07 0.49 <LOQ 0.46 0.12 0.24 <LOQ <LOQ – – Choi et
al. (2019)
Compost – Backyard
waste compost bin; includes yard
trimmings, food waste,
and unbleached coffee filters;
no compostable serviceware
or other paper
products
#9 US X 7.43 1.05 1.69 0.64 1.43 <LOQ 1.07 <LOQ 0.18 <LOQ 0.65 0.38 <LOQ 0.30 <LOQ 0.04 <LOQ <LOQ – – Choi et
al. (2019)

Persistent Chemical Contaminants 25
Sample
Sam
ple
ID (f
rom
St
udy)
Cou
ntry
Con
tain
s Fo
od
Was
te
Concentrationa (µg/kg dw)
Ref
eren
ce
Sum
PFO
A
PFO
S
PFB
A
PFPe
A
PFB
S
PFH
xA
PFH
pA
PFH
xS
PFN
A
PFD
A
PFD
S
PFU
dA
PFD
oA
PFTr
DA
PFTe
DA
PFH
xDA
PFO
DA
PFO
SA
6:2
FTS
Compost – Green waste, leaves and grass from
municipalities
#8 US 3.71 0.48 1.2 0.21 0.41 <LOQ 0.38 <LOQ 0.07 <LOQ 0.38 0.38 <LOQ 0.16 0.04 <LOQ <LOQ <LOQ – – Choi et
al. (2019)
Compost – Green waste,
primarily leaves from
municipalities
#10 US 2.28 0.04 0.47 0.15 0.80 <LOQ 0.38 <LOQ 0.19 <LOQ <LOQ 0.25 <LOQ <LOQ <LOQ <LOQ <LOQ <LOQ – – Choi et
al. (2019)
Compost – Biosolids from wastewater treatment
plants (Class B biosolids from
2018)
US 31.0 0.9 8.5 0.2 – 5.6 0.4 – 0.1 <LOQ 4.2 2.2 1.4 3.3 1.2 3.0 – – – – Lazcano
et al. (2019)
Compost – Biosolids
from wastewater treatment
plants (post-2016
biosolids)
US 68.9 16.4 11.0 2.8 – 5.2 11.0 – 0.4 1.9 12.2 0.8 1.9 3.7 0.7 0.9 – – – – Lazcano
et al. (2019)
Compost – Biosolids
from wastewater treatment
plants (post-2018
biosolids)
US 123.3 16.1 10.5 5.1 – 29.0 38.8 – 0.5 2.6 9.6 0.6 4.3 3.1 2.4 0.7 – – – – Lazcano
et al. (2019)
Compost – Biosolids
from wastewater treatment
plants (post-2016
biosolids, >2 mm)
US 34.9 7.9 4.5 2.1 – 4.5 8.4 – 0.2 0.2 4.5 0.4 0.7 1.2 0.1 0.2 – – – – Lazcano
et al. (2019)

Persistent Chemical Contaminants 26
Sample
Sam
ple
ID (f
rom
St
udy)
Cou
ntry
Con
tain
s Fo
od
Was
te
Concentrationa (µg/kg dw)
Ref
eren
ce
Sum
PFO
A
PFO
S
PFB
A
PFPe
A
PFB
S
PFH
xA
PFH
pA
PFH
xS
PFN
A
PFD
A
PFD
S
PFU
dA
PFD
oA
PFTr
DA
PFTe
DA
PFH
xDA
PFO
DA
PFO
SA
6:2
FTS
Compost – Food and
yard waste A US X 18.6 4.1 <LOQ 0.8 – <LOQ 8.4 2.3 <LOQ <LOQ 1.7 <LOQ <LOQ 0.9 <LOQ 0.4 <LOQ <LOQ – –
Lazcano et al.
(2020)
Compost – Tree and
grass clippings and
discarded Christmas
trees
B US 1.3 0.5 0.2 0.6 – <LOQ <LOQ <LOQ <LOQ <LOQ <LOQ <LOQ <LOQ <LOQ <LOQ <LOQ <LOQ <LOQ – – Lazcano
et al. (2020)
Compost – Manure C US 0.6 <LOQ 0.6 <LOQ – <LOQ <LOQ <LOQ <LOQ <LOQ <LOQ <LOQ <LOQ <LOQ <LOQ <LOQ <LOQ <LOQ – –
Lazcano et al.
(2020)
Compost – Manure and
peat D US 1.2 <LOQ 1.2 <LOQ – <LOQ <LOQ <LOQ <LOQ <LOQ <LOQ <LOQ <LOQ <LOQ <LOQ <LOQ <LOQ <LOQ – –
Lazcano et al.
(2020)
Compost – Mushroom
E US 0.1 <LOQ <LOQ 0.1 – <LOQ <LOQ <LOQ <LOQ <LOQ <LOQ <LOQ <LOQ <LOQ <LOQ <LOQ <LOQ <LOQ – – Lazcano
et al. (2020)
F US 8.1 <LOQ 8.1 <LOQ – <LOQ <LOQ <LOQ <LOQ <LOQ <LOQ <LOQ <LOQ <LOQ <LOQ <LOQ <LOQ <LOQ – – Lazcano
et al. (2020)
Natural fertilizer – Canadian sphagnum peat moss,
perlite, limestone,
gypsum, soy-based
G US 2.65 0.5 1.6 <LOQ – <LOQ <LOQ <LOQ <LOQ <LOQ <LOQ <LOQ 0.15 <LOQ 0.4 <LOQ <LOQ <LOQ – – Lazcano
et al. (2020)
Biosolids – Heat-treated
granular biosolids
H US 33.4 1.9 13.4 0.6 – 1.1 2.3 <LOQ <LOQ 3.9 1.4 3.2 2.1 1.9 <LOQ 1.6 <LOQ <LOQ – – Lazcano
et al. (2020)

Persistent Chemical Contaminants 27
Sample
Sam
ple
ID (f
rom
St
udy)
Cou
ntry
Con
tain
s Fo
od
Was
te
Concentrationa (µg/kg dw)
Ref
eren
ce
Sum
PFO
A
PFO
S
PFB
A
PFPe
A
PFB
S
PFH
xA
PFH
pA
PFH
xS
PFN
A
PFD
A
PFD
S
PFU
dA
PFD
oA
PFTr
DA
PFTe
DA
PFH
xDA
PFO
DA
PFO
SA
6:2
FTS
Biosolids – Heat-treated
granular biosolids
(continued)
I US 61.3 6.9 15.4 0.6 – 3.0 3.5 <LOQ <LOQ 0.8 14.9 0.6 2.9 7.7 1.0 2.4 1.6 <LOQ – – Lazcano
et al. (2020)
J–2014 US 180.5 6.1 88.5 3.3 – 0.4 61.0 <LOQ 0.42 2.3 5.5 1.8 3.5 4.1 1.2 1.3 1.1 <LOQ – –
Lazcano et al.
(2020)
J–2016 US 101.4 2.7 29.7 2.8 – <LOQ 53.10 3.75 <LOQ <LOQ 2.9 <LOQ 4.1 1.7 <LOQ 0.6 <LOQ <LOQ – –
Lazcano et al.
(2020)
J–2018 US 75.0 2.72 18.7 2.5 – <LOQ 41.63 3.02 <LOQ <LOQ 2.6 <LOQ 2.4 1.42 <LOQ <LOQ <LOQ <LOQ – –
Lazcano et al.
(2020)
K US 41.7 3.3 10.3 0.9 – 2.6 3.3 <LOQ <LOQ 3.3 5.5 2.3 4.3 3.7 0.7 1.5 <LOQ <LOQ – – Lazcano
et al. (2020)
L US 9.1 1.4 2.6 0.7 – 0.5 0.5 <LOQ <LOQ <LOQ 1.7 <LOQ 0.6 1.1 <LOQ <LOQ <LOQ <LOQ – – Lazcano
et al. (2020)
Biosolids – Blended with
maple sawdust and aged bark
M US 39.5 11.4 3.0 1.1 – 4.4 8.3 0.4 <LOQ 2.8 4.9 0.67 1.3 1.1 0.1 <LOQ <LOQ <LOQ – – Lazcano
et al. (2020)
Compost – Biosolids
with woodchips
N US 198.7 26.0 37.5 6.5 – 41.9 33.0 6.5 1.90 6.1 20.5 1.87 5.6 7.3 1.7 1.6 0.7 <LOQ – – Lazcano
et al. (2020)
O US 115.2 19.1 10.4 3.4 – 19.7 17.3 5.3 0.45 8.1 11.7 2.8 8.0 4.6 2.3 1.2 0.8 <LOQ – – Lazcano
et al. (2020)
Compost – Biosolids
with municipal
solid waste
P US 33.7 8.6 3.5 3.2 – 3.8 6.4 <LOQ 0.82 0.7 2.2 0.6 1.0 1.0 0.6 0.7 0.6 <LOQ – – Lazcano
et al. (2020)
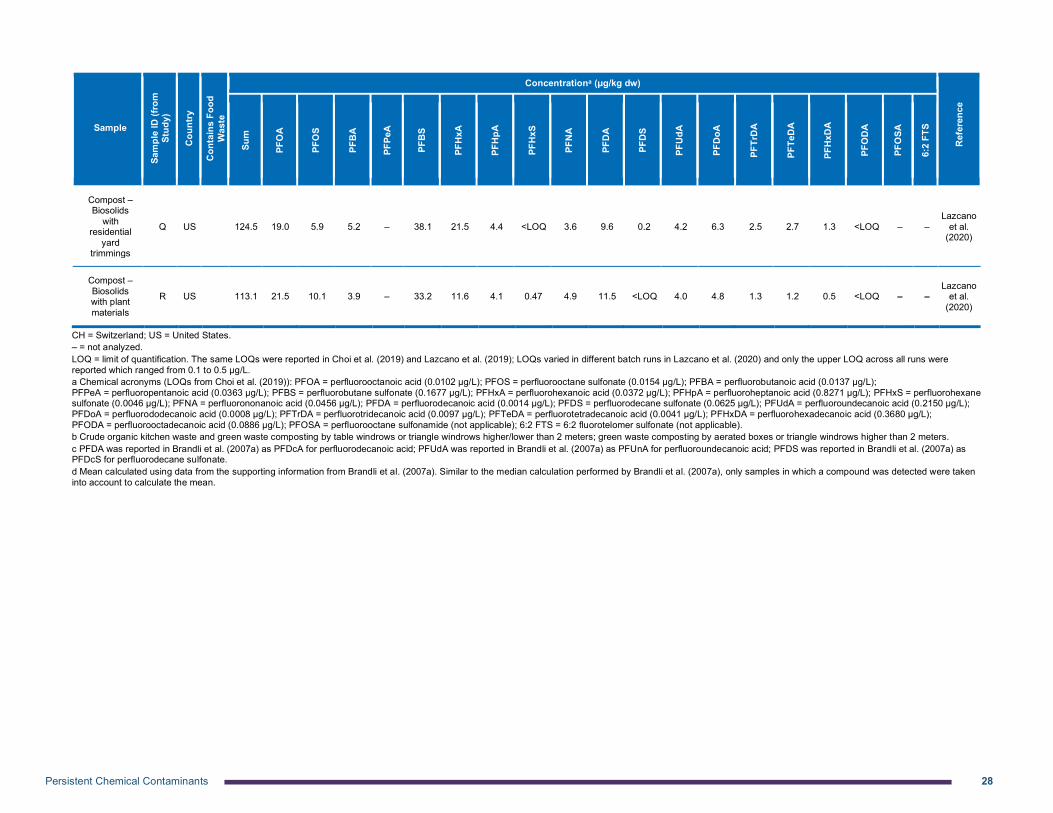
Persistent Chemical Contaminants 28
Sample
Sam
ple
ID (f
rom
St
udy)
Cou
ntry
Con
tain
s Fo
od
Was
te
Concentrationa (µg/kg dw)
Ref
eren
ce
Sum
PFO
A
PFO
S
PFB
A
PFPe
A
PFB
S
PFH
xA
PFH
pA
PFH
xS
PFN
A
PFD
A
PFD
S
PFU
dA
PFD
oA
PFTr
DA
PFTe
DA
PFH
xDA
PFO
DA
PFO
SA
6:2
FTS
Compost – Biosolids
with residential
yard trimmings
Q US 124.5 19.0 5.9 5.2 – 38.1 21.5 4.4 <LOQ 3.6 9.6 0.2 4.2 6.3 2.5 2.7 1.3 <LOQ – – Lazcano
et al. (2020)
Compost – Biosolids with plant materials
R US 113.1 21.5 10.1 3.9 – 33.2 11.6 4.1 0.47 4.9 11.5 <LOQ 4.0 4.8 1.3 1.2 0.5 <LOQ – – Lazcano
et al. (2020)
CH = Switzerland; US = United States. – = not analyzed. LOQ = limit of quantification. The same LOQs were reported in Choi et al. (2019) and Lazcano et al. (2019); LOQs varied in different batch runs in Lazcano et al. (2020) and only the upper LOQ across all runs were reported which ranged from 0.1 to 0.5 µg/L. a Chemical acronyms (LOQs from Choi et al. (2019)): PFOA = perfluorooctanoic acid (0.0102 µg/L); PFOS = perfluorooctane sulfonate (0.0154 µg/L); PFBA = perfluorobutanoic acid (0.0137 µg/L); PFPeA = perfluoropentanoic acid (0.0363 µg/L); PFBS = perfluorobutane sulfonate (0.1677 µg/L); PFHxA = perfluorohexanoic acid (0.0372 µg/L); PFHpA = perfluoroheptanoic acid (0.8271 µg/L); PFHxS = perfluorohexane sulfonate (0.0046 µg/L); PFNA = perfluorononanoic acid (0.0456 µg/L); PFDA = perfluorodecanoic acid (0.0014 µg/L); PFDS = perfluorodecane sulfonate (0.0625 µg/L); PFUdA = perfluoroundecanoic acid (0.2150 µg/L); PFDoA = perfluorododecanoic acid (0.0008 µg/L); PFTrDA = perfluorotridecanoic acid (0.0097 µg/L); PFTeDA = perfluorotetradecanoic acid (0.0041 µg/L); PFHxDA = perfluorohexadecanoic acid (0.3680 µg/L); PFODA = perfluorooctadecanoic acid (0.0886 µg/L); PFOSA = perfluorooctane sulfonamide (not applicable); 6:2 FTS = 6:2 fluorotelomer sulfonate (not applicable). b Crude organic kitchen waste and green waste composting by table windrows or triangle windrows higher/lower than 2 meters; green waste composting by aerated boxes or triangle windrows higher than 2 meters. c PFDA was reported in Brandli et al. (2007a) as PFDcA for perfluorodecanoic acid; PFUdA was reported in Brandli et al. (2007a) as PFUnA for perfluoroundecanoic acid; PFDS was reported in Brandli et al. (2007a) as PFDcS for perfluorodecane sulfonate. d Mean calculated using data from the supporting information from Brandli et al. (2007a). Similar to the median calculation performed by Brandli et al. (2007a), only samples in which a compound was detected were taken into account to calculate the mean.

Persistent Chemical Contaminants 29
2.5. PFAS in Digestate A 2019 survey of U.S. anaerobic digestion facilities that accepted food waste indicated that there were three types of facilities: (i) stand-alone food waste digesters, designed to process food waste although they can also process other organic materials, (ii) on-farm digesters that co-digest food waste with manure, and (iii) digesters at WWTPs that co-digest food waste with biosolids. There were 45 confirmed stand-alone digesters, reported to have processed 8.2 million tons of food waste across 22 states in 2018 (U.S. EPA, 2021b; Goldstein, 2018). Despite the existence of operational stand-alone food waste digesters, no studies were identified that measured PFAS levels in anaerobic digestates produced from 100 percent food waste. While Brandli et al. (2007a) reported PFAS concentration in digestates, the data available in the supporting information were for digestates produced from mixtures of (i) green waste with kitchen waste, and (ii) green waste, kitchen waste, and industrial waste. There were no digestates produced from green waste alone and therefore no comparisons could be made to evaluate whether food waste digestates would have higher, similar, or lower PFAS concentrations compared with digestates produced from other feedstocks. Other studies in the literature also reported PFAS concentrations in digestates, but the feedstocks used did not allow for any conclusions regarding digestates made from food waste (Suominen et al., 2014; Tavazzi et al., 2013).
Summarizing studies conducted between 2008 and 2011 by the Waste and Resources Action Programme (WRAP), a UK-based nonprofit organization, Longhurst et al. (2019) noted that PFOS and PFOS derivatives were not detected in any of the digestate samples made from food waste.
2.6. Effects of Composting or Anaerobic Digestion on PFAS Concentrations
This section examines available empirical data for PFAS in feedstocks and their corresponding compost or anaerobic digestates to determine whether these processes lead to an increase or decrease in concentration. Contaminant concentrations in compost and digestate differ from concentrations in the feedstock because of the physical, biological, and chemical transformations that occur during the composting and anaerobic digestion processes. In (aerobic) composting, organic biological matter is converted into humic substances in the presence of oxygen, while in anaerobic digestion, organic matter is broken down in an oxygen-free environment to produce renewable energy (i.e., biogas and biofuel) and digestate. Composting can also occur under anaerobic conditions in the absence of oxygen, referred to as anaerobic composting, or in alternating cycles of aerobic and anaerobic periods. For both composting and anaerobic digestion, persistent chemical contaminants are resistant to these decomposition processes to varying degrees. Examples of other transformation factors affecting final concentrations include increased or decreased density (e.g., due to loss of moisture or material addition), which can lead to concentration or dilution of the contaminants and influence their partitioning to liquid effluent. The exact transformation processes that occur (e.g., anaerobic transformations, volatilization) are outside the scope of this issue paper and are not discussed here.
The net effects of the physical, biological, and chemical transformations during composting and anaerobic digestion on persistent chemical concentrations are likely to vary among chemicals to some extent due to their different chemical properties (e.g., PFHxA may be different from PFOS) and if they are products of other contaminants, thus depending on degradation rate, etc. They also may vary among individual treatment systems due to differences in design and operation. Because it is difficult to generalize how these processes affect persistent chemical concentrations, this section summarizes the limited available empirical data for PFAS in feedstocks and their corresponding compost or digestate. It is assumed that the effect of composting and anaerobic digestion is independent of the feedstock (i.e., if PFOA concentrations decrease between green waste and green waste compost, it is assumed a similar decrease would be observed between sewage sludge and sewage sludge compost), but this has not been demonstrated. It should be noted that laboratory composting and anaerobic digestion studies are available in the literature; however, this section focuses only on empirical field data.

Persistent Chemical Contaminants 30
Composts
Testing for 24 PFAS was conducted on dewatered wastewater solids and their corresponding biosolids compost from four WWTPs that were known to have minimal contributions from industrial waste. The four WWTPs each had a different treatment process: (i) primary treatment producing primary solids only, (ii) conventional secondary treatment with nutrient removal, producing a mixture of primary and waste activated solids, (iii) conventional secondary treatment with nutrient removal, producing waste activated solids only, and (iv) conventional secondary treatment, producing a mixture of primary and waste activated solids, which was then processed through mesophilic anaerobic digestion (Williams, 2021). Total PFAS levels in the biosolids ranged from approximately 20 to 66 µg/kg dw, while total PFAS levels in the resulting compost ranged from approximately 60 to 245 µg/kg dw. PFOS was the primary compound detected, accounting for 30% to 75% of total PFAS levels. When comparing total PFAS levels between the biosolids feedstock and the resulting compost, one WWTP showed a decrease in PFAS concentrations—likely due to dilution from the bulking agents added—while three WWTPs showed an increase in PFAS concentrations resulting from precursor biotransformation. When examining only PFOS, two WWTPs showed an increase in PFOS concentrations after composting while two WWTPs showed a decrease. Biotransformation of precursor compounds through composting occurred more readily in some solids. Specifically, primary sludge that had not been treated aerobically appeared more susceptible to precursor transformation, with PFBS, PFHxA, PFOA, and PFOS concentrations increased after composting. Aerobically processed solids and anaerobically digested solids appeared less susceptible to precursor transformation during composting (Williams, 2021).
Lazcano et al. (2019) also reported mean PFAS concentrations in biosolids from WWTPs and in composts made from WWTP biosolids. However, the biosolids, which were representative of PFAS concentrations before composting, were sampled from only one WWTP in 2018 whereas the compost came from four WWTPs sampled in 2016 and 2018. As such, the higher PFAS levels in the compost are not necessarily due to the composting process (e.g., through mass reduction or through the breakdown of perfluoroalkyl acid precursors into perfluoroalkyl acids, which are part of PFAS) and may be a result of higher PFAS levels in the biosolids from the other three WWTPs.
Digestates
In a study of five PFAS (PFOS, PFHxS, PFBS, PFOA, and PFNA, which are all PFAAs) in sewage sludge from three WWTPs, PFAS concentrations in the primary sludge (feedstock) were found to be greater, similar, or lower compared with the anaerobic digested sludge, depending on various factors including hydraulic residence time and digestion duration (Gomez-Canela et al., 2012). PFBS was found to be lower in the digestate than in the feedstock, but PFOS and PFNA were higher in the digestate. The authors hypothesized that the increase in these two PFAS was due to the degradation of precursors present in the sewage sludge, leading to generation of PFOS and PFNA (Gomez-Canela et al., 2012). While there were no studies available that compared concentrations of PFAS in food waste and food waste digestate, it should be noted that three of the five PFAS studied by Gomez-Canela et al. (2012) (PFOS, PFHxS, and PFNA) were also detected in retail seafood purchased in the United States (FDA, 2020d; Young et al., 2013) so may exhibit similar behavior.

Persistent Chemical Contaminants 31
Summary of Composting and Anaerobic Digestion Effects on PFAS Concentrations
The limited available data show that the composting process can result in an increase or decrease of some PFAS, possibly due to precursor biotransformation. Biosolids that were aerobically processed or anaerobically digested had a lower degree of precursor transformation while primary sludge that had not been treated aerobically appeared more susceptible to precursor transformation. More data is needed to assess the extent of and conditions favorable for precursor transformation. For anaerobic digestion, some PFAS showed higher concentrations in the digestate compared to the feedstock, possibly due to the breakdown of precursors. Given the possibility of specific PFAS forming from precursors during these processes, composts and digestates should be tested even if the feedstocks show low concentrations of PFAS.
2.7. Safety Thresholds and Standards for PFAS in Composting and Anaerobic Digestion
There are currently no federal regulations on PFAS in compost or digestate. In addition to regulating the use of PFAS in food contact materials (discussed in Section 2.2), some U.S. states are regulating PFAS levels in contact water from composting facilities and in biosolids intended for land application (with or without composting).
Contact Water at Composting Sites
Composters in Minnesota that accept food waste are required to collect and treat contact water, defined in Minnesota as water that comes into contact with tipping and mixing areas, and active or early stage composting activities (MPCA, 2020, 2019). Contact water from seven Minnesota composting sites (i.e., five facilities that accepted organic materials including food waste and two facilities that accepted only yard waste) were shown to contain detectable levels of PFBA, PFPeA, PFHxA, PFHpA, PFOA, PFNA, PFDA, PFBS, PFHxS, and PFOS (MPCA, 2020, 2019). PFAS were more frequently detected in contact water from composting sites that accepted food waste, compared with yard waste composting sites. Using the individual PFAS data reported by the MPCA (2019), Coker (2020b) estimated that the PFAS concentrations in contact water ranged from 0.060 to 3.4 µg/L, with the lower end very close to EPA’s health advisory level of 0.070 µg/L for drinking water. Results showed at least one sampling event per site with one or more PFAS at concentrations greater than their health risk limit or health-based value as defined by the Minnesota Department of Health (MPCA, 2020, 2019).
Biosolids
Some U.S. states have begun setting limits for PFAS in biosolids intended for land application and in composting feedstocks. Maine now requires that land-applied products derived from WWTP biosolids (e.g., Class B biosolids, biosolids compost, pelletized biosolids) must be tested for PFOA, PFOS, and PFBS. If the materials exceed the screening standards of 2.5 µg/kg for PFOA, 5.2 µg/kg for PFOS, and 1,900 µg/kg for PFBS, additional steps must be taken before the materials can be used (Maine DEP, 2019a, b). Other states, for example Massachusetts and New Hampshire, are also requiring testing of PFAS in biosolids for land application (New Hampshire DES, 2020; State of Massachusetts, 2020). In New York, a screening limit of 72 µg/kg for total PFOA and PFOS was used in a permit situation for screening feedstocks for one composting facility (Beecher and Brown, 2018b), while in Michigan, the Department of Environment, Great Lakes, and Energy identified an “industrially-impacted” level of 150 µg/kg for PFOS in biosolids, which is used as a screening level for land application (Michigan EGLE, 2020).

Persistent Chemical Contaminants 32
Under federal law, the land application of biosolids is regulated under the Clean Water Act, specifically under 40 CFR Part 503. The Part 503 rule, as it is commonly called, applies to residuals (i.e., sewage sludge) from systems that treat domestic sewage, materials derived from sewage sludge (e.g., compost) or mixtures with other materials, such as yard waste. Domestic sewage generally includes food waste disposed of down the drain. EPA is now in the early scoping stages of risk assessment for PFOA and PFOS in biosolids (U.S. EPA, 2019c), which will inform decisions on whether to propose standards for PFOA and PFOS.
The federal Part 503 rule does not apply to the land application of compost or digestate from food waste or mixed feedstock (e.g., food waste and green waste) separate from domestic sewage treatment. There are currently no federal regulations on PFAS in compost or digestate produced from sources that do not contain domestic sewage sludge.
Drinking Water
When sources of drinking water are contaminated with PFAS, drinking water can become a route of human exposure to PFAS (U.S. EPA, 2018b), and U.S. regulations, guidelines, and non-enforceable standards to date have focused on this exposure route. For PFOA and PFOS combined, EPA set a lifetime health advisory of 0.070 µg/L (which is non-regulatory and non-enforceable) for long-term exposure in drinking water (U.S. EPA, 2019a).
Some states are developing or have developed their own standards or guidelines for PFAS (Table 3). For example, New Jersey established maximum contaminant levels (MCLs), an enforceable standard, of 0.014, 0.013, and 0.013 µg/L for PFOA, PFOS, and PFNA, respectively (New Jersey DEP, 2020), while California recently lowered their nonregulatory notification levels to 0.0051 and 0.0065 µg/L for PFOA and PFOS, respectively (California Water Boards, 2019). Additional states that have adopted MCLs for select PFAS as of January 2021 are shown in Table 3, and drinking water regulations have also been proposed in Rhode Island and Washington (Kindschuh and Lee, 2021; State of Rhode Island, 2020; Washington DOH, 2020).
Association Between Drinking Water Regulations and Land-applied Products The regulations for drinking water also affect the ability to apply biosolids to land. Studies have shown that PFAS in biosolids have the potential to leach into groundwater after land application or to enter surface water through runoff (Coker, 2020b; Beecher and Brown, 2018b).
For example, PFAS were detected in the low ng/L level in tile water (i.e., subsurface drainage water) and groundwater at 2-meter depth following application of dewatered municipal biosolids containing PFAS, although the concentrations were not significantly different from the reference plot levels (Gottschall et al., 2017). In Lindstrom et al. (2011), PFAS were detected in both well water and surface water around fields where PFAS contaminated biosolids had been applied for years. Repeated application of biosolids containing persistent contaminants can lead to accumulation in soil of nonmobile contaminants and a continuing source of mobile ones (Washington et al., 2015; Yoo et al., 2010). States may exercise authority under the Clean Water Act to meet some of the more stringent limits for PFAS in drinking water. For example, a state may develop PFAS limits for biosolids-amended soil to limit potential leaching to groundwater or limit biosolids land application if concentration measured in either the biosolid or its source wastewater exceeds any state defined limit.

Persistent Chemical Contaminants 33
TABLE 3. MAXIMUM DRINKING WATER CONTAMINANT LEVELS FOR SELECT PFAS IN U.S. STATES (μg/L)
Compounda Massachusetts Michigan New Hampshire
New Jersey New York Vermont
PFOS
0.020 (applies to sum
of 6 PFAS)
0.016 0.015 0.013 0.010
0.020 (applies to sum
of 5 PFAS)
PFOA 0.008 0.012 0.014 0.010
PFNA 0.006 0.011 0.013 –
PFHxS 0.051 0.018 – –
PFHpA – – – –
PFDA – – – – –
HFPO-DA – 0.370 – – – –
PFBS – 0.420 – – – –
PFHxA – 400 – – – –
Sources: Washington DOH (2020); State of Massachusetts (2020); State of Michigan (2020); State of New Hampshire (2020); New Jersey DEP (2020); State of New York (2020a); Vermont DEC (2020) a Chemical acronyms: PFOS = perfluorooctane sulfonate; PFOA = perfluorooctanoic acid; PFNA = perfluorononanoic acid; PFHxS = perfluorohexane sulfonate; PFHpA = perfluoroheptanoic acid; PFDA = perfluorodecanoic acid; HFPO-DA = 2,3,3,3-Tetrafluoro-2-(1,1,2,2,3,3,3- heptafluoropropoxy) propanoic acid (GenX); PFBS = perfluorobutane sulfonate; PFHxA = perfluorohexanoic acid.
2.8. Data Gaps for PFAS As previously indicated, there were no data available on PFAS concentrations in food waste alone. Based on the available data on PFAS in food items and PFAS in composts made with and without food waste, one can infer that PFAS are present both in food waste streams and in compost made from food waste streams. Further testing of compostable food contact materials and comparisons to their non-compostable counterparts is also needed, especially given BPI’s recent requirement that there be no intentionally added fluorinated chemicals in BPI-certified compostable products. While the limited data show higher PFAS concentrations in compostable paper tableware as compared to non-compostable paper tableware, these results are only from one study investigating items from the United States and China (Yuan et al., 2016). Similarly, the three key studies on compost made from food waste mixtures originated from the same research group (Lazcano et al., 2020; Choi et al., 2019; Lazcano et al., 2019), thus additional studies on composts would be useful to expand the available literature. Much of the available data focuses on PFAS quantified using targeted methods, but nontargeted screening to quantify total organofluorines would be useful to understand total PFAS levels. Differences in regulations across regions as well as differences in food items accepted by composting facilities also support the need for additional research on PFAS levels in composts. In addition, new research measuring PFAS levels in food waste streams destined for stand-alone digesters, combined with measuring the associated digestate, would provide useful data. Multilaboratory-validation of an analytical method to reliably detect PFAS in solids (e.g., food waste, composts, digestates) would also be helpful to research although there are standardized methods within organizations (e.g., U.S. Department of Defense, state of California) for PFAS testing in soil and solid matrices. Currently, EPA’s approved laboratory methods, Method 537.1 and Method 533, are only for use with drinking water (Coker, 2020a; U.S. EPA, 2020h, 2019b, c); however, new methods are under development, with EPA collaborating with the U.S. Department of Defense to develop CWA Method 1600 for fish tissues, biosolids, soils, sediments, and non-drinking water aqueous matrices (surface water, groundwater, wastewater influent/effluent, landfill leachate) (U.S. EPA, 2021o, 2019c).

Persistent Chemical Contaminants 34
2.9. Summary of PFAS Several PFAS have been reported in food items, food contact materials, and in compost made with feedstocks containing food waste streams. In food waste streams containing both food waste and food contact materials, the latter may contribute more to overall PFAS levels. Comparisons of composts made from different feedstocks suggest the following decreasing order of PFAS concentrations: biosolids-based products (i.e., treated biosolids, composted biosolids) > food waste compost > yard waste compost ≈ other organic composts. Due to the lack of data available, no conclusions could be made on PFAS concentrations in digestates produced from food waste. Limited data show that of the PFAS being analyzed, both composting and anaerobic digestion can result in an increase or decrease in PFAS. Given these findings, food waste remains a potential important pathway by which PFAS can end up in compost and digestate.
Persistent Chemical Contaminants 35
3. PESTICIDES Pesticides, which include herbicides, insecticides, and fungicides, are designed to be toxic to pests (e.g., weeds, insects, molds) and are regulated by the EPA under the Federal Insecticide, Fungicide, and Rodenticide Act (FIFRA). The majority of pesticides break down during the composting process and the concentrations following composting do not affect human health, garden plants, or crops (Michel Jr and Doohan, 2020). Degradation occurs through various chemical, physical, and biological processes, such as mineralization (or degradation to CO2), photochemical (i.e., light) degradation, and bacterial or other biotransformation into a different form that is not biologically active (Michel Jr and Doohan, 2020). In addition, loss processes such as volatilization or leaching can decrease the amount of chemical present over time (Tu et al., 2001; Penn State University Extension, 1999).
Of particular concern to the U.S. composting industry are the “pyridine and pyrimidine carboxylic acid” herbicides (referred to as “persistent herbicides” in this issue paper), of which clopyralid, aminopyralid, aminocyclopyrachlor, and picloram are the most prevalent examples (USCC, 2013). These four persistent herbicides have not been reported in the literature to be harmful to humans and animals when used at their labelled rates. Their effect on sensitive plants and crops are the primary cause for concern (USCC, 2020a). The U.S. Composting Council reported that the presence of these persistent herbicides in compost can lead to plant and crop (e.g., tomatoes, beans, lettuce, carrots, and potatoes) damage at concentrations as low as 1–10 µg/kg (USCC, 2013). Green waste as well as animal manure and bedding are known sources of persistent herbicide contamination in compost (USCC, 2013). If animals consume crops where herbicides have been applied (e.g., straw, hay), the herbicide residues can pass through the digestive tract of the animals into their manure, urine, or bedding (USCC, 2013), which may be composted. Residues have also been reported where contaminated compost is applied. For example, in field and pot trials, Saito et al. (2010) measured clopyralid residue levels up to 40 µg/kg in crops grown in soils where clopyralid-contaminated compost had been applied.
For persistent herbicides, the concentrations at which they are phytotoxic to sensitive plants, and thus a concern in compost, can be very low and below the limit of quantification in many local or state-level laboratories. While analytical methods do exist to test for persistent herbicides in compost, they often require highly sensitive equipment in order to measure herbicides at phytotoxic levels and can be very expensive. As a result, the lack of widespread analytical capacity is a challenge for the composting industry to be able to quickly and inexpensively test composts and compost feedstocks for these herbicides (Coker, 2014; USCC, 2013). Some compost facilities may choose to test for persistent herbicides using plant growth (i.e., bioassay) testing, but these results are qualitative (e.g., “none,” “slight,” “moderate,” “severe” damage) and plant growth testing is not a standardized practice (USCC, 2015).
The potential contribution of food waste streams to pesticide contamination in compost is discussed below. Although this issue paper focuses on the four persistent herbicides listed above (i.e., clopyralid, aminopyralid, picloram, and aminocyclopyrachlor), other pesticides also may be present in food waste and are discussed where specific and relevant information was available in the literature.
3.1. Pesticides in Food Waste and Food Items All four persistent herbicides of interest (clopyralid, aminopyralid, aminocyclopyrachlor, and picloram) are used to control broadleaf weeds and/or woody plants. Of the four, clopyralid is the most likely candidate that could be found in food waste based on its registered use sites. None of the four herbicides have registered residential use sites and should therefore not be used by homeowners. However, herbicides containing clopyralid, aminopyralid, and picloram are widely available and can be purchased online.

Persistent Chemical Contaminants 36
Registered Use Sites
During the pesticide registration process in the United States, the following information are considered: (i) ingredients of the pesticide, (ii) site or crop where it is to be used, (iii) amount, frequency, and timing of its use, and (iv) storage and disposal practices (U.S. EPA, 2021a). Once approved, legal use of the pesticide is allowed by its registered use sites. For example, if a pesticide’s registered use site is only strawberries, it may not be legally used for apples. Each of the four persistent herbicides has different registered use sites.
Registered use sites for clopyralid include agricultural settings such as fruits (e.g., apples, cherries, peaches, strawberries), vegetables (e.g., asparagus, sugar beets, sweet corn), and cereal grains (e.g., barley, spring wheat, winter wheat). Registered non-agricultural use sites include non-residential turf (e.g., golf courses, athletic/recreational fields), ornamentals, rights of ways, pasture, and rangeland (U.S. EPA, 2020d). Registration for use on residential turfs was cancelled in 2002, with labels indicating that grass clippings treated with clopyralid should not be used as mulch or sent to composting facilities (Sullivan, 2011). However, products containing clopyralid can still be misapplied or illegally applied, leading to contamination of grass clippings.
Aminopyralid is used on agricultural and non-agricultural targets, with registered use sites including corn, wheat, pastures, rangeland, conservation reserve program lands, non-crop areas, campgrounds, rights of ways, forest lands, and more (U.S. EPA, 2020f). Picloram’s registered use sites include agricultural crops (barley, spring wheat, winter wheat), fallow, pastureland, rangeland, forests, rights of ways, industrial/commercial areas, and other non-crop areas (U.S. EPA, 2021l). Neither aminopyralid nor picloram are registered for residential use sites.
Aminocyclopyrachlor is approved for use on non-agricultural areas (e.g., airports, highways, railroad and utility rights of ways), uncultivated non-crop producing agricultural areas (e.g., farmyards, non-irrigation ditchbanks), outdoor industrial sites (e.g., lumberyards), and natural areas (e.g., wildlife management areas) (U.S. EPA, 2020l). The herbicide Imprelis, which contained aminocyclopyrachlor as the active ingredient, was previously registered but was voluntary recalled by the manufacturer, followed by a Stop Sale Order by EPA, following reports of damage and death of balsam fir, Norway spruce, and white pine trees (USCC, 2013). However, other products containing aminocyclopyrachlor are still registered for use, including the herbicide Perspective (State of Oregon, 2019; U.S. EPA, 2019f). In 2018, the use of Perspective was found to be the cause of over 2,000 dead and dying pine trees in Oregon after it was used between 2013 and 2015 for roadside weed control (Cureton, 2019, 2018). The trees were logged, with the Oregon Department of Agriculture indicating that the mill that purchased the logs would need to take measures to ensure that the affected wood does not enter the composting stream (Cureton, 2019).
Food Waste and Food Items No studies were identified that measured concentrations of clopyralid, aminopyralid, picloram, or aminocyclopyrachlor in food waste or in feedstock mixtures containing food waste. Coker (2013) indicated that these persistent herbicides had been detected in food scraps, although no information on concentrations was provided.
Persistent herbicides have, however, been reported in food items. When herbicides are applied to food crops, residue may remain on food at the time of harvest. Food crops will then undergo one or more processing steps before they can be consumed, thereby decreasing residual herbicide concentrations, although low levels of herbicides may still be present. Using a newly developed sample preparation method to test for clopyralid residues in agricultural products, Watanabe and Seike (2020) found concentrations of 0.57–3.5 µg/kg in Japanese mustard spinach, spinach, turnip (leaf), and turnip (root) that were grown in soil treated with clopyralid (method detection limits ranged from 0.2 to 0.4 µg/kg). Note that the U.S. Composting Council noted plant and crop damage from persistent herbicides in compost at concentrations as low as 1 to 10 µg/kg (USCC, 2013).

Persistent Chemical Contaminants 37
In addition, as part of FDA’s pesticide residue monitoring program, 809 pesticides and industrial chemicals, which included clopyralid, aminopyralid, and picloram, were analyzed in October 2017 to September 2018 for over 4,400 human food samples (both domestic and imported). Aminopyralid and picloram were not detected, but clopyralid was detected in 10 samples. The food items where clopyralid was detected and their concentrations were not available. The limit of detection for clopyralid was not given but the report noted that most pesticides could be quantified at FDA’s default limit of quantification of 10 µg/kg (FDA, 2018).
FIFRA Tolerances
Food may legally contain herbicide residues at concentrations up to the FIFRA tolerance value. The tolerance standards were developed to protect humans from adverse health effects, such as birth defects, reduced birth weight, cancer, and hormone disruption (Kim et al., 2017), due to exposure to pesticide residues through their diet. Foods produced in compliance with FIFRA generally should have concentrations below the tolerance levels. Assuming that the pesticide is applied to the crop, that the pesticide is applied at a level close to the tolerance level, and there is no degradation from application to production of food waste, FIFRA tolerances can be used to provide estimates of maximum pesticide concentrations possible in food waste.
For the four most common persistent herbicides, Table 4 lists the FIFRA tolerances for residues in various commodities, including those for meat, vegetables, and grass and wheat. The range of tolerances (excluding grass) were 10–300, 20–4,000, 50–36,000, and 50–15,000 µg/kg for aminocyclopyrachlor, aminopyralid, clopyralid, and picloram, respectively. These tolerances are generally much higher than the lowest concentrations of 1–10 µg/kg reported to cause plant and crop (e.g., tomatoes, beans, lettuce, carrots, and potatoes) damage (USCC, 2013). It should also be noted that the existence of a tolerance does not necessarily mean that the herbicide is used on that particular crop.

Persistent Chemical Contaminants 38
TABLE 4. FIFRA TOLERANCES FOR PERSISTENT HERBICIDE RESIDUES IN FOOD, INCLUDING ITS METABOLITES AND DEGRADATES
Commodity Tolerance (µg/kg)
Aminocyclopyrachlor
Cattle, meat; goat, meat; horse, meat; milk; sheep, meat 10
Cattle, fat; goat, fat; horse, fat, sheep, fat 50
Cattle, meat byproducts; goat, meat byproducts; horse, meat byproducts, sheep, meat byproducts 300
Aminopyralid
Cattle, fat; cattle, meat; cattle, meat byproducts except kidney; goat, fat; goat, meat; goat, meat byproducts except kidney; horse, fat; horse, meat; horse, meat byproducts except kidney; sheep, fat; sheep, meat; sheep, meat byproducts except kidney
20
Milk 30
Wheat, grain 40
Wheat, bran 100
Corn, field, grain; corn, field, stover; grain, aspirated fractions 200
Wheat, straw 250
Corn, field, forage; cattle, kidney; goat, kidney; horse, kidney 300
Wheat, forage 2,000
Wheat, hay 4,000
Grass, forage 25,000
Grass, hay 50,000
Clopyralid
Fruit, pome, group 11–10 50
Egg 100
Hog, fat; hog, meat; hog, meat byproducts; milk; poultry, fat; poultry, meat; poultry, meat byproducts
200
Radish, roots 300
Bushberry subgroup 13-07b; fruit, stone, group 12–12 500
Cattle, fat; cattle, meat; corn, field, grain; corn, pop, grain; corn, sweet, kernel plus cob with husks removed; goat, fat; goat, meat; horse, fat; horse, meat; sheep, fat; sheep, meat; stalk and stem vegetable subgroup 22a; turnip, roots
1,000
Corn, field, milled byproducts; plum, prune, dried 1,500
Beet, sugar, roots; broccoli, Chinese; kohlrabi; vegetable, brassica, head and stem, group 5–16 2,000
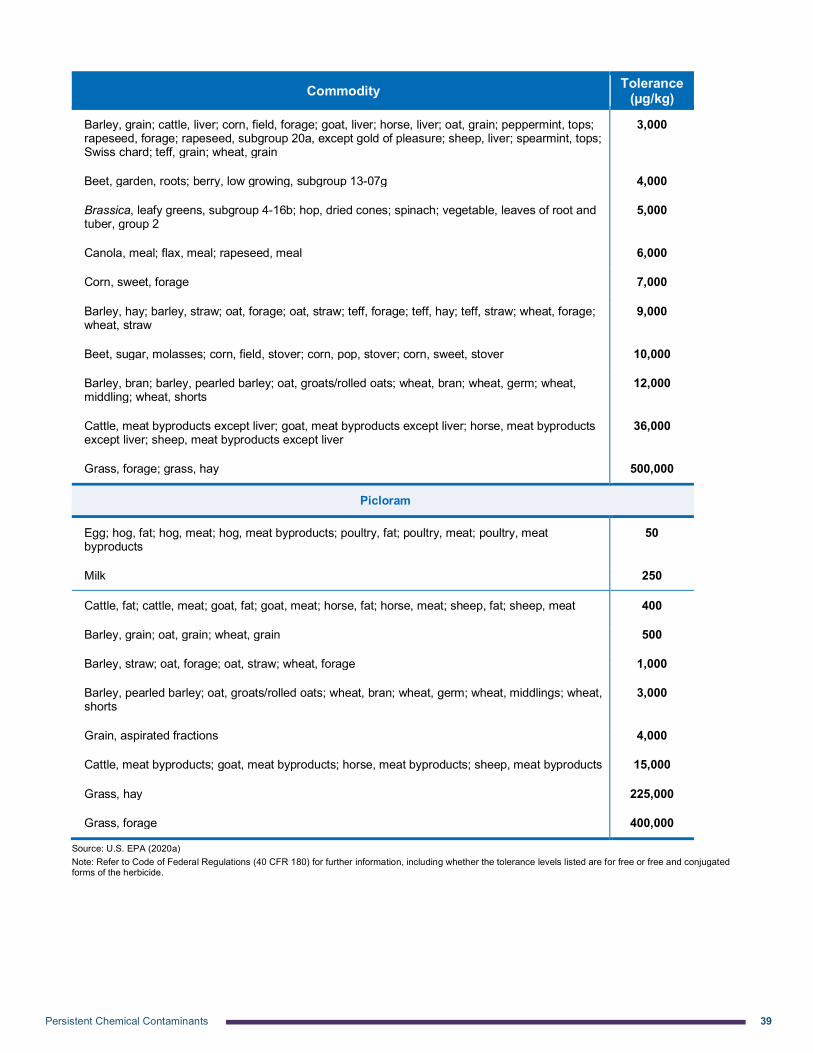
Persistent Chemical Contaminants 39
Commodity Tolerance (µg/kg)
Barley, grain; cattle, liver; corn, field, forage; goat, liver; horse, liver; oat, grain; peppermint, tops; rapeseed, forage; rapeseed, subgroup 20a, except gold of pleasure; sheep, liver; spearmint, tops; Swiss chard; teff, grain; wheat, grain
3,000
Beet, garden, roots; berry, low growing, subgroup 13-07g 4,000
Brassica, leafy greens, subgroup 4-16b; hop, dried cones; spinach; vegetable, leaves of root and tuber, group 2
5,000
Canola, meal; flax, meal; rapeseed, meal 6,000
Corn, sweet, forage 7,000
Barley, hay; barley, straw; oat, forage; oat, straw; teff, forage; teff, hay; teff, straw; wheat, forage; wheat, straw
9,000
Beet, sugar, molasses; corn, field, stover; corn, pop, stover; corn, sweet, stover 10,000
Barley, bran; barley, pearled barley; oat, groats/rolled oats; wheat, bran; wheat, germ; wheat, middling; wheat, shorts
12,000
Cattle, meat byproducts except liver; goat, meat byproducts except liver; horse, meat byproducts except liver; sheep, meat byproducts except liver
36,000
Grass, forage; grass, hay 500,000
Picloram
Egg; hog, fat; hog, meat; hog, meat byproducts; poultry, fat; poultry, meat; poultry, meat byproducts
50
Milk 250
Cattle, fat; cattle, meat; goat, fat; goat, meat; horse, fat; horse, meat; sheep, fat; sheep, meat 400
Barley, grain; oat, grain; wheat, grain 500
Barley, straw; oat, forage; oat, straw; wheat, forage 1,000
Barley, pearled barley; oat, groats/rolled oats; wheat, bran; wheat, germ; wheat, middlings; wheat, shorts
3,000
Grain, aspirated fractions 4,000
Cattle, meat byproducts; goat, meat byproducts; horse, meat byproducts; sheep, meat byproducts 15,000
Grass, hay 225,000
Grass, forage 400,000
Source: U.S. EPA (2020a) Note: Refer to Code of Federal Regulations (40 CFR 180) for further information, including whether the tolerance levels listed are for free or free and conjugated forms of the herbicide.

Persistent Chemical Contaminants 40
Other Pesticides in Food Waste
In general, there are limited studies that analyze pesticides in food waste. The following paragraphs summarize the two studies identified that measured other pesticides in composting feedstocks that contained food waste. The pesticides discussed below include legacy pesticides that have been banned due to known health risks (Hellstrom et al., 2011; Kupper et al., 2008) or may be pesticides not used in the United States. However, given the lack of data available, these studies may provide insight on whether food waste or green waste would contain higher pesticide concentrations.
Kupper et al. (2008) reported pesticide concentrations in Swiss feedstocks of (i) a mixture of green waste, kitchen waste, and approximately 10 percent food residues, and (ii) green waste only. All eight herbicides tested (chlorpropham, dichlobenil, diuron, mecoprop, oxadiazon, propham, terbuthylazine-hydroxy, and terbutryn) were below the limit of detection (1 µg/kg dw) for all feedstocks; this prevented a comparison of feedstocks. Two insecticides, carbofuran and pirimicarb, had concentrations of 15 and 6 µg/kg dw, respectively, in the mixture of green waste, kitchen waste, and food residues. These concentrations were higher than those found in green waste of <1 and 2 µg/kg dw for carbofuran and pirimicarb, respectively. Of the 20 fungicides tested, 9 had concentrations below the limit of detection (1 µg/kg dw) in both feedstocks. As previously indicated, these pesticides may not be used in the United States. For example, EPA revoked all carbofuran tolerances in 2009 (U.S. EPA, 2011); however, this insecticide can still show up in imported food items. In FDA’s 2017–2018 pesticide residue monitoring program, 11 human food samples contained carbofuran (FDA, 2018).
Azoxystrobin exhibited the greatest difference in concentration between the two feedstocks, with the mixture of green waste, kitchen waste, and food residues containing 13 µg/kg dw and the green waste feedstock containing <1 µg/kg dw (Kupper et al., 2008). Several other fungicides such as imazalil and thiabendazole also showed slightly higher concentrations in the feedstock mixture of green waste, kitchen waste, and food residues than in green waste alone. Only one fungicide (paclobutrazol) showed a slightly higher concentration in green waste. These results suggest that the food waste in this study (i.e., kitchen waste and food residues) contained higher levels of the studied pesticides than did the green waste.
Kupper et al. (2008) also reported concentrations for a “green and organic kitchen waste” feedstock. However, this feedstock contained 25 percent horse manure and was therefore not used for comparison purposes. Hellstrom et al. (2011) also measured pesticide concentrations (e.g., chlorpyrifos, chlorothalonil) in the biodegradable fraction of source-separated Swedish household waste; however, no other feedstock was measured and the pesticides studied had limited overlap with those examined by Kupper et al. (2008). In general, the range of concentrations reported by Kupper et al. (2008) was similar to the mean concentrations reported in Hellstrom et al. (2011) where values ranged from not detected to a maximum of 36 µg/kg dw for pentachloroaniline.
Summary of Persistent Pesticides in Food Waste and Food Items
Based on the registered use sites, clopyralid is the most likely persistent herbicide that could be found in food waste. No studies were identified that reported concentrations of clopyralid, aminopyralid, picloram, or aminocyclopyrachlor in food waste or feedstock mixtures containing food waste. However, clopyralid has been detected in U.S. human food samples (data were not available to indicate whether these were domestic or imported samples). No comparisons could be made between food waste and green waste for the four persistent herbicides. Results from one study that examined other pesticides, including legacy pesticides, suggest that the concentrations of several insecticides and fungicides were higher in feedstock mixtures containing food waste compared to green waste alone. However, this observation may be due to the specific uses of these insecticides and fungicides on crops. For the four persistent herbicides of interest, given that they are all used to control broadleaf and/or woody plants, it is more likely that contamination occurs from green waste, either due to misapplication or misdirection of treated materials to composting facilities.
Persistent Chemical Contaminants 41
3.2. Pesticides in Food Contact Materials Pesticides may be present in food contact materials (e.g., food packaging) as intentionally used and regulated pesticides or as food contact substances, or as unintentional or incidental indirect food additives. A food contact substance is defined under the Food, Drug, and Cosmetic Act (FDCA) as "any substance intended for use as a component of materials used in manufacturing, packing, packaging, transporting, or holding food if such use is not intended to have a technical effect in such food."
Antimicrobial chemicals used in or on agricultural commodities, processed foods, or food contact materials can be regulated as a food additive by FDA and/or as a pesticide by EPA. Pesticidal chemicals used as antimicrobial food contact substances (e.g., in packaging to prolong product shelf life) are regulated by EPA as pesticides. Other food contact substances, including antimicrobials that are not EPA-regulated pesticides are regulated by the FDA under the FDCA. Because a food contact material may be composed of several food contact substances, the overall regulation of a food contact material is based on the regulatory status of each individual food contact substance it contains. No studies were identified that reported pesticide concentrations in food contact materials.
A possible way in which pesticides may be present in food contact materials is the use of agricultural waste or plant-based materials to create biodegradable or compostable packaging. Biodegradable or compostable food contact materials include mushroom-based packaging and plant-based paper (id8agency, 2020). To make the mycelium product used for mushroom-based packaging, agricultural waste is needed. Examples of agricultural waste that can be used include wheat straw, rice straw, cotton straw, and banana leaves (Flagel, 2020; Kamthan and Tiwari, 2017). For plant-based paper, examples of plants used are wheat straw, bamboo, husks, sugar cane, and bulrush (id8agency, 2020). With growing interest in biodegradable or compostable food contact materials, studies are needed to determine whether residual pesticides are an issue in these types of materials. For example, given that clopyralid is applied to wheat, the issue of possible residuals should be investigated.
3.3. Comparison of Pesticide Levels in Food versus Food Contact Materials
There were insufficient data available to determine whether food or food contact materials were the primary source of pesticides in food waste streams.
3.4. Pesticides in Compost Clopyralid, aminopyralid, picloram, and aminocyclopyrachlor have been detected in composts produced from green wastes and from manure (ODA, 2020a, b; BioCycle, 2017; USCC, 2013; WRAP, 2010). Incidents of contaminated compost were reported as early as 1999 when damage to tomato plants was reported in Spokane, Washington, due to clopyralid in compost at concentrations of 37–75 µg/kg; in this instance, the source of clopyralid was green waste. Additional incidences have been documented in the United States, with green waste and manure having been the source of the contamination in many of these cases. In 2012, samples from compost made from food scraps in Vermont contained clopyralid concentrations of 5.2 µg/kg (Coker, 2015); however, it was unclear whether food scraps were the source of clopyralid or if its presence was due to another feedstock present. Table 5 provides illustrative examples of compost contamination by persistent herbicides. To date, there have been no reported instances of persistent herbicide contamination in compost due to food waste.
Contaminated green waste may be the result of misuse. Pesticide products include warning labels that treated material should not be sent to composting facilities. However, there is no guarantee that people read or follow the warnings or that the appropriate stakeholders (e.g., property owners, processors) are notified (USCC, 2013). Because food waste is typically processed with other waste such as green waste, the associated compost may therefore contain persistent herbicides.
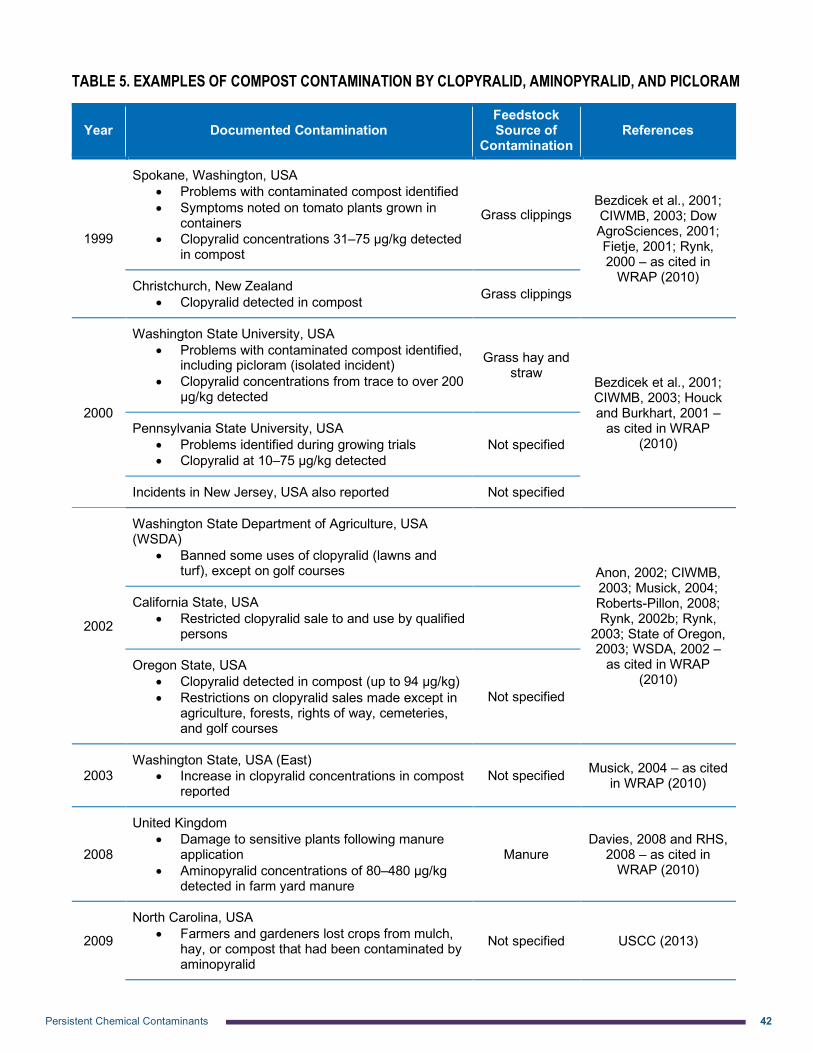
Persistent Chemical Contaminants 42
TABLE 5. EXAMPLES OF COMPOST CONTAMINATION BY CLOPYRALID, AMINOPYRALID, AND PICLORAM
Year Documented Contamination Feedstock Source of
Contamination References
1999
Spokane, Washington, USA • Problems with contaminated compost identified • Symptoms noted on tomato plants grown in
containers • Clopyralid concentrations 31–75 µg/kg detected
in compost
Grass clippings Bezdicek et al., 2001; CIWMB, 2003; Dow AgroSciences, 2001; Fietje, 2001; Rynk, 2000 – as cited in
WRAP (2010) Christchurch, New Zealand • Clopyralid detected in compost Grass clippings
2000
Washington State University, USA • Problems with contaminated compost identified,
including picloram (isolated incident) • Clopyralid concentrations from trace to over 200
µg/kg detected
Grass hay and straw
Bezdicek et al., 2001; CIWMB, 2003; Houck and Burkhart, 2001 –
as cited in WRAP (2010)
Pennsylvania State University, USA • Problems identified during growing trials • Clopyralid at 10–75 µg/kg detected
Not specified
Incidents in New Jersey, USA also reported Not specified
2002
Washington State Department of Agriculture, USA (WSDA)
• Banned some uses of clopyralid (lawns and turf), except on golf courses
Anon, 2002; CIWMB, 2003; Musick, 2004; Roberts-Pillon, 2008; Rynk, 2002b; Rynk,
2003; State of Oregon, 2003; WSDA, 2002 –
as cited in WRAP (2010)
California State, USA • Restricted clopyralid sale to and use by qualified
persons
Oregon State, USA • Clopyralid detected in compost (up to 94 µg/kg) • Restrictions on clopyralid sales made except in
agriculture, forests, rights of way, cemeteries, and golf courses
Not specified
2003 Washington State, USA (East)
• Increase in clopyralid concentrations in compost reported
Not specified Musick, 2004 – as cited in WRAP (2010)
2008
United Kingdom • Damage to sensitive plants following manure
application • Aminopyralid concentrations of 80–480 µg/kg
detected in farm yard manure
Manure Davies, 2008 and RHS,
2008 – as cited in WRAP (2010)
2009
North Carolina, USA • Farmers and gardeners lost crops from mulch,
hay, or compost that had been contaminated by aminopyralid
Not specified USCC (2013)
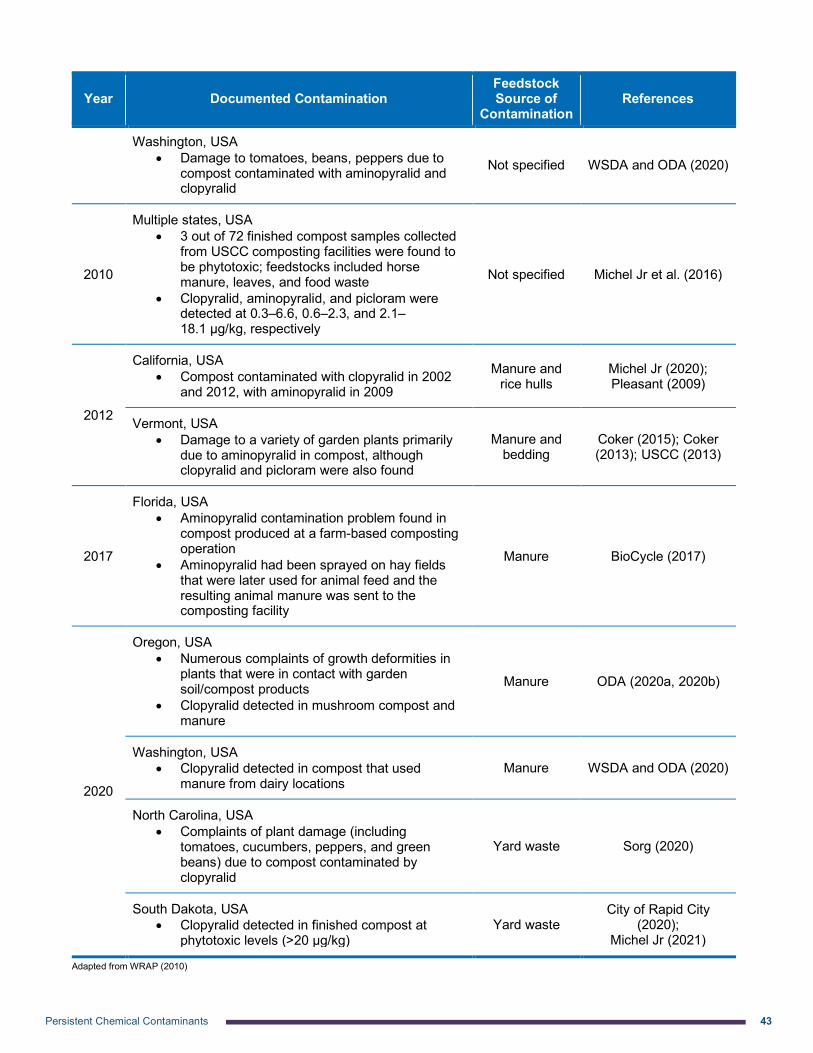
Persistent Chemical Contaminants 43
Year Documented Contamination Feedstock Source of
Contamination References
Washington, USA • Damage to tomatoes, beans, peppers due to
compost contaminated with aminopyralid and clopyralid
Not specified WSDA and ODA (2020)
2010
Multiple states, USA • 3 out of 72 finished compost samples collected
from USCC composting facilities were found to be phytotoxic; feedstocks included horse manure, leaves, and food waste
• Clopyralid, aminopyralid, and picloram were detected at 0.3–6.6, 0.6–2.3, and 2.1–18.1 µg/kg, respectively
Not specified Michel Jr et al. (2016)
2012
California, USA • Compost contaminated with clopyralid in 2002
and 2012, with aminopyralid in 2009
Manure and rice hulls
Michel Jr (2020); Pleasant (2009)
Vermont, USA • Damage to a variety of garden plants primarily
due to aminopyralid in compost, although clopyralid and picloram were also found
Manure and bedding
Coker (2015); Coker (2013); USCC (2013)
2017
Florida, USA • Aminopyralid contamination problem found in
compost produced at a farm-based composting operation
• Aminopyralid had been sprayed on hay fields that were later used for animal feed and the resulting animal manure was sent to the composting facility
Manure BioCycle (2017)
2020
Oregon, USA • Numerous complaints of growth deformities in
plants that were in contact with garden soil/compost products
• Clopyralid detected in mushroom compost and manure
Manure ODA (2020a, 2020b)
Washington, USA • Clopyralid detected in compost that used
manure from dairy locations Manure WSDA and ODA (2020)
North Carolina, USA • Complaints of plant damage (including
tomatoes, cucumbers, peppers, and green beans) due to compost contaminated by clopyralid
Yard waste Sorg (2020)
South Dakota, USA • Clopyralid detected in finished compost at
phytotoxic levels (>20 µg/kg) Yard waste
City of Rapid City (2020);
Michel Jr (2021)
Adapted from WRAP (2010)

Persistent Chemical Contaminants 44
Pesticide Registration Review
Under FIFRA, registered pesticides must be reviewed by EPA at least every 15 years to determine whether they continue to meet, or do not meet, the FIFRA standard for registration (U.S. EPA, 2021m). EPA released its interim registration review decision on clopyralid in December 2020. The decision addressed potential compost contamination by including the following requirements: (i) updates to label language indicating that users may not sell or transport treated plant materials or manure from animals that have grazed in treated areas for compost or animal bedding/feed for 18 months after application, (ii) for pasture and turf use, applicators must notify property owners/operators in writing the label restrictions affecting materials that might be used for composting, (iii) applicators must retain records for two years describing how the property owner/operator was notified, and (iv) animals that grazed on treated forage must be fed clopyralid-free forage for at least three days before they can be moved to non-treated areas where sensitive crops are grown or manure may be collected. Exemptions to the notification and recordkeeping requirement are for application by property owners/operators to their own property and application to public land (U.S. EPA, 2020d). In addition, EPA is requesting the development of educational materials on the issue of compost contamination and a revised pictogram on labels for products used on pasture, rangeland, hayfield, conservation reserve program land, turf, cereal grains, corn, wheat, and other agricultural crops. The revised pictogram will include a warning that treated materials should not be used for composting and to limit the movement of these materials (U.S. EPA, 2020d).
For picloram and aminopyralid, EPA released its proposed interim registration review decisions in March 2021 and April 2021, respectively. To address potential compost contamination, EPA is proposing the same four actions that it decided on for clopyralid, which were (i) updates to label language, (ii) for pasture use, notification of property owners/operators in writing the label restrictions, (iii) recordkeeping of notifications for two years, and (iv) restrictions on the movement of animals that grazed on treated forage for at least three days. Application by property owners/operators to their own property and application to public land are proposed to be exempt from the notification and recordkeeping requirements (U.S. EPA, 2021l).
Other Pesticides in Compost
Bifenthrin, an insecticide used on agricultural crops (primarily corn, soybeans, and cotton, and to a lesser extent on artichokes, cantaloupes, strawberries, and pistachios), and indoor and outdoor residential areas, has also been detected in compost (CalRecycle, 2020; U.S. EPA, 2020c). In 2009, its presence in California compost led three organic composters to discontinue their operations (CalRecycle, 2020) and these composts were banned for use on any organic farm certified to NOP standards (OMRI, 2010). However, this ban was lifted between 2011 to 2016 after USDA adopted guidance NOP 5016, “Allowance of Green Waste in Organic Production Systems” that allowed compost containing pesticide residuals to be used for organic growing. In 2016, a federal judge vacated NOP 5016 after ruling that USDA had not put the proposed rule through the formal rulemaking process that includes public notice and a comment period (Sustainable Food News, 2017; McEntee, 2016). EPA recently released its interim registration review decision on bifenthrin, which did not mention contaminated compost as an issue of concern (U.S. EPA, 2020c).
There were limited studies that analyzed other pesticides in composts made from feedstocks containing food waste. Some of the pesticides analyzed are not used in the United States or are legacy pesticides, but these studies are summarized here given the lack of data available. Concentrations of hexachlorocyclohexane, DDT, hexachlorobenzene, and pentachlorobenzene were detected in composts from multiple European countries derived from (i) green waste, (ii) a mixture of organic household waste including green waste, (iii) sewage sludge, and (iv) municipal solid waste after mechanical-biological treatment (Benisek et al., 2015). Using the individual compost data reported in the author’s supporting information, the mean concentration for DDT and hexachlorobenzene was calculated to be higher in the compost made from a mixture of organic household waste and green waste than it was for green waste compost (20.1 µg/kg dw in the mixture and 7.1 µg/kg dw in green waste alone for DDT; 0.56 µg/kg dw in the mixture and 0.38 µg/kg dw in green waste alone for hexachlorobenzene). For hexachlorocyclohexane, the mean concentration was higher in green waste compost
Persistent Chemical Contaminants 45
compared to compost made from organic household waste and green waste (0.62 µg/kg dw in the mixture and 0.75 µg/kg dw in green waste alone). For pentachlorobenzene, the mean concentration was the same for the two compost types. There was no consistent trend in pesticide concentrations when composts made from sewage sludge or from municipal solid waste after mechanical-biological treatment were compared with green waste compost and compost made from organic household waste and green waste. From the very limited data available in Benisek et al. (2015), pesticide concentrations may potentially be similar, lower, or higher in organic household waste than in green waste; however, this study did not review the pesticides of interest in this issue paper and focused on insecticides and fungicides that have different uses.
Two studies reported pesticide concentrations in composts made from feedstock mixtures that contained food waste; however, there were insufficient data from which to draw conclusions for food waste compost. Kupper et al. (2008) reported results for composts produced from (i) green waste, (ii) mixture of green waste, organic kitchen waste, and cattle manure, and (iii) anaerobic digestate. Because no data were available for composts made from cattle manure or from a mixture of green and organic kitchen waste, no comparisons could be made to determine concentrations from only organic kitchen waste compost. Hellstrom et al. (2011) reported that compost produced from the biodegradable fraction of household waste had individual pesticide mean concentrations ranging from not detected to a maximum of 42 µg/kg dw for bromopropylate. As Hellstrom et al. (2011) did not measure insecticide concentrations in composts made from other feedstocks, no comparisons could be made to other compost types.
Summary of Persistent Pesticides in Composts Data have not been collected that specifically assess the levels of persistent herbicides in food waste compost to support a comparison of those levels to levels in compost made from other feedstocks. However, in the documented cases of compost contamination by these four persistent herbicides, the source of contamination has been green waste, manure, or hay. In addition, if certain food items were contaminated, they would likely be diluted by the wide variety of foods found in municipal food waste and the addition of bulking agents required for composting. As such, food waste is likely not a major source of contamination of composts.
Instead, given the documented incidents of contaminated compost, the primary contributor of pesticide residues is green waste and manure. While composts made with food waste have been found to contain phytotoxic levels of persistent herbicides, this is likely due to the fact that only a fraction of the feedstock is food waste. Food waste is invariably mixed with green waste, manure, and other organic feedstocks that are available to compost producers, some of which may contain persistent herbicides.
3.5. Pesticides in Digestate No studies were identified that reported concentrations of clopyralid, aminopyralid, picloram, or aminocyclopyrachlor in anaerobic digestate made from food waste in the United States. Three studies reported the concentration of other pesticides in anaerobic digestate made from feedstocks containing food waste (Benisek et al., 2015; Hellstrom et al., 2011; Kupper et al., 2008); however, each study evaluated only one type of feedstock, thus the reported concentrations could not be compared with digestates made from other feedstocks. In addition, the contribution of food waste to pesticide concentrations could not be determined. Mean concentrations of individual pesticides in anaerobic digestates across the three studies ranged from not detected to a maximum of 57 µg/kg dw for bromopropylate.
Summarizing studies conducted between 2008–2011 by the Waste and Resources Action Programme (WRAP), a UK-based nonprofit organization, Longhurst et al. (2019) noted that clopyralid and aminopyralid were not detected in any of the digestate samples made from food waste.

Persistent Chemical Contaminants 46
3.6. Effects of Composting or Anaerobic Digestion on Pesticide Concentrations
Composts Two studies were available that examined the effect of composting on concentrations of pesticides. The Department of Environment and Conservation in New South Wales, Australia funded a study that determined the degradation of clopyralid and picloram in an applied composting trial. Source-separated municipal garden organics were used to create static piles, to which the herbicides were applied at a high and low rate in addition to a control pile. Commercial composting conditions were maintained for 16 weeks. Both clopyralid and picloram showed no degradation over the 16 weeks (Recycled Organics Unit, 2004).
In a study of aminocyclopyrachlor and clopyralid degradation during composting, grass to which these chemicals were applied at label rates was amended with leaves and composted for 178 days. Results showed that from 47 to 58% of aminocyclopyrachlor and 71% of clopyralid was lost during thermophilic composting. Each of the final composts were also evaluated for their phytotoxicity. At 10% and 20% amendment levels, symptoms of herbicide toxicity were evidence, indicating that aminocyclopyrachlor and clopyralid were not degraded sufficiently to be used in gardens or in plant growth media (Michel et al., 2012). No studies were available that measured concentrations of aminopyralid in both feedstocks and their corresponding compost.
For other pesticides, Hellstrom et al. (2011) investigated organochlorine pesticides in the biodegradable fraction of household waste and found that depending on the pesticide, concentrations in compost increased, decreased, or remained at levels similar to those in the feedstock when compared with the feedstock. The authors proposed four major contaminant fate scenarios to explain the differing observations and speculated that the four scenarios relate to the rate of degradation of the contaminant when compared with the rate of mineralization of the contaminant in the feedstock. Hellstrom et al. (2011) reported that for pesticides such as dieldrin and pentachloroaniline, their mean concentrations were lower in the compost than in the feedstock. On the other hand, some pesticides had higher mean concentrations in the compost, such as chlorpyrifos, which was not detected in the feedstock but present at 3.2 µg/kg dw in the compost – in this case, Hellstrom et al. (2011) proposed that the feedstock was mineralized more rapidly than chlorpyrifos was degraded. Of the pesticides tested, several showed similar levels between feedstock and compost, including 1,1-dichloro-bis(4-chlorophenyl)-2,2,-ethene (DDE), hexachlorobenzene (HCB), and quintozene. In general, the sum of the mean concentrations of all pesticides measured showed a decrease between feedstock and compost (Hellstrom et al., 2011).
The overall decrease in pesticide concentration reported by Hellstrom et al. (2011) is consistent with the results reported by Kupper et al. (2008) for feedstocks of (i) green waste, (ii) mixture of green waste, cattle manure, and kitchen waste, and (iii) thermophilic anaerobic digestate made from green waste, kitchen waste, and approximately 10 percent food residues. For all three types of feedstock in Kupper et al. (2008), the concentration from the sum of all pesticides was higher in the feedstock than in the compost. Similarly, in Lemmon and Pylypiw (1992), diazinon, chlorpyrifos, isofenphos, and pendimethalin were applied to grass and the grass clippings were placed into compost bins, to imitate methods used by homeowners, for 20 weeks. There were no detectable residues for these four pesticides at the end of composting.
Based on the limited data available, pesticide concentrations generally decrease following composting, although this will depend on factors such as the rate of degradation as well as the percentage of mass reduction that occurs during composting. While higher chemical degradation rates lead to greater decreases in contaminant concentration, higher mass reductions provide the opposite effect (i.e., if the contaminant does not degrade while the mass of the compost decreases, the concentration of the contaminant will increase). For clopyralid, aminocyclopyrachlor, and picloram, long-term composting trials showed that either no concentration reduction occurred or if degradation occurred, it did not degrade to a sufficient extent to be used in gardens or in plant growth media (i.e., final composts were phytotoxic) (Michel et al., 2012; Recycled Organics Unit, 2004).
Persistent Chemical Contaminants 47
Digestates
No studies were available that measured concentrations of clopyralid, aminopyralid, picloram, or aminocyclopyrachlor in both feedstocks and their corresponding digestate. Other pesticides were investigated by Hellstrom et al. (2011) who showed that mean concentrations increased or decreased in digestate depending on the pesticide and on whether the digestate was produced through mesophilic (37°C) or thermophilic (55°C) processing. According to a survey in 2019 of U.S. anaerobic digestion facilities that accepted food waste, of 112 facilities that responded, 71 percent used mesophilic conditions, 13 percent used thermophilic conditions, 12 percent reported unheated conditions, and the remaining 4 percent did not report a temperature range, or indicated that they operated at both mesophilic and thermophilic temperatures (U.S. EPA, 2021b). The mean concentration of bromopropylate was 22 µg/kg dw in the feedstock, 14 µg/kg dw in the mesophilic digestate, and 57 µg/kg dw in the thermophilic digestate (Hellstrom et al., 2011). However, for endosulfan-α, the mean concentrations were 5.2, 2.4, and 1.7 µg/kg dw for feedstock, mesophilic digestate, and thermophilic digestate, respectively. These two examples demonstrate the difficulty in predicting whether pesticide levels would increase or decrease following anaerobic digestion.
3.7. Safety Thresholds and Standards for Pesticides in Composting and Anaerobic Digestion
There are no concentration limits for pesticides under federal regulation 40 CFR Part 503 for the management of biosolids. Further, pesticide testing is not currently required by the U.S. Composting Council’s Seal of Testing Assurance (STA) Program, which tests, labels, and discloses information on composts (USCC, 2020c). Composting facilities may choose to conduct pesticide testing, especially for persistent herbicides, for both feedstocks and compost. However, the capability to test for persistent herbicides at low enough concentrations is not widely available. Some persistent herbicides are phytotoxic at very low levels (1–10 µg/kg) which are below the limit of quantification in many local or state-level laboratories. Highly sensitive equipment is needed in these cases and sample analysis can be very expensive. Some composting facilities conduct plant growth (i.e., bioassay) tests to evaluate damage caused by finished compost, but the results are qualitative, and these tests are not a standardized practice. In cases where damage is observed, composters may follow up with analytical testing, but this is not a requirement. Given the lack of widespread analytical capacity, it remains a challenge for the composting industry to quickly and inexpensively test composts and compost feedstocks for these herbicides (Coker, 2014; USCC, 2013).
3.8. Data Gaps for Pesticides Data were not available to determine the concentration of clopyralid, aminopyralid, picloram, and aminocyclopyrachlor (or any other pesticide) in 100 percent food waste. There was no information on contribution of different types of food waste to the overall compost pesticide concentrations and whether there could be differences between commercial and residential food waste. Limited data available from mixtures containing food waste enabled estimation of whether some pesticide concentrations in food waste/food waste compost would be higher or lower than concentrations in green waste/green waste compost, but not for the persistent herbicides that are the focus of this issue paper. No data were available on pesticides in food contact materials nor were there data that would allow for estimation of relative pesticide concentrations in anaerobic digestates made from food waste. Comparisons made in this section were based on a limited number of pesticides and therefore are not necessarily representative of pesticide concentrations more broadly.

Persistent Chemical Contaminants 48
3.9. Summary of Persistent Pesticides For the four persistent herbicides of interest, no studies were identified that reported concentrations in food waste alone. However, based on the registered use sites of these persistent herbicides, only clopyralid is likely to be found in food waste. Even then, its concentration is likely diluted by the wide variety of foods found in municipal food waste and the addition of bulking agents required for composting. Based on documented cases of compost contamination that link the presence of persistent herbicides to contaminated green waste and manure, food waste is likely not a major source of contamination in composts. As such, persistent pesticides will not be further discussed in this issue paper. It should be noted that because food waste is invariably mixed with green waste, manure, and other organic feedstocks, which may be contaminated with persistent pesticides, the associated compost may also be contaminated. Further research on the prevalence of the four persistent herbicides of interest in commercial composts would help determine which amendments to avoided when composting with food waste.
Persistent Chemical Contaminants 49
4. OTHER PERSISTENT CHEMICAL CONTAMINANTS This section briefly summarizes information available for two other persistent chemical contaminants, PCBs and PAHs, that have been measured in food waste or associated products in recent scientific literature.
4.1. Polychlorinated Biphenyls PCBs are synthetic chemicals that were once widely used in industrial and commercial applications due to their chemical stability, electrical insulating properties, and resistance to temperature change (U.S. EPA, 2020n). Manufacture of PCBs was banned in the United States in 1979 after adverse health effects were identified; however, PCBs may still be present in products produced before the ban. EPA developed an oral reference dose of 0.020 µg PCB/kg body weight/day (U.S. EPA, 2017a; ATSDR, 2000) and FDA set tolerance levels for PCBs as “unavoidable poisonous or deleterious substances” in food that range from 200 to 3,000 µg/kg (FDA, 2020b, 2000). National drinking water MCLs for PCBs is 0.5 µg/L (U.S. EPA, 2021j).
PCBs in Food Waste
In a review of field studies from the United States and Europe, Brandli et al. (2005) compiled data from the literature and reported median concentrations of the sum of seven (∑7) PCBs [PCB 28, PCB 52, PCB 101, PCB 138, PCB 153, PCB 180—the seven PCBs recommended for monitoring by the International Council for the Exploration of the Seas (ICES)] in kitchen waste and other feedstocks, where kitchen waste consisted of crude organic waste originating from private kitchens. The median concentrations for ∑7 PCBs in kitchen waste was 14.9 µg/kg dw, which was similar to that reported for green waste and for organic household waste (defined as a mixture of kitchen waste, green waste, and small amounts of paper). The ∑7 PCBs were lower in bark, grass, and shrub clippings (which ranged from 5.4 to 9.8 µg/kg dw) and higher in foliage (36.6 µg/kg dw), with the authors suggesting that the higher concentrations in foliage may be due to its filtering effects for semi-volatile organic compounds (Brandli et al., 2005). The similar concentrations of PCBs between kitchen waste and green waste were confirmed in a follow-up study by Brandli et al. (2007c), where the ICES seven PCBs were measured in Swiss green waste alone and in mixtures of organic kitchen waste and green waste.
PCBs in Food Contact Materials Because of their prohibition, PCBs are not expected to be present in food contact materials. No recent studies identified reported concentrations of the seven ICES PCBs in food contact materials, although surveys conducted before the ban on PCBs did demonstrate PCB contamination (Sawhney and Hankin, 1985).
However, a less-studied PCB congener, PCB 11, was detected in food packaging materials in a study conducted by the State of Washington (Stone, 2014). PCB 11 is inadvertently created during the production of diarylide yellow pigment. Among the various samples tested, the highest concentration of PCB 11 occurred in packaging for a cheese and crackers snack at 48.5 µg/kg.
PCBs in Compost
In Lithuania, Barcauskaitė (2019) reported that all seven ICES congeners were detected in composts produced from food waste, with concentrations ranging from 0.87 (PCB 153) to 5.4 (PCB 138) µg/kg dw. The ∑7 PCBs in food waste compost (18.5 µg/kg dw) was higher than in cattle manure compost (2.7 µg/kg dw), slightly higher than in green waste compost (15.1 µg/kg dw), and lower than in sewage sludge (59.9 µg/kg dw) and mixed municipal waste (67–253 µg/kg dw) composts. These results were similar to those reported by Višniauskė et al. (2018), where PCBs were highest in sewage sludge compost and lowest in cattle manure compost. Actual PCB levels in composts were lower in Višniauskė et al. (2018), with ∑8 PCBs (the seven ICES PCBs plus PCB 163) concentrations at 2 µg/kg dw in food waste compost.

Persistent Chemical Contaminants 50
The higher concentrations of PCBs in food waste compost compared with green waste compost were also consistent with findings in Europe from Brandli et al. (2005), Brandli et al. (2007b), and Benisek et al. (2015). In Brandli et al. (2005), median concentrations of ∑6 PCBs (PCB 28, PCB 52, PCB 101, PCB 138, PCB 153, PCB 180) were reported for composts produced from organic household waste (i.e., mixture of kitchen waste, green waste, and small amounts of paper) and composts produced from green waste. The ∑6 PCBs in organic household waste and in green waste composts were found to be 39.8 and 30.6 µg/kg dw, respectively. In Brandli et al. (2007b), an analysis of the supporting information showed that, in general, PCB concentrations in composts made from a mixture of green waste and kitchen waste were >30 percent above those reported for composts from green waste. Benisek et al. (2015) also reported the ∑6 PCBs (the same congeners reported in Brandli et al. (2005) – PCB 28, PCB 52, PCB 101, PCB 138, PCB 153, PCB 180) ranging from 18 to 44 µg/kg dw in composts produced from a mixture of household organic waste with green waste and from 15 to 18 µg/kg dw in composts produced from green waste alone. Only one study showed the opposite trend, where ∑7 PCBs in composts from organic kitchen waste and green waste were lower than ∑7 PCBs in composts from green waste alone (Brandli et al., 2007c).
PCBs have been shown to degrade during composting. In a field study where PCB-contaminated soil was composted with yard trimmings for 370 days, up to 40% total PCB loss was reported with yard trimmings amendment levels of 60% and 82% (Michel Jr. et al., 2001). The majority of the decrease in PCB concentration occurred in the initial 70 days of composting. Congener specific PCB analysis indicated that less chlorinated PCB congeners (1-3 chlorines per biphenyl) were preferentially degraded during composting.
PCBs in Anaerobic Digestate
Brandli et al. (2007c) reported concentrations of PCBs in anaerobic digestate produced from kitchen waste, which later served as feedstock for composting. PCB 28 was not detected, whereas the concentrations for the remaining six ICES congeners ranged from 2.4 to 5.1 µg/kg dw. This range is slightly higher than the ranges for the individual congener concentrations reported by Hellstrom et al. (2011) for mesophilic (1.5–3.2 µg/kg dw) and thermophilic (0.5–2.7 µg/kg dw) anaerobic digestates produced from the biodegradable fraction of household waste, in which PCB 28 also was not detected. In a report by WRAP (2011) the concentrations for ∑7 PCBs (as well as for each individual congener) was higher in digestate produced from food waste than in the digestate produced from livestock slurry (i.e., mixture of manure and water) at concentrations of 4.0 and 1.8 µg/kg dw, respectively.
Regulations for PCBs in Land-applied Products
There are no concentration limits for PCBs under federal regulation 40 CFR Part 503, which governs the management of biosolids, and similarly, the U.S. Composting Council’s STA Program does not require testing for PCBs. While dioxin-like coplanar PCBs were initially considered in the second round of rulemaking, EPA ultimately concluded, based on risk assessments, that existing regulations are adequate to protect public health and the environment from the reasonably anticipated adverse effects of dioxins and dioxin-like compounds in sewage sludge that is incinerated and surface-disposed (National Archives and Records Administration, 2001) and land applied (National Archives and Records Administration, 2003). Regulations for disposal of PCBs exist under the Toxic Substances Control Act (TSCA), however these regulations apply only for items containing ≥50,000 µg/kg of PCBs (FDA, 2019a).

Persistent Chemical Contaminants 51
Summary of PCBs
The PCBs ban in the United States is reflected by the lack of recent studies in the literature with U.S. data on PCBs in food waste and its associated compost or digestate. Data were available from outside the United States and showed that PCB concentrations are expected to be similar between kitchen waste and green waste. In composts, results were inconsistent across studies, with concentrations in food waste compost either higher, lower, or similar to concentrations in green waste compost. However, both food waste and green waste composts had lower concentrations than compost made from sewage sludge. A field study where PCB-contaminated soil was mixed with yard trimmings reported that less chlorinated PCB congeners were preferentially degraded during composting. Given the ban on PCBs and the lack of recent U.S. compost/digestate data, PCBs will not be further discussed in this issue paper.
4.2. Polycyclic Aromatic Hydrocarbons PAHs are found in natural hydrocarbon sources such as crude oil and are produced during the burning of coal, oil, gas, wood, garbage, and tobacco, as well as during high-temperature cooking and from industrial sources. Certain PAHs, such as naphthalene, may also be manufactured commercially (U.S. EPA, 2009). EPA has classified some PAHs as probable human carcinogens (ATSDR, 2009) and developed reference doses for anthracene, acenaphthene, fluoranthene, fluorene, and pyrene, which range from 30 to 300 µg/kg body weight/day (ATSDR, 1995). For various color additives, FDA limited total PAHs to 500 µg/kg, with benzo[a]pyrene limited to 5 µg/kg (FDA, 2020b). Only benzo[a]pyrene has a national drinking water MCL of 0.2 µg/L (U.S. EPA, 2021j).
PAHs in Food Waste No studies were identified that reported concentrations of PAHs in food waste. Brandli et al. (2005) reviewed data from field studies on various composts and feedstocks from the United States and Europe and reported that no data were available for kitchen waste alone; the studies from the United States were for green waste alone. The median concentration for the sum of 16 PAHs (∑16 PAHs) – acenaphthene, acenaphthylene, anthracene, benzo[a]anthracene, benzo[a]pyrene, benzo[b]fluoranthene, benzo[g,h,i]perylene, benzo[k]fluoranthene, chrysene, dibenz[a,h]anthracene, fluoranthene, fluorene, indeno[1,2,3-cd]pyrene, naphthalene, phenanthrene, pyrene – was reported as 635 µg/kg dw for organic household waste, which was a mixture of kitchen waste, green waste, and small amounts of paper. This was lower than the median concentration of 1,803 µg/kg dw reported for green waste alone. The difference in concentration for ∑16 PAHs between organic household waste and green waste suggests that the concentration of ∑16 PAHs in kitchen waste may be lower than that for green waste. These results are consistent with those from a follow-up study by Brandli et al. (2007c) in which PAH concentrations were lower in the organic kitchen waste and green waste mixture than in green waste alone.
PAHs in Food Contact Materials
PAHs have been detected in polystyrene-based food contact materials (Schweighuber et al., 2019; Li et al., 2017). In Schweighuber et al. (2019), 14 single-use polystyrene-based products (e.g., fork, knife, coffee cup, plate, box) were purchased from local Austrian supermarkets and tested for the presence of PAHs and the migration of PAHs into a food simulant. Acenaphthene, naphthalene, and phenanthrene were found in all product samples, with the highest ∑15 PAHs detected in a party-skewer sample at >250 µg/kg. Migration experiments demonstrated that PAHs were able to migrate into 95 percent ethanol, a simulant for fatty foodstuff, with greater migration observed in food contact materials made from extruded polystyrene foam (compared with polystyrene alone).
These results were consistent with the findings reported by Li et al. (2017), in which eight PAHs with ≤4 rings (naphthalene, acenaphthylene, acenaphthene, fluorene, phenanthrene, anthracene, fluoranthene, and pyrene) were detected in 21 polystyrene-made food contact materials purchased from local Chinese supermarkets. PAHs
Persistent Chemical Contaminants 52
with >4 rings were not detected in any of the samples. The ∑8 PAHs ranged from 18.9 to 476 µg/kg for colorless fruit forks to foam instant noodle containers, respectively, with naphthalene and phenanthrene detected in all samples and at the highest concentrations. Higher concentrations of PAHs were also found in colored products than in colorless products, and in expanded polystyrene versus extruded polystyrene food contact materials. Although Li et al. (2019) did not experimentally test the migration of PAHs into food simulants, the authors estimated the migration into water and showed that migration was possible.
PAHs in Compost
In a study that examined composts made from five different feedstocks, Višniauskė et al. (2018) found the four most common PAHs, among the 16 PAHs evaluated, were acenaphthylene, fluorene, phenanthrene, and dibenzo[a,h] anthracene. The mean concentration of ∑16 PAHs in food waste compost ranged from 740 to 1,830 µg/kg dw for the two years of data evaluated and was slightly higher than that in green waste compost (830–1,370 µg/kg dw). Compost made from sewage sludge and anaerobic digestate had the highest mean concentrations of ∑16 PAHs, with values up to 5,700 and 7,110 µg/kg dw, respectively. Cattle manure compost had the lowest ∑16 PAHs levels (740–570 µg/kg dw). Benisek et al. (2015), Brandli et al. (2007b), and Brandli et al. (2005) measured concentrations in composts made from mixtures with and without food waste. For all three studies, a comparison of the data between composts with and without food waste suggested that concentrations of PAHs are higher in kitchen waste/food waste compost than in green waste compost. Benisek et al. (2015) reported median concentrations for ∑19 PAHs in composts in highest to lowest order: organic household waste compost (1,600 µg/kg dw) > sewage sludge compost (1,300 µg/kg dw) > green waste compost (1,200 µg/kg dw) > municipal solid waste compost (690 µg/kg dw). Only one study (Brandli et al., 2007c) reported no clear trend between green waste compost and composts produced from a mixture of organic kitchen waste and green waste.
PAHs in Anaerobic Digestate No studies were identified that measured PAHs in anaerobic digestates produced solely from food waste. Although Brandli et al. (2007b) reported PAH concentration in digestates, the data available in the supporting information were for digestates produced from mixtures of (i) green waste with kitchen waste and (ii) green waste, kitchen waste, and industrial waste. There were no data on digestates produced from green waste alone and therefore no comparisons could be made to evaluate whether food waste digestates would have higher, similar, or lower PAH concentrations compared with other nonfood waste digestates. Other studies in the literature also report PAH concentration in digestates, but the feedstocks used did not allow concentrations of PAHs in food waste digestates to be determined (Benisek et al., 2015).
Regulations for PAHs in Land-applied Products PAHs are not regulated under federal regulation 40 CFR Part 503 for the management of biosolids, and similarly, the U.S. Composting Council’s STA program does not require testing for PAHs.
Summary of PAHs
There were no recent studies in the literature with U.S. data on PAHs in food waste and its associated compost or digestate. Data were available from outside the United States that suggest PAH concentrations are higher in green waste compared to food waste. For composts, food waste compost generally had higher concentrations of PAHs when compared with green waste compost, possibly due to contamination with food contact materials made of polystyrene, which has been documented to contain PAHs. Given the lack of recent U.S. compost/digestate data, PAHs will not be further discussed in this issue paper.

Persistent Chemical Contaminants 53
5. IMPLICATIONS OF PFAS ON MARKETABILITY AND USE OF FOOD WASTE COMPOST AND DIGESTATE
Of the persistent chemical contaminants that have been discussed in this issue paper, food waste remains a potential important pathway by which compost or digestate may become contaminated only for PFAS. As such, the remaining sections in this issue paper only discuss PFAS.
The presence of PFAS in food waste and its composts and digestates has far-reaching implications. Concerns about contamination can, and have, affected decisions and policies applicable to food waste collection, management, processing, and, consequently, the reduction of food waste. Those implications may transpire whether contaminants are actually present or not in a particular instance or, if they are present, whether their levels are potentially harmful to human health or the environment. This section briefly describes, using illustrative examples, the potential effects that PFAS, or their suspected presence, can have on food waste products with respect to (i) the market for the product and (ii) the requirements for a compost to be certified as organic.
Market Market impacts are associated with known, potential, and perceived risks from PFAS. While the risks associated with PFAS in compost have not been determined, the potential or perceived risk has affected not just composting facilities, but also facilities that provide the feedstock. No examples were identified in the literature where food waste feedstock was turned away by a composting or anaerobic digestion facility due to known or suspected presence of persistent chemical contaminants, but compost facilities have ceased production or sales once contamination was detected. For example, in 2017, the combined concentration of PFOA and PFOS was 0.24 µg/L in a stormwater collection pond and 0.160 µg/L at an on-site groundwater well at a composting facility that used paper mill residuals as its feedstock. At the request of the state, the composting facility stopped producing and distributing its compost. The paper mill that had supplied the feedstock was required to send its residuals to the landfill (Beecher and Brown, 2018b). In another example, a composting facility voluntarily stopped sales of its compost after PFAS were detected during screening and testing (Coker, 2020a).

Persistent Chemical Contaminants 54
TABLE 6. ALLOWED FEEDSTOCKS AND PROHIBITED MATERIALS FOR ORGANIC COMPOSTS
Feedstock Feedstock Examples Prohibited Materials
Food processing waste / agricultural byproducts
Tomato puree, grape pomace, rice hulls, mushroom growing media; cannery
wastes and cannery wastewater
No additives added after material becomes waste
stream
Green wastea
Food residues, paper, food soiled paper (coffee filters, paper cups, plates), raw
wood (sawdust, chips), stumps, prunings, bark, grass clippings
No plastic utensils, bioplastics, Styrofoam, plastic mulches,
materials recovered from mixed municipal solid waste
Source: Kennedy (2020) aThe definition of green waste here differs from the definition used in the rest of the paper. Green waste is defined by the National Organic Program as “Biodegradable waste that can be composed of garden or park waste, such as grass or flower cuttings and hedge trimmings, as well as domestic and commercial food waste. Green waste is often collected in municipal curbside collection schemes or through private waste management contractor businesses” (USDA, 2020a).
Organic Compost Certification
The USDA National Organic Program requires that the composts used in organic agriculture be made from allowed feedstocks, which cannot include sewage sludge or certain non-synthetic substances listed in 7 CFR 205.602. Certain synthetic substances listed in 7 CFR 205.601 are allowed for organic agriculture applications (USDA, 2020a). Table 6 lists the allowed feedstocks and materials considered by the Organic Materials Review Institute (OMRI) to be prohibited9 according to USDA rules (Kennedy, 2020). There are currently no specific guidelines or standards for persistent chemical pollutants, including emerging contaminants such as PFAS, for compost used in organic farming. However, it is a requirement that the compost “producer must manage plant and animal materials to maintain or improve soil organic matter content in a manner that does not contribute to contamination of crops, soil, or water by plant nutrients, pathogenic organisms, heavy metals, or residues of prohibited substances.” (7 CFR 205.203, (USDA, 2020a)).
Summary of PFAS Implications
Whether or not PFAS are actually present in food waste, their potential presence can impact the marketability of food waste compost and its use in organic farming. While there are currently no national standards for PFAS in composts, some states have established screening steps (e.g., Maine requires biosolids compost to be tested for PFOA, PFOS, and PFBS). Standards can be developed in the future if levels are determined to possibly reach risk-based levels of concern. Developing PFAS standards for compost would benefit the marketability of composts by strengthening confidence in product quality and safety.
________________ 9 USDA sets the regulations on feedstocks and materials that are prohibited. OMRI translates USDA materials into lists and guides targeted to the consumer.

Persistent Chemical Contaminants 55
6. RISKS TO HUMAN HEALTH AND THE ENVIRONMENT DUE TO LAND APPLICATION OF PFAS-CONTAMINATED COMPOST OR DIGESTATE
Much remains unknown about the risks to human health and the environment posed by the land application of food waste compost and anaerobic digestate containing PFAS. Full risk assessments are not available and the data needed to estimate with confidence the human health and environmental risks are very limited. One of the primary concerns about PFAS in land-applied compost or digestate is that it may transfer to the soil, be taken up by plants and crops, or leach into groundwater.
This section summarizes examples of previous risk-assessment studies that may be relevant to land application of food waste composts or digestates, specifically (i) the U.S. regulations on biosolids produced from sewage sludge and (ii) risk assessments on compost or digestate produced from mixed feedstocks that may contain food waste. Because previous risk assessments are limited with respect to persistent contaminants in food waste, this section concludes by summarizing the data needed to support a robust assessment of risks associated with land application of food waste compost or digestate. A brief discussion is also provided on options for food waste management, potential pathways of exposure, levels of exposure, and the data needed to perform a comparative risk analysis.
6.1. Regulations on Application of Biosolids EPA conducted two rounds of risk assessment to identify the chemical contaminants included in the federal regulations (40 CFR Part 503) governing land application of biosolids from municipal wastewater treatment facilities. As part of Round 1 in the mid-1980s, EPA used the following criteria to determine whether a contaminant was exempt from regulation:
(i) The pollutant has been banned from use, has restricted use, or is no longer manufactured for use in the United States,
(ii) The pollutant has a low frequency of detection in sewage sludge (less than 5 percent) based on data from the National Sewage Sludge Survey (NSSS), or
(iii) The concentration of the pollutant in sewage sludge is already low enough that the estimated annual loading to cropland soil would result in an annual pollutant-loading rate within allowable risk-based levels (NRC, 2002).
Applying these criteria in Round 1 resulted in only inorganic chemicals being regulated under the Part 503 rule, with organic contaminants exempt. In Round 2 in the mid-1990s, over 400 chemical contaminants were initially considered for regulation; however, contaminants were eliminated if (i) they were not detected or detected in less than 10 percent of sewage sludge based on the NSSS data or (ii) they lacked sufficient toxicity data (NRC, 2002). Limits were not set for any of the persistent chemical contaminants discussed in this issue paper, although dioxin-like coplanar PCBs were initially considered in Round 2. EPA ultimately concluded based on risk assessments that existing regulations are adequate to protect public health and the environment from the reasonably anticipated adverse effects of dioxins and dioxin-like compounds in sewage sludge that is incinerated and surface-disposed (National Archives and Records Administration, 2001) and land applied (National Archives and Records Administration, 2003). Note that while not regulated under the Part 503 rule, regulations do exist under 40 CFR Part 761 for disposal of items with PCB concentrations greater than 50,000 µg/kg dw (FDA, 2019a).
In 2001, EPA requested that the National Research Council (NRC) of the National Academy of Sciences independently review the technical basis of the chemical and pathogen regulations for biosolids. The resulting NRC report concluded that there was no documented evidence that Part 503 failed to protect public health (NRC,

Persistent Chemical Contaminants 56
2002). NRC (2002) also noted that additional scientific research was needed to address uncertainties regarding the safety of land application of biosolids. Specifically, the decision to regulate certain contaminants relied largely on the data available from the NSSS, conducted in 1988, and the presence and concentration of contaminants now present in biosolids may have changed since then. A previous NRC report also noted limitations of the sampling and analytical methods of the NSSS (NRC, 1996). Additionally, there may be toxicity data that were not available in 1996 that can support an updated risk assessment. In response to the NRC (2002) report, EPA conducted a review of the existing sewage sludge regulations and developed a 14-Point Action Plan, which included activities such as biennial reviews of sewage sludge standards, methods development and validation, field studies of sewage sludge, and targeted national survey of pollutants in sewage sludge (U.S. EPA, 2003). The biennial reviews identify publicly available data on newly or previously identified pollutants that have been measured in biosolids and sets regulations for these pollutants if sufficient scientific evidence is available to demonstrate harm to human health or the environment (U.S. EPA, 2021d). For example, in its 2013, 2015, 2017, and 2019 biennial reviews, EPA identified multiple PFAS as new chemicals with concentration data in biosolids; however, no human health toxicity data were identified (U.S. EPA, 2021c).
In 2018, the U.S. EPA Office of Inspector General (OIG) performed an audit on whether EPA’s controls over land application of biosolids were protective of human health and the environment (U.S. EPA, 2018c). The audit found that EPA’s controls were incomplete or had weaknesses and, as a result, EPA’s controls might not fully protect human health and the environment. Between 1989 and 2015, EPA identified 352 contaminants in biosolids but could not evaluate whether these contaminants should be regulated due to lack of data or lack of risk-assessment tools. Without performing a risk assessment on these contaminants, the 2018 audit report concluded that EPA cannot determine whether land application of biosolids is safe for human health and the environment.
In response to the EPA OIG report, the USDA National Institute of Food and Agriculture (NIFA) provided its own review and response (USDA, 2020b). USDA NIFA’s response indicated that the report did not consider concentrations of chemicals found in the biosolids when considering risk and that sufficient data and research are available to conclude that the biosolids regulations are protective of human health and the environment. For PFAS specifically, with the exception of a few, rare worst-case scenarios where the biosolids were industrially impacted, the literature does not show cases of excessive human exposure associated with the use of biosolids in agriculture (Lee, 2020). In addition, EPA’s Office of Water is currently undertaking several corrective actions to provide appropriate risk communication (e.g., through revisions to the EPA biosolids website) with respect to data gaps and unregulated pollutants (U.S. EPA, 2019g). Thus, given the existing state of knowledge, generalizing from the EPA sewage sludge risk studies to persistent contaminants in food waste appears to be of limited value.
The data on persistent chemical contaminants summarized in the previous sections are for contaminant concentrations, which can be used in exposure models to determine dose. The limited data indicated that composts produced from sewage sludge generally had higher concentrations of contaminants when compared with composts produced from food waste though comparative data were not available for all contaminants of concern. This suggests that the results of previous and future risk assessments conducted in support of 40 CFR Part 503 and from the biennial reviews could be, in part, relevant to food waste composts and digestates, as they could provide an upper estimate of risk for food waste composts and digestates. An updated risk assessment using data from food waste composts and digestates, particularly for emerging chemical contaminants, should be conducted in order to draw any general conclusions about risk with confidence. The risk assessment methodology for biosolids land application can be used taking into account key parameters such as agronomic rates and application frequency, water content of the compost, and chemical concentrations.
Persistent Chemical Contaminants 57
6.2. Risk Studies for Compost or Digestate The risk-assessment studies discussed in this section focus on compost and digestate produced from various types of mixed feedstocks (i.e., food waste mixed with other feedstock materials). No assessments are available for compost and digestate produced from food waste only because facilities typically do not process food waste unmixed with other feedstocks.
Wood (2019) prepared an environmental and human health risk assessment for the European Commission on contaminants in composts and digestates produced from various feedstocks, some of which may include food waste and food contact materials (e.g., municipal solid waste). The risk of various contaminants of concern (i.e., cadmium, nickel, lead, copper, zinc, mercury, PCB 28, benzo[a]pyrene, chrysene, benz[a]anthracene, benzo[b]fluoranthene, indeno[1,2,3-cd]pyrene, PFOA, PFOS, PFHxA, and others) were evaluated under two scenarios: (i) application of compost or digestate to land as a soil conditioner and fertilizer and (ii) use of compost or digestate in containers as a growing medium (e.g., for domestic gardens). Predicted no-effect concentrations could be calculated only for contaminants such as heavy metals where a threshold dose exists below which toxicity does not occur.
For contaminants without an effects threshold value (meaning there is no dose below which toxic effects are not expected), a risk characterization ratio could not be calculated; therefore, Wood (2019) qualitatively assessed the contaminant levels in compost or digestate according to how these contaminants transfer between the various environmental media (e.g., soil to groundwater used as a source of drinking water; soil to air). Wood (2019) indicated that both PFOA and PFOS, for which no threshold value exists, should be prioritized for risk management because of predicted environmental concentrations, the contribution of compost or digestate to total background levels, or predicted exposures; however, a detailed risk assessment for PFOA and PFOS was not performed.
In a report commissioned for the Scottish Environmental Protection Agency (wca environment Ltd., 2019), the authors measured concentrations of specific PFAS, among other contaminants, in composts and digestates and estimated risk to human health and soil quality following land application. For composts produced from (i) green waste and (ii) green waste/food waste, risk characterization ratios10 were >1 for PFOS at the highest tonnages and applications, indicating potential risk. For digestates, risk characterization ratios were always <1 under all scenarios considered for all chemicals evaluated. However, the wca environment Ltd. (2019) noted that their measured contaminant concentrations were lower than those reported in the literature and indicated that the results of their assessment were based on a limited dataset for a small number of contaminants, indicating a need for further monitoring. In addition, wca environment Ltd. (2019) acknowledged that there are considerable uncertainties in the predicted no-effect concentrations used to calculate the risk characterization ratios.
In a review of multiple risk assessments conducted between 2008 and 2011 by the Waste and Resources Action Programme (WRAP (2011)), a UK-based nonprofit organization, on composts and anaerobic digestates produced from source-segregated biodegradable materials, Longhurst et al. (2019) indicated that food waste feedstocks that undergo composting and anaerobic digestion are expected to contain negligible chemical contamination. Summarizing a WRAP report, Longhurst et al. (2019) noted that PFOS and its derivatives were not detected in any of the digestate samples made from food waste. However, PFHpA and PFNA were detected at 24 and 6.32 µg/kg dw in livestock manure; chemical hazard quotients11 for PFAS were not reported in the paper. Because the WRAP UK risk assessments were conducted between 2008 and 2011, updated assessments are needed using more recent data on potential exposure for PFAS to determine whether detailed risk assessments should be conducted.
Ghisi et al. (2019) highlighted some limitations in risk assessments, pointing out that assessments that use only ________________ 10 Risk characterization ratio is defined in wca environment Ltd. (2019) as PEC/PNEC, where PEC = predicted environmental concentrations and PNEC = predicted no-effect concentration. A risk characterization ratio ≥1 indicates potential risk. 11 Hazard quotient is defined in Longhurst et al. (2019) as, “…a ratio of potential exposure to a substance and the level at which no adverse effects are expected. If the hazard quotient is estimated to be <1, no adverse health effects are expected as a result of exposure.”
Persistent Chemical Contaminants 58
one or two representative contaminants (e.g., using PFOA and PFOS as indicators of all PFAS) do not necessarily represent all potential risks. For example, if assessing plant uptake following application of contaminated biosolids, Blaine et al. (2013) reported only PFBA and PFPeA detected in maize stover (which is made up of the leaves, stalks, and cobs of maize plants), with PFOA and PFOS below the limit of quantification. If a risk assessment were conducted using only PFOA and PFOS data from Blaine et al. (2013), the results would not reflect the exposure to other PFAS that were detected.
Other risk assessments related to land application of various materials that do not provide additional information directly relevant to PFAS for land application of food waste compost and digestate are not included in this issue paper. The studies summarized above, including comprehensive peer-reviewed EPA studies related to sewage sludge biosolids and the three recent European assessments of composts or digestates from various feedstocks, are provided as examples of the state of the science and the types of assessments that have been performed to evaluate contaminant exposure and risk from land application of biosolids, composts, or digestates.
6.3. Comparison of Food Waste Management Options As food becomes “waste,” it must go somewhere. Therefore, when adequate data becomes available, risk should be examined not only as an absolute, but rather relative to the risk of other potential pathways for food waste. In addition, consumption of food containing PFAS can be regarded as a benchmark. Much food waste is landfilled, sent directly “down the drain” (i.e., into the sewer and WWTP), incinerated, or used as animal feed in the United States. Quantitative analyses of exposure and risk comparing these options to composting and anaerobic digestion of food waste are not available to determine whether one option presents less risk than the others to human health and the environment due to persistent chemical contaminants. Some general observations about persistent chemical exposure pathways, exposure levels, and potential risks are presented below. Broader environmental impacts (e.g., greenhouse gas emissions) and benefits (e.g., energy generation and soil enhancement) for each option are not discussed here.
Landfill
EPA estimates that more food reaches landfills and incinerators than any other single material in our everyday trash, constituting more than 24 percent of landfilled municipal solid waste in 2016 (U.S. EPA, 2020j). Recent research by EPA also indicated than landfilling was the primary disposal pathway of food waste in 2018, with an estimated 36 percent of food waste going to landfills (U.S. EPA, 2020b). Municipal solid waste landfills are regulated under the Resource Conservation and Recovery Act (RCRA) Subtitle D in the United States. This requires that landfills be designed with liners, leachate collection systems, groundwater monitoring programs, and other measures to control potential contamination of groundwater or surface water. When these systems are working properly, landfill leachate should not infiltrate/leak into surrounding soil and groundwater or run off to surface water.
Studies show that municipal solid waste landfill leachate contains PFAS, with predominantly shorter-chain perfluoroalkyl acids present (Wei et al., 2019). Within the United States, PFAS concentrations in landfill leachate (from food waste and other source materials) have ranged from 0.01 to 8.9 µg/L for PFCAs (e.g., PFBA and PFHxA) and from 0.05 to 3.2 µg/L for perfluoroalkyl sulfonic acids (PFSAs)(e.g., PFBS and PFHxS), depending on the solid waste, the landfill age, and climate conditions, among other factors (Wei et al., 2019).
Some exceptions apply, with higher PFAS concentrations observed in specific landfills. For example, Masoner et al. (2020) reported total PFAS concentration of 48 µg/L in untreated leachate from one municipal landfill that accepted municipal waste, construction/debris, and other waste (ash, biosolids, non-hazardous industrial waste) at compositions of 54%, 26%, and 20%, respectively. Treated leachate from two municipal landfills that accepted mainly municipal waste and construction/debris had PFAS concentrations of 19.8–24.6 µg/L (Masoner et al., 2020).

Persistent Chemical Contaminants 59
Landfill leachate is often treated offsite at WWTPs, which can present its own risks to human health and the environment. Although research to date has been limited, some studies demonstrate that PFAS are difficult to treat by WWTPs and that secondary treatment in activated sludge can increase the effluent concentrations of certain PFAS (e.g., PFOA, PFOS, PFNA, PFDA, PFUdA) due to the transformation of their precursors (Sinclair and Kannan, 2006). PFAS can therefore be present in both WWTP effluent and also in sludge (Sinclair and Kannan, 2006). The effluent can be discharged into surface waters and the sludge may be used to produce biosolids for land application.
When landfill leachate is sent to a WWTP, an additional source of PFAS is introduced to WWTPs. WWTP influents that receive landfill leachate can have higher concentrations of PFAS compared with other WWTP influents that do not receive landfill leachate. In a study comparing PFAS concentrations from three WWTPs receiving landfill leachate and two WWTPs that did not receive leachate, concentrations in landfill leachate for PFHxA (8.3 µg/L), methyl perfluoropentane sulfonamido acetic acid (MePFeSAA) (7.6 µg/L), PFHpA (6.5 µg/L), and PFOA (4.8 µg/L) were much higher than influent samples (0.47, 0.048, 0.35, and 1.4 µg/L, respectively), with some PFAS (i.e., PFNA, PFDoA, PFPeS, among others) detected only in the leachate samples (Masoner et al., 2020). A comparison of WWTP influents with and without leachate addition showed that landfill leachate is a significant contributor in the influent of some wastewater facilities for PFOA, PFOS, PFDA, PFHxA, MeFBSAA, ethyl perfluoropentane sulfonamido acetic acid (EtFPeSAA), 3-perfluoropentyl propanoic acid (5:3)(FPePA), and 2-perfluorooctylethanoic acid (FOEA).
However, when PFAS concentrations in effluent were compared in this one study between WWTPs that received landfill leachate and WWTPs that did not receive landfill leachate, no clear differences were observed in total PFAS concentrations. For some PFAS (PFOA, PFHxA, PFPeA, PFHpA, MeFBSAA, PFBS, and PFHxS), effluent loads (measured in g/day) were higher than influent loads due to the transformation of precursors (Masoner et al., 2020). Sludge samples were not measured for PFAS, but, given that PFAS are difficult to treat and with no clear difference in effluent WWTP samples, this suggests that some PFAS concentrations may be higher in sludge samples from WWTPs that receive landfill leachate than in those that do not. For example, WWTP sludge samples in Michigan showed that long-chain PFAS were more frequently detected in biosolids/sludge while short-chain PFAS were more frequently detected in the influent/effluent (Michigan EGLE, 2020). To better understand the impacts of the disposal of landfill leachate into WWTP influents, further studies are needed to determine the fate of PFAS through various wastewater and solids treatment processes, taking into consideration concentrations in the influent and effluent as well as in the solids generated, and examining transformations of PFAS and their precursors during biological treatment as well as separation and sorption of PFAS into sludge solids.
Down the Drain Food waste is often sent down the drain (via an in-sink garbage disposer or a commercial food grinder or liquifier) directly into the sewer system connected to a WWTP. If food waste is contaminated with PFAS, they can persist as described above and be present in WWTP effluent and in sludge (Sinclair and Kannan, 2006). The effluent is discharged into surface waters and the sludge can be used to produce biosolids for land application.
Composting or Anaerobic Digestion
As discussed in this issue paper, stakeholders have raised concerns about PFAS in compost and digestate being applied to land, leading to their transfer to soil, uptake by plants and crops, and leaching into groundwater. Composting can also indirectly lead to chemical discharge to the environment when contact water from composting facilities is sent to WWTPs. In Minnesota, commercial composters are required to collect and treat contact water if they accept food scraps and/or compostable products; composters who collect only yard waste are not required to collect and treat contact water (MPCA, 2020). When contact water is sent to WWTPs, the contact water provides an additional source of PFAS for WWTP influents. The PFAS present will either be discharged in the WWTP effluent or remain in sludge that could be used as biosolids for land application.
Persistent Chemical Contaminants 60
In a study commissioned by the Minnesota Pollution Control Agency, contact water from seven composting sites (i.e., five facilities that accepted organic materials including food waste and two facilities that accepted only yard waste) had detectable levels of PFBA, PFPeA, PFHxA, PFHpA, PFOA, PFNA, PFDA, PFBS, PFHxS, and PFOS (MPCA, 2020, 2019). PFAS were more frequently detected in contact water from composting sites that accepted food waste compared with sites that accepted only yard waste. Using the individual PFAS data reported by the MPCA (2019), Coker (2020b) estimated that the PFAS concentrations ranged from 0.060 to 3.4 µg/L, with the lower end very close to EPA’s health advisory level of 0.070 µg/L for drinking water. Results showed at least one sampling event per site with one or more PFAS at concentrations greater than their health risk limit or health-based value as defined by the Minnesota Department of Health (MPCA, 2020, 2019). MPCA (2019) found that concentrations of PFOA and PFOS in contact water from the Minnesota composting sites were generally lower than concentrations in landfill leachate from Lang et al. (2017) and MWRA (2019). Lang et al. (2017) reported PFOA and PFOS concentrations of approximately 1 and 0.1 µg/L, respectively, while MWRA reported PFOA and PFOS concentration from MWRA-member landfills of 0.24–3.2 µg/L and 0.1–0.71 µg/L, respectively. MWRA (2019) also summarized existing literature of PFOA and PFOS concentrations in landfill leachate globally and reported median PFOA and PFOS concentrations in the United States of 0.49–1.05 and 0.097–0.155 µg/L, respectively, which are within the range of PFOA (0.042–5 µg/L) and PFOS (<0.0095–4.4 µg/L) concentrations reported in Wei et al. (2019) for landfill leachate from North America. Finally, MPCA (2019) also compared PFAS concentrations in ambient groundwater in Minnesota with PFAS concentrations in contact water from composting facilities and showed that levels in contact water were generally higher (MPCA, 2019).
Incineration
EPA estimates that in 2018 food waste was the largest component of municipal solid waste combusted, at approximately 22 percent (U.S. EPA, 2021i). Incineration, along with other high-temperature combustion technologies, was identified in EPA’s proposed Interim Guidance on the Destruction and Disposal of Perfluoroalkyl and Polyfluoroalkyl Substances and Materials Containing Perfluoroalkyl and Polyfluoroalkyl Substances as potentially having the capability to destroy PFAS (U.S. EPA, 2021g). However, EPA acknowledged that it is not well understood how effective high-temperature combustion is in completely destroying PFAS and whether fluorinated/mixed halogenated organic byproducts and or products of incomplete combustion can form with unknown toxicity (U.S. EPA, 2021g, 2020k). Incineration also leads to greenhouse gas emissions and air quality impacts on local communities. In addition to air emissions, PFAS or its byproducts can also be present in the incinerator ash. Other high-temperature disposal methods that EPA and its partners are developing and evaluating are gasification and pyrolysis as well as supercritical water oxidation (U.S. EPA, 2021k). Conventional pyrolysis is one method to produce biochar, which can be used as a soil amendment, contaminant adsorbent, fuel cell, or catalyst (Qian et al., 2015). Research is still needed to explore and evaluate these technologies.
Animal Feed
Diverting food scraps to animal feed is environmentally preferable to the other options discussed, according to EPA’s Food Recovery Hierarchy, ranking third after source reduction and feed hungry people (U.S. EPA, 2020i). EPA estimated in 2016 that approximately 21 percent of food waste was managed through animal feed (U.S. EPA, 2020b). Federal and state regulations exist to regulate the types of animals that may be fed food scraps, the kind of food scraps that may be fed to animals, and the type of treatment needed to render the food scraps disease-free (Broad Leib et al., 2016). However, these regulations do not include testing for persistent chemicals in food scraps and therefore food scraps may be a source of PFAS exposure for animals.

Persistent Chemical Contaminants 61
Summary of Food Waste Management Options
Potential human health and environmental concerns from PFAS are associated with each of the methods of managing food waste, although these concerns are not well quantified, making both the comparison across methods and the evaluation of the level of concern, difficult to assess. Adding complexity, PFAS contamination from food waste may travel through multiple management pathways. PFAS can be introduced directly to the WWTP by sending contaminated food waste “down the drain,” or indirectly through collected leachate (landfills) or contact water (composting), for example. It is therefore not possible to determine whether one method is preferable when considering persistent chemical contaminants and their effects on human health and the environment. As such, additional research is essential for making informed decisions on food waste management.
6.4. Data Gaps and Needs Data needed to assess the human health and environmental risks of substances released to the environment with confidence are, generally speaking, relatively expensive and time-consuming. Thus, it is not surprising that the regulations and risk-assessment studies identified do not provide enough information to estimate with confidence risks posed by PFAS in food waste compost or digestate. Specifically, the studies do not allow for the contributions of food waste to be distinguished from those of other waste streams, and do not address the full variety of food waste origins (e.g., various kinds of agricultural, industrial, and household food waste). Data to distinguish the contributions from food waste and other waste streams would be needed to support regulatory assessments such as those under FIFRA or TSCA. The approaches and specific data requirements for such assessments are not evaluated in this report.
A risk assessment for substances released to the environment requires considering the hazard/toxicity data for contaminants of concern along with data on the nature and magnitude of exposure for populations of concern. In the case of land application of compost or digestate produced from food waste, there are toxicity data for some PFAS (e.g., PFOA, PFOS); however, toxicity data are not available for many of the newer PFAS, and, in many cases, toxicity data are non-existent. In addition, PFAS toxicity studies to date have focused on assessing toxicity to individual PFAS and not to mixtures of PFAS, thus not allowing cumulative risk of PFAS to be assessed.
Although important data gaps remain, the availability of toxicity information is not the most limiting factor in trying to assess risks for land application of soil amendments made from PFAS-contaminated food waste. Instead, the key limiting factor is the lack of detailed quantitative information in the individual exposure media, on likely routes of exposures, and on contaminant uptake kinetics on which to base total exposure estimates.
Ideally, an exposure assessment would be based, at least in part, on comprehensive monitoring data for substances of concern in environmental media (e.g., soil, air, diet, ground and surface water) that are part of relevant exposure pathways at locations where well-characterized composts or digestates produced from food waste have been/are being applied to land. When sufficient monitoring data for assessing exposures are unavailable, exposure modeling at various levels of rigor (and presumed accuracy and precision) is the next best option. Existing models of chemical fate and transport and receptor uptake/intake can be used or adapted to apply to the situation of concern, but such modeling typically still requires substantial analytical input data and often requires critical assumptions to substitute for missing data. Read-across chemicals—chemicals with structural similarity—can also be used as a surrogate for the chemical of interest. Data gaps and the assumptions required in the absence of key input data frequently limit the confidence in and generalizability of exposure modeling results.
In the absence of sufficient data to support a comprehensive exposure and risk modeling study, the options for addressing important questions related to risks of land application of compost or digestate produced from food waste are more qualitative than quantitative, and any conclusions would be uncertain. For example, extrapolating from available risk studies of potentially “similar” situations, such as land application of sewage sludge biosolids or land application of other kinds of waste, is inherently uncertain given the potential differences in waste

Persistent Chemical Contaminants 62
characteristics (e.g., the profiles of chemical mixtures) and data gaps regarding the toxicity data, environmental fate, and biokinetic uptake of some PFAS.
Given the very limited information identified in the literature, general conclusions cannot be made with confidence about human health and environmental risks associated with land application of compost or digestate produced from food waste. Available data show that PFAS and pesticides have been detected in composts produced from feedstocks containing food waste; however, there is insufficient information to evaluate whether typical levels of contamination would pose unacceptable health or environmental risks when properly processed and managed. Additional data are needed to estimate representative levels of exposure before risk can be assessed.

Persistent Chemical Contaminants 63
7. STRATEGIES TO MITIGATE RISKS DUE TO LAND APPLICATION OF PFAS-CONTAMINATED COMPOST OR DIGESTATE
Despite concerns about the presence of PFAS in compost or digestate for land application, PFAS will likely remain on the market unless new local, state, or federal bans, use limits, or other regulations or voluntary industry phase-outs are implemented. Although PFOA, PFOS, and other long-chain PFAS have been phased out of production by manufacturers in the United States (Schaider et al., 2017), new PFAS continue to be developed and products containing existing PFAS continue to be imported, some of which may exhibit similar behavior and properties to existing PFAS and for which limited data are available (Choi et al., 2019; ATDSR, 2018). The following existing strategies for other waste streams (e.g., green waste) can be applied to food waste in order to minimize the risks of PFAS on human health and the environment:
(i) Upstream solutions, such as phase-outs and bans,
(ii) Feedstock restrictions,
(iii) Restricted uses for composts and digestates, and
(iv) Concentration limits in the compost or digestate.
Three of the four proposed strategies follow European Chemicals Agency (ECHA) guidance on Annex XV for restrictions for application to agricultural land and for container growing (Wood, 2019).
Upstream Solutions
One proposed strategy to reduce PFAS from entering the environment and into composts and anaerobic digestates is to stop producing PFAS. In a 2019 workshop attended by U.S. government, academia, communities, and the private sector on Understanding, Controlling, and Preventing Exposure to PFAS, one session focused on reducing exposures by preventing the release of PFAS in the first place (NAS, 2020). The concept of essential use (also outlined in (Cousins et al., 2019)), was discussed. Products can be separated into three categories—nonessential, essential, and substitutable—and elimination of PFAS can begin with the nonessential and substitutable products. For essential products with no alternatives available, one workshop participant “noted that ‘essentiality is not permanent’ as alternatives continue to be discovered and developed” (NAS, 2020). Workshop participants also emphasized that in addition to banning PFAS within the United States, imported products containing PFAS should also be banned (NAS, 2020). Within the United States, some states have already implemented bans on PFAS in food packaging, as previously discussed; however, a federal mandate would be more efficient and could address the issue of imported products. In line with phase-outs and bans is source control, which focuses on reducing the use of PFAS-containing products. Source control aims to prevent PFAS from entering the environment, thus preventing contamination of biosolids, composts, or manures (Bolan et al., 2021).
Feedstock Restrictions In composting, food waste is typically mixed with another feedstock, such as green waste or manure, to achieve an optimum moisture content and carbon-to-nitrogen ratio. For anaerobic digestion, digesters exist that can process only food waste or a mixture of food waste and other waste sources. The literature indicates that certain feedstocks are known to have higher concentrations of PFAS (biosolids > food waste > green waste). With this knowledge, restrictions can be placed on the feedstocks used in composting or anaerobic digestion, by either eliminating these specific feedstocks or by restricting their contribution to the overall feedstock mixture. For example, feedstock restrictions is a strategy used to address persistent herbicide contamination of composts.
Persistent Chemical Contaminants 64
Following compost contamination with persistent herbicides in Vermont in 2012 (see Table 5), the compost manufacturer stopped accepting horse manure and bedding, which was found to be the cause of contamination, until a reliable testing method for the herbicides of concern becomes available (Coker, 2013). A similar approach could be taken to restrict compostable food contact materials or certain types of food that are more likely to contain high levels of PFAS from entering composting and anaerobic digestion processes, if data became available.
Restricted Uses for Composts and Digestates
Composts and digestates can be used for various applications, and their use may be restricted to certain applications depending on the potential exposure to PFAS. For example, King County in Washington State, started several pilot programs that will use compost on farmland, as a cover for a closed landfill, and as a soil amendment for sites on County parkland restoration (Dawson, 2020). Given that not all farmland is the same, restrictions can also be different depending on the type of farmland. Depending on the compost use, these three composts may have differing levels of chemical contaminants; as Coker (2013) notes, composters producing compost for landfill covers would have a higher risk tolerance than composters producing compost for community gardens. In that instance, some composts could be restricted to landfill cover usage but not for application to farmland; however, this may limit the environmental benefits (and financial value) of composting and anaerobic digestion. The strategy for composts and digestates having restricted uses is similar to the existing biosolids regulations in the United States (40 CFR Part 503 rule) that classify biosolids as Class A or Class B (U.S. EPA, 2018a).
Concentration Limits
Limits can be set to levels that pose no risk or an “acceptable” level of risk. For chemicals for which data are available to conduct a risk assessment, a safe limit can be defined. In other instances, limit values would need to be defined by considering factors such as ability to monitor/measure the compound, achievability of the analyte limit, and enforceability of the limit (Wood, 2019). In the United States, composts are tested for heavy metals, for example, under a voluntary certification program from the U.S. Composting Council (USCC, 2020b), and the U.S. 40 CFR Part 503 for biosolids requires that biosolids meet the limits set for certain heavy metals (e.g., copper, lead, zinc) (U.S. EPA, 1994). There are currently no concentration limits for PFAS in composts, digestates, or biosolids—and no multilaboratory-validated analytical method for detection of PFAS in solids—but concentration limits can be developed in the future. Standardized analytical methods within organizations are available and EPA is in the process of developing CWA Method 1600 to measure PFAS in biosolids and non-drinking water aqueous matrices (U.S. EPA, 2021o, 2019c).
Persistent Chemical Contaminants 65
8. CONCLUSIONS AND RESEARCH GAPS This issue paper summarizes the available information on persistent chemical contaminants in food waste streams and the composts or digestates derived from food waste streams to investigate whether food waste is a leading contributor to contamination in compost and digestate. Food waste is defined in this paper as food that is produced for human consumption but not ultimately consumed by humans. Food waste streams may include items other than food waste, including compostable and non-compostable food contact materials. Conclusions based on the available information are presented in Section 8.1. Section 8.2 identifies areas where scientifically rigorous data are needed to address important research gaps.
8.1. Conclusions Overall, this paper demonstrates that food waste streams are a source of PFAS contamination in composts and digestates but are likely not a major source of contamination for the four persistent herbicides of interest (clopyralid, aminopyralid, aminocyclopyrachlor, and picloram). The available data on PCBs and PAHs in food waste and associated composts and digestates are briefly discussed but were not further considered due to the lack of recent U.S. compost and digestate data and, in the case of PCBs, due to the U.S. ban on PCBs. It should be noted that in most cases, the conclusions listed below are based on limited available data. In addition, a challenge to studying food waste streams is that they are rarely processed alone, therefore most of the available research reports contaminant concentrations in soil amendments produced from feedstock mixtures.
Detailed conclusions for PFAS are listed below:
PFAS has been detected in food waste, with one study reporting three PFAS (PFBA, PFHxS, and PFNA) in the range of 0.11–1 µg/kg in samples collected from grocery stores, hospitals, schools, restaurants, retirement communities, and residences (MacRae et al., 2020).
PFAS has also been detected in food (i.e., precursor of food waste), supporting the finding that food waste contains PFAS. Food items from non-contaminated areas were found to have concentrations in the 0.1 to 10 µg/kg range, with higher levels seen in food items collected from areas with known sources of PFAS (Table 1). Analysis of different food types purchased from grocery stores showed that seafood and meat are important contributors to PFAS in food items (FDA, 2020d; Schecter et al., 2010), possibly due to bioaccumulation.
Food contact materials (defined in this paper as materials and articles that come into contact with food, specifically food packaging and food serviceware) are a source of PFAS contamination in food waste streams. PFAS from food contact materials may migrate into food that is ultimately wasted or the PFAS-containing food contact materials may be included in food waste streams. Paper plates, paper bowls, microwave popcorn bags, fast-food wrappers and paperboards have all been shown to either contain elevated levels of total fluorine, indicating likely PFAS treatment, or specific PFAS (Dickman et al., 2020; Chiang et al., 2018; Schreder and Dickman, 2018; Schaider et al., 2017; Yuan et al., 2016).
Compostable food contact materials had higher PFAS concentrations than non-compostable samples. In one study, compostable paper tableware samples had higher concentrations of 6:2 FTOH than non-compostable samples made in the U.S. and China (Yuan et al., 2016). This finding is supported by comparisons of PFAS levels in composts made with and without compostable food packaging. Analysis of 10 U.S. composts showed that in general, PFAS concentrations were higher in composts with compostable food packaging (Choi et al., 2019).
In food waste streams that contain both food waste and food contact materials, the latter may contribute more to the overall PFAS levels on a per weight basis. Median PFAS concentrations ranged from <1 to 485 µg/kg in food contact materials, compared with PFAS concentrations of <10 µg/kg in U.S. food items from non-contaminated areas (Table 1). The primary contributor (food waste or food contact materials) to

Persistent Chemical Contaminants 66
PFAS contamination depends on several factors, including the source of food waste and the type of food contact material. In addition, some composting facilities do not accept food items that have been shown to contain PFAS (e.g., seafood, meat) due to odor problems and issues with rodents and flies (U.S. EPA, 2020e).
Composts made from food waste contain higher levels of PFAS compared with composts made from green waste. Comparing results across three studies (which originated from the same research group), PFAS concentrations in decreasing order were: biosolids-based products (i.e., treated biosolids, composted biosolids) > food waste compost > green waste compost ≈ other organic composts (Lazcano et al., 2020; Choi et al., 2019; Lazcano et al., 2019). An additional study on composts in Europe also showed that kitchen waste compost had higher PFAS concentrations than green waste compost (Brandli et al., 2007a).
There were insufficient data to determine how the composting process affects PFAS concentrations when comparing final PFAS levels in the compost with initial PFAS levels in the feedstock. The limited data from one study on biosolids composting show that there was no clear trend and concentrations increased or decreased depending on the specific PFAS and feedstock (Williams, 2021).
No data were available to draw conclusions on PFAS levels in digestates made from food waste compared with digestates made from other wastes. One study that examined digested sludge showed no clear trend in how the anaerobic digestion process affected PFAS levels (Gomez-Canela et al., 2012). Various factors, such as hydraulic residence time, digestion duration, and the possible presence of precursors in the feedstock, can affect final PFAS concentrations.
Given the very limited data available, general conclusions cannot be made with confidence about human health and environmental risks associated with land application of compost of digestate produced from PFAS-contaminated food waste. There is a need to determine with confidence the actual exposure levels and risks associated with food waste compost and digestate and to compare these with exposure levels and risks associated with other options for food waste management—and to broadly communicate these findings. For emerging PFAS, hazard/toxicity data to support quantitative risk assessments may be limited or may not exist. When present in land-applied biosolids (compost or digestate), PFAS have the potential to be taken up by plants and crops and/or leach into groundwater (Costello and Lee, 2020; Wang et al., 2020; Ghisi et al., 2019; Lan et al., 2018; Gottschall et al., 2017; Blaine et al., 2013; Lindstrom et al., 2011; Yoo et al., 2011; Washington et al., 2010; Yoo et al., 2010; Yoo et al., 2009), which can be consumed by humans or used for agricultural purposes. Also, studies have shown that PFAS in biosolids have the potential to leach into groundwater after land application or to enter surface water through runoff (Coker, 2020b; Beecher and Brown, 2018b).
Regardless of whether PFAS are actually present at levels of concern in composts and digestates made from food waste, concerns about contamination can, and have, affected the marketability and value of these products, in addition to decisions and policies applicable to food waste collection, management, processing, and consequently, the reduction of food waste.
Strategies to mitigate risks due to the land application of PFAS-contaminated compost or digestate include (i) upstream solutions, such as phase-outs and bans, (ii) feedstock restrictions, (iii) restricted uses for composts and digestates, and (iv) concentration limits in composts and digestates. There are currently no federal regulations on PFAS in compost or digestate from sources that do not contain domestic sewage sludge, although some states have established screening steps for biosolids compost or for feedstocks. Also, composters in Minnesota that accept food waste are required to collect and treat contact water (MPCA, 2020, 2019). In response to concerns about PFAS in food contact materials, some cities and states have adopted or are considering the adoption of policies prohibiting PFAS in food packaging and some manufacturers have also begun voluntary phase-out of 6:2 FTOH in food contact materials. For example, compostable food contact materials certified by the Biodegradable Products
Persistent Chemical Contaminants 67
Institute may no longer contain intentionally added fluorinated chemicals.
Detailed conclusions for the persistent herbicides of interest are listed below:
No studies were identified that reported concentrations of clopyralid, aminopyralid, picloram, or aminocyclopyrachlor in food waste or feedstock mixtures containing food waste. However, clopyralid has been detected in food samples in the United States (FDA, 2018). The detection of only clopyralid in food samples is consistent with the registered use sites of the four persistent herbicides, where only clopyralid had agricultural settings (e.g., fruits, vegetables, and cereal grains) as a registered use site.
There were no data available that supported a comparison of persistent herbicide concentrations in food waste and green waste or a comparison of composts made from different wastes.
Documented cases of clopyralid, aminopyralid, picloram, and aminocyclopyrachlor in contaminated compost show that the source of contamination is green waste, manure, or hay (Table 5). Food waste has not been indicated in any documented incident to date.
As food waste is invariably mixed with green waste, manure, and other organic feedstocks that are available to compost producers, if food items were contaminated with persistent herbicides, these levels would likely be diluted by the wide variety of foods found in municipal food waste streams and/or other feedstocks present. Surveys of persistent herbicide contamination in mixed feedstock composts may be useful when considering which amendments to avoid when composting with food waste.
8.2. Research Gaps PFAS contamination in food waste presents challenges for a broad range of stakeholders, including but not limited to those involved in waste management and recycling facilities, and those who purchase and intend to use compost and digestate as soil amendments. Additional research is needed to inform decisions and policies applicable to food waste collection, management, processing, and consequently, the reduction of food waste. Priority research needs include:
Priority Research Needs
Research to obtain additional data on PFAS species and concentrations in finished composts and digestates generated from food waste and used as soil amendments in the United States. This data is imperative to determining the magnitude of PFAS contamination in composts and digestates and calculating the potential risks to human health and the environment from land application of compost and digestate made from food waste. Current available data on U.S. composts and land-applied products are limited to three studies originating from the same research group, thus additional studies on composts would be useful to expand the available literature. More data is also needed to compare composts with and without compostable materials, especially given that new guidelines and standards (e.g., total fluorine limits for BPI-certified compostable products) have taken effect. Differences in regulations across regions as well as differences in food items accepted by composting facilities also support the need for additional research on PFAS levels in composts. No data were identified that would enable the determination of whether food waste digestates would have higher, similar, or lower PFAS concentrations compared with digestates produced from other feedstocks.
Research to obtain additional data on PFAS species and concentrations in food waste streams in the United States. Studies have shown that both food waste and food contact materials may contain PFAS and from the limited data, food contact materials appear to have higher concentrations of PFAS. Additional data should be obtained to confirm this finding especially with new guidelines and standards now adopted. In addition, data is needed to assess PFAS concentrations in food waste from different sectors and food types (e.g., seafood, vegetables). This data is needed to inform strategies to mitigate

Persistent Chemical Contaminants 68
risks of land applied composts and digestates, by identifying which types of food waste and/or food contact materials could be restricted from composting and anaerobic digestion feedstocks to reduce contamination levels, as the U.S. EPA encourages increased recycling of food waste.
Research to assess exposure and potential risks to human health and the environment from land application of PFAS-contaminated compost and digestate produced from food waste. One of the primary concerns about PFAS in land-applied compost or digestate is that it may transfer to the soil, be taken up by plants and crops, or leach into groundwater. Full risk assessments are not available on the risks to human health and the environment posed by the land application of food waste compost and anaerobic digestate containing PFAS and the data needed to estimate with confidence the human health and environmental risks are very limited. When adequate data become available, risk should be examined not only as an absolute, but rather relative to the risk of other potential pathways for food waste.
Research to understand the comparative risks of different food waste management options, including further research to determine the fate of PFAS through various wastewater and solids treatment processes. In the United States, food waste is typically landfilled, sent directly “down the drain,” incinerated, or used as animal feed, if not composted or anaerobically digested. Quantitative analyses of exposure and risk comparing these options to composting and anaerobic digestion of food waste are not available, but are needed, to determine whether one option presents less risk than the others to human health and the environment due to persistent chemical contaminants. When adequate data become available for PFAS, there is a need to examine the risk of land-applied compost and digestate not only as an absolute, but rather relative to the risk of other potential pathways for food waste. Research specifically on the fate of PFAS through wastewater treatment processes would be applicable for several food waste management pathways, as PFAS can be introduced directly to the WWTP by sending contaminated food waste “down the drain,” or indirectly through collected leachate (landfills) or contact water (composting). This research should take into consideration concentrations in process and plant influent and effluent as well as in the solids generated, including investigating transformations of PFAS and their precursors during biological treatment as well as separation and sorption of PFAS into sludge solids.
Additional Research Needs
Development of a multilaboratory-validated analytical method to detect PFAS in solids (e.g., food waste, composts, digestates), although standardized methods do exist within organizations for PFAS testing in non-drinking water matrices (e.g., state of California, U.S. Department of Defense). EPA’s two approved laboratory methods, Method 537.1 and Method 533, are only for use with drinking water. CWA Method 1600 is currently under development by EPA in collaboration with the U.S. Department of Defense for fish tissues, biosolids, soils, sediments, and non-drinking water aqueous matrices (surface water, groundwater, wastewater influent/effluent, landfill leachate) (U.S. EPA, 2021o, 2019c). A standardized analytical method for PFAS in composts would allow for more comparable data comparisons across studies.
Expansion of PFAS analytical methods to identify more than the 30–50 compounds under the current methods, given that there are more than 4,700 individual PFAS documented. Nontargeted screening of U.S. composts and biosolids-based products demonstrated that in additional to the PFAS quantified, additional PFAS precursors were also present, such as sulfonamides, fluorotelomer sulfonates, and/or diPAPs. Methods are needed to identify and quantify the increasing number of PFAS.
Further research on PFAS fate and transformation during composting and anaerobic digestion. The limited data available showed no clear trends when comparing PFAS concentrations in the feedstock with PFAS concentrations in the final product. This is further complicated by the potential presence of precursors in the feedstock. More data is needed to assess the extent of and conditions favorable for
Persistent Chemical Contaminants 69
precursor transformation and to understand the factors that affect PFAS levels.
Research to support determination of an acceptable PFAS limit for land-applied biosolids, composts, and digestates, that could affect drinking water sources and surface water due to potential leaching and runoff. This research would include development of models to predict leaching and runoff, and full-scale field work for validation and parameter estimation for the models. There is ongoing research in this area, including studies from EPA grantees (U.S. EPA, 2019e) as well as the U.S. Geological Survey and New Hampshire (NHDES, 2020). EPA also initiated problem formulation for PFOA and PFOS in biosolids, the first step in the risk assessment process (U.S. EPA, 2021n).
Research to determine the long-term impacts as well as the transformation of PFAS over time after land application of PFAS-contaminated soil amendments. Given their resistance to degradation, more data is needed to understand their fate and persistence in environmental media after the use and application of composts and digestates generated from food waste.
Persistent Chemical Contaminants 70
9. REFERENCES ASTM International. (2017). ASTM D7968-17a, Standard Test Method for Determination of Polyfluorinated
Compounds in Soil by Liquid Chromatography Tandem Mass Spectrometry (LC/MS/MS). West Conshohocken, PA.
ATDSR (Agency for Toxic Substances and Disease Registry). (2018). What are PFAS? https://www.atsdr.cdc.gov/pfas/overview.html
ATSDR (Agency for Toxic Substances and Disease Registry). (1995). Toxicological profile for Polycyclic Aromatic Hydrocarbons. https://www.atsdr.cdc.gov/toxprofiles/tp69.pdf
ATSDR (Agency for Toxic Substances and Disease Registry). (2000). Toxicological Profile for Polychlorinated Biphenyls (PCBs). https://www.atsdr.cdc.gov/ToxProfiles/tp17.pdf
ATSDR (Agency for Toxic Substances and Disease Registry). (2009). Case studies in environmental medicine: Toxicity of polycyclic aromatic hydrocarbons (PAHs) https://www.atsdr.cdc.gov/csem/pah/docs/pah.pdf
Banks, C; Heaven, S; Zhang, Y; Baier, U. (2018). Food waste digestion: Anaerobic digestion of food waste for a circular economy. IEA Bioenergy Task 37. https://www.ieabioenergy.com/wp-content/uploads/2018/12/Food-waste_WEB_END.pdf
Barcauskaitė, K. (2019). Gas chromatographic analysis of polychlorinated biphenyls in compost samples from different origin. Waste Management & Research 37: 556-562. https://doi.org/10.1177/0734242X19828156
Beecher, N; Brown, S. (2018a). Managing organics in the “PFAS age”. BioCycle 29: 31. https://www.biocycle.net/2018/08/07/managing-organics-pfas-age/
Beecher, N; Brown, S. (2018b). PFAS and organic residuals management. BioCycle 29: 20. https://www.biocycle.net/2018/07/06/pfas-organic-residuals-management/
Begley, T; White, K; Honigfort, P; Twaroski, M; Neches, R; Walker, R. (2005). Perfluorochemicals: Potential sources of and migration from food packaging. Food Additives and Contaminants 22: 1023-1031.
Benisek, M; Kukucka, P; Mariani, G; Suurkuusk, G; Gawlik, BM; Locoro, G; Giesy, JP; Blaha, L. (2015). Dioxins and dioxin-like compounds in composts and digestates from European countries as determined by the in vitro bioassay and chemical analysis. Chemosphere 122: 168-175.
BioCycle. (2017). Composting roundup. BioCycle 58: 9. https://www.biocycle.net/2017/06/07/composting-roundup-74/
Blaine, A; Rich, C; Hundal, L; Lau, C; Mills, M; Harris, K; Higgins, C. (2013). Uptake of perfluoroalkyl acids into edible crops via land applied biosolids: Field and greenhouse studies. Environmental Science & Technology 47: 14062-14069.
Bolan, N; Sarkar, B; Vithanage, M; Singh, G; Tsang, DCW; Mukhopadhyay, R; Ramadass, K; Vinu, A; Sun, Y; Ramanayaka, S; Hoang, SA; Yan, Y; Li, Y; Rinklebe, J; Li, H; Kirkham, MB. (2021). Distribution, behaviour, bioavailability and remediation of poly- and per-fluoroalkyl substances (PFAS) in solid biowastes and biowaste-treated soil. Environment International 155: 106600. https://www.sciencedirect.com/science/article/pii/S0160412021002257
BPI (Biodegradable Products Institute). (2020). Fluorinated chemicals. https://bpiworld.org/Fluorinated-Chemicals
Brandli, R; Bucheli, T; Kupper, T; Furrer, R; Stadelmann, F; Tarradellas, J. (2005). Persistent organic pollutants in source-separated compost and its feedstock materials: A review of field studies. Journal of Environmental Quality 34: 735-760.

Persistent Chemical Contaminants 71
Brandli, R; Kupper, T; Bucheli, T; Zennegg, M; Huber, S; Ortelli, D; Muller, J; Schaffner, C; Iozza, S; Schmid, P; Berger, U; Edder, P; Oehme, M; Stadelmann, F; Tarradellas, J. (2007a). Organic pollutants in compost and digestate. Part 2. Polychlorinated dibenzo-p-dioxins, and -furans, dioxin-like polychlorinated biphenyls, brominated flame retardants, perfluorinated alkyl substances, pesticides, and other compounds. Journal of Environmental Monitoring 9: 465-472.
Brandli, RC; Bucheli, TD; Kupper, T; Furrer, R; Stahel, WA; Stadelmann, FX; Tarradellas, J. (2007b). Organic pollutants in compost and digestate. Part 1. Polychlorinated biphenyls, polycyclic aromatic hydrocarbons and molecular markers. Journal of Environmental Monitoring 9: 456-464.
Brandli, RC; Bucheli, TD; Kupper, T; Mayer, J; Stadelmann, FX; Tarradellas, J. (2007c). Fate of PCBs, PAHs and their source characteristic ratios during composting and digestion of source-separated organic waste in full-scale plants. Environmental Pollution 148: 520-528.
Broad Leib, E; Balkus, O; Rice, C; Maley, M; Taneja, R; Cheng, R; Civita, N; Alvoid, T. (2016). Leftovers for Livestock: A Legal Guide for Using Food Scraps as Animal Feed. https://furtherwithfood.org/wp-content/uploads/2017/07/Leftovers-for-Livestock_A-Legal-Guide_August-2016.pdf
Buck, RC; Franklin, J; Berger, U; Conder, JM; Cousins, IT; de Voogt, P; Jensen, AA; Kannan, K; Mabury, SA; van Leeuwen, SP. (2011). Perfluoroalkyl and polyfluoroalkyl substances in the environment: Terminology, classification, and origins. Integrated Environmental Assessment and Management 7: 513-541. https://setac.onlinelibrary.wiley.com/doi/abs/10.1002/ieam.258
California Water Boards. (2019). Frequently asked questions: Drinking water guidelines for PFOA and PFOS. https://www.waterboards.ca.gov/publications_forms/publications/factsheets/docs/pfoa_pfos_guidelines_faq_factsheet.pdf
California Water Boards Environmental Laboratory Accreditation Program (ELAP). (2019). Updates to ELAP Field of Testing Forms 111 and 117 for Per- and Polyfluorinated Alkyl Substances in Non-Drinking Water Analysis. https://www.waterboards.ca.gov/drinking_water/certlic/labs/documents/pfas_announcement_dwq_final.pdf
CalRecycle (California Department of Resources Recycling and Recovery). (2020). Pesticide/Herbicide Residues in Compost. Available online at https://www.calrecycle.ca.gov/organics/threats/pesticides
Chiang, S; Cox, C; Levin, J. (2018). Avoiding Hidden Hazards: A Purchaser’s Guide to Safer Foodware. https://ceh.org/wp-content/uploads/2019/05/CEH-Disposable-Foodware-Report-final-1.31.pdf
Choi, Y; Lazcano, R; Yousefi, P; Trim, H; Lee, L. (2019). Perfluoroalkyl acid characterization in U.S. municipal organic solid waste composts. Environmental Science & Technology Letters 6: 372-377. https://doi.org/10.1021/acs.estlett.9b00280
City of Rapid City. (2020). City Issues Yard Waste Compost Advisory. Rapid City, SD. https://www.rcgov.org/rapid-city-news-room/city-issues-yard-waste-compost-advisory-8608.html
Coker, C. (2013). Composters defend against persistent herbicides. BioCycle 54: 21. https://www.biocycle.net/2013/08/21/composters-defend-against-persistent-herbicides/
Coker, C. (2014). Testing for Persistent Herbicides in Feedstocks And Compost. BioCycle. https://www.biocycle.net/testing-for-persistent-herbicides-in-feedstocks-and-compost/
Coker, C. (2015). Coping with persistent herbicides in composting feedstocks. BioCycle. https://www.biocycle.net/2015/01/14/coping-with-persistent-herbicides-in-composting-feedstocks/
Coker, C. (2020a). Managing PFAS chemicals in composting and anaerobic digestion. BioCycle. https://www.biocycle.net/2020/01/21/managing-pfas-chemicals-composting-anaerobic-digestion/
Persistent Chemical Contaminants 72
Coker, C. (2020b). Treatment of PFAS-contaminated composting site runoff. BioCycle. https://www.biocycle.net/2020/01/28/treatment-pfas-contaminated-composting-site-runoff/
Costello, MCS; Lee, LS. (2020). Sources, Fate, and Plant Uptake in Agricultural Systems of Per- and Polyfluoroalkyl Substances. Current Pollution Reports. https://doi.org/10.1007/s40726-020-00168-y
Cousins, IT; Goldenman, G; Herzke, D; Lohmann, R; Miller, M; Ng, CA; Patton, S; Scheringer, M; Trier, X; Vierke, L; Wang, Z; DeWitt, JC. (2019). The concept of essential use for determining when uses of PFASs can be phased out [10.1039/C9EM00163H]. Environmental Science: Processes & Impacts 21: 1803-1815. http://dx.doi.org/10.1039/C9EM00163H
Cureton, E. (2018). Trees Accidentally Killed By ODOT To Be Logged. Retrieved from https://www.opb.org/news/article/odot-ponderosa-pine-pesticide-logging-sisters-highway-20/
Cureton, E. (2019). Oregon Becomes 1st State To Sharply Restrict Herbicide Linked To Tree Deaths. Retrieved from https://www.opb.org/news/article/oregon-herbicide-restriction-aminocyclopyrachlor-perspective-acp-sisters/
D'eon, J; Mabury, S. (2011). Exploring indirect sources of human exposure to perfluoroalkyl carboxylates (PFCAs): Evaluating uptake, elimination, and biotransformation of polyfluoroalkyl phosphate esters (PAPs) in the rat. Environmental Health Perspectives 119: 344-350.
D'Eon, JC; Mabury, SA. (2007). Production of Perfluorinated Carboxylic Acids (PFCAs) from the Biotransformation of Polyfluoroalkyl Phosphate Surfactants (PAPS): Exploring Routes of Human Contamination. Environmental Science & Technology 41: 4799-4805. https://doi.org/10.1021/es070126x
D’eon, J; Mabury, S. (2007). Production of perfluorinated carboxylic acids (PFCAs) from the biotransformation of polyfluoroalkyl phosphate surfactants (PAPS): Exploring routes of human contamination. Environmental Science and Technology 41: 4799-4805.
Dasu, K; Royer, LA; Liu, J; Lee, LS. (2010). Hydrolysis of fluorotelomer compounds leading to fluorotelomer alcohol production during solvent extractions of soils. Chemosphere 81: 911-917. https://www.sciencedirect.com/science/article/pii/S0045653510008817
Dawson, K. (2020). Washington state's compost procurement law. BioCycle. https://www.biocycle.net/washington-states-compost-procurement-law/
Dickman, J; Schreder, E; Uding, N. (2020). Packaged in Pollution: Are food chains using PFAS in packaging? Safer Chemicals, Healthy Families. https://saferchemicals.org/packaged-in-pollution/
DoD; DoE (U.S. Department of Defense (DoD) Environmental Data Quality Workgroup (EDQW) and U.S. Department of Energy (DOE) Consolidated Audit Program (DOECAP) Data Quality Workgroup (DOE-DQW)). (2019). Consolidated Quality Systems Manual (QSM) for Environmental Laboratories. https://denix.osd.mil/edqw/documents/manuals/qsm-version-5-3-final/
EFSA (European Food Safety Panel on food contact materials, enzymes, flavourings and processing aids (CEF)). (2010). Scientific Opinion on the safety evaluation of the substance perfluoro acetic acid, α-substituted with the copolymer of perfluoro-1,2-propylene glycol and perfluoro-1,1-ethylene glycol, terminated with chlorohexafluoropropyloxy groups, CAS No. 329238-24-6 for use in food contact materials. EFSA Journal 2010 8: 1519. https://efsa.onlinelibrary.wiley.com/doi/pdf/10.2903/j.efsa.2010.1519
Fair, PA; Wolf, B; White, ND; Arnott, SA; Kannan, K; Karthikraj, R; Vena, JE. (2019). Perfluoroalkyl substances (PFASs) in edible fish species from Charleston Harbor and tributaries, South Carolina, United States: Exposure and risk assessment. Environmental Research 171: 266-277. https://www.sciencedirect.com/science/article/pii/S0013935119300222
FDA (U.S. Food and Drug Administration). (2000). Guidance for Industry: Action Levels for Poisonous or Deleterious Substances in Human Food and Animal Feed. https://www.fda.gov/regulatory-
Persistent Chemical Contaminants 73
information/search-fda-guidance-documents/guidance-industry-action-levels-poisonous-or-deleterious-substances-human-food-and-animal-feed#poly
FDA (U.S. Food and Drug Administration). (2018). Pesticide Residue Monitoring Program: Fiscal Year 2018 Pesticide Report. https://www.fda.gov/media/140802/download
FDA (U.S. Food and Drug Administration). (2019a). 40 CFR Part 761 - Polychlorinated biphenyls (pcbs) manufacturing, processing, distribution in commerce, and use prohibitions https://www.govinfo.gov/content/pkg/CFR-2019-title40-vol34/pdf/CFR-2019-title40-vol34-part761.pdf
FDA (U.S. Food and Drug Administration). (2019b). Statement on FDA’s scientific work to understand per- and polyfluoroalkyl substances (PFAS) in food, and findings from recent FDA surveys. https://www.fda.gov/news-events/press-announcements/statement-fdas-scientific-work-understand-and-polyfluoroalkyl-substances-pfas-food-and-findings
FDA (U.S. Food and Drug Administration). (2020a). Analytical Results of Testing Food for PFAS from Environmental Contamination. https://www.fda.gov/food/chemicals/analytical-results-testing-food-pfas-environmental-contamination
FDA (U.S. Food and Drug Administration). (2020b). CFR - Code of Federal Regulations Title 21. https://www.accessdata.fda.gov/scripts/cdrh/cfdocs/cfcfr/CFRSearch.cfm?fr=109.30#:~:text=The%20temporary%20tolerances%20for%20residues,in%20poultry%20(fat%20basis)
FDA (U.S. Food and Drug Administration). (2020c). FDA announces the voluntary phase-out by industry of certain PFAS used in food packaging. https://www.fda.gov/food/cfsan-constituent-updates/fda-announces-voluntary-phase-out-industry-certain-pfas-used-food-packaging
FDA (U.S. Food and Drug Administration). (2020d). Per and polyfluoroalkyl substances (PFAS). https://www.fda.gov/food/chemicals/and-polyfluoroalkyl-substances-pfas
FDA (U.S. Food and Drug Adminstration). (2020e). Questions and Answers on PFAS in Food. U.S.fda.gov/food/chemicals/questions-and-answers-pfas-food
Fei, C; McLaughlin, J; Tarone, R; Olsen, J. (2007). Perfluorinated chemicals and fetal growth: A study within the Danish National Birth Cohort. Environmental Health Perspectives 115: 1677-1682.
Flagel, J. (2020). Mycelium: Using Mushrooms to Make Packaging Materials. Available online at https://matmatch.com/blog/mycelium-using-mushrooms-to-make-packaging-materials/
Ghisi, G; Vamerali, T; Manzetti, S. (2019). Accumulation of perfluorinated alkyl substances (PFAS) in agricultural plants: A review. Environmental Research 169: 326-341.
Glüge, J; Scheringer, M; Cousins, IT; DeWitt, JC; Goldenman, G; Herzke, D; Lohmann, R; Ng, CA; Trier, X; Wang, Z. (2020). An overview of the uses of per- and polyfluoroalkyl substances (PFAS) [10.1039/D0EM00291G]. Environmental Science: Processes & Impacts 22: 2345-2373. http://dx.doi.org/10.1039/D0EM00291G
Goldstein, N. (2013). Unraveling the maze of persistent herbicides in compost. BioCycle 54: 17. https://www.biocycle.net/2013/06/19/unraveling-the-maze-of-persistent-herbicides-in-compost/
Goldstein, N. (2018). Codigestion of food waste in the U.S. BioCycle. https://www.biocycle.net/codigestion-food-waste-u-s/
Goldstein, N; Coker, C. (2020). Top 10 composting trends in 2020. BioCycle. https://www.biocycle.net/2020/01/07/composting-trends-2020/
Gomez-Canela, C; Barth, J; Lacorte, S. (2012). Occurrence and fate of perfluorinated compounds in sewage sludge from Spain and Germany. Environmental Science and Pollution Research International 19: 4109-

Persistent Chemical Contaminants 74
4119.
Gottschall, N; Topp, E; Edwards, M; Payne, M; Kleywegt, S; Lapen, D. (2017). Brominated flame retardants and perfluoroalkyl acids in groundwater, tile drainage, soil, and crop grain following a high application of municipal biosolids to a field. Science of the Total Environment 574: 1345-1359.
Hellstrom, A; Nilsson, M; Kylin, H. (2011). Current-use and organochlorine pesticides and polychlorinated biphenyls in the biodegradable fraction of source separated household waste, compost, and anaerobic digest. Bulletin of Environmental Contamination and Toxicology 86: 60-64.
Herzke, D; Huber, S; Bervoets, L; D’Hollander, W; Hajslova, J; Pulkrabova, J; Brambilla, G; Paola De Filippis, S; Klenow, S; Heinemeyer, G; de Voogt, P. (2013). Perfluorinated alkylated substances in vegetables collectedin four European countries; occurrence and human exposure estimations. Environmental Science Pollution and Research.
Houde, M; De Silva, AO; Muir, DCG; Letcher, RJ. (2011). Monitoring of Perfluorinated Compounds in Aquatic Biota: An Updated Review. Environmental Science & Technology 45: 7962-7973. https://doi.org/10.1021/es104326w
IATP (Institute for Agriculture and Trade Policy). (2020). With a second farm shuttered due to massive PFAS contamination, Maine legislators weigh easing access to the courts. https://www.iatp.org/blog/202007/second-farm-shuttered-due-massive-pfas-contamination-maine-legislators-weigh-easing
id8agency. (2020). Sustainable Packaging Design. Available online at https://id8agency.com/sustainable-eco-friendly-package-design/
Johnson, MS; Buck, RC; Cousins, IT; Weis, CP; Fenton, SE. (2021). Estimating Environmental Hazard and Risks from Exposure to Per- and Polyfluoroalkyl Substances (PFASs): Outcome of a SETAC Focused Topic Meeting. Environmental Toxicology and Chemistry 40: 543-549. https://setac.onlinelibrary.wiley.com/doi/abs/10.1002/etc.4784
Kamthan, R; Tiwari, I. (2017). Agricultural Wastes- Potential Substrates For Mushroom Cultivation. European Journal of Experimental Biology 7: 31. https://www.imedpub.com/articles/agricultural-wastes-potential-substrates-for-mushroom-cultivation.php?aid=20589
Kennedy, T. (2020). Compost standards. Organic Materials Review Institute. https://www.omri.org/compost-standards
Kim, K; Kabir, E; Jahan, S. (2017). Exposure to pesticides and the associated human health effects. Science of the Total Environment 575: 525-535.
Kindschuh, J; Lee, T. (2021). Multiple States Enact Drinking Water and Groundwater Regulations for PFAS Chemicals. Available online at https://www.jdsupra.com/legalnews/multiple-states-enact-drinking-water-4898520/
Kupper, T; Bucheli, T; Brändli, R; Ortelli, D; Edder, P. (2008). Dissipation of pesticides during composting and anaerobic digestion of source-separated organic waste at full-scale plants. Bioresource Technology 99: 7988-7994. http://www.sciencedirect.com/science/article/pii/S0960852408002952
Lan, Z; Zhou, M; Yao, Y; Sun, H. (2018). Plant uptake and translocation of perfluoroalkyl acids in a wheat-soil system. Environmental Science and Pollution Research International 25: 30907-30916.
Lang, JR; Allred, BM; Field, JA; Levis, JW; Barlaz, MA. (2017). National Estimate of Per- and Polyfluoroalkyl Substance (PFAS) Release to U.S. Municipal Landfill Leachate. Environmental Science & Technology 51: 2197-2205. https://doi.org/10.1021/acs.est.6b05005
Lau, C; Anitole, K; Hodes, C; Lai, D; Pfahles-Hutchens, A; Seed, J. (2007). Perfluoroalkyl Acids: A Review of

Persistent Chemical Contaminants 75
Monitoring and Toxicological Findings. Toxicological Sciences 99: 366-394. https://doi.org/10.1093/toxsci/kfm128
Lazcano, R; Choi, Y; Mashtare, M; Lee, L. (2020). Characterizing and comparing per- and polyfluoroalkyl substances in commercially available biosolid and organic non-biosolid-based products. Environmental Science & Technology 54: 8640-8648.
Lazcano, R; de Perre, C; Mashtare, M; Lee, L. (2019). Per- and polyfluoroalkyl substances in commercially available biosolid-based products: The effect of treatment processes. Water Environment Research 91: 1669-1677.
Lee, L. (2020). W4170 Committee Response to the 2018 OIG Report. MWEA 2020 Biosoilds Conference, Virtual.
Lemmon, CR; Pylypiw, HM, Jr. (1992). Degradation of diazinon, chlorpyrifos, isofenphos, and pendimethalin in grass and compost. Bull Environ Contam Toxicol 48: 409-415.
Li, D; Zhang, Z-h; Zhong, H-n; Zhu, L; Pan, J-j; Zheng, J-g; Lin, Q-b; Liu, H. (2019). The determination of trace per- and polyfluoroalkyl substances and their precursors migrated into food simulants from food contact materials by LC–MS/MS and GC–MS/MS. LCGC North America 37: 464-475. http://www.chromatographyonline.com/determination-trace-and-polyfluoroalkyl-substances-and-their-precursors-migrated-food-simulants-food
Li, S; Ni, H; Zeng, H. (2017). PAHs in polystyrene food contact materials: An unintended consequence. Science of the Total Environment 609: 1126-1131.
Lindstrom, A; Strynar, M; Delinsky, A; Nakayama, S; McMillan, L; Libelo, E; Neill, M; Thomas, L. (2011). Application of WWTP biosolids and resulting perfluorinated compound contamination of surface and well water in Decatur, Alabama, USA. Environmental Science & Technology 45: 8015-8021.
Longhurst, P; Tompkins, D; Pollard, S; Hough, R; Chambers, B; Gale, P; Tyrrel, S; Villa, R; Taylor, M; Wu, S; Sakrabani, R; Litterick, A; Snary, E; Leinster, P; Sweet, N. (2019). Risk assessments for quality-assured, source-segregated composts and anaerobic digestates for a circular bioeconomy in the UK. Environment International 127: 253-266.
Lopez-Espinosa, M; Mondal, D; Armstrong, B; Bloom, M; Fletcher, T. (2012). Thyroid function and perfluoroalkyl acids in children living near a chemical plant. Environmental Health Perspectives 120: 1036-1041.
Macon, M; Villanueva, L; Tatum-Gibbs, K; Zehr, R; Strynar, M; Stanko, J; White, S; Helfant, L; Fenton, S. (2011). Prenatal perfluorooctanoic acid exposure in CD-1 mice: Low-dose developmental effects and internal dosimetry. Toxicological Sciences 122: 134-145.
MacRae, J; Nayak, B; Isenhour, C; Blackmer, T; Silka, L. (2020). The Emergent Risks of Food Waste Recovery: Characterizing the Contaminants in MSW Organics from Different Sources. Environmental Research and Education Foundation.
Maine DEP (Maine Department of Environmental Protection). (2019a). DEP announces testing of all sludge materials before land application.
Maine DEP (Maine Department of Environmental Protection). (2019b). Requirement to analyze for PFAS compounds Memorandum and Standard Operating Procedure (SOP) Addendum A: Additional Requirements for the Sampling of Perfluorinated Alkylated Substances (PFASs), Perfluorooctanoic acid (PFOA) and Perfluorooctane sulfonate (PFOS).
Masoner, J; Kolpin, D; Cozzarelli, I; Smalling, K; Bolyard, S; Field, J; Furlong, E; Gray, J; Lozinski, D; Reinhart, D; Rodowa, A; Bradley, P. (2020). Landfill leachate contributes per-/poly-fluoroalkyl substances (PFAS) and pharmaceuticals to municipal wastewater. Environmental Science Water Research & Technology 6: 1300-1311.
Persistent Chemical Contaminants 76
McCord, JP; Strynar, MJ; Washington, JW; Bergman, EL; Goodrow, SM. (2020). Emerging Chlorinated Polyfluorinated Polyether Compounds Impacting the Waters of Southwestern New Jersey Identified by Use of Nontargeted Analysis. Environmental Science & Technology Letters 7: 903-908. https://doi.org/10.1021/acs.estlett.0c00640
McEntee, K. (2016). New USDA "green waste" rule under development. Composting News 25. http://www.recycle.cc/2016cn08august2016.pdf
Michel, F; Grewal, S; Li, Y. (2012). Long-term persistence of aminocyclopyrachlor and clopyralid during composting. 8th International ORBIT Conference, June 12-15, 2012, Rennes, France.
Michel Jr, F; Doohan, D. (2020). Clopyralid and Other Pesticides in Composts. The Ohio State University: Extension FactSheet. https://www.global2000.at/sites/global/files/Clopyralid_Factsheet.pdf
Michel Jr, F; Speicher, K; Zang, B; Huezo, L. (2016). Characterization of Commercial Composting Facilities and Composts in the USA. ORBIT 2016, Circular Economy and Organic Waste, European Composting Network/Harokopio137.
Michel Jr., F; Quensen, J; Reddy, C. (2001). Bioremediation of a PCB contaminated soil via composting. Compost Science and Utilization 9: 274-284.
Michigan EGLE (Michigan Department of Environment, Great Lakes, and Energy). (2020). Summary Report: Initiatives to Evaluate the Presence of PFAS in Municipal Wastewater and Associated Residuals (Sludge/Biosolids) in Michigan. https://www.michigan.gov/documents/egle/wrd-pfas-initiatives_691391_7.pdf
Miller, K. (2020). State investigating ‘very startling’ levels of PFAS chemicals on central Maine dairy farm. Retrieved from https://www.pressherald.com/2020/07/24/state-investigating-very-startling-levels-of-pfas-chemicals-on-central-maine-dairy-farm/#
MPCA (Minnesota Pollution Control Agency). (2019). Site investigation report: Investigation of per- and polyfluoroalkyl substances at select source separated organic material and yard waste sites, Minnesota. Wood Environment & Infrastructure Solutions Inc. https://www.pca.state.mn.us/sites/default/files/w-sw4-37.pdf
MPCA (Minnesota Pollution Control Agency). (2020). Composting and PFAS. https://www.pca.state.mn.us/waste/composting-and-pfas
MWRA (Michigan Waste & Recycling Association). (2019). Michigan Waste & Recycling Association Statewide Study on Landfi ll Leachate PFOA and PFOS Impact on Water Resource Recovery Facility Infl uent. https://www.bridgemi.com/sites/default/files/mwra-technical-report.pdf
NAS (National Academies of Sciences, Engineering, Medicine). (2020). Understanding, Controlling, and Preventing Exposure to PFAS: Proceedings of a Workshop–in Brief. Washington, DC: The National Academies Press. https://www.nap.edu/catalog/25856/understanding-controlling-and-preventing-exposure-to-pfas-proceedings-of-a
National Archives and Records Administration. (2001). Federal Register; 12-21-01 (pp. 65811–66292). Washington, DC. https://www.govinfo.gov/content/pkg/FR-2001-12-21/pdf/FR-2001-12-21.pdf
National Archives and Records Administration. (2003). Federal Register: 10-24-03 (pp. 60841-61096). Washington, DC. https://www.govinfo.gov/content/pkg/FR-2003-10-24/pdf/FR-2003-10-24.pdf
New Hampshire DES (New Hampshire Department of Environmental Services). (2020). Biosolids. Available online at https://www.des.nh.gov/land/biosolids
New Jersey DEP (New Jersey Department of Environmental Protection). (2020). Federal and NJ State Primary and Secondary Drinking Water Standards as of June 2020.
Persistent Chemical Contaminants 77
https://www.state.nj.us/dep/watersupply/pdf/dw-standards.pdf
NHDES (New Hampshire Department of Environmental Services). (2020). Requested Action: Authorize Department of Environmental Services (DES) to enter into a Sole Source agreement with the U.S. Geological Survey (USGS) to study the occurrence and behavior of per- and poly-fiuoroalkyi substances (PFAS) in soils and biosolids in New Hampshire. https://sos.nh.gov/media/3ughb5aw/60-gc-agenda-092320.pdf
NIEHS (National Institute of Environmental Health Sciences). (2020). Perfluoroalkyl and Polyfluoroalkyl Substances (PFAS). https://www.niehs.nih.gov/health/topics/agents/pfc/index.cfm#:~:text=PFAS%20are%20used%20in%20hundreds,of%20this%20type%20of%20chemical
NRC (National Research Council). (1996). Use of reclaimed water and sludge in food crop production. Wasington, DC: National Academy Press. https://www.nap.edu/read/5175/chapter/1
NRC (National Research Council). (2002). Biosolids applied to land: Advancing standards and practices. Washington, DC: The National Academies Press. https://www.nap.edu/catalog/10426/biosolids-applied-to-land-advancing-standards-and-practices
NTP (National Toxicology Program). (2016). NTP Monograph: Immunotoxicity associated with exposure to perfluorooctanoic acid or perfluorooctane sulfonate. Research Triangle Park, NC: U.S. Department of Health and Human Services, National Institutes of Health, National Toxicology Program. https://ntp.niehs.nih.gov/ntp/ohat/pfoa_pfos/pfoa_pfosmonograph_508.pdf
NTP (National Toxicology Program). (2019a). Toxicity studies of perfluoroalkyl carboxylates administered by gavage to Sprague Dawley (Hsd:Sprague Dawley SD) rats. (TOX-97). Research Triangle Park, NC. https://ntp.niehs.nih.gov/ntp/htdocs/st_rpts/tox097_508.pdf
NTP (National Toxicology Program). (2019b). Toxicity studies of perfluoroalkyl sulfonates administered by gavage to Sprague Dawley (Hsd:Sprague Dawley SD) rats. (TOX-96). Research Triangle Park, NC. https://ntp.niehs.nih.gov/ntp/htdocs/st_rpts/tox096_508.pdf
NTP (National Toxicology Program). (2020). Toxicology and carcinogenesis studies of perfluorooctanoic acid administered in feed to Sprague Dawley (Hsd:Sprague Dawley SD) rats. (TR-598). Research Triangle Park, NC. https://ntp.niehs.nih.gov/ntp/htdocs/lt_rpts/tr598_508.pdf
ODA (Oregon Department of Agriculture). (2020a). Pesticide advisory: Clopyralid in compost/manures
ODA (Oregon Department of Agriculture). (2020b). Soil/compost and clopyralid Issues – Pesticide use investigations #200405, #200408, #200481, and #210040 https://www.oregon.gov/oda/programs/Pesticides/Documents/2020/ClopyralidNovemberUpdate.pdf
OECD (Organisation for Economic Co-Operation and Development). (2018). Toward a New Comprehensive Global Database of Per and Polyfluoralkyl Substances (PFASs): Summary Report on Updating the OECD 2007 List of Per and Polyfluoroalkyl Substances (PFASs). https://www.oecd.org/officialdocuments/publicdisplaydocumentpdf/?cote=ENV-JM-MONO(2018)7&doclanguage=en
OMRI (Organic Materials Review Institute). (2010). NOP Allowance of Green Waste. https://www.omri.org/news/85806/compost-issue-update
Penn State University Extension. (1999). Persistence of Herbicides in Soil. https://extension.psu.edu/persistence-of-herbicides-in-soil
Pérez, F; Llorca, M; Köck-Schulmeyer, M; Škrbić, B; Oliveira, L; da Boit Martinello, K; Al-Dhabi, N; Antić, I; Farré, M; Barceló, D. (2014). Assessment of perfluoroalkyl substances in food items at global scale. Environmental Research 135: 181-189.

Persistent Chemical Contaminants 78
Pleasant, B. (2009). Contaminated Compost: Coming Soon to a Store Near You. Mother Earth News.
Poothong, S; Boontanon, S; Boontanon, N. (2012). Determination of perfluorooctane sulfonate and perfluorooctanoic acid in food packaging using liquid chromatography coupled with tandem mass spectrometry. J Hazard Mater 205-206: 139-143.
Qian, K; Kumar, A; Zhang, H; Bellmer, D; Huhnke, R. (2015). Recent advances in utilization of biochar. Renewable and Sustainable Energy Reviews 42: 1055-1064. https://www.sciencedirect.com/science/article/pii/S1364032114008995
Recycled Organics Unit. (2004). Persistent Herbicides Risk Management Program: Research Report and Recommendations. Report prepared for the Department of Environment and Conservation (NSW, Sustainability Programs Division) by the Recycled Organics Unit, The University of New South Wales, Sydney, Australia. https://www.epa.nsw.gov.au/~/media/EPA/Corporate%20Site/resources/warrlocal/050365-herbicides.ashx
Risse, M; Faucette, B. (2017). Food waste composting: Institutional and industrial applications. UGA Extension Bulletin 1189: 1-8.
Ruffle, B; Vedagiri, U; Bogdan, D; Maier, M; Schwach, C; Murphy-Hagan, C. (2020). Perfluoroalkyl Substances in U.S. market basket fish and shellfish. Environmental Research 190: 109932. https://www.sciencedirect.com/science/article/pii/S0013935120308276
Saito, R; Ikenaga, O; Ishihara, S; Shibata, H; Iwafune, T; Sato, T; Yamashita, Y. (2010). Determination of herbicide clopyralidresidues in crops grown in clopyralid-contaminated soils. Journal of Pesticide Science 35: 479-482.
Salter, G. (2020). State legislatures take the lead on turning off tap on toxic chemicals. Safer States. http://www.saferstates.org/news/states-in-the-lead/
Sawhney, B; Hankin, L. (1985). Polychlorinated biphenyls in food: A review. Journal of Food Protection 48: 442-448.
Schaider, L; Balan, S; Blum, A; Andrews, D; Strynar, M; Dickinson, M; Lunderberg, D; Lang, J; Peaslee, G. (2017). Fluorinated compounds in U.S. fast food packaging. Environmental Science & Technology Letters 4: 105-111. https://pubmed.ncbi.nlm.nih.gov/30148183
Schecter, A; Colacino, J; Haffner, D; Patel, K; Opel, M; Päpke, O; Birnbaum, L. (2010). Perfluorinated Compounds, Polychlorinated Biphenyls, and Organochlorine Pesticide Contamination in Composite Food Samples from Dallas, Texas, USA. Environmental Health Perspectives 118: 796-802. https://doi.org/10.1289/ehp.0901347
Scher, DP; Kelly, JE; Huset, CA; Barry, KM; Hoffbeck, RW; Yingling, VL; Messing, RB. (2018). Occurrence of perfluoroalkyl substances (PFAS) in garden produce at homes with a history of PFAS-contaminated drinking water. Chemosphere 196: 548-555. https://www.sciencedirect.com/science/article/pii/S0045653517321574
Schreder, E; Dickman, J. (2018). Take out toxics: PFAS chemicals in food packaging. Toxic-Free Future. https://48h57c2l31ua3c3fmq1ne58b-wpengine.netdna-ssl.com/wp-content/uploads/2019/05/Take-Out-Toxics-Full-Report.pdf
Schweighuber, A; Himmelsbach, M; Buchberger, W; Klampfl, C. (2019). Analysis of polycyclic aromatic hydrocarbons migrating from polystyrene/divinylbenzene-based food contact materials. Monatshefte für Chemie - Chemical Monthly 150: 901-906. https://doi.org/10.1007/s00706-019-2377-1
SFBOS (San Francisco Board of Supervisors). (2018). Environment code - Single-use food ware plastics, toxics, and litter reduction. (Ordinance No. 294-18). https://sfbos.org/sites/default/files/o0294-18.pdf

Persistent Chemical Contaminants 79
Sinclair, E; Kannan, K. (2006). Mass loading and fate of perfluoroalkyl surfactants in wastewater treatment plants. Environmental Science & Technology 40: 1408-1414.
Sinclair, G; Long, S; Jones, O. (2020). What are the effects of PFAS exposure at environmentally relevant concentrations? Chemosphere 258: 1-15.
Sorg, L. (2020). PW exclusive: Herbicide-tainted compost plaguing NC farmers and gardeners. Retrieved from http://www.ncpolicywatch.com/2020/08/19/pw-exclusive-herbicide-tainted-compost-plaguing-nc-farmers-and-gardeners/
State of Maine. (2019). Public Law c. 277: An Act To Protect the Environment and Public Health by Further Reducing
Toxic Chemicals in Packaging. https://www.maine.gov/dep/safechem/packaging/LD1433-PL277.pdf
State of Massachusetts. (2020). PFAS in Residuals: Information on MassDEP efforts to establish standards for Per- and Polyfluoroalkyl Substances (PFAS) in Residuals. https://www.mass.gov/info-details/pfas-in-residuals
State of Michigan. (2020). New state drinking water standards pave way for expansion of Michigan's PFAS clean-up efforts. https://www.michigan.gov/pfasresponse/0,9038,7-365-86513_96296-535603--,00.html
State of New Hampshire. (2020). New Hampshire House Bill 1264. https://legiscan.com/NH/text/HB1264/2020
State of New York. (2020a). Maximum Contaminant Levels (MCLs). https://regs.health.ny.gov/sites/default/files/proposed-regulations/Maximum%20Contaminant%20Levels%20%28MCLs%29.pdf
State of New York. (2020b). Senate Bill S8817. https://www.nysenate.gov/legislation/bills/2019/s8817
State of Oregon. (2019). Products containing Aminocyclopyrochlor. https://www.oregon.gov/ODA/programs/Pesticides/RegulatoryIssues/Documents/Documents/2019/ProductsList.pdf
State of Rhode Island. (2020). An Act Relating to Waters and Navigation -- PFAS in Drinking Water, Groundwater and Surface Waters. http://webserver.rilin.state.ri.us/BillText/BillText20/HouseText20/H7216.pdf
State of Washington. (2019). RCW 70A.222.070. https://app.leg.wa.gov/rcw/default.aspx?cite=70A.222.070
Stone, A. (2014). Polychlorinated biphenyls (PCBs) in general consumer products. (Publication No. 14-04-035). State of Washington, Department of Ecology. https://fortress.wa.gov/ecy/publications/documents/1404035.pdf
Sullivan, D. (2011). DuPont Label Says "Do Not Compost" Grass Clippings. BioCycle 52: 23. https://www.biocycle.net/dupont-label-says-do-not-compost-grass-clippings/#:~:text=To%20protect%20the%20compost%20industry,turf%20treated%20with%20clopyralid%20should
Suominen, K; Verta, M; Marttinen, S. (2014). Hazardous organic compounds in biogas plant end products—soil burden and risk to food safety. Science of the Total Environment 491-492: 192-199.
Supply Chains Solutions Center. (2021). Testing for PFAS in food packaging. https://supplychain.edf.org/resources/testing-for-pfas-in-food-packaging/
Sustainable Food News. (2017). Feds withdraw organic compost standards amendment. Available online at https://sustainablefoodnews.com/feds-withdraw-organic-compost-standards-amendment/
Tavazzi, S; Locoro, G; Comero, S; Sobiecka, E; Loos, R; Eder, P; Saveyn, H; Blaha, L; Benisek, M; Gans, O;

Persistent Chemical Contaminants 80
Hartl, W; Voorspoels, S; Ghiani, M; Umlauf, G; Mariani, G; Suurkuusk, G; Paracchini, B; Cristache, C; Fissiaux, I; Alonso-Ruiz, A; Gawlik, B. (2013). Occurrence and levels of selected compounds in European compost and digestate samples. (Report EUR 26164 EN). European Commission, Joint Research Center, Institute for Environment and Sustainability.
Tittlemier, S; Pepper, K; Seymour, C; Moisey, J; Bronson, R; Cao, X; Dabeka, R. (2007). Dietary exposure of Canadians to perfluorinated carboxylates and perfluorooctane sulfonate via consumption of meat, fish, fast foods, and food items prepared in their packaging. Journal of Agricultural and Food Chemistry 55: 3203-3210.
Trier, X; Granby, K; Christensen, J. (2011). Polyfluorinated surfactants (PFS) in paper and board coatings for food packaging. Environmental Science and Pollution Research International 18: 1108-1120.
Trier, X; Taxvig, C; Rosenmai, A; Pedersen, G. (2017). PFAS in paper and board for food contact - options for risk management of poly- and perfluorinated substances. Copenhagen, Denmark: Nordic Council of Ministers.
Tu, M; Hurd, C; Robison, R; Randall, J. (2001). Clopyralid. In Weed Controls Methods Handbook: The Nature Conservancy. https://www.invasive.org/gist/products/handbook/11.Clopyralid.pdf
U.S. EPA (U.S. Environmental Protection Agency). (1994). A plain English guide to the EPA part 503 biosolids rule. (EPA-832/R-93/003). https://www.epa.gov/sites/production/files/2018-12/documents/plain-english-guide-part503-biosolids-rule.pdf
U.S. EPA (U.S. Environmental Protection). (1997). Polymer Exemption Guidance Manual. Washington, DC. https://www.epa.gov/sites/production/files/2015-03/documents/polyguid.pdf
U.S. EPA (U.S. Environmental Protection Agency). (2003). Final Response to the National Research Council Report. https://www.epa.gov/sites/production/files/2018-11/documents/final-response-2002-nrc-report-factsheet.pdf
U.S. EPA (U.S. Environmental Protection Agency). (2009). Polycyclic aromatic hydrocarbons (PAHs). https://www.epa.gov/sites/production/files/2014-03/documents/pahs_factsheet_cdc_2013.pdf
U.S. EPA (U.S. Environmental Protection Agency). (2011). Carbofuran Cancellation Process. https://archive.epa.gov/pesticides/reregistration/web/html/carbofuran_noic.html#revocation
U.S. EPA. (2016a). Health Effects Support Document for Perfluorooctane Sulfonate (PFOS). Washington, DC. https://www.epa.gov/sites/production/files/2016-05/documents/pfos_hesd_final_508.pdf
U.S. EPA (U.S. Environmental Protection Agency). (2016b). Health Effects Support Document for Perfluorooctanoic Acid (PFOA). Washington, DC. https://www.epa.gov/sites/production/files/2016-05/documents/pfoa_hesd_final_508.pdf
U.S. EPA (U.S. Environmental Protection Agency). (2017a). Aroclor 1254: CASRN 11097-69-1 | DTXSID5020100. https://cfpub.epa.gov/ncea/iris2/chemicalLanding.cfm?substance_nmbr=389
U.S. EPA (U.S. Environmental Protection Agency). (2017b). Technical Fact Sheet – Perfluorooctane Sulfonate (PFOS) and Perfluorooctanoic Acid (PFOA). https://www.epa.gov/sites/production/files/2017-12/documents/ffrrofactsheet_contaminants_pfos_pfoa_11-20-17_508_0.pdf
U.S. EPA (U.S. Environmental Protection Agency). (2018a). 40 CFR Part 503: Standards for the use or disposal of sewage sludge. https://www.govinfo.gov/content/pkg/CFR-2018-title40-vol32/xml/CFR-2018-title40-vol32-part503.xml
U.S. EPA (U.S. Environmental Protection Agency). (2018b). Basic information on PFAS. https://www.epa.gov/pfas/basic-information-pfas
U.S. EPA (U.S. Environmental Protection Agency). (2018c). EPA unable to assess the impact of hundreds of

Persistent Chemical Contaminants 81
unregulated pollutants in land-applied biosolids on human health and the environment. (Report No. 19-P-0002). U.S. Environmental Protection Agency, Office of Inspector General. https://www.epa.gov/sites/production/files/2018-11/documents/_epaoig_20181115-19-p-0002.pdf
U.S. EPA (U.S. Environmental Protection Agency). (2019a). Drinking water health advisories for PFOA and PFOS. https://www.epa.gov/ground-water-and-drinking-water/drinking-water-health-advisories-pfoa-and-pfos
U.S. EPA (U.S. Environmental Protection Agency). (2019b). EPA Analytical Methods for PFAS in Drinking Water. https://www.epa.gov/sites/production/files/2019-12/documents/table_of_pfas_methods_533_and_537.1.pdf
U.S. EPA (U.S. Environmental Protection Agency). (2019c). EPA’s per- and polyfluoroalkyl substances (PFAS) action plan. (EPA 823R18004). https://www.epa.gov/sites/production/files/2019-02/documents/pfas_action_plan_021319_508compliant_1.pdf
U.S. EPA (U.S. Environmental Protection Agency). (2019d). EPA’s PFAS Action Plan: A Summary of Key Actions. https://www.epa.gov/sites/production/files/2019-02/documents/pfas_action_factsheet_021319_final_508compliant.pdf
U.S. EPA (U.S. Environmental Protection Agency). (2019e). Practical Methods to Analyze and Treat Emerging Contaminants (PFAS) in Solid Waste, Landfills, Wastewater/Leachates, Soils, and Groundwater to Protect Human Health and the Environment. https://cfpub.epa.gov/ncer_abstracts/index.cfm/fuseaction/recipients.display/rfa_id/643/records_per_page/ALL
U.S. EPA (U.S. Environmental Protection Agency). (2019f). Registration Review Label Mitigation for Chlorsulfuron. https://www3.epa.gov/pesticides/chem_search/ppls/000432-01569-20190510.pdf
U.S. EPA (U.S. Environmental Protection Agency). (2019g). Response to November 15, 2018, Office of Inspector General’s Final Report, ‘EPA Unable to Assess the Impact of Hundreds of Unregulated Pollutants in the Land-Applied Biosolids on Human Health and the Environment.’ Memorandum from David P. Ross, Assistant Administrator, Office of Water, to Charles Sheehan, Acting Assistant Inspector General, Office of Audit and Evaluation, U.S. Environmental Protection Agency. https://www.epa.gov/sites/production/files/2019-07/documents/_epaoig_19-p-0002_agency_response.pdf
U.S. EPA (U.S. Environmental Protection Agency). (2020a). 40 CFR Part 180: Tolerances and exemptions for pesticide chemical residues in food. https://www.ecfr.gov/cgi-bin/text-idx?SID=a3b649316ccb17c31211db2edd81f789&mc=true&node=pt40.24.180&rgn=div5#se40.26.180_1689
U.S. EPA (U.S. Environmental Protection Agency). (2020b). 2018 Wasted Food Report. https://www.epa.gov/sites/production/files/2020-11/documents/2018_wasted_food_report.pdf
U.S. EPA (U.S. Environmental Protection Agency). (2020c). Bifenthrin: Interim Registration Review Decision, Case Number 7402. https://www.regulations.gov/document/EPA-HQ-OPP-2010-0384-0299
U.S. EPA (U.S. Environmental Protection Agency). (2020d). Clopyralid: Interim Registration Review Decision, Case Number 7212 https://www.regulations.gov/document/EPA-HQ-OPP-2014-0167-0622
U.S. EPA (U.S. Environmental Protection Agency). (2020e). Composting at home. https://www.epa.gov/recycle/composting-home
U.S. EPA (U.S. Environmental Protection Agency). (2020f). Draft Ecological Risk Assessment for the Registration Review of Aminopyralid. https://www.regulations.gov/document/EPA-HQ-OPP-2013-0749-0048
U.S. EPA (U.S. Environmental Protection Agency). (2020g). EPA PFAS Action Plan: Program Update. https://www.epa.gov/sites/production/files/2020-01/documents/pfas_action_plan_feb2020.pdf
Persistent Chemical Contaminants 82
U.S. EPA (U.S. Environmental Protection Agency). (2020h). EPA PFAS Drinking Water Laboratory Methods. https://www.epa.gov/pfas/epa-pfas-drinking-water-laboratory-methods
U.S. EPA (U.S. Environmental Protection Agency). (2020i). Food Recovery Hierarchy. https://www.epa.gov/sustainable-management-food/food-recovery-hierarchy
U.S. EPA (U.S. Environmental Protection Agency). (2020j). Food: Material-specific data. https://www.epa.gov/facts-and-figures-about-materials-waste-and-recycling/food-material-specific-data
U.S. EPA (U.S. Environmenal Protection Agency). (2020k). Per- and Polyfluoroalkyl Substances (PFAS): Incineration to Manage PFAS Waste Streams. https://www.epa.gov/sites/production/files/2019-09/documents/technical_brief_pfas_incineration_ioaa_approved_final_july_2019.pdf
U.S. EPA (U.S. Environmental Protection Agency). (2020l). PRIA Label Amendment – New Restricted Use on Non-Hayed, Privately-Owned Rangelands in AZ, NM, OK, and TX. https://www3.epa.gov/pesticides/chem_search/ppls/000432-01545-20200203.pdf
U.S. EPA (U.S. Environmental Protection Agency). (2020m). Sustainable management of food: United States 2030 food loss and waste reduction goal. https://www.epa.gov/sustainable-management-food/united-states-2030-food-loss-and-waste-reduction-goal
U.S. EPA (U.S. Environmental Protection Agency). (2020n). What are PCBs? https://www.epa.gov/pcbs/learn-about-polychlorinated-biphenyls-pcbs#what
U.S. EPA (U.S. Environmental Protection ). (2021a). About Pesticide Registration. https://www.epa.gov/pesticide-registration/about-pesticide-registration
U.S. EPA (U.S. Environmental Protection Agency). (2021b). Anaerobic Digestion Facilities Processing Food Waste in the United States (2017 & 2018). https://www.epa.gov/sites/production/files/2021-02/documents/2021_final_ad_report_feb_2_with_links.pdf
U.S. EPA (U.S. Environmental Protection Agency). (2021c). Biennial Review of 40 CFR Part 503 as Required under the Clean Water Act Section 405(d)(2)(C) https://www.epa.gov/sites/production/files/2021-02/documents/biennial-review8-report-2021.pdf
U.S. EPA (U.S. Environmental Protection Agency). (2021d). Biennial Reviews of Sewage Sludge Standards. https://www.epa.gov/biosolids/biennial-reviews-sewage-sludge-standards
U.S. EPA (U.S. Environmental Protection Agency). (2021e). CompTox Chemicals Dashboard. https://comptox.epa.gov/dashboard/
U.S. EPA (U.S. Environmental Protection Agency). (2021f). Estimation Programs Interface Suite™ for Microsoft® Windows, v 4.11. Washington, DC. https://www.epa.gov/tsca-screening-tools/epi-suitetm-estimation-program-interface
U.S. EPA (U.S. Environmental Protection Agency). (2021g). Interim Guidance on the Destruction and Disposal of Perfluoroalkyl and Polyfluoroalkyl Substances and Materials Containing Perfluoroalkyl and Polyfluoroalkyl Substances. https://www.regulations.gov/document/EPA-HQ-OLEM-2020-0527-0002
U.S. EPA (U.S. Environmental Protection Agency). (2021h). List of FY 2019 Pesticide Registration Review Actions. https://www.epa.gov/pesticide-reevaluation/list-fy-2019-pesticide-registration-review-actions
U.S. EPA (U.S. Environmental Protection Agency). (2021i). National Overview: Facts and Figures on Materials, Wastes and Recycling. https://www.epa.gov/facts-and-figures-about-materials-waste-and-recycling/national-overview-facts-and-figures-materials#:~:text=The%20total%20generation%20of%20municipal,pounds%20per%20person%20per%20day.&text=In%20addition%2C%20nearly%2035%20million,(50%20percent)%20were%20landfilled
Persistent Chemical Contaminants 83
U.S. EPA (U.S. Environmental Protection Agency). (2021j). National Primary Drinking Water Regulations. https://www.epa.gov/ground-water-and-drinking-water/national-primary-drinking-water-regulations
U.S. EPA (U.S. Environmental Protection Agency). (2021k). PFAS Innovative Treatment Team (PITT). https://www.epa.gov/chemical-research/pfas-innovative-treatment-team-pitt
U.S. EPA (U.S. Environmental Protection Agency). (2021l). Picloram Proposed Interim Registration Review Decision Case Number 0096. https://www.regulations.gov/document/EPA-HQ-OPP-2013-0740-0073
U.S. EPA. (2021m). Registration Review Process. https://www.epa.gov/pesticide-reevaluation/registration-review-process
U.S. EPA (U.S. Environmental Protection Agency). (2021n). Risk Assessment of Pollutants in Biosolids. https://www.epa.gov/biosolids/risk-assessment-pollutants-biosolids
U.S. EPA (U.S. Environmental Protection Agency). (2021o). Status of EPA Research and Development on PFAS. https://www.epa.gov/chemical-research/status-epa-research-and-development-pfas#methods
United States Congress. (2020). Public Law No. 116-92: National Defense Authorization Act for Fiscal Year 2020. https://www.govinfo.gov/content/pkg/PLAW-116publ92/html/PLAW-116publ92.htm
USCC (U.S. Composting Council). (2013). USCC Position: Persistent herbicides. Reston, VA. https://old.compostingcouncil.org/wp-content/plugins/wp-pdfupload/pdf/9199/USCC-Position-Statement-on-Persistent-Herbicides-FINAL.pdf
USCC (U.S. Composting Council,). (2015). Strategies to Mitigate Persistent Herbicide Contamination at Your Composting Facility. https://cdn.ymaws.com/www.compostingcouncil.org/resource/resmgr/images/USCC-PH-Fact-Sheet-2-for-web.pdf
USCC (U.S. Composting Council). (2020a). Persistent herbicides FAQ. https://www.compostingcouncil.org/page/persistent-herbicides-faq
USCC (U.S. Composting Council). (2020b). STA certified compost - Test result limits for compost manufacturers. https://www.compostingcouncil.org/page/TestResultLimits
USCC (U.S. Composting Council). (2020c). STA requirements. https://www.compostingcouncil.org/page/STA-Requirements
USDA (U.S. Department of Agriculture). (2020a). 5016: Allowance of green waste in organic production systems. https://www.ams.usda.gov/rules-regulations/organic/handbook/5016
USDA (U.S. Department of Agriculture). (2020b). Response to USEPA OIG Report No. 19-P-0002. https://www.nimss.org/system/ProjectAttachment/files/000/000/502/original/W4170%20Response%20to%20OIG%20Report%20July%2023%202020%20final.pdf
Vaughn, B; Winquist, A; Steenland, K. (2013). Perfluorooctanoic acid (PFOA) exposures and incident cancers among adults living near a chemical plant. Environmental Health Perspectives 121: 1313-1318.
Vermont DEC (Vermont Department of Environmental Conservation). (2020). Per and Polyfluoroalkyl Substances (PFAS) & Drinking Water. https://dec.vermont.gov/water/drinking-water/water-quality-monitoring/pfas#:~:text=The%20MCL%20is%2020%20nanograms,%2C%20PFNA%20(perfluorononanoic%20acid)
Vested, A; Ramlau-Hansen, C; Olsen, S; Bonde, J; Kristensen, S; Halldorsson, T; Becher, G; Haug, L; Ernst, E; Toft, G. (2013). Associations of in utero exposure to Perfluorinated Alkyl Acids with human semen quality and reproductive hormones in adult men. Environmental Health Perspectives 121: 453-458.
Vestergren, R; Orata, F; Berger, U; Cousins, IT. (2013). Bioaccumulation of perfluoroalkyl acids in dairy cows in a

Persistent Chemical Contaminants 84
naturally contaminated environment. Environmental Science and Pollution Research 20: 7959-7969. https://doi.org/10.1007/s11356-013-1722-x
Višniauskė, I; Barčauskaitė, K; Baksiene, E; Mazeika, R. (2018). Evaluation of contamination levels of different types of composts and their suitability for usage in agriculture. Zemdirbyste-Agriculture 105: 211-220.
Wang, W; Rhodes, G; Ge, J; Yu, X; Li, H. (2020). Uptake and accumulation of per- and polyfluoroalkyl substances in plants. Chemosphere 261: 127584. https://www.sciencedirect.com/science/article/pii/S0045653520317793
Wang, Z; Zhang, T; Wu, J; Wei, X; Xu, A; Wang, S; Wang, Z. (2021). Male reproductive toxicity of perfluorooctanoate (PFOA): Rodent studies. Chemosphere 270: 128608. https://www.sciencedirect.com/science/article/pii/S0045653520328034
Washington DOH (State of Washington Department of Health). (2020). Group A Public Water Supplies • Chapter 246-290 WAC; DOH Approach to Developing PFAS State Action Levels. https://www.doh.wa.gov/Portals/1/Documents/4200/PFAS-DOHApproach.pdf
Washington, JW; Jenkins, TM; Rankin, K; Naile, JE. (2015). Decades-Scale Degradation of Commercial, Side-Chain, Fluorotelomer-Based Polymers in Soils and Water. Environmental Science & Technology 49: 915-923. https://doi.org/10.1021/es504347u
Washington, JW; Naile, JE; Jenkins, TM; Lynch, DG. (2014). Characterizing Fluorotelomer and Polyfluoroalkyl Substances in New and Aged Fluorotelomer-Based Polymers for Degradation Studies with GC/MS and LC/MS/MS. Environmental Science & Technology 48: 5762-5769. https://doi.org/10.1021/es500373b
Washington, JW; Rosal, CG; McCord, JP; Strynar, MJ; Lindstrom, AB; Bergman, EL; Goodrow, SM; Tadesse, HK; Pilant, AN; Washington, BJ; Davis, MJ; Stuart, BG; Jenkins, TM. (2020). Nontargeted mass-spectral detection of chloroperfluoropolyether carboxylates in New Jersey soils. Science 368: 1103. http://science.sciencemag.org/content/368/6495/1103.abstract
Washington, JW; Yoo, H; Ellington, JJ; Jenkins, TM; Libelo, EL. (2010). Concentrations, Distribution, and Persistence of Perfluoroalkylates in Sludge-Applied Soils near Decatur, Alabama, USA. Environmental Science & Technology 44: 8390-8396. https://doi.org/10.1021/es1003846
Watanabe, E; Seike, N. (2020). Detection of herbicide clopyralid at nanogram per gram level in agricultural products using easy-to-use micro liquid–liquid extraction followed by analysis with ultraperformance liquid chromatography–tandem mass spectrometry. Journal of Chromatography A 1630: 461578. https://www.sciencedirect.com/science/article/pii/S0021967320308529
wca environment Ltd. (2019). The assessment of organic contaminants in materials spread on land. (SN7 7YR). Oxforshire, UK: WCA Environment for Scottish Environment Protection Agency. https://www.sepa.org.uk/media/413269/organic_contaminants_materials_to_land.pdf
Wei, Z; Xu, T; Zhao, D. (2019). Treatment of per- and polyfluoroalkyl substances in landfill leachate: Status, chemistry and prospects. Environmental Science: Water Research & Technology 5: 1814-1835. http://dx.doi.org/10.1039/C9EW00645A
Williams, T. (2021). Biosolids Compost PFAS Testing. BioCycle. https://www.biocycle.net/biosolids-compost-pfas-testing/
Wood (Wood Environment & Infrastructure Solutions UK Limited). (2019). Digestate and compost as fertilisers: Risk assessment and risk management options. Wood, Ramboll, and Peter Fisk Associates for the European Commission. https://ec.europa.eu/environment/chemicals/reach/pdf/40039%20Digestate%20and%20Compost%20RMOA%20-%20Final%20report%20i2_20190208.pdf
WRAP (Waste & Resources Action Programme). (2010). An investigation of clopyralid and aminopyralid in
Persistent Chemical Contaminants 85
commercial composting systems. (OAV031-002). https://www.wrap.org.uk/sites/files/wrap/Clopyralid%20Report.pdf
WRAP (Waste & Resources Action Programme). (2011). New markets for digestate from anaerobic digestion. (ISS001-001). https://www.wrap.org.uk/sites/files/wrap/New_Markets_for_AD_WRAP_format_Final_v2.c6779ccd.11341.pdf
WSDA and ODA (Washington State Department of Agriculture; Oregon Department of Agriculture). (2020). Joint letter from WSDA and ODA regarding EPA’s Clopyralid Proposed Interim Registration Review Decision Case Number 7212 (Document ID EPA-HQ OPP-2014-0167-0046), August 5, 2020. https://www.oregon.gov/oda/programs/Pesticides/Documents/2020/ODAWSDALetterToEPA.pdf
Ye, X; Schoenfuss, H; Jahns, N; Delinsky, A; Strynar, M; Varns, J; Nakayama, S; Helfant, L; Lindstrom, A. (2008a). Perfluorinated compounds in common carp (Cyprinus carpio) fillets from the Upper Mississippi River. Environment International 34: 932-938.
Ye, X; Strynar, M; Nakayama, S; Varns, J; Helfant, L; Lazorchak, J; Lindstrom, A. (2008b). Perfluorinated compounds in whole fish homogenates from the Ohio, Missouri, and Upper Mississippi Rivers, USA. Environmental Pollution 156: 1227-1232.
Yoo, H; Washington, JW; Ellington, JJ; Jenkins, TM; Neill, MP. (2010). Concentrations, Distribution, and Persistence of Fluorotelomer Alcohols in Sludge-Applied Soils near Decatur, Alabama, USA. Environmental Science & Technology 44: 8397-8402. https://doi.org/10.1021/es100390r
Yoo, H; Washington, JW; Jenkins, TM; Ellington, JJ. (2011). Quantitative Determination of Perfluorochemicals and Fluorotelomer Alcohols in Plants from Biosolid-Amended Fields using LC/MS/MS and GC/MS. Environmental Science & Technology 45: 7985-7990. https://doi.org/10.1021/es102972m
Yoo, H; Washington, JW; Jenkins, TM; Laurence Libelo, E. (2009). Analysis of perfluorinated chemicals in sludge: Method development and initial results. Journal of Chromatography A 1216: 7831-7839. https://www.sciencedirect.com/science/article/pii/S002196730901423X
Young, W; South, P; Begley, T; Noonan, G. (2013). Determination of perfluorochemicals in fish and shellfish using liquid chromatography-tandem mass spectrometry. Journal of Agricultural and Food Chemistry 61: 11166-11172.
Yuan, G; Peng, H; Huang, C; Hu, J. (2016). Ubiquitous occurrence of fluorotelomer alcohols in eco-friendly paper-made food-contact materials and their implication for human exposure. Environmental Science & Technology 50: 942-950.
Zabaleta, I; Blanco-Zubiaguirre, L; Baharli, E; Olivares, M; Prietoa, A; Zuloaga, O; Elizalde, M. (2020). Occurrence of per- and polyfluorinated compounds in paper and boardpackaging materials and migration to food simulants and foodstuffs. Food Chemistry 321: 1-10.

Persistent Chemical Contaminants 86
APPENDIX A: LITERATURE SEARCH METHODOLOGY This appendix presents the literature search methodology used to identify, screen, and manage literature sources for From Farm to Kitchen: The Environmental Impacts of U.S. Food Waste (Part 1) and associated issue papers, including this paper on persistent chemical contamination in food waste streams. The objective of this literature search was to identify the latest scientific information about food waste and food waste reduction, including emerging technologies and approaches for prevention, reuse, and recycling. In addition, analysis of the literature helped to identify knowledge gaps and the most important areas for future scientific research.
Section A.1. Methodology for Peer-Reviewed Literature describes the literature search methodology for peer-reviewed literature sources, and Section A.2. Methodology for Grey Literaturedescribes the identification of governmental and non-governmental reports that are not published in the peer-reviewed scientific literature, referred to as “gray literature” in this methodology.
This literature search identified and prioritized 3,219 peer-reviewed sources, 1,723 of which were screened as relevant to the scope of the From Farm to Kitchen report and issue papers. These source, as well as the key gray literature (see Section A.2. Methodology for Grey Literatureand additional key sources identified in supplemental, targeted literature searches, served as the primary corpus of literature from which literature synthesis and report development were performed. The report and associated issue papers were developed by primarily using the literature identified through this methodology, but were not limited to this set of literature as additional sources were identified subsequently (e.g., from peer-review recommendations).
A.1. Methodology for Peer-Reviewed Literature Peer-reviewed literature was identified with a search of selected publication databases using keywords and Boolean logic defined in this section. Titles and abstracts of the publications returned by the literature search were processed to eliminate duplicates and then screened to identify a subset of “key” sources that meet criteria for relevance and usefulness for the report or issue papers. Key sources were “tagged” to pre-defined topics to assist authors in identifying the most relevant sources for particular topics covered in the report.
Peer-Reviewed Literature Search Strategy The search of peer-reviewed literature focused on references relevant to the scope of the food waste report and issue papers from 2010–present, with special priority given to more recent papers, which were considered to be 2017–present. A targeted search to identify review papers from 2014–present was performed. During development of the report and issue papers, additional targeted searches were performed as needed within the 2010–present corpus of literature, and subject matter experts also identified key sources, some of which were dated in 2020 or 2021.
The following databases were searched for relevant peer-reviewed literature:
AGRICOLA (AGRICultural OnLine Access): AGRICOLA records describe publications and resources encompassing all aspects of agriculture and allied disciplines, including animal and veterinary sciences, entomology, plant sciences, forestry, aquaculture and fisheries, farming and farming systems, agricultural economics, extension and education, food and human nutrition, and earth and environmental sciences; Produced by the National Agricultural Library (NAL), U.S. Department of Agriculture.
AGRIS: AGRIS facilitates access to publications, journal articles, monographs, book chapters, and grey literature - including unpublished science and technical reports, theses, dissertations and conference papers in the area of agriculture and related sciences; Maintained by the Food and Agriculture Organization of the United Nations (FAO).
EBSCO: EBSCOhost Research Databases: Academic Search Complete; Energy & Power Source.

Persistent Chemical Contaminants 87
PubMed: US National Library of Medicine National Institutes of Health.
Web of Science: Web of Science Core Collection, refined by Research Area. Clarivate Analytics.
Table A-1 outlines the searches performed and the combinations of keyword sets and Boolean operators used to search each database. Four distinct sets of keywords were used to capture references with relevance to food waste, pathways of food waste and food waste reduction, environmental impacts of food waste, and emerging issues in the area of food waste. Sets were combined using Boolean logic to identify relevant references for screening and evaluation. Search results were limited to publications written in English.
For each search, all references were downloaded into EndNote and then DeDuper was used to remove duplicate references (i.e., references that appeared in more than one of the databases searched). DeDuper is a tool that uses a two-phase approach to identify and resolve duplicates: (1) it locates duplicates using automated logic, and (2) it employs machine learning to predict likely duplicates which are then verified manually.
TABLE A-1. SEARCH STRATEGY KEYWORDS
Set Search Keywords and Boolean Logic
Food Waste Food AND (waste OR loss OR "FLW") AND (prevention OR system OR consumed OR Surplus OR Excess OR Uneaten OR reduction OR supply OR demand OR Per capita OR Edible OR Inedible OR Safety OR recall OR packaging OR Preventable OR Drivers OR Spoilage OR perishable OR Freshness OR harvest OR transportation OR Processing OR manufacturing OR supermarket OR grocer* OR reuse OR recycling OR seasonal OR projection OR future OR economic)
Pathways ("Source reduction" OR Awareness OR education OR campaign OR LeanPath OR Photodiary OR storage OR Labeling OR (Refrigerator AND temperature) OR Cellar OR Frozen OR "Meal kits" OR packaging OR Donation OR Upcycling OR "Animal feed" OR "Anaerobic digestion" OR Co-digestion OR "Aerobic processes" OR Composting OR "Controlled combustion" OR Incineration OR Landfill OR "Land application" OR de-packaging OR "shelf life")
Environment Environment* AND (use OR usage OR impacts) AND (climate OR "Air emissions" OR "Water pollution" OR Pesticide OR Land OR Irrigation OR Energy OR fertilizer OR water OR Herbicides))
Emerging Issues ((Compost* or compostable) AND (packaging OR serviceware OR utensil OR tableware OR plate OR bowl))
To efficiently screen results, references were prioritized using topic extraction, also referred to as clustering, with ICF's Document Classification and Topic Extraction Resource (DoCTER) software. The titles and abstracts from all search results (i.e., AGRICOLA, AGRIS, EBSCO, PubMed, and Web of Science) were run through DoCTER’s topic extraction function. Each study was assigned to a single cluster based on text similarities in titles and abstracts. Clusters were prioritized or eliminated for screening based on the relevance of the keywords identified. Only prioritized studies published from 2014–present were screened for relevance.
Peer-Reviewed Literature Screening and Tagging The sources identified by the literature search were screened to identify those that are considered “key” sources for the report and issue papers. To be considered a key source, a publication had to be relevant to the project scope and exhibit at least most of the general attributes provided in EPA’s Quality Assurance Instructions for Contractors Citing Secondary Data, summarized below:
Focus: the work not only addresses the area of inquiry under consideration but also contributes to its understanding.
Persistent Chemical Contaminants 88
Verify: the work is consistent with accepted knowledge in the field or, if not, the new or varying information is documented within the work; the work fits within the context of the literature and is intellectually honest and authentic.
Integrity: Is the work structurally sound? In a piece of research, is the design or research rationale logical and appropriate?
Rigor: the work is important, meaningful, and non-trivial relative to the field and exhibits enough depth of intellect rather than superficial or simplistic reasoning.
Utility: the work is useful and professionally relevant; it contributes to the field in terms of the practitioners’ understanding or decision-making on the topic.
Clarity: Is it written clearly and appropriately for the nature of the study?
Relevance to the project scope was evaluated against the specific topics and criteria. In particular, relevant topics included:
Characterization of U.S. food waste, including but not limited to kinds of food, sources, amounts, and reasons for loss or waste.
Reduction strategies, including composting, anaerobic digestion, secondary industrial uses, animal feed, donation, and source reduction.
Lifecycle environmental costs and benefits of choices between and within levels of the EPA food recovery hierarchy.
Pre-processing technologies (e.g., grinding, heating, digestion) and their environmental implications in use, including their potential to help reduce food waste.
Food packaging and service ware and their relationships to food waste, including ways packaging may impact prevention and recycling of food waste or use and value of products created by recycling.
Chemical contaminants (e.g., PFOS, PFAS, persistent herbicides) and the risk and problems posed in food waste streams.
Food system trends to identify well-recognized trends in the U.S. food system that may impact food waste and summarize what has been written about their potential impacts.
Unharvested or unutilized crops that do not reach the consumer market.
Waste or loss during transportation, food processing/manufacturing/packaging facilities, or wholesale food distributors.
Waste or loss at supermarkets (e.g., unsold or spoiled products), restaurants, and households.
Existing economic, social, and cultural drivers of food waste or barriers to food waste prevention, reuse, and recycling efforts.
The following topics were not considered relevant:
Unutilized livestock (e.g., due to market forces, routine mortality) or unharvested or unutilized feed crops.
Regulatory drivers of food waste or barriers to food waste prevention, reuse, and recycling efforts.

Persistent Chemical Contaminants 89
Broad economic impacts (e.g., on the agricultural sector) of food waste production, prevention, reuse, and recycling efforts; economic costs and benefits for entities resulting from food waste production and reduction strategies.
The litstream™ tool was used to screen for key sources based on reference titles and abstracts. litstream™ facilitates screening by one or two independent reviewers, automatically compares categories, and identifies discrepancies for resolution by another individual. litstream™ also allows users to design flexible data-extraction forms, thus enabling the review team to perform the screening and tagging steps of the systematic review within one software tool.
For publications identified as key sources, full text files were retrieved with EPA’s Health & Environmental Research Online (HERO) database as requested by authors. Then, authors used the full text of the key sources to confirm topic area relevance and incorporate them into their literature synthesis.
A screening and tagging guidance document was developed to provide instructions and keywords associated with the tags. To ensure internal consistency and accuracy of the litstream™ screening and tagging, a pilot screening of 5–10 reference (per reviewer) was performed to provide feedback to the screening team. Additionally, 10% of each reviewer’s assigned citations were reviewed by a second reviewer. Discrepancies between the primary and secondary reviews were resolved by lead authors.
A.2. Methodology for Grey Literature Identifying key sources in the “grey literature” was essential to a comprehensive review and synthesis of the report and issue papers. The review methodology for grey literature included a search strategy and approaches for screening and tagging key sources.
Grey Literature Search Strategy The peer-reviewed literature search was supplemented with relevant grey literature from the sources listed below:
Grey literature publications cited by key sources identified by the EPA from prior related research. These sources were screened as potential key sources.
Grey literature publications identified by peer reviewers and subject matter experts who reviewed pre-peer review drafts of the reports and issue papers (see the acknowledgments sections in the report and each issue paper). These sources were considered key sources without screening.
Targeted google and domain searches for selected governmental or non-governmental organizations.
The titles and URLs of potential sources identified by the searches were compiled in an Excel file used for subsequent screening.
Grey Literature Screening and Tagging Grey literature was screened in Excel using the key source criteria defined for peer-reviewed literature (see Section A.1). Screeners applied the criteria to each of the potential sources in the database file described above (i.e., titles and URLs identified from searches). For each URL, the screeners evaluated the sources by reviewing abstracts, executive summaries, forewords, keyword lists, or tables of contents. When a screener identified a key source, they recorded additional information including publishing organization, author names, and year for the source to proceed to tagging.
Tagging was only performed for the grey literature identified as key sources, and the same tags as used for peer-reviewed literature (see Section A.1. Methodology for Peer-Reviewed Literature) were used for grey literature. screeners applied the tags in columns within Excel

U.S. Environmental Protection Agency Office of Research and Development