emergency evacuation report card 2006 - … · 9 roadway capacity score and influencing factors ......
TRANSCRIPT

25 Urban
Areas
Could Face
Greater
Challenges
than
New Orleans
Experienced
after
Hurricane
Katrina
Emergency Evacuation
Report Card 2006
Emergency Evacuation
Report Card 2006
New research findings by the American Highway Users Alliance

2
Acknowledgements
The American Highway Users Alliance (The Highway Users) gratefully acknowledges the American Bus
Association (ABA) for providing special assistance in the funding of this study. The American Bus Association is the trade organization of the intercity bus industry with about 1000 motorcoach owner and tour company members in the United States and Canada. Its members operate charter, tour, regular route, airport express, special operations and contract services. Another 2,300 members are travel and tourism organizations and suppliers of bus products and services who work in partnership with the North American motorcoach industry.
The Highway Users also thanks its 300 member associations and companies for the support of this study through their annual membership dues. Highway Users members have charged the organization with representing the best interests of the driving public, whether they travel by car, bus, truck, recreational vehicle, or motorcycle.
Our members pay taxes that finance transportation spending programs and advocate public policies that dedicate those taxes to improved highway safety and mobility.
Copyright 2006

�
American H ighway U s e r s A l l i a n c e Emergency Evacuation R e p o r t 2 0 0 6
Contents
Executive Summary .............................................................................................4 Introduction ........................................................................................................7Purpose of the Emergency Evacuation Report Card .............................................7The Principal Resources of Evacuation: Highways and Cars ................................7The Recent Experience ........................................................................................9Evaluating Evacuation Capacity ........................................................................11Exit Capacity .....................................................................................................12Internal Traffic Flow ..........................................................................................14Automobile Access ............................................................................................16Evacuation Capacity Index ................................................................................18Evacuation Challenges .......................................................................................21Planning for the Mass Transit Dependent ..........................................................24Additional Issues ...............................................................................................28Recommendations .............................................................................................29Conclusion ........................................................................................................29
Appendix 1: Appendix 2: Methodology
TablesES-1 Evacuation Capacity Index: Urban Area Grades .......................................6 1 Urban Areas over 1,000,000 Population ................................................102 Grading System .....................................................................................11� Exit Capacity Scores ..............................................................................134 Internal Traffic Flow Scores ....................................................................155 Automobile Availability and Automobile Access Scores..........................176 Evacuation Capacity Index: Urban Area Grades and Scores ...................197 Evacuation Capacity Index and Grades ..................................................208 Geographical Barriers ............................................................................239 Roadway Capacity Score and Influencing Factors ..................................24A-1 Evacuation Capacity Index and Grades: Alphabetical List ......................30A-2 Urban Area Scores and Evacuation Capacity Index: Alphabetical List ....31A-� Roadway Network Intensity ..................................................................32
Figures1 Exit Capacity Scores ..............................................................................142 Internal Traffic Flow Scores ....................................................................16� Automobile Access Scores ......................................................................184 Evacuation Capacity Index and Grades ..................................................215 Density and the Roadway Capacity Scores .............................................236 Roads and the Roadway Capacity Scores ...............................................24

4
American H ighway U s e r s A l l i a n c e Emergency Evacuation R e p o r t 2 0 0 6
EXECUTIVE SUMMARY
The potential for terrorist attacks and last year’s New Orleans’ flood destruction underscore the necessity for providing sufficient evacuation capacity from the nation’s urban areas. Yet, the Department of Homeland Security says, “Significant
weaknesses in evacuation planning are an area of profound concern.” The Emergency Evacuation Report Card is an initial attempt to assess the evacuation capacity of the 37 largest urban areas – those with more than 1,000,000 population. Evacuation planning is new to US urban areas and, as a result, evacuation capacity can be expected to fall short of optimal levels.
Automobiles: The Principal Evacuation Resource: The overwhelming majority of households have their own cars. As a result, urban areas principally rely on private auto-mobiles for evacuation and on the publicly provided highways. Those without access to automobiles also rely on the highways, because buses are the most important alternative to cars for evacuation.
Evaluation Method: Three factors are used to evaluate evacuation capacity: Exit Capacity, Internal Traffic Flow and Automobile Access. Based upon this analysis, urban areas are assigned scores of from 0 to 100 in Exit Capacity and Internal Traffic Flow. These factors are weighted at 50 percent each. The combined score is then multiplied by an Automobile Access percentage to produce an Evacuation Capacity Index. Letter grades from “A” to “F” are assigned based upon the evaluation factor scores and the Evacuation Capacity Index.
Exit Capacity is an estimate of the ability of routes leading out of the urban area to accommodate the evacuating population. The evaluation standard is a 12-hour theoretical exit route capacity or a 50 percent capacity with full use of contra-flow operations (all lanes in the outward direction). Kansas City and Columbus achieve grades of “A,” while Indianapolis, Cincinnati, Memphis, Pittsburgh, Orlando and Dallas-Fort Worth receive “B” grades. Twenty urban areas receive “F” grades, with New York, Chicago, Miami, San Diego and Seattle scoring the lowest.
Internal Traffic Flow is an estimate of the ability of roadway systems within the urban area to deliver traffic to the exit routes. Cleveland and Pittsburgh achieve grades of “A,” while Kansas City, Memphis, Columbus, New Orleans and Providence receive “B” grades. Eight urban areas receive “F” grades, with Los Angeles, Chicago, Washington, San Francisco-San Jose and Atlanta scoring the lowest.
Automobile Access is an estimate of the percentage of the population that will be evacuated by car. Automobile Access is estimated based upon the share of households owning cars and the experience in New Orleans of people without cars who evacuated with friends and relatives. Automobile Access is the one evaluation criteria in which all urban areas score well. All but one of the 37 urban areas received a grade of “A,” and one, New York, received a “B.”

5
American H ighway U s e r s A l l i a n c e Emergency Evacuation R e p o r t 2 0 0 6
Evacuation Capacity Index: Kansas City achieves the highest overall Evacua-tion Capacity Index and is the only urban area with a grade of “A.” Columbus, Memphis and Pittsburgh receive “B” grades. Seven urban areas receive “C” grades, while six receive “D” grades. Twenty urban areas receive ”F” grades, with the lowest scores being in Los Angeles, Chicago, New York, Miami and San Francisco-San Jose (Table ES-1).
Influencing Factors: Various factors are associated with higher Evacuation Capacity Index scores. Generally, the higher scoring urban areas have lower population densities, more intense roadway systems (greater capacity) and do not have significant geographical barriers blocking exit directions.
Planning for the Mass Transit Dependent: Governments must under-take special efforts to plan effectively for the evacuation of people without access to cars. While people without cars plan and execute their own evacuations on publicly provided infrastructure, people without cars must depend on government to provide the neces-sary evacuation transportation, Authorities face even greater challenges in the New York urban area, due to the unusually high number of mass transit dependent households. The principal resources of evacuation for the mass transit dependent are buses (transit buses, school buses and motor coaches), with a supplemental role for commuter rail, Amtrak and, to a lesser extent, subway and light rail systems. Based upon the experiences in New Orleans and Houston, it is clear that there are considerable opportunities for improve-ment in mass transit dependent evacuation programs.
Recommendations: The following recommendations are offered to improve urban evacuation planning:
• A National Standards and Reporting System should be established. • Roadway Capacity should be expanded. • Automobile Access should be expanded. • Comprehensive Urban Area Evacuation Operations Planning should be completed.
Conclusion: There is considerable latitude for improving the evacuation capacity of the nation’s urban areas. Such a program will be most effectively delivered through an ob-jective evaluation system, which leads to effective measures to improve evacuation capacity.

RANK URBAN AREA SCORE
GRADE: A
1 Kansas City 90.0
GRADE: B
2 Columbus 82.3
3 Memphis 80.5
4 Pittsburgh 80.4
GRADE: C
5 Indianapolis 79.2
6 Cincinnati 79.0
7 Cleveland 74.5
8 Orlando 74.1
9 San Antonio 73.5
10 St. Louis 70.6
11 Dallas-Fort Worth 70.5
GRADE: D
12 New Orleans 67.3
13 Austin 66.2
14 Providence 65.9
15 Milwaukee 65.2
16 Baltimore 62.6
17 Sacramento 60.3
GRADE: F
18 Denver 59.8
19 Tampa-St. Petersburg 58.9
20 Virginia Beach 57.4
21 Houston 54.8
22 Boston 49.4
22 Philadelphia 49.4
24 Atlanta 48.1
25 Portland 47.7
26 Minneapolis-St. Paul 47.5
27 Las Vegas 47.4
28 Detroit 47.3
29 Washington 44.9
30 Phoenix 43.6
31 Seattle 39.9
32 San Diego 37.8
33 San Francisco-San Jose 37.2
34 Miami 36.9
35 New York 31.5
36 Chicago 28.0
37 Los Angeles 25.6
Evacuation Capacity Index: Urban Area Grades
Table eS-1

7
American H ighway U s e r s A l l i a n c e Emergency Evacuation R e p o r t 2 0 0 6
INTRODUCTIONAmerican urban areas face unprecedented threats that could require evacuation, the most obvious of which relate to terrorism, which was brought to attention so vividly by the events of September 11, 2001. Certainly, each of the nation’s largest urban areas could fall victim to a terrorist attack. At the same time, the destruction in New Orleans from the floods associated with Hurricane Katrina showed the potential for devastation that can occur when an unfortunate worst combination of destructive circumstances combine.
It has become clear that each urban area needs to be prepared to evacuate its citizens in the event of catastrophe. Urban areas are preparing disaster readiness plans, which include detailed plans for evacuation. The federal government is making funding available to assist in this effort. Yet, a recent report by the Department of Homeland Security indicates that much more progress is needed to ensure that the disaster plans are sufficient to the need. In issuing an evaluation of urban area disaster planning, the Department stated, “Signifi-cant weaknesses in evacuation planning are an area of profound concern.”1
Purpose of the Emergency Evacuation Report CardThe Emergency Evacuation Report Card is an initial evacuation capacity evaluation for the largest urban areas in the United States. It estimates the comparative capacity of high-way systems both in capacity for exit from urban areas and the internal traffic circulation necessary to access the exit points. Further, the Emergency Evacuation Report Card provides information on planning for evacuation by households who do not have access to personal vehicles.2 Evacuation planning is new to US urban areas and, as a result, evacuation capacity can be expected to fall short of optimal levels.
The principal purpose of this report is to compare evacuation capacity among urban areas with the objective of encouraging consistent, quantitatively based and effective practices for evacuation planning. The analysis is based upon a requirement that the entire urban area be evacuated, which is certainly possible. It is also possible that evacuations will be limited to small zones within an urban area.
The Principal Resources of Evacuation: Highways and Cars The principal resources of urban evacuation are private cars and publicly provided highways. The automobile is the dominant mode of transport in US urban areas.3 The automobile is the principal mode of transport within the 37 urban areas with more than 1,000,000 popula-tion. Automobiles account for 96 percent of travel or more in 36 urban areas, while in the New York urban area, automobiles account for more than 90 percent of travel.4
1 Fact Sheet: Nationwide Plan Review Initial Conclusions, http://www.dhs.gov/dhspublic/interapp/press_release/press_release_0929.xml and Nationwide Plan Review, Phase 2 Report, http://www.dhs.gov/interweb/assetlibrary/Prep_NationcwidePlanReview.pdf, Department of Homeland Security, June 2006.
2 Personal vehicles include automobiles, sport utility vehicles and personal trucks. The terms “automobile” and “car” in this report refer to all personal vehicles.
3 Contrary to popular belief, the automobile is used for the majority of travel in all high-income world urban areas with the exception of Tokyo-Yokohama, Osaka-Kobe-Kyoto and Hong Kong (International Union of Public Transport – UITP, Millen-nium Cities Database, Brussels: 2002).
4 Automobile share as a percentage of mechanized transportation mode. http://www.publicpurpose.com/ut-uspt2003share.pdf. (The Public Purpose, www.publicpurpose.com, is a website of Wendell Cox Consultancy.)

8
American H ighway U s e r s A l l i a n c e Emergency Evacuation R e p o r t 2 0 0 6
Streets and highways have long been recognized as the avenues of urban and even na-tional productivity. Research documents the importance of roadways in urban economic performance. For example, the Texas Transportation Institute annually measures traffic congestion in large US urban areas and estimates the cost to local economies of traffic congestion.5 The most recent estimate is $63 billion, an amount equal to more than the gross state product of Nebraska. Recent reports in Portland, Oregon and Vancouver, BC document the business losses that have already occurred and could occur in the future from failure to provide roadway capacity sufficient to accommodate demand.6 University of Paris research underscores the importance of improving traffic flows by documenting the economic gains that occur from simply making more jobs accessible to people in a fixed period of time (such as 30 minutes).7
However, highways have another, increasingly important function – providing evacuation routes in times of emergency. With nearly all travel in urban areas being by cars or streets and highways, it can be no other way. Moreover, this is not likely to change. The substan-tial mass transit expansions that have occurred in many urban areas have not materially reduced the share of travel by car.8 Moreover, most such improvements have been for the purpose of internal circulation within urban areas, rather than the exit capacity that is required for evacuation. Thus, urban areas are principally dependent upon highways and automobiles for evacuation.
Much of the urban highway evacuation capacity, both in exit routes and in internal circulation routes is provided by the interstate highway system, which was originally called the “National System of Interstate and Defense Highways.” The system’s defense role became less important with the fall of Communism and the end of the Cold War. Now, due to the increasing threat of terrorism, the interstate system is reasserting itself as a major element of national security (and defense), principally due to its capacity for handling mass evacuations.
America’s comprehensive highway system and the broad availability of cars greatly sim-plify evacuation planning. For the vast majority of households, government’s planning role is limited to providing the highway infrastructure and managing its operation during an evacuation. The government role in planning for the evacuation of the mass transit dependent population without access to automobiles is far more complex.
…�the�interstate�system�is�reasserting�itself�as��
a�major�element�of�national�security
5 http://mobility.tamu.edu/ums/. 6 Economic Development Research Group, The Cost of Congestion to the Economy of the Portland Region, December 5,
2005: http://www.metro-region.org/library_docs/trans/coc_exec_summary_final_4pg.pdf and Delcan and Economic Development Research Group, Economic Impact Analysis of Investment in a Major Commercial Transportation System for the Greater Vancouver Region, July 2003: http://www.gvgc.org/pdfs/SW1040_FinalReport_Re-vised2.pdf.
7 Remy Prud’homme and Chang-Woon Lee (1998), “Size, Sprawl, Speed, and the Efficiency of Cities,” Paris, France: Obervatoire de l’Économic et des Institutions Locals.
8 See http://www.publicpurpose.com/ut-uspt1983share.pdf,

9
American H ighway U s e r s A l l i a n c e Emergency Evacuation R e p o r t 2 0 0 6
Further, the recent experience in New Orleans shows that mass transit, even when avail-able in considerable amounts,9 may not always be sufficiently deployed to serve even the needs of the minority of residents who do not have access to cars.
Even so, highways are necessarily the principal infrastructure of evacuation. A well functioning evacuation system for people without access to cars would necessarily rely on buses, which would rely on highways.
The Recent ExperienceThe nation has had two well-publicized experiences with urban evacuations over the past year. The Hurricane Katrina evacuation of the New Orleans area and the Hurricane Rita evacuation of the Houston area provided much to criticize. In New Orleans, officials were faulted for not having ordered the mandatory evacuation earlier, which lost valuable time. Similarly, the Mayor of New Orleans has been criticized for failing to use hundreds of available buses from the city’s transit agency and school district to evacuate the large number of people who did not have cars for fleeing on their own. By contrast, in Hous-ton, local officials managed to use their transit and other bus resources effectively. Nonetheless, one crucial element of the evacuation worked well in both urban areas – the highway system. In both New Orleans and Houston, hundreds of thousands of households managed to flee the urban areas using their private cars on the highways. This is not to suggest that things worked perfectly. There were monumental traffic jams. There were fuel shortages.
There is little detailed data on the Houston and New Orleans evacuations. However, Louisiana Governor Kathleen Blanco has estimated that 92 percent of the 1.3 million residents of the New Orleans area were evacuated.10 Only those who either chose to stay or had no access to automobile transportation were left in the urban area.
In fact, it appears that friends and relatives evacuated a large number of car-less people in New Orleans. Based upon Governor Blanco’s estimate that 92 percent of metropolitan area residents were evacuated, it appears that friends and relatives who had cars evacuated more than one-half of the car-less households. United States Census data indicates that 82 percent of New Orleans area households had access to cars in 2000, which would sug-gest that 10 percent of car-less households were evacuated by car, leaving eight percent behind. Moreover, some of the households that did not evacuate had cars available, but chose not to leave, which suggests that the share of car-less households evacuated by friends and relatives may have been even higher.
9 The Regional Transit Authority in New Orleans has a high level of transit service and the fifth highest ridership per capita of any large US transit agency (http://www.publicpurpose.com/ut-us97pc-sys.htm).
10 The Federal Response to Hurricane Katrina: Lessons Learned, Washington: The White House, February 2006, p 29 (http://www.whitehouse.gov/reports/katrina-lessons-learned.pdf).
A�well�functioning�evacuation�system�for�people��without�access�to�cars�would�necessarily�rely�on��buses,�which�would�rely�on�highways.�

ATL Atlanta 4,050,000 3,500,000 1,963 1,783
AUS Austin 1,050,000 902,000 318 2,835
BAL Baltimore 2,080,000 2,076,000 683 3,041
BOS Boston 4,050,000 4,032,000 1,736 2,323
CHI Chicago 8,620,000 8,308,000 2,123 3,914
CIN Cincinnati 1,550,000 1,503,000 672 2,238
CLV Cleveland 1,770,000 1,787,000 647 2,761
COL Columbus 1,200,000 1,133,000 398 2,849
DEN Denver 2,170,000 1,985,000 499 3,979
DET Detroit 3,930,000 3,903,000 1,261 3,094
DFW Dallas-Fort Worth 4,670,000 4,146,000 1,407 2,946
HOU Houston 4,280,000 3,823,000 1,295 2,951
IPS Indianapolis 1,310,000 1,219,000 553 2,205
KC Kansas City 1,440,000 1,362,000 584 2,330
LA Los Angeles 14,910,000 14,040,000 2,330 6,026
LV Las Vegas 1,630,000 1,314,000 286 4,597
MEM Memphis 1,020,000 972,000 400 2,431
MIA Miami 5,330,000 4,919,000 1,116 4,407
MIL Milwaukee 1,320,000 1,309,000 487 2,687
MSP Minneapolis-St. Paul 2,530,000 2,389,000 894 2,671
NO New Orleans 1,010,000 1,009,000 198 5,102
NY New York 18,210,000 17,800,000 3,353 5,309
ORL Orlando 1,360,000 1,157,000 453 2,554
PGH Pittsburgh 1,720,000 1,753,000 852 2,057
PHI Philadelphia 5,270,000 5,149,000 1,800 2,861
PHX Phoenix 3,460,000 2,907,000 799 3,638
POR Portland 1,720,000 1,583,000 474 3,340
PRV Providence 1,200,000 1,175,000 504 2,332
SA San Antonio 1,470,000 1,328,000 408 3,257
SAC Sacramento 1,580,000 1,393,000 369 3,776
SD San Diego 2,790,000 2,674,000 782 3,419
SEA Seattle 2,850,000 2,712,000 954 2,844
SF San Francisco-San Jose 5,360,000 5,320,000 963 5,523
STL St. Louis 2,140,000 2,078,000 829 2,506
TSP Tampa-St. Petersburg 2,280,000 2,062,000 802 2,571
VB Virginia Beach 1,460,000 1,394,000 527 2,647
WDC Washington 4,280,000 3,934,000 1,157 3,401
Average 3,222
Density:PoPulation Per
square Mile (2000)CoDe urban area
estiMateD PoPulation (July 1, 2005)
PoPulation (aPril 1, 2000)
lanD area: square Miles:
(2000)
Notes: 2000 data from US Census 2005 estimate based upon corresponding metropolitan area growth rate from 2000 to 2005 Los Angeles includes Riverside-San Bernardino, Mission Viejo and Thousand Oaks. San Francisco-San Jose includes San Francisco, San Jose and Concord. See Appendix 2: Methodology
Table 1
Urban Areas Over 1,000,000 Population

11
American H ighway U s e r s A l l i a n c e Emergency Evacuation R e p o r t 2 0 0 6
Evaluating Evacuation CapacityThe Emergency Evacuation Report Card covers the 37 urban areas11 with more than 1,000,000 population as of 2005 (Table 1).
Three criteria are used in evaluating evacuation capacity of urban areas. These include (1) exit capacity from the urban area, (2) traffic flow in urban areas and (3) automobile access.
• Exit Capacity: Exit Capacity refers to the capacity of major roadways leading out of an urban area to handle an evacuation of urban area residents. An urban area with a greater Exit Capacity will be better prepared for evacuation.
• Internal Traffic Flow: Expeditious evacuation of an urban area requires that traffic flow well within the urban area, as people seek to reach the exit roadways. An urban area with better Internal Traffic Flow will be better prepared for evacuation.
• Automobile Access: Certainly, the Hurricane Katrina experience showed that people without access to automobiles face more significant evacuation challenges than those with automobiles. An urban area with greater automobile accessibility will be better prepared for evacuation.
These three evaluation factors are then combined into an overall Evacuation Capacity Index. The factors and the Evacuation Capacity Index are converted to letter grades from “A” to “F.” (Table 2). The analysis below summarizes the results for each of the three evaluation factors as well as the overall Evacuation Capacity Index. The methodology is described in Appendix 2.
SCORE GRADE
90 to 100 A
80 to 89 B
70 to 79 C
60 to 69 D
60 and Below F
11 Urban areas (also called urbanized areas) are areas of continuous urban development. Urban areas are different from metropolitan areas both in being smaller geographically and in not containing surrounding rural (undeveloped) territory. Urban areas are also different from cities, which are municipalities, such as the city of Chicago or the many cities that comprise its suburbs (for example, the city of Naperville, the city of Kenosha, etc.). In the United States, urban areas are always smaller than cities (municipalities).
Table 2
Grading System:Evacuation Capacity Index
and Evaluation Factors

12
American H ighway U s e r s A l l i a n c e Emergency Evacuation R e p o r t 2 0 0 6
Exit CapacityThe most fundamental issue in evacuating an urban area is the capability of the roads to provide an exit for the population.
Exit Capacity was estimated by identifying the higher capacity roadways leading from each of the urban areas and estimating their capacity. This included all freeways, toll roads, frontage roads and major express arterials (roadways with comparatively few traffic sig-nals), all with four or more lanes.12 The number of lanes available was determined at the urban area boundary, using maps and satellite photography. Additional evacuation capac-ity could be provided by more locally oriented and smaller capacity roads, however these were excluded from the analysis because of the overwhelming importance of the higher capacity roads. Higher exit capacity not only improves evacuation out of urban areas, but also increases the potential for dispersing evacuation traffic outward from urban areas.
The standard for evaluation was the theoretical capacity of the roadways at the exit points over a 12-hour period. Of course, during periods of high demand, with evacuation representing the highest demand, roadways do not operate at full capacity, as was evident from the experiences in New Orleans and Houston. Nonetheless, the 12-hour theoretical standard is useful for comparison. In fact, up to this theoretical capacity could be accommodated by exit routes by an effective employment of contra-flow (converting inbound lanes to outbound operation) if the roadways were able to handle 50 percent of their theoretical capacity.
The capacity of each urban area’s roadways to evacuate the population was estimated. The resulting percentage was converted into a number from 0 to 100, so that, for example, an urban area with an exit capacity of 75 percent would receive a score of 75.
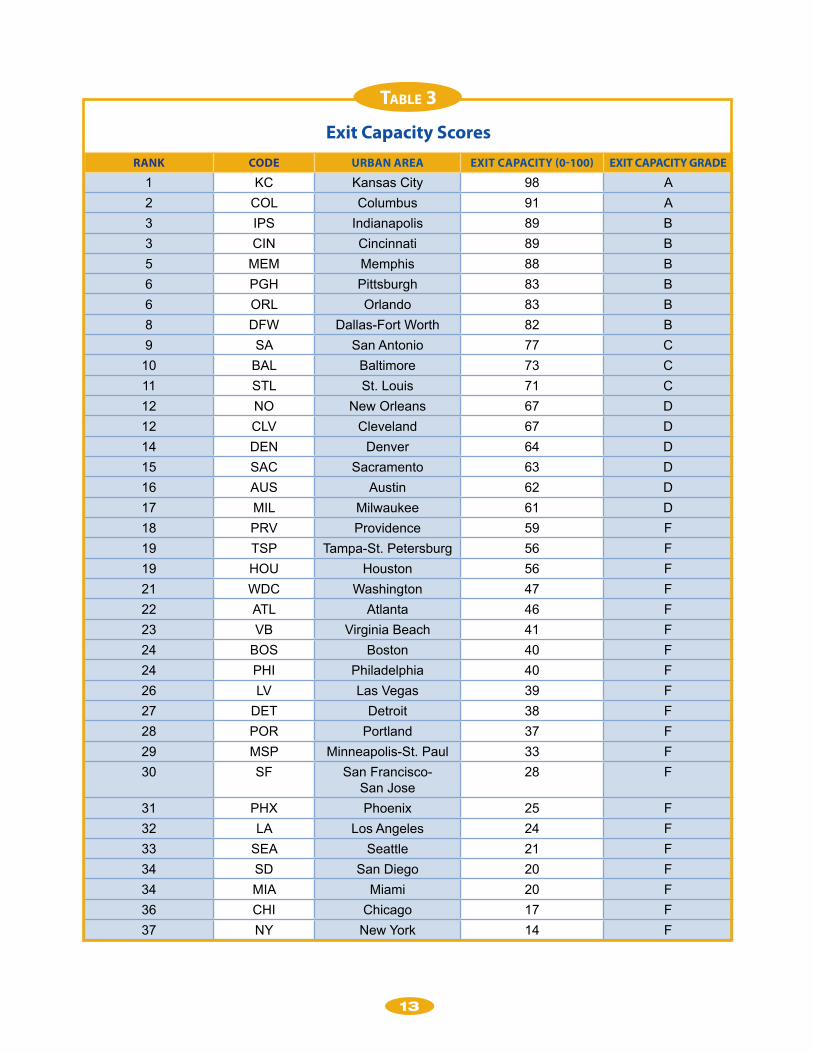
None of the 37 urban areas achieved a 100 percent score in Exit Capacity, which means that none appears to have the theoretical capacity to evacuate all of its citizens in a 12-hour period at peak efficiency (Table 3 and Figure 1). Eight of the 37 urban areas score 80 or higher in exit capacity.
Kansas City scores highest in Exit Capacity, at 98, for a grade of “A.” Columbus also achieves an “A,” with a score of 91 in Exit Capacity. Columbus, like Cincinnati and to a lesser extent, Cleveland, has profited from the Ohio state highway construction program that has widened a number of intercity freeways to 6-lanes, instead of the more usual 4-lanes.
Four urban areas achieve grades of “B,” Indianapolis and Cincinnati tied with a score of 89. Memphis (88), Pittsburgh (83), Orlando (83) and Dallas-Fort Worth (82) were also above 80.
Kansas�City�scores�
highest�in�Exit�Capacity,�
at�98,�for�a�grade�of�“A.”
12 At least two lanes in each direction.
1�
RANK CODE URBAN AREA ExIt CAPACIty (0-100) ExIt CAPACIty GRADE
1 KC Kansas City 98 A
2 COL Columbus 91 A
3 IPS Indianapolis 89 B
3 CIN Cincinnati 89 B
5 MEM Memphis 88 B
6 PGH Pittsburgh 83 B
6 ORL Orlando 83 B
8 DFW Dallas-Fort Worth 82 B
9 SA San Antonio 77 C
10 BAL Baltimore 73 C
11 STL St. Louis 71 C
12 NO New Orleans 67 D
12 CLV Cleveland 67 D
14 DEN Denver 64 D
15 SAC Sacramento 63 D
16 AUS Austin 62 D
17 MIL Milwaukee 61 D
18 PRV Providence 59 F
19 TSP Tampa-St. Petersburg 56 F
19 HOU Houston 56 F
21 WDC Washington 47 F
22 ATL Atlanta 46 F
23 VB Virginia Beach 41 F
24 BOS Boston 40 F
24 PHI Philadelphia 40 F
26 LV Las Vegas 39 F
27 DET Detroit 38 F
28 POR Portland 37 F
29 MSP Minneapolis-St. Paul 33 F
30 SF San Francisco- San Jose
28 F
31 PHX Phoenix 25 F
32 LA Los Angeles 24 F
33 SEA Seattle 21 F
34 SD San Diego 20 F
34 MIA Miami 20 F
36 CHI Chicago 17 F
37 NY New York 14 F
Table 3
Exit Capacity Scores

14
American H ighway U s e r s A l l i a n c e Emergency Evacuation R e p o r t 2 0 0 6
0102030405060708090
100
Exit Capacity ScoresURBAN AREAS OVER 1,000,000 POPULATION
Figure 1
KC COL
IPS
CVIN
MEM PG
HO
RLD
FW SA BAL
STL
NO
CLV
DEN SA
CAU
SM
ILPR
VTS
PH
OU
WD
CAT
LVB BO
SPH
ILV
DET
POR
SDP SF
PHX LA SEA SD M
IACH
IN
Y
Internal Traffic FlowTraffic flow within the urban area is important because virtually all evacuation trips begin within the urban area and operate on internal roadways until they exit (Exit Capacity, above).
The Texas Transportation Institute has developed the “Travel Time Index,” which is the principal indicator of traffic congestion in US urban areas. The delay from estimated in the Travel Time Index is used for the Internal Traffic Flow factor. For example, an urban area with no travel delay scores 100 in Internal Traffic Flow, while an urban area with a 40 percent average travel delay scores 60 in Internal Traffic Flow (100 minus 40).
Seven of the 37 urban areas achieve Internal Traffic Flow scores of 80 or greater (Table 4 & figure 2). The most favorable Internal Traffic Flow score is in Cleveland, at 91, fol-lowed closely by Pittsburgh (90), both achieving grades of “A.” Kansas City scores 89 for a high “B.” Memphis (82), Columbus, New Orleans13 and Providence (tied at 81) also received “B” grades.
Twenty-two (22) of the urban areas scored below 70 in Internal Traffic Flow, for grades of “D” or “F.” The lowest score is in Los Angeles, at 30, for a grade of “F.” Seven other urban areas score under 60 (for a grade of “F”), including Chicago, Washington, San Francisco-San Jose, Atlanta, Miami, Houston and San Diego.
13 New Orleans information is based upon data from before the Hurricane Katrina related flooding. For a comparison of the estimated “before and after” population, see http://www.demographia.com/db-katrinano.htm (Demographia, www.demographia.com, is a website of Wendell Cox Consultancy.)

15
RANK CODE URBAN AREA INtERNAl tRAFFIC FlOw (0-100)
INtERNAl tRAFFIC FlOw GRADE
1 CLV Cleveland 91 A
2 PGH Pittsburgh 90 A
3 KC Kansas City 89 B
4 MEM Memphis 82 B
5 COL Columbus 81 B
5 NO New Orleans 81 B
5 PRV Providence 81 B
8 MIL Milwaukee 79 C
8 VB Virginia Beach 79 C
10 CIN Cincinnati 78 C
10 SA San Antonio 78 C
10 STL St. Louis 78 C
13 IPS Indianapolis 76 C
14 AUS Austin 75 C
15 ORL Orlando 70 C
16 PHI Philadelphia 68 D
17 TSP Tampa-St. Petersburg 67 D
18 BOS Boston 66 D
18 MSP Minneapolis-St. Paul 66 D
20 PHX Phoenix 65 D
21 DFW Dallas-Fort Worth 64 D
22 BAL Baltimore 63 D
22 POR Portland 63 D
22 SAC Sacramento 63 D
25 DET Detroit 62 D
25 SEA Seattle 62 D
27 LV Las Vegas 61 D
27 NY New York 61 D
29 DEN Denver 60 D
30 SD San Diego 59 F
31 HOU Houston 58 F
31 MIA Miami 58 F
33 ATL Atlanta 54 F
34 SF San Francisco-San Jose 51 F
35 WDC Washington 49 F
36 CHI Chicago 43 F
37 LA Los Angeles 30 F
Table 4
Internal traffic Flow Scores

16
American H ighway U s e r s A l l i a n c e Emergency Evacuation R e p o r t 2 0 0 6
Automobile AccessAutomobiles provide by far the greatest and most reliable means of evacuation. Fortunately, the vast majority of American households have access to automobiles, without which the mass evacuations of New Orleans and Houston could not have been accomplished.
Data from the 2000 census was to estimate the percentage of households having access to automobiles in each urban area. In 21 of the 37 urban areas, 90 percent or more of households had access to an automobile, while the figure exceeded 85 percent in all but three urban areas (Table 5). Only in New York (at 67.6 percent) is automobile access under 80 percent. Based upon the New Orleans experience, it is assumed that one-half of people who do not have automobiles will be evacuated in the cars of friends and relatives.The urban areas all score well on automobile access, indicating that the private resources of urban areas are well positioned to handle evacuations (Figure 3). All but one of the urban areas scores above 90 percent in Automobile Access, achieving grades of “A.”
Only New York scores lower, at 83.8 percent, for a grade of “B.” The low New York score reflects the hyper-densities in the four large boroughs of the city of New York (Brooklyn, the Bronx, Manhattan and Queens), which make intense mass transit service feasible, allowing many households that can afford cars to use transit instead for their daily commutes. This is illustrated by the fact that nearly 55 percent of the nation’s urban rail service is in the New York urban area.14
14 Estimated from United States Department of Transportation Federal Transit Administration National Transit Database, 2004 (using vehicle miles).
Fortunately,�the�vast�majority�of�American�households�have��
access�to�automobiles,�without�which�the�mass�evacuations�of�
New�Orleans�and�Houston�could�not�have�been�accomplished.
Figure 2
0102030405060708090
100
Internal Tra�c Flow ScoresURBAN AREAS OVER 1,000,000 POPULATION
CLV
PGH KC
MEM CO
LN
OPR
VM
IL VB CIN SA STL
IPS
AUS
ORL PH
ITS
PBO
SM
SPPH
XD
FW BAL
[PR
SAC
DET SE
A LV NY
DEN SD
HO
UM
IAAT
L SFW
DC
CHI
LA

17
RANK CODE URBAN AREA AUtOmOBIlE AvAIlABIlIty
AUtOmOBIlE ACCESS
AUtOmOBIlE AvAIlABIlIty GRADE
1 AUS Austin 93.5% 96.8% A
2 DFW Dallas-Fort Worth 93.5% 96.7% A
3 ORL Orlando 93.2% 96.6% A
4 PHX Phoenix 92.9% 96.4% A
5 DEN Denver 92.4% 96.2% A
6 ATL Atlanta 92.2% 96.1% A
6 IPS Indianapolis 92.2% 96.1% A
8 HOU Houston 91.9% 96.0% A
8 KC Kansas City 92.1% 96.0% A
10 COL Columbus 91.8% 95.9% A
10 SD San Diego 91.7% 95.9% A
12 SAC Sacramento 91.6% 95.8% A
12 SEA Seattle 91.5% 95.8% A
14 TSP Tampa-St. Petersburg 91.5% 95.7% A
15 MSP Minneapolis-St. Paul 91.0% 95.5% A
15 POR Portland 91.1% 95.5% A
15 VB Virginia Beach 91.1% 95.5% A
18 LV Las Vegas 90.3% 95.2% A
19 DET Detroit 90.1% 95.1% A
19 SA San Antonio 90.2% 95.1% A
21 STL St. Louis 90.0% 95.0% A
22 LA Los Angeles 89.3% 94.7% A
23 CIN Cincinnati 89.1% 94.6% A
24 MEM Memphis 89.0% 94.5% A
24 MIA Miami 89.0% 94.5% A
26 SF San Francisco-San Jose 88.5% 94.3% A
27 CLV Cleveland 88.4% 94.2% A
28 PRV Providence 88.1% 94.1% A
29 WDC Washington 87.8% 93.9% A
30 MIL Milwaukee 87.0% 93.5% A
31 BOS Boston 85.8% 92.9% A
32 CHI Chicago 85.5% 92.7% A
32 PGH Pittsburgh 85.4% 92.7% A
34 BAL Baltimore 83.5% 91.8% A
34 PHI Philadelphia 83.6% 91.8% A
36 NO New Orleans 82.0% 91.0% A
37 NY New York 67.6% 83.8% B
Note: Automobile Access calculated assuming that one-half of the people without automobile availability will be evacuated in the cars of friends or relatives.
Table 5
Automobile Availability and Automobile Access Scores

18
American H ighway U s e r s A l l i a n c e Emergency Evacuation R e p o r t 2 0 0 6
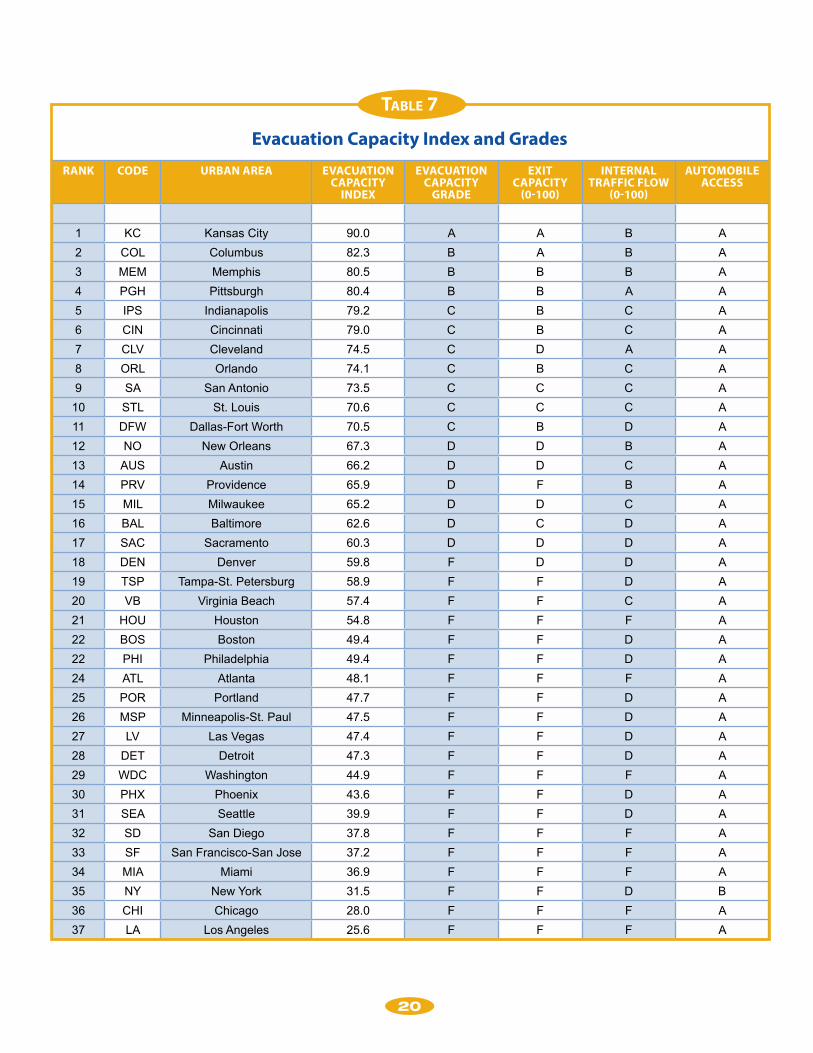
Evacuation Capacity IndexThe Evacuation Capacity Index combines the Exit Capacity, Internal Traffic Flow and Automobile Access scores into a single measure. Exit Capacity and Internal Traffic Flow are each weighted at 50 percent of the score to produce the Roadway Capacity score, which is a measure of the ability of the road system to evacuate the population of the urban area. To reflect the fact that not all of the population will have access to cars, the Roadway Capacity score is adjusted downward by the Automobile Access score to produce the Evacuation Capacity Index.
Four of the 37 urban areas achieve a grade of “A” (Table 6). Only Kansas City achieves a grade of “A,” with an Evacuation Capacity Index of 90.0. Kansas City achieves a grade of “A” in all three evaluation categories. Three urban areas achieve grades of “B,” with Columbus at 82.3, Memphis at 80.5 and, Pittsburgh at 80.4.
Seven of the urban areas were graded “C,” (scoring between 70 and 79), while six earned a “D” grade, scoring between 60 and 69. Twenty (20) urban areas were given a failing grade of “F.” The lowest scores were achieved in Los Angeles, Chicago and New York (Table 7 & Figure 4).
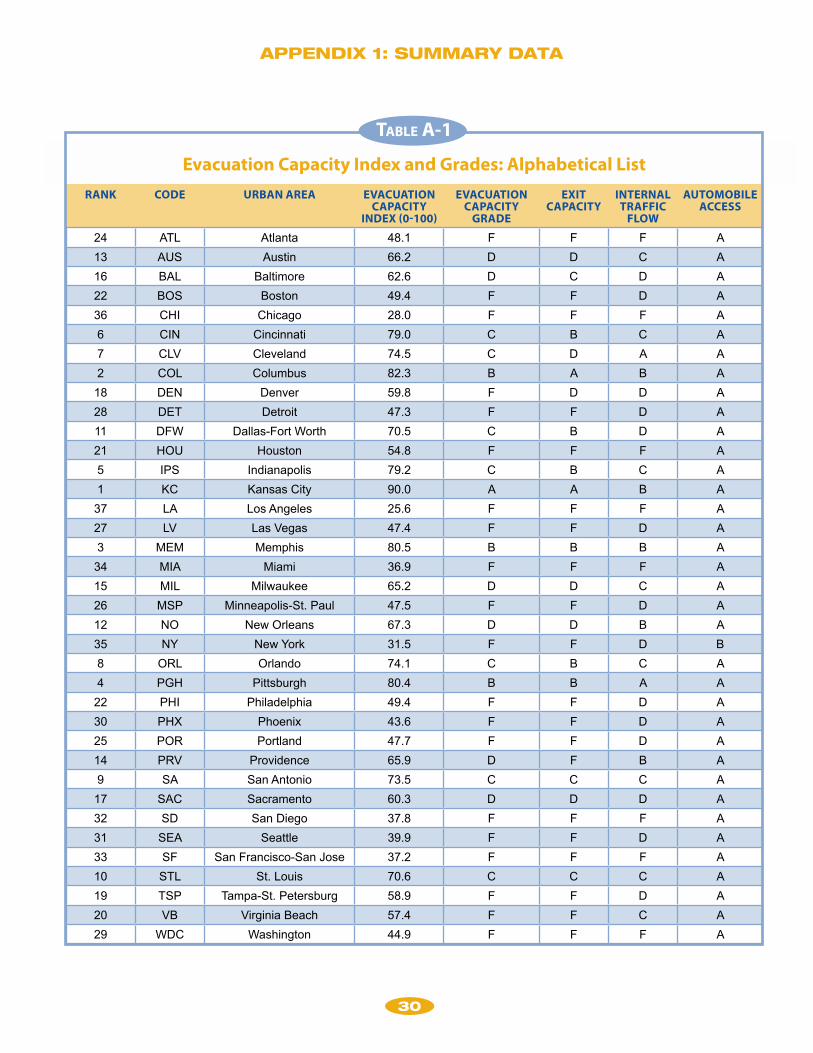
Tables A-1 and A-2 portray the scores and grades alphabetically by urban area (Appendix A).
Figure 3
0%10%20%30%40%50%60%70%80%90%
100%
Automobile Access ScoresURBAN AREAS OVER 1,000,000 POPULATION
AUS
DFW ORL
PHX
DEN AT
LIP
S H
OU KC COL
SD SAC
SEA
TSP
MSP
POR VB LV
DEB SA ST
L LA CIN
MEM M
IA SF CLV
PRV
WD
CM
ILBO
SCH
IPG
HBA
LPH
IN
O NY

19
RANK URBAN AREA SCORE
GRADE: A
1 Kansas City 90.0
GRADE: B
2 Columbus 82.3
3 Memphis 80.5
4 Pittsburgh 80.4
GRADE: C
5 Indianapolis 79.2
6 Cincinnati 79.0
7 Cleveland 74.5
8 Orlando 74.1
9 San Antonio 73.5
10 St. Louis 70.6
11 Dallas-Fort Worth 70.5
GRADE: D
12 New Orleans 67.3
13 Austin 66.2
14 Providence 65.9
15 Milwaukee 65.2
16 Baltimore 62.6
17 Sacramento 60.3
GRADE: F
18 Denver 59.8
19 Tampa-St. Petersburg 58.9
20 Virginia Beach 57.4
21 Houston 54.8
22 Boston 49.4
22 Philadelphia 49.4
24 Atlanta 48.1
25 Portland 47.7
26 Minneapolis-St. Paul 47.5
27 Las Vegas 47.4
28 Detroit 47.3
29 Washington 44.9
30 Phoenix 43.6
31 Seattle 39.9
32 San Diego 37.8
33 San Francisco-San Jose 37.2
34 Miami 36.9
35 New York 31.5
36 Chicago 28.0
37 Los Angeles 25.6
Table 6
Evacuation Capacity Index:Urban Area Grades
20
RANK CODE URBAN AREA EvACUAtION CAPACIty
INDEx
EvACUAtION CAPACIty
GRADE
ExIt CAPACIty
(0-100)
INtERNAl tRAFFIC FlOw
(0-100)
AUtOmOBIlE ACCESS
1 KC Kansas City 90.0 A A B A
2 COL Columbus 82.3 B A B A
3 MEM Memphis 80.5 B B B A
4 PGH Pittsburgh 80.4 B B A A
5 IPS Indianapolis 79.2 C B C A
6 CIN Cincinnati 79.0 C B C A
7 CLV Cleveland 74.5 C D A A
8 ORL Orlando 74.1 C B C A
9 SA San Antonio 73.5 C C C A
10 STL St. Louis 70.6 C C C A
11 DFW Dallas-Fort Worth 70.5 C B D A
12 NO New Orleans 67.3 D D B A
13 AUS Austin 66.2 D D C A
14 PRV Providence 65.9 D F B A
15 MIL Milwaukee 65.2 D D C A
16 BAL Baltimore 62.6 D C D A
17 SAC Sacramento 60.3 D D D A
18 DEN Denver 59.8 F D D A
19 TSP Tampa-St. Petersburg 58.9 F F D A
20 VB Virginia Beach 57.4 F F C A
21 HOU Houston 54.8 F F F A
22 BOS Boston 49.4 F F D A
22 PHI Philadelphia 49.4 F F D A
24 ATL Atlanta 48.1 F F F A
25 POR Portland 47.7 F F D A
26 MSP Minneapolis-St. Paul 47.5 F F D A
27 LV Las Vegas 47.4 F F D A
28 DET Detroit 47.3 F F D A
29 WDC Washington 44.9 F F F A
30 PHX Phoenix 43.6 F F D A
31 SEA Seattle 39.9 F F D A
32 SD San Diego 37.8 F F F A
33 SF San Francisco-San Jose 37.2 F F F A
34 MIA Miami 36.9 F F F A
35 NY New York 31.5 F F D B
36 CHI Chicago 28.0 F F F A
37 LA Los Angeles 25.6 F F F A
Table 7
Evacuation Capacity Index and Grades

21
American H ighway U s e r s A l l i a n c e Emergency Evacuation R e p o r t 2 0 0 6
Evacuation ChallengesUrban areas face considerable, yet differing challenges in attempting to improve their evacuation capacity. Much of the difference in Evacuation Capacity Index scores between urban areas is associated with the following factors.
Geographical Barriers: Urban areas with geographical barriers face particular challenges in Exit Capacity and as a result tend to score lower in the Evacuation Capacity Index (Table 8). In some urban areas, water barriers or international boundaries block one or more exit directions. The seven urban areas with the lowest Evacuation Capacity Index scores all have such geographical barriers (Los Angeles, Chicago, New York, Miami, San Francisco-San Jose, San Diego and Seattle). It is necessary to concentrate more roadway capacity in the directions without barriers to improve Exit Capacity in these urban areas. Among the urban areas with higher Roadway Capacity Scores (between 75 and 100), only 11 percent (one out of nine urban areas) has a geographical barrier. In contrast, more than 60 percent of the urban areas scoring between 25 and 49 (eight out of 13 urban areas) have geographical barriers, illustrating the importance of such barriers (Table 9).
High Population Density: Higher population density is associated with higher traffic volumes,15 and with lower Evacuation Capacity Index scores (Figure 5). Thus, more robust roadway systems must be in-place to provide sufficient traffic flow where densities are higher. Generally, sufficient roadway robust systems have not been provided and, as a result, traffic congestion tends to be worse. Higher population densities thus
15 See How Higher Density Makes Congestion Worse, http://www.publicpurpose.com/pp57-density.htm.
Figure 4
0102030405060708090
100
Evacuation Capacity Index & GradesURBAN AREAS OVER 1,000,000 POPULATION
B C D F
KC COL
IPS
CIN
PGH
MEM ORL SA
DFW CL
VST
LN
OPR
VBA
LM
ILAU
SD
EN SAC
TSP
HO
U VB ATL
BOS
WD
CPH
ILV
POR
DET
MSP
PHX
SEA SF SD M
IA LA CHI
NY
A

22
American H ighway U s e r s A l l i a n c e Emergency Evacuation R e p o r t 2 0 0 6
mean that internal roadway systems and exit routes must have greater capacity to function adequately. In the cases where urban areas seek to implement strong densification or “smart growth” policies (such as Portland, Seattle or Denver), greater roadway expansion will be necessary to accelerate highway capacity improvements to maintain sufficient evacuation capacity. However, densification policies have generally been accompanied by the strategies to reduce the rate of highway expansion, thereby worsening evacuation capacity.
Ten of the 11 urban areas with the lowest scores have population densities that are higher than average. Lowest scoring Los Angeles has the highest population density in the nation. The urban areas with higher Roadway Capacity scores (between 75 and 100) are 38 percent less dense than those scoring between 75 and 100, further illustrat-ing the negative relationship between population density and evacuation capacity (Table 9).
Roadway Capacity: Some urban areas have roadway systems with particularly limited capacity. This severely limits Internal Traffic Flow and is associated with lower Evacuation Capacity Index scores (Figure 6). For example, Las Vegas, Chicago, New York, Portland. Phoenix, Washington and Atlanta, which score low in the Evacuation Capacity Index, have roadway capacity ratings well below average. Atlanta is an unusual case. Atlanta has the lowest population density in the world of any urban area with more than 1,000,000 population.16 Atlanta’s has a particularly weak roadway system that is overly dependent upon freeways, with little arterial capacity and thus few routes that can be used as alternates to its freeways (Table A-3).17 The urban areas with higher Roadway Capacity scores (75 to 100) have 45 percent more roadway capacity than the lower scoring (25 to 49) urban areas, illustrating the effectiveness of greater roadway capacity in improving evacuation capacity (Table 9).
Lack of Automobile Access: Most urban areas have high rates of automobile access. New York is the only urban area with a substantially lower Automobile Access score, which has the impact of reducing its Evacuation Capacity Index score by more than 15 percent. Nonetheless, the Evacuation Capacity Index in all urban areas could be improved if more households owned cars. This would also have significant positive impacts in job access, thereby providing a means of entry to the economic mainstream by low-income households. Low rates of automobile availability can be moderated by various policies that would seek to increase the number of low-income households with cars.18
densification�policies�have�generally�
been�accompanied�by�the�strategies�to�
reduce�the�rate�of�highway�expansion,�
thereby�worsening�evacuation�capacity.
16 Demographia World Urban Areas, http://www.demographia.com/db-worldua.pdf, February 13, 2006.17 The deficiencies of the Atlanta roadway system are outlined in Wendell Cox and Alan Pisarski, Blueprint 2030: Affordable
Mobility and Access for All of Atlanta and Georgia (Atlanta: Georgians for Better Transportation, 2004). http://ciprg.com/ul/gbt/atl-report-20040621.pdf.
18 The empowering effect of car ownership on low-income households is described in Evelyn Blumenberg and Margy Waller, “The Long Journey to Work: A Federal Transportation Policy for Working Families,” Center for Urban and Metropolitan Policy, Brookings Institution, July 2003, Margy Waller and Mark Alan Hughes, “Working Far from Home: Transportation and Welfare Reform in the Ten Big States,” Progressive Policy Institute, August 1, 1999 and Anne Kim, “Why People Need Affordable Cars,” Blueprint: Ideas for a New Century, February 11, 2003, at www.ndol.org/ndol_ci.cfm?contentid=251220&kaid=114&subid=143.

2�
NO DIRECtIONAl BARRIER ONE OR mORE DIRECtIONAl BARRIER
Atlanta Baltimore
Austin Boston
Cincinnati Chicago
Columbus Cleveland
Dallas-Fort Worth Detroit
Denver Houston
Indianapolis Los Angeles
Kansas City Miami
Las Vegas Milwaukee
Memphis New Orleans
Minneapolis-St. Paul New York
Orlando Providence
Philadelphia San Diego
Phoenix San Francisco-San Jose
Pittsburgh Seattle
Portland Tampa-St. Petersburg
Sacramento Virginia Beach
San Antonio
St. Louis
Washington
Table 8Urban Areas by Geographical Barriers
(water or International Border)
Figure 5
0
10
20
30
40
50
60
70
80
90
100
1,500 2,500 3,500 4,500 5,500 6,500
Density & the Roadway Capacity ScoresURBAN AREAS OVER 1,000,000 POPULATION
Population per Square Mile
R 2=0.35(signi�cant at 95% level of con�dence)
Road
way
Cap
acit
y Sc
ore

24
CAtEGORy AvERAGE POPUlAtION
DENSIty
AvERAGE ROADwAy INtENSIty
DIRECtIONAl GEOGRAPhICAl
BARRIERS
Higher: 75-100 2,520 1.07 11%
Middle: 50-74 2,956 0.89 53%
Lower: 25-49 4,049 0.74 62%
No Cases: 0-24 No Cases
higher Category Compared to lower Category
-37.8% 45.2% -81.9%
However, evacuation capacity is as important in urban areas with unique challenges as it is urban areas with low population density, strong roadway systems, high automobile ownership rates and without geographical barriers. Thus, adequate protection of the citizenry will require greater efforts in the more disadvantaged urban areas.
Planning for the Mass Transit DependentPublic planning for people without access to cars (mass transit dependent) is far more complex than the planning for automobile evacuation. For those with cars, the public role is simply to manage the best use of infrastructure that is in place. Much of the planning for households with cars — the operational planning — is conducted by the
Table 9
Roadway Capacity Score and Influencing Factors
Figure 6
0
10
20
30
40
50
60
70
80
90
100
0.40 0.60 0.80 1.00 1.20 1.40 1.60
Roads & the Roadway Capacity ScoresURBAN AREAS OVER 1,000,000 POPULATION
Roadway Network Intensity
R 2=0.47(signi�cant at 99% level of con�dence)
Road
way
Cap
acit
y Sc
ore
25
American H ighway U s e r s A l l i a n c e Emergency Evacuation R e p o r t 2 0 0 6
households themselves, who provide for their own movement by car using the govern-ment provided infrastructure already in place.
However, government must plan for the movement of the mass transit dependent. This in-cludes not only the vast majority whose lack of automobile access arises from low-income, but for those with higher incomes who choose to live and work relying on transit and walking and have chosen to not purchase an automobile. This latter category of households is principally concentrated in the New York urban area, which is discussed below.
Generally, people who are not able to evacuate by means of cars are dependent upon transit. The responsibility for the evacuation infrastructure and evacuation operations will fall on government, for people without cars, regardless of their income levels. Some of the higher income households living in places like the core of New York or Chicago might be able to rent cars, but the demand for rental cars would far exceed the supply.
Resources for Mass Transit Dependent EvacuationThere are considerable resources available for evacuating the mass transit dependent in each of the urban areas.
Buses: Buses would be the most important mechanism of evacuation for people without cars. Most urban areas have a significant supply of buses, which could be used to carry people directly to evacuation centers, often returning to take additional trips. The bus resources include the following:
• Mass transit buses: There are approximately 60,000 urban transit buses in the United States. Most of these buses have been purchased principally with federal tax funding and these public resources should be a principal means of mass transit dependent evacuation.
• School buses: The nation has 425,000 school buses, of which at least 200,000 school buses19 in urban areas and a total of 425,000 school buses including those in rural areas.
• Motor coaches: There are approximately 40,000 motor coaches in the nation, many of which are in urban areas. The motor coach industry provides charter, tour, intercity, airport express, special operations and contract services (commuter, school and transit) services. Motor coaches provide an additional benefit, in being able to accommodate personal effects more readily.
Buses�would�be�the�most�
important�mechanism�
of�evacuation�for�people�
without�cars.
19 School buses are the largest mass transit mode in the nation on school days, carrying approximately 65 percent more passenger miles than all of the nation’s mass transit agency modes combined, including buses, metros (subways), light rail, etc. See: http://www.publicpurpose.com/sch-tr96.htm.

26
American H ighway U s e r s A l l i a n c e Emergency Evacuation R e p o r t 2 0 0 6
Paratransit Vehicles: There are also at least 35,000 paratransit vehicles (“dial-a-ride”), operated under the auspices of social service and mass transit agencies. These vehicles play a special role because most are equipped for serving handicapped citizens who find it difficult to use buses. Commuter Rail: In a few areas, high-capacity commuter rail systems can play a supplemental role, especially in New York and Chicago and to a lesser extent in Boston and Philadelphia. These commuter rail systems could carry large numbers of people to train stations, generally at the end of the line (usually on the periphery of the urban area or somewhat beyond), where buses would distribute people to shelters outside the urban areas.20 Bus transportation would be necessary so that the large numbers are not left stranded within urban areas near railroad stations where there is insufficient capacity to accommodate them.
Other urban areas, such as Los Angeles, San Francisco, Washington and Baltimore have commuter rail systems, but have considerably less capacity both in available routes and operating vehicles (trains) than New York, Chicago, Boston and Philadelphia.
Subways and Light Rail: Subway and light rail systems, such as the New York subway, the Washington Metro and light rail lines such as those built in Portland or San Diego can also be used as a resource to supplement evacuation system. Subways and light rail are generally local transportation systems, with routes generally serving areas that are more central. Their principal use would be feeding buses that would complete the evacu-ation to outside the urban area.
Amtrak: Amtrak could also play a minor role, especially in the Northeast Corridor, where its resources are concentrated. Here again, Amtrak evacuation would need to be coordinated with connecting bus service from railroad stations to shelters, so that evacu-ees are not stranded at railroad stations.
Taxicabs and Rental Cars: Taxicabs could be used by mass transit dependent households, though would be beyond the financial means of most low-income households.
Evacuation Centers: The horror stories from the mass evacuation centers in New Orleans (the Super Dome and the convention center) illustrate the difficulty of providing logistical support to overly large facilities. Generally, it will be preferable to move mass transit dependent households to more dispersed locations, outside the disaster area.21
20 Passenger rail systems can be vulnerable in emergencies. For example, during the recent storms (June 2006) in the Washington, DC area, two Virginia commuter rail lines shut down, while the Maryland lines ran abbreviated schedules. There were also significant service disruptions on the Washington Metro subway.
21 For a description of the experience at the large New Orleans evacuation centers, see Douglas Brinkley, The Great Deluge Hurricane Katrina, New Orleans and the Mississippi Gulf Coast, New York: William Morrow, 2006.

27
American H ighway U s e r s A l l i a n c e Emergency Evacuation R e p o r t 2 0 0 6
The Unique Challenge of New YorkThe New York urban area has nearly double the number of auto-less households as the next most mass transit dependent urban area, New Orleans. As noted above, this is possible because of the high level of service provided by transit agencies in the hyper-dense city of New York, where many households choose to not have a car, despite having sufficient income. Elsewhere, most auto-less households have no car because they have insufficient income.
Yet, differences in income among the mass transit dependent will be largely irrelevant in an evacuation. Higher-income auto-less households will have little advantage over their lower-income counterparts. Some may be able to take ad-vantage of rental cars or taxis, but those resources will fall far short of the demand.
The distribution of auto-less households in the New York urban area generally corresponds with design of mass transit services. Approximately 80 percent of the auto-less households live in the city of New York, where there is intensive transit service. It can be expected that the city’s subway (metro) system will provide mobility for auto-less households to commuter rail stations, where people can transfer to trains that take them to bus staging stations outside the urban area. Others can be taken to peripheral subway stations, where they can board buses to complete their evacuation.
Thus, evacuation planning in New York will be a considerably greater burden for govern-ments than it is where a far lower share of the population is mass transit dependent.
Opportunities for Improvement in Mass Transit Dependent PlanningConsiderable use was made of motor coaches in the New Orleans and Houston evacua-tions. The American Bus Association, the national trade association of the motor coach industry, has examined the experience and made recommendations for improving evacu-ation planning. For example, it is important to provide for driver logistics, such as food and lodging. Some motor coach operators report having had drivers working for weeks and being forced to sleep on buses. As has been clear in media reports, there were signifi-cant coordination problems in the government response effort and those were evident to bus operators. There were significant communications difficulties and there was a failure to use Internet resources to a significant extent. There were also contractual, deployment and payment difficulties.
A lack of available drivers was cited as a reason why Regional Transit Authority buses did not play a major role in evacuating citizens from New Orleans. Planning must be improved so that personnel of organizations with evacuation resources understand what is expected of them and are effectively deployed.
The�New�York�urban�
area�has�nearly�double�
the�number�of�auto-less�
households�as�the�next�
most�mass�transit��
dependent�urban�area,�
New�Orleans.

28
American H ighway U s e r s A l l i a n c e Emergency Evacuation R e p o r t 2 0 0 6
Transportation operators need to be paid promptly, whether they are mass transit agen-cies, school districts or private bus companies. There is a need to facilitate the contracting and deployment process, so that transportation operators are aware of what is required of them and confident that they will be paid. There may be a need to establish “standby” or expedited contracts in advance so that the transaction time in arranging for evacuation services is minimized.
There may be a need to establish expedited bus exclusive routes, so that buses can avoid the worst traffic congestion. This could make it possible for buses to make return trips, multiplying the number of people who can be evacuated. Most urban areas have a num-ber of lower capacity, two lane roads that could be used as exclusive bus routes for exiting the urban area, which might be preferable to attempting to enforce exclusive bus lanes on the overcrowded routes being used by cars.
Each of these issues should be addressed in a comprehensive, cooperative planning pro-cess that includes government agencies and all potential providers of evacuation services, as recommended above. Finally, the American Bus Association has developed “Partnering Principles” that would facilitate a more effective response in the future.22 These prin-ciples should apply, as appropriate, to the relationship between government agencies and all transportation operators, not just motor coach operators.
Additional IssuesIn planning the operation of mass evacuations, authorities should consider issues such as the following:
• Maximum use of contra-flow operations on roadways
• Use of roadway shoulders as additional lanes
• Suspension of tolls on all roadway facilities
• Strategic use of lower capacity exit routes, such as two-lane highways
• Use of global positioning systems for providing directions to disperse traffic to underutilized routes both within the urban area and once it has exited the urban area.
• Strategies for ensuring adequate fuel supplies, both in the evacuation and during the return trip
There�may�be�a�need�to�establish�expedited�bus�exclusive�routes,�so�that�buses�can�avoid�the�worst�traffic�congestion.
22 Partnering Principles, American Bus Association, www.buses.org/downloads/2787.cfm

29
American H ighway U s e r s A l l i a n c e Emergency Evacuation R e p o r t 2 0 0 6
RECOMMENDATIONSThe following recommendations are offered based upon the analysis above.
• A National Standards and Reporting System should be established: A national urban evacuation standards and reporting system should be established in a cooperative effort involving governments at every level and other appropriate interests. Such a system would provide more detailed information on the issues of Exit Capacity, Internal Traffic Flow Automobile Access and other important issues that might be identified. Comparative data should be regularly reported on urban areas. The standards and reporting system could be established through consultation between urban areas, with the technical assistance of the Federal Highway Administration, the Department of Homeland Security and other appropriate organizations.
• Roadway Capacity should be expanded: Each urban area should undertake roadway capacity expansions to make necessary improvements to the evacuation system. This would include not only construction of new and expanded roadways, but also capacity expansions through improved traffic management and other strategies that enhance the more efficient operation of roadways. There is particu-lar potential for improving roadway capacity and better using existing capacity through information technology (Intelligent Transportation Systems). This can include vehicle guidance systems, ramp metering with emergency gates, and expanded systems for providing information to drivers – especially on traffic conditions and alternate routes.
• Automobile Access should be expanded: Governments should seek to employ strategies that increase automobile ownership among low-income households that do not have access to automobiles. An important step in this direction was taken by the Clinton administration in establishing regulations to encourage households on public assistance to own their own cars.23
• Urban Area Evacuation Operations Planning should be completed: Each urban area should establish a participative evacuation plan-ning program that includes appropriate government and private interests. The principal purpose of this planning program would be to establish the operational framework for managing mass evacuations. This would include not only highway management, but also programs to provide evacuation services to mass transit dependent populations. Additional observations are provided on this process below.
CONCLUSIONThere is considerable latitude for improving the evacuation capacity of the nation’s urban areas. Such a program will be most effectively delivered through an objective evaluation system, which leads to effective measures to improve evacuation capacity.
23 Press release, “President Clinton Announces Transportation Grants to Help Low-Income Families,” White House, October 16, 2000.
�0
APPENDIX 1: SUMMARY DATA
RANK CODE URBAN AREA EvACUAtION CAPACIty
INDEx (0-100)
EvACUAtION CAPACIty
GRADE
ExIt CAPACIty
INtERNAl tRAFFIC
FlOw
AUtOmOBIlE ACCESS
24 ATL Atlanta 48.1 F F F A
13 AUS Austin 66.2 D D C A
16 BAL Baltimore 62.6 D C D A
22 BOS Boston 49.4 F F D A
36 CHI Chicago 28.0 F F F A
6 CIN Cincinnati 79.0 C B C A
7 CLV Cleveland 74.5 C D A A
2 COL Columbus 82.3 B A B A
18 DEN Denver 59.8 F D D A
28 DET Detroit 47.3 F F D A
11 DFW Dallas-Fort Worth 70.5 C B D A
21 HOU Houston 54.8 F F F A
5 IPS Indianapolis 79.2 C B C A
1 KC Kansas City 90.0 A A B A
37 LA Los Angeles 25.6 F F F A
27 LV Las Vegas 47.4 F F D A
3 MEM Memphis 80.5 B B B A
34 MIA Miami 36.9 F F F A
15 MIL Milwaukee 65.2 D D C A
26 MSP Minneapolis-St. Paul 47.5 F F D A
12 NO New Orleans 67.3 D D B A
35 NY New York 31.5 F F D B
8 ORL Orlando 74.1 C B C A
4 PGH Pittsburgh 80.4 B B A A
22 PHI Philadelphia 49.4 F F D A
30 PHX Phoenix 43.6 F F D A
25 POR Portland 47.7 F F D A
14 PRV Providence 65.9 D F B A
9 SA San Antonio 73.5 C C C A
17 SAC Sacramento 60.3 D D D A
32 SD San Diego 37.8 F F F A
31 SEA Seattle 39.9 F F D A
33 SF San Francisco-San Jose 37.2 F F F A
10 STL St. Louis 70.6 C C C A
19 TSP Tampa-St. Petersburg 58.9 F F D A
20 VB Virginia Beach 57.4 F F C A
29 WDC Washington 44.9 F F F A
Table a-1
Evacuation Capacity Index and Grades: Alphabetical list

�1
CODE URBAN AREA ExIt CAPACIty
(0-100)
INtERNAl tRAFFIC FlOw
(0-100)
ROAD CAPACIty
SCORE (0-100)
AUtOmOBIlE ACCESS
EvACUAtION CAPACIty
INDEx (0-100)
EvACUAtION CAPACIty
GRADE
ATL Atlanta 46 54 50.0 96.1% 48.1 F
AUS Austin 62 75 68.5 96.8% 66.2 D
BAL Baltimore 73 63 68.0 91.8% 62.6 D
BOS Boston 40 66 53.0 92.9% 49.4 F
CHI Chicago 17 43 30.0 92.7% 28.0 F
CIN Cincinnati 89 78 83.5 94.6% 79.0 C
CLV Cleveland 67 91 79.0 94.2% 74.5 C
COL Columbus 91 81 86.0 95.9% 82.3 B
DEN Denver 64 60 62.0 96.2% 59.8 F
DET Detroit 38 62 50.0 95.1% 47.3 F
DFW Dallas-Fort Worth 82 64 73.0 96.7% 70.5 C
HOU Houston 56 58 57.0 96.0% 54.8 F
IPS Indianapolis 89 76 82.5 96.1% 79.2 C
KC Kansas City 98 89 93.5 96.0% 90.0 A
LA Los Angeles 24 30 27.0 94.7% 25.6 F
LV Las Vegas 39 61 50.0 95.2% 47.4 F
MEM Memphis 88 82 85.0 94.5% 80.5 B
MIA Miami 20 58 39.0 94.5% 36.9 F
MIL Milwaukee 61 79 70.0 93.5% 65.2 D
MSP Minneapolis-St. Paul 33 66 49.5 95.5% 47.5 F
NO New Orleans 67 81 74.0 91.0% 67.3 D
NY New York 14 61 37.5 83.8% 31.5 F
ORL Orlando 83 70 76.5 96.6% 74.1 C
PGH Pittsburgh 83 90 86.5 92.7% 80.4 B
PHI Philadelphia 40 68 54.0 91.8% 49.4 F
PHX Phoenix 25 65 45.0 96.4% 43.6 F
POR Portland 37 63 50.0 95.5% 47.7 F
PRV Providence 59 81 70.0 94.1% 65.9 D
SA San Antonio 77 78 77.5 95.1% 73.5 C
SAC Sacramento 63 63 63.0 95.8% 60.3 D
SD San Diego 20 59 39.5 95.9% 37.8 F
SEA Seattle 21 62 41.5 95.8% 39.9 F
SF San Francisco-San Jose 28 51 39.5 94.3% 37.2 F
STL St. Louis 71 78 74.5 95.0% 70.6 C
TSP Tampa-St. Petersburg 56 67 61.5 95.7% 58.9 F
VB Virginia Beach 41 79 60.0 95.5% 57.4 F
WDC Washington 47 49 48.0 93.9% 44.9 F
Table a-2
Urban Area Scores and Evacuation Capacity Index: Alphabetical list

CODE URBAN AREA FREEwAy INtENSIty
RANK PRINCIPAl ARtERIAl INtENSIty
RANK ROADwAy NEtwORK INtENSIty
RANK
ATL Atlanta 0.62 16 0.13 36 0.75 29
AUS Austin 0.56 22 0.26 23 0.82 24
BAL Baltimore 0.74 7 0.26 20 1.00 10
BOS Boston 0.59 19 0.26 21 0.85 20
CHI Chicago 0.31 36 0.24 28 0.55 35
CIN Cincinnati 0.77 5 0.28 18 1.05 6
CLV Cleveland 0.79 4 0.25 26 1.05 7
COL Columbus 0.80 3 0.23 32 1.02 8
DEN Denver 0.57 21 0.31 14 0.88 19
DET Detroit 0.49 25 0.42 3 0.90 16
DFW Dallas-Fort Worth 0.67 11 0.32 11 0.99 11
HOU Houston 0.58 20 0.25 27 0.83 22
IPS Indianapolis 0.55 24 0.29 17 0.84 21
KC Kansas City 1.29 1 0.24 30 1.52 1
LA Los Angeles 0.46 27 0.34 9 0.80 25
LV Las Vegas 0.29 37 0.11 37 0.41 37
MEM Memphis 0.60 18 0.42 2 1.02 9
MIA Miami 0.39 32 0.38 6 0.77 28
MIL Milwaukee 0.56 23 0.41 4 0.96 12
MSP Minneapolis-St. Paul 0.63 14 0.19 34 0.82 23
NO New Orleans 0.37 35 0.35 8 0.72 32
NY New York 0.38 33 0.16 35 0.54 36
ORL Orlando 0.62 17 0.46 1 1.08 4
PGH Pittsburgh 0.73 8 0.36 7 1.09 3
PHI Philadelphia 0.44 29 0.29 16 0.73 30
PHX Phoenix 0.39 31 0.32 10 0.71 33
POR Portland 0.44 30 0.20 33 0.64 34
PRV Providence 0.76 6 0.32 12 1.07 5
SA San Antonio 0.73 9 0.23 31 0.96 13
SAC Sacramento 0.46 28 0.31 13 0.77 27
SD San Diego 0.69 10 0.25 25 0.94 14
SEA Seattle 0.63 13 0.26 24 0.89 17
SF San Francisco-San Jose
0.62 15 0.26 22 0.88 18
STL St. Louis 0.99 2 0.27 19 1.26 2
TSP Tampa-St. Petersburg 0.37 34 0.40 5 0.77 26
VB Virginia Beach 0.64 12 0.29 15 0.94 15
WDC Washington 0.48 26 0.24 29 0.72 31
Average 0.59 0.29 0.88
Table a-3Roadway Network Intensity
Roadway Intensity: Freeway equivalent lane miles per 1,000 population Calculated from 2004 Federal Highway Administration data (freeways, 2004) and Texas Transportation Institute data (principal arterials, 2003).

��
American H ighway U s e r s A l l i a n c e Emergency Evacuation R e p o r t 2 0 0 6
APPENDIX 2: METHODOLOGY
The methodology used in the Emergency Evacuation Report Card is described below.
Urban Areas: Urban areas represent geography that is contiguously developed for urban uses, such as residences, employment and supportive transportation (such as airports and roadways within the urban area). An urban area is different from a metropol-itan area, which includes rural areas beyond the urban area from which there is significant commuting to the urban area for employment. The analysis uses urban areas as defined by the 2000 United States Census, with populations adjusted from 2000 to 2005 based upon the metropolitan area rate of population increase. Urban areas with more than 1,000,000 estimated population in 2005 were used in the analysis.
The Los Angeles and San Francisco (San Francisco-San Jose) urban areas were expanded to include substantially adjacent urban areas within US Bureau of the Census consolidated areas and to include urban areas that are maintained as separate by the Bureau of the Census but included by the Federal Highway Administration and the Texas Transportation Institute.
The Los Angeles urban area includes the census-designated Los Angeles and Riverside-San Bernardino urban areas. The Los Angeles urban area also includes the Mission Viejo and Thousand Oaks urban areas, which are considered separate by the Bureau of the Census but included in Los Angeles by the Federal Highway Administration and the Texas Transportation Institute.
The San Francisco-San Jose urban area includes the census-designated San Francisco and San Jose urban areas and the Concord urban area, which is considered separate by the Bureau of the Census but included in San Francisco by the Federal Highway Administra-tion and the Texas Transportation Institute.
Exit Capacity: The capacity of each urban area’s roadways to evacuate the popula-tion was estimated.24 The standard for evaluation was the theoretical capacity of the roadways at the exit points over a 12-hour period. During periods of high demand, with evacuation representing the highest demand, roadways do not operate at full capacity. However, up to this theoretical capacity could be accommodated by exit routes by an effective employment of contra-flow (converting inbound lanes to outbound operation) if the roadways were able to handle 50 percent of their theoretical capacity.
The resulting percentage of population that could be evacuated was converted into a number from 0 to 100, so that, for example, an urban area with an exit capacity of 75 percent would receive a score of 75.
24 A capacity per lane of 2,200 cars was used for grade separated roadways (freeways and tollways) and 1,500 for principal arterials and frontage roads.

�4
American H ighway U s e r s A l l i a n c e Emergency Evacuation R e p o r t 2 0 0 6
Internal Traffic Flow: Internal Traffic Flow is estimated using the most recent Travel Time Index (2003), which is produced by the Texas Transportation Institute. The Travel Time Index estimates the average travel delay on urban highway systems during peak hours. For example, an urban area with a Travel Time Index of 1.40 has an average peak period travel delay of 40 percent compared to travel during non-congested periods. The travel delay is used to estimate Internal Traffic Flow. For example, an urban area with no travel delay (a Travel Time Index of 1.00) scores 100 in Internal Traffic Flow, while an urban area with a 40 percent travel delay (Travel Time Index of 1.40) scores 60 in Internal Traffic Flow (100 minus 40). The Internal Travel Flow scores for the consolidated urban areas (Los Angeles and San Francisco-San Jose are weighted on a traffic volume basis.
Roadway Capacity: The Roadway Capacity Score is the combined Exit Capacity and Internal Traffic Flow score, with each weighted at 50 percent.
Automobile Access: Automobile access was estimated for each urban area using data from the 2000 United States Census for households with automobiles. The Automo-bile Access factor was estimated, based upon the New Orleans experience, that friends and relatives would evacuate one-half of the households who do not have access to automo-biles by automobile. Thus, an urban area in which 90 percent of households have cars would have an Automobile Access factor of 95 percent (one-half of the auto-less would not be evacuated by car).
Evacuation Capacity Index: The Evacuation Capacity Index for each urban area is determined by multiplying the Automobile Access score (percentage) by the Roadway Evacuation Score.
About the Author — Wendell CoxWendell Cox is a public policy consultant and principal of Wendell Cox Consultancy (Demographia) in metropolitan St. Louis, Missouri-Illinois. He also serves as a visiting professor at the Conservatoire National des Arts et Metiers in Paris. He was appointed to three terms on the Los Angeles County Transportation Commission by Mayor Tom Bradley and to one term on the Amtrak Reform Council by Speaker of the US House of Representatives Newt Gingrich.