emergency departments - home | audit scotland to emergency departments are self-referrals but there...
TRANSCRIPT

Emergency departments
Prepared for the Auditor General for ScotlandAugust 2010

Auditor General forScotlandThe Auditor General for Scotland is the Parliament’s watchdog for ensuring propriety and value for money in the spending of public funds.
He is responsible for investigating whether public spending bodies achieve the best possible value for money and adhere to the highest standards of financial management.
He is independent and not subject to the control of any member of the Scottish Government or the Parliament.
The Auditor General is responsible for securing the audit of the Scottish Government and most other public sector bodies except local authorities and fire and police boards.
The following bodies fall within the remit of the Auditor General:
• directorates of the Scottish Government• government agencies, eg the Scottish Prison Service, Historic Scotland • NHS bodies • further education colleges • Scottish Water • NDPBs and others, eg Scottish Enterprise.
Audit Scotland is a statutory body set up in April 2000 under the Public Finance and Accountability (Scotland) Act 2000. It provides services to the Auditor General for Scotland and the Accounts Commission. Together they ensure that the Scottish Government and public sector bodies in Scotland are held to account for the proper, efficient and effective use of public funds.

ContentsSummaryPage2
Background
About the audit Page3
Key messages
Key recommendations Page5
Part1.EmergencydepartmentsPage6
Key messages
There are no national definitions of emergency departments in ScotlandPage7
Emergency care activity has increased in recent years Page9
Deprivation and distance help explain attendance levels Page10
Most patients refer themselves to an emergency department Page12
Information about the medical condition of patients is limited but over half are classed as having minor injuries or illnesses Page15
Nearly a quarter of patients attending an emergency department are admitted to hospital Page16
There is a risk that the four-hour waiting time standard is not applied appropriately Page17
Emergency departments face significant workforce pressures Page18
Patients leaving without treatment cost over £2 million each year
Work is under way to improve data quality which is essential to help the service to improve
Recommendations Page21
Part2.WaitingtimesandqualityofcarePage24
Key messages
Waiting times for emergency care have reduced significantly Page25
Patients who need to be admitted or transferred wait longer Page26
Patient satisfaction with emergency care is linked to how long they waitPage27
Support for vulnerable groups is variable Page28
Monitoring and reporting on the quality of emergency care are limitedPage29
Recommendations Page30
Part3.WorkingtogetherPage31
Key messages
Services must work together more effectively to manage demand Page32
It is unclear how emergency department attendances will be reduced Page33
Alternatives to emergency departments have not been thoroughly evaluated Page34
Recommendations Page36
Appendix1.ProjectadvisorygroupPage37
Appendix2.MethodologyPage38
Appendix3.Self-assessmentchecklistforNHSboardsPage41
Emergency departments 1

SummarySummary22
A number of services work together to provide emergency care to patients. In 2008/09, the equivalent of around 1.4 million people attended an emergency department.

Summary 3
Background
1.A number of health services work together to deliver care to patients in an emergency (Exhibit 1, overleaf). The location and type of emergency services have evolved over time with the introduction of initiatives such as NHS 24 and minor injuries units. People may need treatment at a hospital emergency department, but it is not possible to review these services in isolation.1 NHS 24, GP practices and the Scottish Ambulance Service have an important role in assessing patients’ needs, deciding the appropriate level of response and, in some cases, stabilising patients’ conditions before taking them to hospital. However, most people who attend an emergency department decide to do so without being referred by a healthcare professional.
2.Emergency departments are an area of high spend and activity. In 2008/09, the equivalent of around 1.4 million people in Scotland attended an emergency department at a cost of £148 million.2 Patients can access other services when they require urgent treatment, such as one of the 59 minor injuries units across Scotland.3 These units provide treatment to just under 200,000 patients a year for less complex injuries, such as sprains, at a total cost of around £15 million.4
3.In 2008/09, the ambulance service transported over 400,000 patients to hospital, a fifth of whom had immediate life-threatening conditions such as chest pain or cardiac arrest. The overall cost of the ambulance service in that year was £142 million.5 Over recent years, the ambulance service has taken on a greater role in providing treatment alongside its traditional role of transporting patients, for example, administering drugs to people who have had a heart attack.
4.NHS 24 and GPs can refer patients to emergency departments or to the ambulance service. NHS 24 refers just under four per cent of attendances to emergency departments and GPs refer just over ten per cent of attendances. In 2008/09, NHS 24 referred just under 75,000 of its calls to emergency departments and an average of six per cent of calls to the ambulance service. Referrals from NHS 24 represented around 16 per cent of emergency journeys by the ambulance service to hospitals.
Abouttheaudit
5.Our audit focused on emergency departments and their links with other services such as the ambulance service and NHS 24. We looked at the performance of these services in meeting the needs of patients and assessed whether emergency departments are making the best use of resources. We also reviewed how effectively services work together to manage demand and deliver coordinated patient care. We found that it is not possible to draw clear conclusions about the relative performance of emergency departments, as the services provided across Scotland are not clearly defined and vary across the country. We collected management data from all NHS boards to underpin this audit as there is a lack of basic information available to benchmark these services. We analysed these data to look for patterns in the way that services are provided, but the relatively small number of emergency departments in Scotland make statistical comparisons difficult. We have shared the information we collected with NHS boards during the audit to help them to improve their services. We have also published a summary of these data on our website.
6.This report focuses on emergency departments but we have also analysed data from NHS 24, the ambulance service and general practice. We interviewed staff at NHS 24 and the ambulance service and spoke to staff at all NHS boards in Scotland. We carried out a survey of doctors and nurses working in emergency departments and surveyed a sample of people who have recently used emergency care services. Full details of the findings from these surveys are available on our website, and Appendix 2 has more information about our methodology. Issues for non-executive NHS board members to raise within their NHS boards are available in a separate document (see Issues for non-executive NHS board members on our website).
7.This report is structured into three main parts:
• Emergency departments (Part 1).
• Waiting times and quality of care (Part 2).
• Working together (Part 3).
1 Emergency departments were previously known as accident and emergency departments.2 Audit Scotland fieldwork, 2009.3 Ibid.4 Total accident and emergency specialty costs, Information Services Division (ISD) Scotland Costs Book, 2008/09. This figure does not include costs for minor injuries units that do not submit a costs book return, including the Western General Hospital, Edinburgh. 5 This covers the cost of the accident and emergency service provided by the ambulance service. It excludes the cost of the patient transport service.

4
Exhibit1Location of emergency care services in ScotlandMost emergency departments are located in the central belt, reflecting population density.
Reproduced by permission of Ordnance Survey on behalf of HMSO. © Crown copyright and database right 2010. All rights reserved. Ordnance Survey Licence number Scottish Government 100020540.
Note: This exhibit contains information on 35 emergency departments and 59 minor injuries units, representing service provision in 2008/09. However, since then, two emergency departments in NHS Greater Glasgow and Clyde have changed to minor injuries units.
Source: Audit Scotland, 2010
®v
®v
®v
®v
®v
®v ®v®v
®v
®v
®v
®v®v®v®v®v®v®v
®v
®v
®v
®v
®v
®v
®v®v®v
®v®v ®v
®v
®v®v
®v
®v
Minor injuries units®v Emergency departments
0 68,000 136,00034,000 Metres
¯
Summary 5
Keymessages
• There is inadequate information to demonstrate that the best use is made of existing emergency care resources. The location and type of emergency services have evolved over time with the introduction of initiatives such as NHS 24 and minor injuries units. There is variation across Scotland in the services provided, the population served by emergency departments, attendance rates and how patients are recorded.
• Emergency departments are facing pressures due to increasing attendances. Most attendances to emergency departments are self-referrals but there is limited analysis of the reasons for this. Attempts to reduce attendances at emergency departments are not underpinned by an assessment of what works or the costs of alternative approaches.
• Patient satisfaction with emergency care services is high. The ambulance service and NHS 24 have improved response times, and emergency departments have significantly reduced waiting times. Closer working across the whole health and social care system is needed to make further service improvements.
• National monitoring and reporting on the quality and clinical effectiveness of the care that patients receive at emergency departments are limited. Services and facilities to meet the needs of specific patient groups are variable across Scotland.
Keyrecommendations
The Scottish Government should:
• provide a clearer strategic direction for emergency care services in Scotland underpinned by a review of the services provided, workforce, attendance rates and how patients are recorded
• provide clarity about the role and definitions of services involved in delivering emergency care, including developing consistent national definitions of emergency departments
• work with Information Services Division (ISD) Scotland and NHS Quality Improvement Scotland (NHS QIS) to develop formal measures to assess and monitor the quality and clinical effectiveness of care provided at emergency departments
• evaluate the impact of alternatives to emergency departments on other services in terms of cost, activity, capacity and quality of care, and ensure that good practice is shared
• work with the NHS to develop robust benchmarking data to ensure that available resources are being used effectively and ensure consistency in terminology and standards across services.
NHS boards should:
• routinely review referrals and work with services to ensure that patients are seen and receive treatment in the most appropriate place
• examine the scope for GPs to refer emergency patients direct to the relevant admission unit in the hospital without first attending the emergency department
• ensure that facilities for children and vulnerable people are appropriate
• use the Audit Scotland checklist detailed in Appendix 3 to help improve the efficiency and effectiveness of emergency care services.
NHS boards, the ambulance service, NHS 24 and GPs should:
• ensure that initiatives for reducing attendances at emergency departments are underpinned by evidence of their effectiveness and the impact on patient care, costs and the wider health and social care system.
6
Part1.Emergencydepartments
Emergency care services have evolved over time and there is variation in the services provided across Scotland. This must be addressed to make best use of available resources.

Part 1. Emergency departments 7
Keymessages
• The location and type of emergency services have evolved over time with the introduction of initiatives such as NHS 24 and minor injuries units. There is variation across Scotland in the services provided, the population served by emergency departments, attendance rates and how patients are recorded.
• Most attendances to emergency departments are self-referrals but there is limited analysis of why people attend emergency departments. Given the focus on reducing attendances at emergency departments and that self-referrals account for the vast majority of attendances, it is a concern that they are not consistently recorded.
• Patients in the rest of the UK know what services to expect from emergency departments as clear definitions are in place. These services are not well defined in Scotland and this makes it difficult for patients to know which service to attend and difficult for staff, including the ambulance service, to know where to direct them.
• Modernising Medical Careers and other national staffing changes such as the consultant contract and the European Working Time Directive have affected the staffing available within emergency departments.
• There is inadequate information to demonstrate that the best use is made of existing emergency care resources. There is scope to improve efficiency by improving data quality, including information
on costs and case-mix, and through routinely benchmarking services.
TherearenonationaldefinitionsofemergencydepartmentsinScotland
8.Several policy documents have set out the broad approach to unscheduled care in Scotland. In 2005, Delivering for Health set out plans to develop an unscheduled care service that:
• focuses key medical resources in well staffed and resourced emergency centres to allow emergency specialists to concentrate on dealing with complex cases
• maintains care at a local level through multi-disciplinary teams
• makes greater use of tele-medicine
• plans some specialist services on a regional basis
• delivers against the four-hour waiting time target.6
9.Despite these aims, fundamental challenges with emergency departments remain, which the Scottish Government and the NHS must work together to address. The work of each emergency department in Scotland varies according to local demand. Staff working in emergency departments treat patients when something critical and life-threatening has happened, such as a heart attack or a major accident; or a serious illness or injury such as severe bleeding; or a less serious injury like a sprain. The majority of people attending an emergency department are classified as having a minor injury. We explain how this classification works in more detail at paragraph 31.
10.There are no national definitions of emergency departments in Scotland, although these are in place in the rest of the UK. The services provided by each emergency department vary across Scotland and this can be confusing for patients and staff (Exhibit 2, overleaf). For example, the distinction between the role of emergency departments and minor injuries units is not always clear. This lack of clarity makes it difficult for staff, including the ambulance service, to know where to direct patients. There are also differences in the terminology used by the various emergency services in Scotland. The terms emergency care or unscheduled care mean different things to different services and there is no agreed national definition of what constitutes an ‘emergency’. This also has consequences for professionals who need to direct patients to appropriate services and contributes to a lack of understanding among patients and staff about what type of emergency care service is most appropriate. Patients do not need to know the detail of how each service is classified but it is important that they do know which services are available and how to access them.
11.To collect consistent data for this audit we devised categories for emergency departments in Scotland and asked NHS boards to tell us which services they provide. Additional details of the services provided across Scotland can be found on our website. This report analyses the activity, staffing and costs for 30 emergency departments in Scotland. The 30 departments include the following:
• eleven consultant-led departments with a 24-hour service with trauma, acute medicine, acute surgery and tertiary services7
6 Delivering for Health, Scottish Executive, November 2005.7 Tertiary care services are very specialist services that are provided in a limited number of specialist units.

8
Exhibit2Definition of emergency departments in the UKAgreed definitions of emergency departments are in place across the rest of the UK but not in Scotland.
Agreed definitions across the UK
Scotland None. ISD Scotland classifies emergency departments as either core or non-core sites. Core sites include all emergency departments within large hospitals. According to this classification some core sites are large minor injuries units, for example the Western General Hospital. Non-core sites include minor injuries units, small hospitals with paper-based administration systems and health centres in rural areas that carry out emergency department type activity.
England Type 1 – A consultant-led, 24-hour service with full resuscitation facilities and designated accommodation for the reception of emergency department patients.
Type 2 – A consultant-led, single specialty emergency department service (eg, ophthalmology or dental services) with designated accommodation for the reception of patients.
Type 3 – May be doctor-led or nurse-led with designated accommodation for the reception of emergency department patients, treating at least minor injuries and illnesses (eg, sprains) which patients can routinely access without an appointment. This also includes all NHS walk-in centres and other open access treatment services offering at least minor injury/illness services, whether located alongside a main emergency department or at another location.
Wales Major emergency department – defined as a consultant-led service with appropriate resuscitation facilities and designated accommodation for the reception of emergency department patients. These departments must provide the resuscitation, assessment and treatment of acute illness and injury in patients of all ages, and services must be available continuously, 24 hours a day.
Other emergency department/minor injuries units – defined as all other emergency department /casualty/minor injuries units which have designated accommodation for the reception of emergency department patients and can be routinely accessed without an appointment, but which are not classed as a major emergency department.
Northern Ireland
Type 1 – A consultant-led service with designated accommodation for the reception of emergency care patients, providing both emergency medicine and emergency surgical services on a round-the-clock basis.
Type 2 – A consultant-led service with designated accommodation for the reception of emergency care patients, but which does not provide both emergency medicine and emergency surgical services and/or has time-limited opening hours.
Type 3 – A minor injuries unit, either doctor or nurse-led, with designated accommodation for the reception of patients with a minor injury and/or illness. This service treats at least minor injuries and/or illnesses and can be routinely accessed without an appointment.
Source: Audit Scotland, 2010; Improving Emergency Care in England, National Audit Office, 2004; The time spent in Northern Ireland Accident and Emergency Departments: December 2009, Northern Ireland Department of Health, Social Services and Public Safety; The time spent in NHS Wales Accident and Emergency Departments, Statistics for Wales.

Part 1. Emergency departments 9
• thirteen consultant-led departments with a 24-hour service with trauma, acute medicine and acute surgery but no tertiary services
• three consultant-led departments with a 24-hour service with acute medicine and acute surgery
• two consultant-led departments with a 24-hour service with either acute medicine or acute surgery
• one other department with a nurse and GP-led service.8
12.In recent years, the Scottish Government and NHS boards have worked together to try to improve emergency departments in Scotland and some NHS boards have restructured their services. NHS Greater Glasgow and Clyde is currently restructuring its emergency care services to five emergency departments instead of eight, with an additional six minor injuries units.9 In some other areas NHS board proposals to restructure emergency services have changed. In June 2007, proposals by NHS Lanarkshire and NHS Ayrshire and Arran to close emergency department facilities at two hospitals were rejected by the Scottish Government as it believed that they had failed to adequately take account of the needs of the local community.
13.Services in rural areas are very different to those provided in urban areas and the way that the local population uses these services also varies. For example, the Emergency Medical Retrieval Service, Scotland’s flying doctor and paramedic service for patients with life-threatening
conditions in remote and rural areas of Scotland. It is important that the ambulance service, NHS 24, GP practices and NHS boards work well together in rural areas. Initiatives such as tele-medicine are being developed in Scotland but are not yet used widely across emergency departments.10 Case study 1 sets out how emergency services are provided on the Scottish islands.
Emergencycareactivityhasincreasedinrecentyears
14.Unplanned attendances at emergency departments have increased by over 9.4 per cent in the last ten years, from 1.39 million in 1999/2000 to 1.52 million in 2008/09.11 The rate of increase in Scotland is lower than in England, where unplanned attendances have
Casestudy1Emergency care provision on the Scottish islands Western Isles: NHS Western Isles operates an emergency nurse practitioner-led service at the Western Isles Hospital in Stornoway. This was attended by around 7,800 patients in 2008/09, just over 1,600 of whom arrived by ambulance. In total, the ambulance service responded to around 3,100 urgent and emergency calls in the Western Isles in 2008/09, 684 of which were classified as immediately life-threatening. The annual cost of emergency services provided by NHS Western Isles is almost £1 million.
Orkney: There is no emergency department on Orkney but there is an acute receiving area within Balfour Hospital. This was attended by 2,700 patients in 2008/09, an estimated 90 of whom arrived by ambulance. In total the ambulance service responded to just over 1,600 emergency and urgent calls in 2008/09, 285 of which were classified as immediately life threatening. The annual cost of emergency services provided by NHS Orkney is over £700,000.
Shetland: Shetland has an emergency department at Gilbert Bain Hospital which also acts as a minor injuries unit and a primary care out-of-hours service. Over 10,000 patients attended the emergency department at Gilbert Bain Hospital in 2008/09, including patients who attended the primary care out-of-hours service. Of these 10,000 patients, around 600 arrived by ambulance. In total, the ambulance service responded to just over 1,700 emergency and urgent calls in 2008/09, 362 of which were classified as immediately life-threatening. The annual cost of emergency services provided by NHS Shetland is over £2 million.
Note: Costs provided are total emergency department costs only. These costs may include medical staff from other specialties. Scottish Ambulance Service costs were not available for island NHS boards. Source: Audit Scotland, 2010
8 The Belford Hospital in Fort William, Caithness General Hospital in Wick and Lorne and Islands District General Hospital in Oban classed themselves as having an emergency department type service and submitted information on some questions as part of this audit. These departments do not have the systems in place to collect detailed activity data and have therefore been excluded from the Scotland figure in the report (with the exception of the total attendance and total cost of emergency department figures). Balfour Hospital in Orkney also has an emergency department type service but does not have an electronic information system in place to capture emergency care activity, so it was unable to submit detailed data for 2008/09 and therefore has been excluded from the Scotland figure in the report (with the exception of the total attendance and total cost of emergency department figures). The Vale of Leven Hospital submitted information as an emergency department but as this is a nurse-led minor injuries unit open 12 hours a day, we have not included it as part of the main emergency department data (with the exception of the total attendance and total cost of emergency department figures).
9 This total includes two emergency departments on the Southern General Hospital site, one for adults and a separate children’s emergency department. Three of the minor injuries units will be integrated on the same sites as emergency departments.
10 Tele-medicine is the use of telecommunications technology for medical diagnosis and patient care when services and the patient are in different locations.11 Information Services Division, ISD(S)1 data. Includes minor injuries units except those who do not submit a costs book data return. This figure excludes
any patients with a planned appointment for follow-up treatment.

10
increased by 43 per cent over the last ten years, from 13.2 million to 18.8 million.12 Total unplanned attendances in 2008/09 ranged from just over 7,000 at the Western Isles Hospital to over 105,000 at the Royal Infirmary of Edinburgh.
15.Some emergency departments accept planned attendances, where staff have asked a patient to come back to the department to check on their condition. This varied from no planned attendances at Borders General Hospital to 4,568 at Monklands Hospital in NHS Lanarkshire in 2008/09.13 Differences in whether emergency departments accept planned attendances impact on their workload.
16.Ambulance service and NHS 24 activity has also increased in recent years. Emergency calls attended by the ambulance service have increased by 31 per cent from 2004/05 to 2008/09, while urgent calls attended by the ambulance service have decreased by seven per cent.14 Calls to NHS 24 have increased by around two per cent from 1.46 million in 2006/07 to 1.49 million in 2008/09. Over the same period, NHS 24 calls that resulted in a 999 call have increased by 16 per cent, but calls that resulted in the patient being advised to go to an emergency department have fallen by around six per cent.15
17.As part of our staff survey, doctors and nurses working in emergency departments reported that they believe the introduction of the new General Medical Services contract for GPs and the roll out of NHS 24 across Scotland in April 2004 has led to increased demand for emergency department services. However, given that data show referrals from GPs and NHS 24 to emergency departments
are low, these are unlikely to have had a significant impact on workloads at emergency departments. Differences in waiting times guarantees may in part explain the increases in emergency department attendances as patients are guaranteed to be seen within four hours at an emergency department but can wait 48 hours for a GP appointment.
18.The steady growth in the older population in Scotland, which is set to continue, is likely to have an impact on emergency departments as 17 per cent of patients attending emergency departments are aged over 65 years (Exhibit 3). By 2031, the number of people aged between 60 to 74 is projected to rise by 40 per cent and the number of people aged 75 and over is set to increase by 81 per cent. The prevalence of long-term conditions such as diabetes increases with age and patients with
these conditions are more likely than other people to use primary and acute services, including emergency care services. Doctors and nurses working in emergency departments told us that patients with long-term conditions are contributing to increased activity. However, there is limited information on the clinical reasons why people attend emergency departments. We explain this in more detail in paragraphs 29 to 32.
Deprivationanddistancehelpexplainattendancelevels
19.There is wide variation in attendance rates at emergency departments across Scotland. In 2008/09, there were 270 total attendances at emergency departments per 1,000 population. Attendance rates are highest in NHS Shetland (455 per 1,000), NHS Greater Glasgow and Clyde
Exhibit3Rates of emergency department attendances per 1,000 population by age and gender, 2008/09Males aged between 16 and 24 are most likely to attend emergency departments.
Source: Audit Scotland fieldwork, 2009
Males
Females
400 300 200 100 0 100 200 300 400
<16
16–24
25–34
35–54
55–64
65+
Patie
nt a
ge (y
ears
)
Rate of attendances per 1,000 population
12 Department of Health Hospital Activity Statistics, Quarterly Monitoring of Accident and Emergency (QMAE) first A&E attendances 1999/2000 and 2008/09.13 There are inconsistencies in how emergency departments in Scotland record planned attendances.14 Emergency calls include 999 calls and can include calls from a healthcare professional where a fast response is required. Emergency calls are classified into
three categories (A, B or C) depending on the urgency. The ambulance service aims to respond to the most serious calls within eight minutes. Urgent calls are requested by a healthcare professional and are usually responded to within one, two, three or four hours depending on a timescale agreed between the healthcare professional and the ambulance service.
15 NHS 24 data.
Part 1. Emergency departments 11
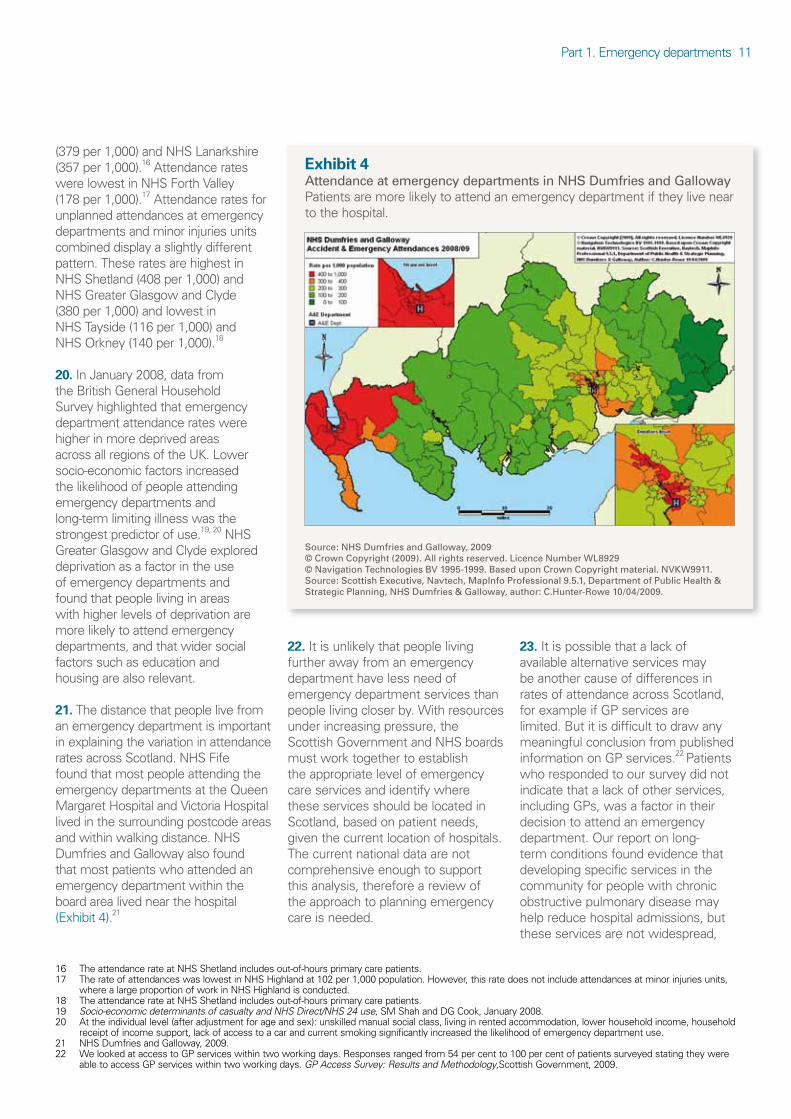
(379 per 1,000) and NHS Lanarkshire (357 per 1,000).16 Attendance rates were lowest in NHS Forth Valley (178 per 1,000).17 Attendance rates for unplanned attendances at emergency departments and minor injuries units combined display a slightly different pattern. These rates are highest in NHS Shetland (408 per 1,000) and NHS Greater Glasgow and Clyde (380 per 1,000) and lowest in NHS Tayside (116 per 1,000) and NHS Orkney (140 per 1,000).18
20.In January 2008, data from the British General Household Survey highlighted that emergency department attendance rates were higher in more deprived areas across all regions of the UK. Lower socio-economic factors increased the likelihood of people attending emergency departments and long-term limiting illness was the strongest predictor of use.19, 20 NHS Greater Glasgow and Clyde explored deprivation as a factor in the use of emergency departments and found that people living in areas with higher levels of deprivation are more likely to attend emergency departments, and that wider social factors such as education and housing are also relevant.
21.The distance that people live from an emergency department is important in explaining the variation in attendance rates across Scotland. NHS Fife found that most people attending the emergency departments at the Queen Margaret Hospital and Victoria Hospital lived in the surrounding postcode areas and within walking distance. NHS Dumfries and Galloway also found that most patients who attended an emergency department within the board area lived near the hospital (Exhibit 4).21
22.It is unlikely that people living further away from an emergency department have less need of emergency department services than people living closer by. With resources under increasing pressure, the Scottish Government and NHS boards must work together to establish the appropriate level of emergency care services and identify where these services should be located in Scotland, based on patient needs, given the current location of hospitals. The current national data are not comprehensive enough to support this analysis, therefore a review of the approach to planning emergency care is needed.
23.It is possible that a lack of available alternative services may be another cause of differences in rates of attendance across Scotland, for example if GP services are limited. But it is difficult to draw any meaningful conclusion from published information on GP services.22 Patients who responded to our survey did not indicate that a lack of other services, including GPs, was a factor in their decision to attend an emergency department. Our report on long-term conditions found evidence that developing specific services in the community for people with chronic obstructive pulmonary disease may help reduce hospital admissions, but these services are not widespread,
Exhibit4Attendance at emergency departments in NHS Dumfries and GallowayPatients are more likely to attend an emergency department if they live near to the hospital.
Source: NHS Dumfries and Galloway, 2009© Crown Copyright (2009). All rights reserved. Licence Number WL8929© Navigation Technologies BV 1995-1999. Based upon Crown Copyright material. NVKW9911. Source: Scottish Executive, Navtech, MapInfo Professional 9.5.1, Department of Public Health & Strategic Planning, NHS Dumfries & Galloway, author: C.Hunter-Rowe 10/04/2009.
16 The attendance rate at NHS Shetland includes out-of-hours primary care patients.17 The rate of attendances was lowest in NHS Highland at 102 per 1,000 population. However, this rate does not include attendances at minor injuries units,
where a large proportion of work in NHS Highland is conducted.18 The attendance rate at NHS Shetland includes out-of-hours primary care patients.19 Socio-economic determinants of casualty and NHS Direct/NHS 24 use, SM Shah and DG Cook, January 2008.20 At the individual level (after adjustment for age and sex): unskilled manual social class, living in rented accommodation, lower household income, household
receipt of income support, lack of access to a car and current smoking significantly increased the likelihood of emergency department use.21 NHS Dumfries and Galloway, 2009.22 We looked at access to GP services within two working days. Responses ranged from 54 per cent to 100 per cent of patients surveyed stating they were
able to access GP services within two working days. GP Access Survey: Results and Methodology,Scottish Government, 2009.

12
and even within a board area may not be available across the whole area.23 Better targeted care of patients with long-term conditions and people who frequently use emergency departments are important but are unlikely to address the scale of variation in the use of emergency departments across Scotland.
Mostpatientsreferthemselvestoanemergencydepartment
24.Patients can access emergency departments in a number of ways (Exhibit 5). Patients may attend an emergency department without being referred by a healthcare professional (self-referral), or they can be referred by a 999 service such as the ambulance service or by NHS 24 or a GP.
25.It is not possible under the current system to separate out people who decide to self refer to an emergency department from those people who first dial 999 or have an ambulance requested for them by the police or other emergency services. In 2008/09, most people who attended an emergency department (almost three-quarters) either decided to go themselves or were taken by an ambulance (Exhibit 6).24 This ranged from 57 per cent at Raigmore Hospital in NHS Highland to almost 90 per cent at Victoria Hospital in NHS Fife (Exhibit 7, page 14). There are inconsistencies in the way emergency departments record self-referrals. Given the focus on reducing attendances at emergency departments and that self-referrals account for the vast majority of attendances, it is a concern that they are not consistently recorded. ISD Scotland is working with NHS boards to improve these data and we have shared our data to help with this work.
Until accurate data are in place it will be difficult for NHS boards to actively manage demand for these services. There are similar issues in England where the published guidance is also unclear and open to interpretation.25 We estimate that the number of patients who refer themselves to an emergency department without any prior contact with healthcare professionals is around 56 per cent of all attendances.26
26.GP referrals make up just over ten per cent of total attendances at emergency departments (141,112). This varied from around three per cent at Victoria Hospital in NHS Fife and Stirling Royal Infirmary in NHS Forth Valley to over 21 per cent at Dumfries and Galloway Royal Infirmary. Some patients who are referred by a GP require a direct admission to hospital and do not specifically need the services of an
Exhibit5Flows into a typical emergency department Emergency departments accept referrals from a variety of sources including the ambulance service, NHS 24 and GPs.
Note: There may be local variation in patient flows into emergency departments and between services.
Source: Audit Scotland, 2010
Clinical decisionunit/observation ward/A&E ward/short-stay ward
Medical/surgical assessment unit
NHS 24 Self-referral AmbulanceGP in hours/out-of-hours
Admitted
Discharged
Other healthor social care
service
Emergencydepartment
23 Managing long-term conditions, Audit Scotland, August 2007. 24 When patients decide that they need emergency care and make their own way to the emergency department without first seeing or being told by a
healthcare professional to attend, this is often known as a self-referral. ISD Scotland’s definition of a self-referral also includes cases where the patient or a bystander calls 999 for an ambulance. The ISD Scotland guidance also states that the 999 code should only be used when a member of the emergency services, such as the police, has made the 999 call.
25 Correspondence with NHS Information Centre around the definition of a self-referral, April 2010.26 Although we are unable to separate those patients who self refer to an emergency department from those who first dial 999 or have an ambulance
requested by the police or other emergency services, we are able to look at how these patients arrive at the emergency department and separate them into those who arrived by ambulance and those who did not. This allows us to estimate the number of patients who attend the emergency department without any prior contact with healthcare professionals (ie, those who self referred, dialled 999 or were referred by the police or other emergency services, but did not arrive by ambulance). However, this may also include patients who had contact with a healthcare professional via a 999 call, but used an alternative method of transport to the emergency department.

Part 1. Emergency departments 13
emergency department. NHS boards take different approaches to admitting patients referred by GPs to hospital. In some areas or specialties, patients may be admitted to hospital through the emergency department but in others patients may be admitted directly to a ward. This may explain some of the variation in GP referrals, but this information is not collected consistently. Some NHS boards have collected data that show
significant variation in the rate and pattern of referrals by different GPs. NHS Lanarkshire found a three-fold difference in GP practice referral rates to emergency departments.27
27.Fewer than four per cent of patients attending emergency departments are referred from NHS 24 (53,879 patients in 2008/09). This varied across the country, from over two per cent at Glasgow Royal
Infirmary and Inverclyde Hospital in NHS Greater Glasgow and Clyde to over eight per cent at St John’s Hospital in NHS Lothian in 2008/09.28, 29
28.A quarter of all patients attending emergency departments are brought by ambulance. This ranged from eight per cent at the Royal Hospital for Sick Children in NHS Lothian to just over 36 per cent at Royal Infirmary of Edinburgh.30
Exhibit6Referrals between emergency care servicesAlmost three-quarters of people attending emergency departments are self-referrals. Fifty-six per cent of people attending emergency departments go directly to the department, while 18 per cent are taken by ambulance.
Note: The exhibit contains data for 30 emergency departments; however, NHS Lothian was unable to provide discharge information for any of its three emergency departments (Edinburgh Royal Infirmary, St John’s Hospital and The Royal Hospital for Sick Children Edinburgh) in a comparable format to other emergency departments. As a result, the discharge information is based on 27 emergency departments, while total attendances are based on 30 emergency departments, therefore the discharge total does not equate to 100 per cent.
Source: Audit Scotland, 2010
Ambulance25.8% of attendances
Emergency department1,390,837 attendances
Self-referral/99974.2% of attendances
GP10.2% of attendances
NHS 243.9% of attendances
Minor injuries unit0.8% of attendances
Other/not known8.1% of attendances
Out-of-hours services1.5% of attendances
6.9% of
attendances
56.1% of
attendances
2.7% of
attendances
1.2% of
attendances
0.7% of
attendances
5.3% of
attendances
0.3% of
attendances
3.3% of
attendances
18.1% of
attendances
1.2% of
attendances
0.1% of
attendances
2.8% of
attendances
Discharged57.6%
Admitted to hospital20.2%
Other/not known4.4%
Assessment unit1.8%
A&E ward0.6%
Died0.1%
27 NHS Lanarkshire presentation prepared for the Scottish Government Emergency Access Delivery Team, December 2009.28 Patients are also referred from other services such as minor injuries units (less than one per cent), out-of-hours services (less than two per cent) and for some
patients the referral source is not recorded (eight per cent).29 Some emergency departments were unable to provide a specific breakdown of referrals from NHS 24.30 Gilbert Bain Hospital in NHS Shetland reported that six per cent of people attending the emergency department arrived by ambulance and 38 per cent made
their own way. However, for 55 per cent of attendances the method of arrival was not recorded.

14
Exhibit7Attendances by referral source and hospital site, 2008/09Most people either decided to go to an emergency department themselves or were taken by an ambulance, although there is significant variation across Scotland.
Self-referrals
(including 999)%
GP%
Out-of-hours
services%
NHS 24%
Minor injuries
unit%
Other%
Not known
%
Victoria Hospital 89.7 2.9 0.3 4.1 2.1 0.9 0.0
Perth Royal Infirmary 88.9 3.0 0.2 4.2 1.0 2.4 0.2
Queen Margaret Hospital 87.4 4.7 0.6 3.9 2.7 0.7 0.0
Hairmyres Hospital 83.8 7.5 1.2 2.8 0.0 4.7 0.0
Wishaw General Hospital 82.9 9.0 0.6 3.1 0.0 4.4 0.0
Stirling Royal Infirmary 82.7 2.9 0.2 6.6 1.7 5.9 0.0
Ninewells Hospital 82.2 3.9 0.4 6.4 1.9 3.5 1.5
Southern General Hospital 81.8 13.7 0.0 0.0 0.0 1.2 0.0
Glasgow Royal Infirmary 79.6 11.3 0.8 2.4 0.0 4.4 0.0
Victoria Infirmary 79.0 9.7 0.0 0.0 0.0 5.1 0.0
Inverclyde Royal Hospital 77.7 7.3 0.2 2.4 0.0 11.0 0.1
Aberdeen Royal Infirmary 75.9 5.8 0.7 4.4 5.8 7.4 0.0
Royal Infirmary of Edinburgh 72.6 8.1 2.6 5.8 0.7 7.6 0.1
Monklands Hospital 71.5 10.5 2.2 5.0 0.0 10.8 0.0
Western Isles Hospital 70.9 10.7 0.0 3.1 0.0 15.4 0.0
The Ayr Hospital 70.3 20.1 0.0 INA 0.0 5.2 4.4
Royal Hospital for Sick Children, Glasgow 70.3 11.9 5.6 3.6 0.0 4.6 0.0
Royal Alexandra Hospital 70.1 12.8 2.2 3.2 0.0 10.6 0.0
Royal Aberdeen Children's Hospital 69.9 12.6 5.7 7.5 2.9 1.4 0.0
Royal Hospital for Sick Children, Edinburgh 69.9 11.6 2.9 5.5 0.6 4.5 2.8
Dr Gray's Hospital, Elgin 69.8 14.2 2.8 3.3 4.8 5.1 0.0
Galloway Community Hospital 69.8 6.5 3.3 5.0 0.1 6.4 0.4
Stobhill General Hospital 66.7 16.1 1.5 2.4 0.0 10.0 0.1
Western Infirmary Glasgow 64.8 14.4 2.3 3.2 0.0 9.5 0.2
Crosshouse Hospital 64.1 14.5 3.6 4.9 0.0 7.0 5.9
Dumfries and Galloway Royal Infirmary 63.8 21.6 1.0 4.4 0.2 4.2 0.1
St John's Hospital, Livingston 62.2 8.3 0.9 8.5 0.0 19.8 0.1
Borders General Hospital 61.4 12.9 2.7 3.7 0.9 11.2 7.2
Raigmore Hospital 57.0 6.3 0.0 5.0 0.0 21.8 9.9
Gilbert Bain Hospital 55.4 11.9 0.0 6.0 0.0 20.0 6.7
Scotland 74.2 10.2 1.5 3.9 0.8 7.1 1.0
Notes: 1. The data do not always sum to 100 per cent due to rounding or missing data. 2. INA denotes the information was not available. Where referrals from a specific source are zero, this may be due to local differences in data recording rather than there being no referrals.
Source: Audit Scotland fieldwork, 2009

Part 1. Emergency departments 15
3aaioodaoeCwwTdftor
Information about the medical condition of patients is limited but over half are classed as having minor injuries or illnesses
29. Emergency departments categorise patients using a triage scale which allows staff to rank patients according to how urgently they require assessment or treatment rather than in order of attendance. This enables staff to focus on the most seriously ill patients. Exhibit 8 gives further details of the triage categories used at the emergency departments which were able to provide data. Not all patients are triaged, for example at busy times staff may see and treat patients without triage.
30. ‘See and treat’ has been developed in some emergency departments to deal with less serious injuries and conditions. Under this system the first clinician, either a nurse or a doctor, who sees the patient can treat and discharge the patient without referring on to other clinicians. Most emergency departments use ‘see and treat’ at some point and many also ‘stream’ patients. This involves directing patients, according to the severity of their illness or injury, into appropriate areas with dedicated staff. This allows patients with more minor illnesses or injuries to be seen and treated at the same time as patients who are acutely ill or seriously injured.
1. Emergency departments also ttribute a ‘flow category’ to each ttendance (flows one to five) to ndicate the complexity and length f attendance. In 2008/09, over half f patients attending emergency epartments were classed as having minor injury or illness (Exhibit 9, verleaf). The flow categories were stablished by the Unscheduled are Collaborative but NHS boards ere allowed to determine what as included within each category. he methodology that emergency epartments use to define patient lows therefore differs. This means hat attendances included in flow 1 at ne emergency department might be ecorded as a flow 2 elsewhere. There
Exhibit 8Triage category by emergency departmentThe triage category of patients attending emergency departments in Scotland varies, but not all patients are triaged.1
Notes: 1. The most commonly used scale in Scotland is the Manchester Triage Scale, which consists of five categories that have an indicative time in which a patient should be seen. The five categories are immediate resuscitation (patient should be seen immediately), very urgent (patient should be seen within ten minutes), urgent (patient should be seen within one hour), standard (patient should be seen within two hours) and non-urgent (patient should be seen within four hours). 2. Patients classified as not triaged may also include patients receiving a ‘see and treat’ service.
Source: Audit Scotland fieldwork, 2009
Immediate resuscitation
Very urgent
Urgent
Standard
Non-urgent
Not triaged
Percentage of patients
0 20 40 60 80 100
Hairmyres Hospital
Royal Aberdeen Children's Hospital
Dumfries and Galloway Royal Infirmary
Wishaw District General
Gilbert Bain
Victoria Hospital
Queen Margaret Hospital
Royal Hospital for Sick Children Edinburgh
Raigmore Hospital
Stirling Royal Infirmary
Crosshouse Hospital
Inverclyde Royal Hospital
Dr Gray's Hospital, Elgin
St John's Hospital
Monklands District General
The Ayr Hospital
Borders General Hospital
Aberdeen Royal Infirmary
Royal Hospital for Sick Children Glasgow
Ninewells Hospital
Perth Royal Infirmary
Royal Infirmary of Edinburgh
Scotland

16
is also confusion around when to use flow 5. Currently these groupings are not helpful, particularly as flow 1 can cover a very broad range of conditions. There is a need for clarity about the use of flow categories from the Scottish Government and ISD Scotland.
32.Information on the types of conditions patients present with is patchy. Overall, emergency departments could not provide us with information on the types of conditions treated for around a third of all attendances. Where information was available, the broad category of trauma/injury/poisoning accounted for a quarter of total attendances in 2008/09.
Nearlyaquarterofpatientsattendinganemergencydepartmentareadmittedtohospital
33.Admission to hospital is not the only indicator of whether patients were appropriately referred to an emergency department. Over half of patients who go to an emergency department are diagnosed, treated and discharged. Nearly a quarter of patients attending emergency departments are admitted to a hospital ward or transferred to another hospital for further care.31 This compares to over 57 per cent of people discharged home and is similar to England where around 24 per cent of people are admitted or transferred. However, the rate of admission is higher in some hospitals in Scotland.
In eight emergency departments over 30 per cent of patients who attended were then admitted to hospital or transferred to another hospital for further care. This included Borders General Hospital and Crosshouse Hospital in NHS Ayrshire and Arran, where around two thirds of patients were either admitted or transferred. NHS boards should compare their admission and transfer rates and explore reasons for variation.
34.Over a fifth of patients who self-referred or were referred by 999 emergency services to the emergency department were admitted to hospital or transferred to another hospital for further care. Sixty per cent of patients brought in by the
Exhibit9Flow category Over half of patients are classed as having a minor injury or illness.
Source: Audit Scotland fieldwork, 2009
Flow 1 (minor injury or illness)
Flow 2 (acute assessment)
Flow 3 (medical admissions)
Flow 4 (surgical admissions)
Flow 5 (out of hospital care)
Percentage of patients
0 20 40 60 80 100
Crosshouse HospitalDr Gray's Hospital, ElginGlasgow Royal Infirmary
Western Infirmary GlasgowRoyal Infirmary of Edinburgh
Dumfries and Galloway Royal InfirmaryAberdeen Royal InfirmaryStobhill General HospitalBorders General Hospital
St John's Hospital, LivingstonVictoria Hospital
Royal Alexandra HospitalMonklands Hospital
The Ayr HospitalNinewells Hospital
Queen Margaret HospitalStirling Royal Infirmary
Southern General HospitalInverclyde Royal Hospital
Royal Hospital for Sick Children, GlasgowVictoria Infirmary
Hairmyres HospitalWishaw General Hospital
Perth Royal InfirmaryRoyal Hospital for Sick Children, Edinburgh
Royal Aberdeen Children's HospitalRaigmore Hospital
Galloway Community HospitalWestern Isles Hospital
Gilbert Bain HospitalScotland
31 Includes admission to emergency department ward, admission unit and admission to hospital ward.

Part 1. Emergency departments 17
ambulance service were admitted or transferred and 30 per cent of NHS 24’s referrals went on to be admitted or transferred (Exhibit 10). People referred by a GP are most likely to be admitted or transferred (62 per cent). This may suggest that GP referrals are more appropriate but patients may be referred appropriately to an emergency department for treatment rather than because they need to be admitted to hospital. There is significant variation in the percentage of GP referrals to emergency departments who are then admitted to hospital, ranging from 21 per cent at Perth Royal Infirmary in NHS Tayside to almost three quarters at Dumfries and Galloway Royal Infirmary.32 From current data it is not possible to determine whether higher admission rates reflect better patient care. Admitting patients directly to a ward may provide better care for patients and free up capacity in emergency departments in some areas, but NHS boards must carefully assess the potential impact of any changes in admission policies on their inpatient wards.
Thereisariskthatthefour-hourwaitingtimestandardisnotappliedappropriately
35.Six emergency departments use short-stay wards to monitor patients for up to 24 hours before they are formally admitted to hospital or discharged home. Patients admitted to the short-stay ward are those who are assessed as needing only a brief period of assessment or treatment and are recorded as inpatients. Patients in these areas are not covered by the four-hour waiting time standard, except for patients in Ninewells Hospital in NHS Tayside and the Ayr Hospital in NHS Ayrshire and Arran.33 We found little difference in average performance against the waiting time standard between those departments with short-stay wards and those without.
36.Six emergency departments have an observation unit or clinical decision unit. These are dedicated areas for patients who need short term treatment or observation. The four-hour waiting time standard does not apply to these patients. Patients admitted to these units are usually recorded as inpatients, therefore it is not possible to show the extent to which these units reduce emergency inpatient admissions. We found no difference in the percentage of hospital admissions between hospitals with these units and those without; however, NHS Ayrshire and
Arran estimates it has reduced the number of inpatient bed days by around 6,000 days per year through establishing a clinical decision unit.
37.Most hospitals have a medical and/or surgical or combined assessment unit known as an acute medical unit. These units are not part of the emergency department and patients in these beds are not subject to the four-hour waiting time standard, so they should be admitted to hospital and counted in the hospital data as an inpatient. If this does not happen, then there is a risk that patients are
Exhibit10Summary of discharge from emergency departmentsThe percentage of people who are admitted to hospital varies depending on how they are referred to an emergency department.
Note: Admission to hospital includes admissions to any ward in the hospital excluding the emergency department ward or assessment unit. This exhibit includes 27 emergency departments; NHS Lothian were unable to provide data in a comparable format for their three sites.
Source: Audit Scotland fieldwork, 2009
Residence Admission to emergency department ward
Admission to assessment unit
Admission to hospital
Transfer to another NHS healthcare provider
Private healthcare provider
Death Other Not known
0
20
40
60
80
100
Not
kno
wn
Oth
er
Min
or in
jurie
s un
it
NH
S 24
Out
-of-h
ours
ser
vice
s
GP
Self-
refe
rral
and
999
com
bine
d
Perc
enta
ge
Referral source
32 Sixteen per cent of patients referred by GPs to the emergency department at Royal Alexandra Hospital in NHS Greater Glasgow and Clyde were admitted to the hospital; however, the discharge destination of 44 per cent of patients who were referred by their GP was classed as other.
33 Only patients in the short-stay ward while awaiting admission to another specialty bed at the Ayr Hospital are included in the four-hour waiting time standard. In Ninewells Hospital, the four-hour standard applies from registration on the ward to arrival in a bed on the ward.
18
discharged from the emergency department and therefore no longer covered by the four-hour standard, but are also not counted as an inpatient. Patients waiting on trolleys or chairs within these units are covered by the four-hour standard. There is some confusion over the different status of short-stay wards, observation units, clinical decision units and assessment units and there is a risk that the four-hour waiting time standard is not applied appropriately.
38. The number of emergency admissions to hospitals has steadily increased over the last 20 years, rising to 523,846 in 2008/09.
39. The Scottish Government has set a HEAT target that by 2010/11, NHS boards will reduce emergency inpatient bed days for people aged 65 and over by ten per cent compared to 2004/05.34 The number of people admitted as an emergency directly from emergency departments increased by five per cent between 2007/08 and 2008/09; however, not all emergency departments could provide this trend information. The number of multiple emergency admissions (more than three a year) also rose by 35 per cent, from 23,293 in 1999/00 to 31,419 in 2008/09. We noted in our recent overview of the NHS that the trend is rising rather than reducing.35
Emergency departments face significant workforce pressures
40. We collected data on the emergency department workforce as national data are not available. Around
a quarter of staff are doctors and 63 per cent are nurses.36 In 2008/09, overall medical and nursing staffing costs accounted for 65 per cent of total emergency department costs.37 Staff cost per case varies across mainland departments from £35 at Inverclyde Hospital in NHS Greater Glasgow and Clyde to £95 at Stirling Royal Infirmary in NHS Forth Valley.38
41. The level of staffing at emergency departments and the mix of different professional groups employed varies across Scotland (Exhibit 11). There is limited evidence of the impact of different staffing levels and skill mix on the efficiency of services. Around 80 per cent of departments have not evaluated the effect of skill mix on clinical decision-making, such as examining whether the grade of staff has an impact on what happens to patients. However, where this has been examined it appears that having more senior doctors on duty reduces the number of patients who are admitted to hospital. Ninewells Hospital in NHS Tayside found that where a senior doctor assessed patients there were almost 12 per cent fewer inpatient admissions and just over 21 per cent fewer admissions to the acute medical assessment unit. The review also found that patients were less likely to be inappropriately discharged.39
42. The number of consultants working in emergency departments per mainland NHS board population varies from 0.89 whole time equivalent (WTE) per 100,000 population in NHS Borders, to 2.97 WTE in NHS Lanarkshire.
We found variation in activity per staff member across emergency departments. The average number of attendances per WTE member of medical or nursing staff in post varies from 535.4 in the Royal Hospital for Sick Children in Glasgow and 586.8 in Raigmore Hospital, to 1,100.6 in St John’s Hospital, Livingston and 1,109.8 in the Royal Alexandra Hospital (Exhibit 12, page 20).40, 41
43. Emergency departments are busiest on Mondays, particularly around midday. This pattern is the same in England. Attendances on Mondays on average range from 26 per day at the Western Isles Hospital to 322 per day at the Royal Infirmary of Edinburgh. We analysed staff rotas and at most points during the day, staffing is matched with attendances although attendances peak between midday and four in the afternoon while staffing peaks between four and eight in the afternoon (Exhibit 13, page 21).42
44. The role of nurses within the emergency department has changed in recent years and emergency nurse practitioners (ENPs) are employed by almost all departments.43 Not all emergency departments record information on the number of patients that ENPs treat, but report that some have the authority to discharge and refer patients with minor illnesses or injuries and four emergency departments allow ENPs to discharge and refer patients with major illness or injury.
34 HEAT is the national performance framework for the NHS which includes indicators relating to Health improvement for the people of Scotland; Efficiency and governance improvements; Access to services, and Treatment appropriate to individuals.
35 Overview of the NHS in Scotland’s performance 2008/09, Audit Scotland, December 2009.36 The remainder relates to other staff such as managerial staff. Data as at September 2009 and collected as part of Audit Scotland fieldwork. 37 Audit Scotland fieldwork, 2009.38 This includes costs for an assessment unit. Medical and nursing staff cost per case was also £95 at Royal Hospital for Sick Children, Glasgow; however, this
includes staffing costs for an assessment unit.39 Impact of senior clinical review on patient disposition from the emergency department, AL White, PAR Armstrong and S Thakore, April 2010.40 In some NHS boards staff rotate between emergency department sites and staffing could not be apportioned to a specific emergency department.
Consequently figures for the Queen Margaret Hospital and the Victoria Hospital, both in NHS Fife, are combined, as are those for the Aberdeen Royal Infirmary and the Royal Aberdeen Children’s Hospital, both in NHS Grampian, and Ninewells Hospital and Perth Royal Infirmary, both in NHS Tayside.
41 Medical staffing at the Royal Hospital for Sick Children, Glasgow includes staffing for an assessment unit. 42 Based on information from 29 sites. Galloway Community Hospital was not asked to provide this information.43 The Royal Aberdeen Children’s Hospital in NHS Grampian reported they had no ENPs in post as at 30 September 2009.

Part 1. Emergency departments 19
45.Medical staffing in emergency departments has increased by two per cent from 422 WTE in September 2007 to 431 in September 2009.44 The nursing workforce increased by eight per cent from 1,100 WTE to 1,185 WTE over the same period.45 Despite these increases, the European Working Time Directive (EWTD) and the consultant contract have reduced the number of available working hours
for medical staff. Over half of staff we surveyed said that a lack of middle grade doctors (doctors who have completed initial training, and are in higher grade training posts) was having a major impact on their department. NHS boards also report workforce challenges due to Modernising Medical Careers and the EWTD, for example difficulties in recruiting suitably qualified staff and maintaining
a flexible medical rota. NHS Fife took the decision to downgrade the emergency department at the Victoria Hospital to a minor injuries unit between 5pm and 8am for one week in May and in July due to shortages in junior doctors in the medicine specialty and a lack of medical locum cover. At 30 September 2009, there were 13.1 vacant consultant posts in emergency departments in Scotland.
Exhibit11Emergency department staffingThere is variation in how emergency departments are staffed across Scotland.
Notes: 1. Staffing shown as at 30 September 2009. 2. Nurses includes registered and unregistered nurses and excludes emergency nurse practitioners. 3. Emergency nurse practitioner data for NHS Greater Glasgow and Clyde relate to ENPs who have either completed or are nearing completion of ENP training. They do not reflect numbers of staff currently deployed to work as ENPs. 4. Some sites have been unable to split staffing figures as staff may work across more than one site within the NHS board, so data in NHS Fife, NHS Grampian and NHS Tayside are presented to reflect this.
Source: Audit Scotland fieldwork, 2009
Medical staff Emergency nurse practitioners
Nurses
Percentage of total staff
0 20 40 60 80 100
Gilbert BainBorders General HospitalStobhill General Hospital
The Ayr HospitalWestern Infirmary Glasgow
Glasgow Royal InfirmaryWishaw District General
Crosshouse HospitalStirling Royal Infirmary
Raigmore HospitalSouthern General Hospital
Victoria InfirmaryRoyal Hospital for Sick Children Glasgow
Dumfries and Galloway Royal InfirmaryInverclyde Royal Hospital
Royal Infirmary of EdinburghHairmyres Hospital
Monklands District GeneralQueen Margaret Hospital and Victoria Hospital
Dr Gray's Hospital, ElginAberdeen Royal Infirmary and Royal Aberdeen Children's Hospital
Galloway Community HospitalSt John's Hospital, Livingston
Ninewells Hospital and Perth Royal InfirmaryRoyal Alexandra Hospital
Royal Hospital for Sick Children EdinburghScotland
44 These figures exclude Monklands District General, Wishaw District General, Hairmyres Hospital and Royal Hospital for Sick Children, Edinburgh as these emergency departments were unable to provide medical staffing data for 2007.
45 These figures exclude Royal Hospital for Sick Children, Edinburgh as this emergency department was unable to provide nurse staffing data for 2007.

20
Exhibit12Average attendances per member of medical or nursing staffAverage attendances per member of medical or nursing staff vary across Scotland.
Notes: 1. Monklands District General, Wishaw District General, Hairmyres Hospital, The Royal Hospital for Sick Children in Edinburgh and The Western Isles Hospital are not included as they were unable to provide workforce data for 2008. 2. Some sites were unable to split staffing figures as staff may work across more than one emergency department within the NHS board, so data in NHS Fife, NHS Grampian and NHS Tayside are presented to reflect this.
Source: Audit Scotland fieldwork, 2009
0
200
400
600
800
1000
1200
Roya
l Hos
pita
l for
Sic
k Ch
ildre
n, G
lasg
ow
Raig
mor
e H
ospi
tal
Stirl
ing
Roya
l Inf
irmar
y
Dr G
ray'
s H
ospi
tal,
Elgi
n
Abe
rdee
n Ro
yal I
nfirm
ary
and
Roya
l Abe
rdee
n Ch
ildre
n's
Hos
pita
l
The
Ayr
Hos
pita
l
Nin
ewel
ls H
ospi
tal a
nd P
erth
Roy
al In
firm
ary
Gilb
ert B
ain
Hos
pita
l
Gal
low
ay C
omm
unity
Hos
pita
l
Dum
frie
s &
Gal
low
ay R
oyal
Infir
mar
y
Roya
l Inf
irmar
y of
Edi
nbur
gh
Cros
shou
se H
ospi
tal
Que
en M
arga
ret H
ospi
tal a
nd V
icto
ria H
ospi
tal
Stob
hill
Gen
eral
Hos
pita
l
Sout
hern
Gen
eral
Hos
pita
l
Gla
sgow
Roy
al In
firm
ary
Wes
tern
Infir
mar
y G
lasg
ow
Inve
rcly
de R
oyal
Hos
pita
l
Bord
ers
Gen
eral
Hos
pita
l
Vict
oria
Infir
mar
y
St J
ohn'
s H
ospi
tal
Roya
l Ale
xand
ra H
ospi
talAve
rage
num
ber
of a
tten
danc
es p
er m
embe
r of
med
ical
or
nurs
ing
staf
f 200
8/09
46.Although most emergency departments could not provide us with details of the number of temporary staff they had employed in 2008/09, they provided cost information. The overall spend on locum doctors and bank and agency nurses was £6.4 million in 2008/09, seven per cent of emergency departments’ total medical and nursing staff expenditure that year. Spending varied significantly across mainland emergency departments, from one per cent at Inverclyde Royal Hospital in NHS Greater Glasgow and Clyde to 27 per cent at Galloway Community Hospital. Our recent report Using locum doctors in hospitals gives further details on the efficient and safe use of locum doctors in hospitals.46 Other professional staff also work with emergency departments to provide care to patients, for example five emergency departments have dedicated social workers and two have psychologists.
47.Staff sickness levels in some emergency departments are high, adding to the pressure on workforce. However, many emergency departments were unable to provide sickness absence data.47 Sickness rates are higher for nursing staff than doctors.
48.There is a need for a strategic, Scotland-wide approach to emergency care as there are emerging staffing difficulties that cannot be resolved solely at a local level. NHS boards need central guidance on best practice to support their planning of clinical staffing
46 Using locum doctors in hospitals, Audit Scotland, June 2010.47 Seven out of 30 emergency departments did not provide sickness absence rates for nursing staff. 15 out of 30 sites did not provide sickness absence rates
for medical staff, including Gilbert Bain and Western Isles Hospital where there is no dedicated medical staffing in the emergency department. Inverclyde Royal Hospital and Royal Alexandra Hospital submitted sickness absence rates for medical and nursing staff combined.

Part 1. Emergency departments 21
in emergency departments. The College of Emergency Medicine has recommended staffing levels for emergency departments in England, but these are not easily applied to Scotland given the lower numbers of attendances and the rural geography.48
Patients leaving without treatment cost over £2 million each year
49. In 2008/09, two per cent (27,775) of people attending emergency departments left before receiving treatment.49 Of these, over 9,500 were brought to hospital by ambulance, at a cost of £2.3 million. The percentage of people leaving without treatment varies from 0.3 per cent at the Royal Hospital for Sick Children in Glasgow to five per cent at Glasgow Royal Infirmary.50
50. The cost of emergency departments has increased by nearly a quarter, from £120 million in 2006/07 to £148 million in 2008/09. The average cost per patient in 2008/09 was almost £102. Across the mainland boards, this ranged from £65 at the Victoria Infirmary in Glasgow to £165 at Stirling Royal Infirmary (Exhibit 14, overleaf).51 Information on the types of procedures and investigations carried out in emergency departments is not recorded consistently, therefore it is not possible to calculate how much of the difference in cost reflects the complexity of work (case-mix).52
Work is under way to improve data quality which is essential to help the service to improve
51. Progress has been made in improving the data on services provided by emergency departments. ISD Scotland set up the A&E data mart to monitor performance against the four-hour waiting time standard. However, the data are incomplete and different definitions are used, which limits their use. These issues need to be resolved so that NHS boards can use the data to identify potential improvements on an ongoing basis.
52. Across Scotland, emergency departments use a variety of information systems which creates problems in trying to compare data. The majority of NHS boards use the nationally procured Emergency Department Information System (EDIS) but six NHS boards use different systems. Some minor injuries units use manual systems to record patient information and those units with high levels of patient attendances should consider whether an electronic system would be more effective.
Exhibit 13Attendances at emergency departments and staffing rotasStaffing rotas are almost matched to activity.
Source: Audit Scotland fieldwork, 2009
Monday – attendances Saturday – attendances
Monday – staff headcount Saturday – staff headcount
0
10,000
20,000
30,000
40,000
50,000
60,000
70,000
04:00-08:0024:00-04:00
20:00-24:0016:00-20:00
12:00-16:0008:00-12:00
Num
ber
of E
D a
tten
danc
es
Staff headcount
Time
0
50
100
150
200
250
300
350
400
450
500
48 Emergency Medicine Consultants Workforce Recommendations, The College of Emergency Medicine, April 2010. The recommendations in this report are based on an average case mix of 15–20 per cent admissions and very few sites in Scotland fit this profile. The recommendations are also designed for larger sites. A smaller unit is referred to in the report as one with less than 40,000 attendances per year, but in Scotland there are a number of sites with less than 40,000 attendances.
49 This includes patients who left the emergency department before treatment had started, before treatment was completed, patients who refused treatment and also those who were removed by the police.
50 Data from NHS Lothian have been excluded as it was unable to provide data in a comparable format for each of its three sites. The cost has been calculated by multiplying the total number of patients who did not wait by the average cost per ambulance journey.
51 Audit Scotland fieldwork 2009. Costs include new, unplanned and planned attendances. Costs at Stirling Royal Infirmary include costs for an assessment unit.52 Emergency departments record flow as a measure of complexity of care but these categories are broad and do not help understand case-mix.

22
Exhibit14Costs per attendance by emergency department 2006/07–2008/091
Costs per attendance vary across Scotland.
Costs per attendance (£) Percentage change between 2007/08–2008/092006/07 2007/08 2008/09
Aberdeen Royal Infirmary and Royal Aberdeen Children's Hospital
102.25 120.31 126.45 5.1
Borders General Hospital 122.78 121.08 101.72 -16.0
Crosshouse Hospital 108.82 108.73 111.45 2.5
Dr Gray's, Elgin 90.82 124.55 131.61 5.7
Dumfries and Galloway Royal Infirmary 75.77 91.37 114.79 25.6
Galloway Community Hospital 75.94 99.35 97.46 -1.9
Gilbert Bain Hospital 155.73 168.78 202.70 20.1
Glasgow Royal Infirmary 77.90 80.34 88.24 9.8
Hairmyres Hospital 71.96 74.07 82.26 11.1
Inverclyde Royal Hospital 77.32 90.42 118.36 30.9
Monklands Hospital 71.21 70.99 77.97 9.8
Ninewells Hospital and Perth Royal Infirmary 84.49 94.91 97.73 3.0
Queen Margaret Hospital and Victoria Hospital 79.92 89.94 92.89 3.3
Raigmore Hospital 159.67 124.93 133.58 6.9
Royal Alexandra Hospital 75.90 95.12 82.83 -12.9
Royal Hospital for Sick Children, Edinburgh 95.82 117.54 118.72 1.0
Royal Hospital for Sick Children, Glasgow 115.82 99.96 120.94 21.0
Royal Infirmary of Edinburgh 72.39 105.19 104.59 -0.6
Southern General Hospital 85.39 83.86 79.95 -4.7
St John's Hospital, Livingston 96.78 83.76 100.92 20.5
Stirling Royal Infirmary 106.35 100.52 164.81 64.0
Stobhill General Hospital 60.83 70.79 76.93 8.7
The Ayr Hospital 109.67 123.33 130.67 6.0
Victoria Infirmary 65.79 70.75 65.38 -7.6
Western Infirmary, Glasgow 80.91 86.10 101.57 18.0
Western Isles Hospital 92.15 111.31 118.82 6.7
Wishaw General Hospital 70.61 76.54 80.28 4.9
Average 86.09 94.40 101.84 7.9
Note: 1. Hospitals in NHS Fife, NHS Grampian and NHS Tayside share staffing across sites within the board so we are not able to split staffing costs by hospital site. Costs per attendance for these hospitals are combined in the table. Costs include planned and unplanned attendances.
Source: Total accident and emergency specialty net costs, ISD Scotland Costs Book, 2008/09 and Audit Scotland fieldwork, 2009

Part 1. Emergency departments 23
Recommendations
The Scottish Government should:
• provide a clearer strategic direction for emergency care services in Scotland underpinned by a review of the services provided, workforce, attendance rates and how patients are recorded
• provide clarity about the role and definitions of services involved in delivering emergency care, including developing consistent national definitions of emergency departments and flow categories
• provide benchmarking information and guidance to help NHS boards with decisions about appropriate staffing levels and grade-mix.
The Scottish Government and NHS boards should:
• develop robust benchmarking data to ensure that available resources are being used effectively and ensure consistency in terminology and standards across services
• apply the ISD Scotland definition of self-referral consistently and consider whether it would be helpful to have an additional code to capture patients who self refer but have no prior contact with any healthcare professional
• review the benefits of the use of short-stay wards/observation units and work together to develop guidance on best working practice to inform how services should be configured.
NHS boards should:
• routinely review referrals and work with services to ensure that patients are seen and receive treatment in the most appropriate place
• examine the scope for GPs to refer emergency patients direct to the relevant admission unit in the hospital without first attending the emergency department
• accurately apply ISD Scotland data definitions
• work with ISD Scotland to explore variation in attendance rates and rates of admission
• review the effectiveness of holding planned clinics within the emergency department
• work with ISD Scotland to develop measures of case- mix to help with benchmarking services.

24
Part2.Waitingtimesandqualityofcare
Patient satisfaction with emergency care services is high and waiting times have improved. Information about the quality and clinical effectiveness of care provided is limited.
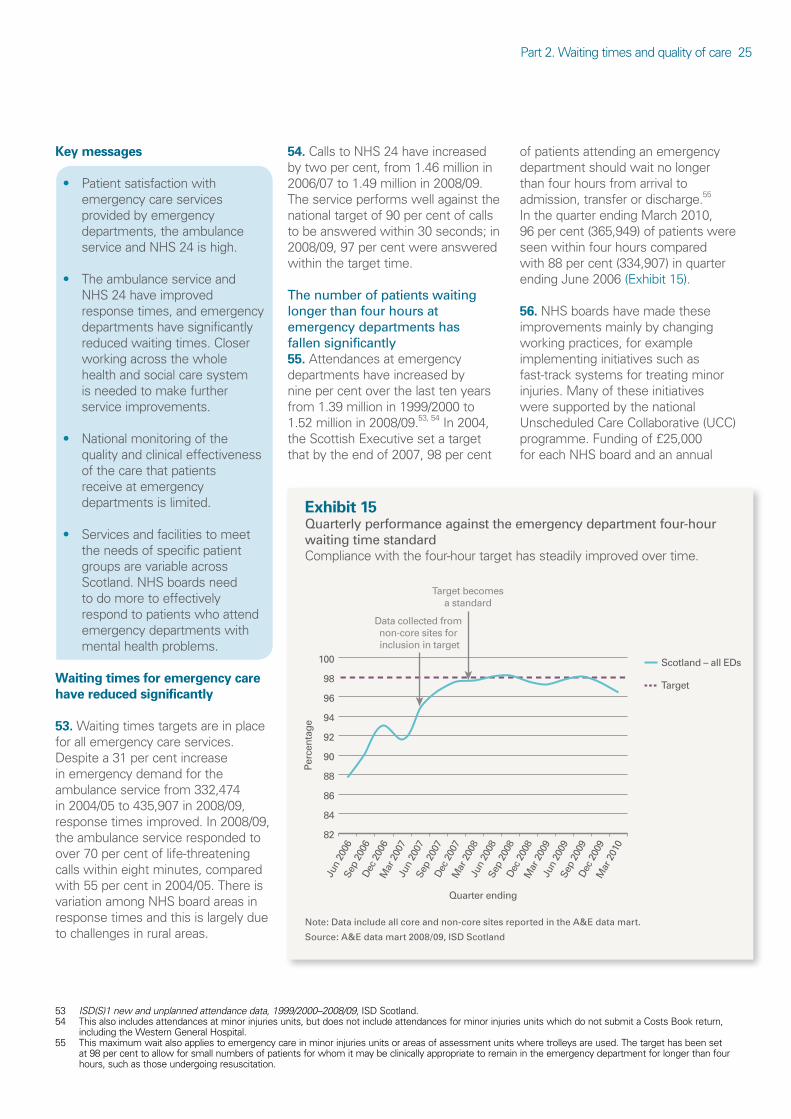
Part 2. Waiting times and quality of care 25
Keymessages
• Patient satisfaction with emergency care services provided by emergency departments, the ambulance service and NHS 24 is high.
• The ambulance service and NHS 24 have improved response times, and emergency departments have significantly reduced waiting times. Closer working across the whole health and social care system is needed to make further service improvements.
• National monitoring of the quality and clinical effectiveness of the care that patients receive at emergency departments is limited.
• Services and facilities to meet the needs of specific patient groups are variable across Scotland. NHS boards need to do more to effectively respond to patients who attend emergency departments with mental health problems.
Waitingtimesforemergencycarehavereducedsignificantly
53.Waiting times targets are in place for all emergency care services. Despite a 31 per cent increase in emergency demand for the ambulance service from 332,474 in 2004/05 to 435,907 in 2008/09, response times improved. In 2008/09, the ambulance service responded to over 70 per cent of life-threatening calls within eight minutes, compared with 55 per cent in 2004/05. There is variation among NHS board areas in response times and this is largely due to challenges in rural areas.
54.Calls to NHS 24 have increased by two per cent, from 1.46 million in 2006/07 to 1.49 million in 2008/09. The service performs well against the national target of 90 per cent of calls to be answered within 30 seconds; in 2008/09, 97 per cent were answered within the target time.
The number of patients waiting longer than four hours at emergency departments has fallen significantly55.Attendances at emergency departments have increased by nine per cent over the last ten years from 1.39 million in 1999/2000 to 1.52 million in 2008/09.53, 54 In 2004, the Scottish Executive set a target that by the end of 2007, 98 per cent
of patients attending an emergency department should wait no longer than four hours from arrival to admission, transfer or discharge.55 In the quarter ending March 2010, 96 per cent (365,949) of patients were seen within four hours compared with 88 per cent (334,907) in quarter ending June 2006 (Exhibit 15).
56.NHS boards have made these improvements mainly by changing working practices, for example implementing initiatives such as fast-track systems for treating minor injuries. Many of these initiatives were supported by the national Unscheduled Care Collaborative (UCC) programme. Funding of £25,000 for each NHS board and an annual
Exhibit15Quarterly performance against the emergency department four-hour waiting time standardCompliance with the four-hour target has steadily improved over time.
Note: Data include all core and non-core sites reported in the A&E data mart.
Source: A&E data mart 2008/09, ISD Scotland
Scotland – all EDs
Target
82
84
86
88
90
92
94
96
98
100
Perc
enta
ge
Quarter ending
Data collected from non-core sites for inclusion in target
Target becomesa standard
Mar
201
0
Dec
200
9
Sep
2009
Jun
2009
Mar
200
9
Dec
200
8
Sep
2008
Jun
2008
Mar
200
8
Dec
200
7
Sep
2007
Jun
2007
Mar
200
7
Dec
200
6
Sep
2006
Jun
2006
53 ISD(S)1 new and unplanned attendance data, 1999/2000–2008/09, ISD Scotland.54 This also includes attendances at minor injuries units, but does not include attendances for minor injuries units which do not submit a Costs Book return,
including the Western General Hospital. 55 This maximum wait also applies to emergency care in minor injuries units or areas of assessment units where trolleys are used. The target has been set
at 98 per cent to allow for small numbers of patients for whom it may be clinically appropriate to remain in the emergency department for longer than four hours, such as those undergoing resuscitation.

26
allocation of £1 million based on the former Arbuthnott formula was made available to NHS boards over the three-year programme.56 However, NHS boards have not sustained some of the progress made under the UCC approach since the UCC came to an end in 2007. The Scottish Government recently wrote to NHS boards to remind them to submit data to ISD Scotland, and to remind NHS boards when the four-hour waiting time standard applies.
57.It is difficult to directly compare performance against the four-hour waiting time standard in Scotland with other parts of the UK as there are differences in the way it is measured. The standard in Wales and Northern Ireland is 95 per cent of patients to be seen within four hours. In England, trolleyed areas of assessment units are not included in the standard but they are included in Scotland.
58.Until 2006, emergency department data in Scotland were collected through an annual national census which covered a three or seven-day period in April. This included an estimate of each hospital’s performance against the four-hour waiting time target. Since April 2006, ISD Scotland has collected data from core sites in the A&E data mart in order to report on the waiting time target. In July 2007, non-core sites were also included within the waiting time target.
Emergency departments face challenges in maintaining the waiting time standard59.Median waiting times for patients are increasing.57 Pressures are particularly evident during the winter period when the standard is often just missed. Almost half of the doctors and nurses we surveyed expressed concerns over the sustainability of the four-hour standard. Over 55 per cent of staff feel that patients
are sometimes inappropriately admitted to hospital to avoid breaching the standard, and over 70 per cent disagreed with the statement that ‘there are no trolley waits in the emergency department’.58
Delays in the emergency department reflect problems in joint working60.Based on information from 13 sites which could provide it, over 90 per cent of patients receive their first clinical assessment within two hours of arriving at the department. This ranges from 66 per cent in Queen Margaret Hospital, NHS Fife to 99 per cent at the Royal Aberdeen Children’s Hospital in NHS Grampian.
61.People waiting for treatment in emergency departments often reflects problems with the way that the wider health services work together to meet the needs of these patients. In 2008/09, 35,186 patients (two per cent of unplanned
attendances) waited longer than four hours.59 The three most common reasons for waiting were waiting for a bed, for assessment or for a specialist (Exhibit 16). The four-hour waiting time standard cannot be achieved by the emergency department alone but requires better bed management within the hospital and joined-up working with the ambulance service and social care services. Most staff we surveyed said patients are often delayed because of reasons outwith the control of the emergency department.
Patientswhoneedtobeadmittedortransferredwaitlonger
62.Certain patients, such as people who need to be admitted to hospital, are likely to wait longer in emergency departments than patients who are treated and discharged home. In 2008/09, almost six per cent of patients admitted to hospital and eight per cent of patients transferred
Exhibit16Reasons why patients wait over four hours in emergency departments, 2008/09The most likely reason for a patient waiting longer than four hours is waiting for an inpatient bed.
Note: Data relate to all emergency departments classified as core sites by ISD Scotland.
Source: A&E data mart 2008/09, ISD Scotland
Wait for bed
Wait for first assessment
Wait for specialist
Clinical reason(s)
Wait for initial emergency department treatment to be completed
Other reason
Wait for transport
Wait for diagnostics test(s) results
Not known
Wait for diagnostics test(s) to be performed
Wait for initial emergency department treatment to commence
Major incident
14%
19%
25%
11%
6%
6%
6%
6%4%
2% 1% 0%
56 The Arbuthnott formula was a means of allocating funding to NHS boards based on a number of socio-economic and population factors. It was replaced by a new formula in 2009/10.
57 Parliamentary question S3W-28836, The Scottish Parliament, 2009.58 A trolley wait occurs when a patient is waiting on a trolley to be assessed, waiting for transport or for admission to hospital.59 A&E data mart 2008/09, ISD Scotland.

Part 2. Waiting times and quality of care 27
to another hospital for further care waited longer than the four-hour standard compared with one per cent of patients who were discharged home. Patients waiting more than four hours and who need to be transferred is a particular concern at eight emergency departments. At each of these departments, less than 90 per cent of patients waiting to be transferred to another hospital are seen and transferred within four hours. This ranges from 71 per cent at Dumfries Royal Infirmary to 88 per cent at the Western Isles Hospital.60
63.Reducing the length of time patients stay in hospital and ensuring that patients ready to be discharged are moved quickly helps to reduce waiting times for patients who need to be admitted to hospital. The delayed discharge census in January 2010 showed that 606 patients in hospital beds were declared fit for discharge but were waiting for care elsewhere.61 This can cause delays in admitting emergency patients with the associated knock-on effect on emergency departments.
64.A lack of inpatient beds was raised as a concern by over two-thirds of the staff we surveyed. Acute inpatient beds across Scotland have reduced by six per cent from 18,456 in 2000 to 17,398 in 2009. However, we found as bed numbers increase, performance against the standard tends to get worse.62
65.In Scotland, over three per cent of patients were discharged home or admitted to hospital just before they were about to breach the four-hour waiting time standard (Exhibit 17). The figure in England is slightly higher.
66.It is not possible to tell from existing information whether patients are moved inappropriately to meet the
waiting time standard, but 70 per cent of doctors and nurses we surveyed disagree that there is always time for patients to be adequately assessed or stabilised before being discharged or moved.
Patientsatisfactionwithemergencycareislinkedtohowlongtheywait
67.Patients are generally very happy with the service from emergency departments, and over 80 per cent of respondents to our survey rated it as good or excellent. Respondents were happy with the information they were given, the time to discuss concerns with doctors and nurses and the degree of privacy while they received treatment.
68.There is a strong link between how long people wait at emergency departments and levels of satisfaction. Around 90 per cent of patients who had a total time in the department of under an hour rated the service as excellent or very good, compared with just under 80 per cent of those who spent over an hour in the department.
69.For those patients who contacted NHS 24, almost three in four people rated the service excellent or very good and only five per cent said the service was poor or very poor. Satisfaction with the ambulance service was also high; 86 per cent of respondents described the service from the ambulance crew as excellent or very good. Of those patients who travelled to an emergency department
Exhibit17Timing of patients discharged from emergency departments, 2008/09There is a slight peak in patients who are discharged or admitted just before the four-hour standard is breached.
Source: A&E data mart 2008/09, ISD Scotland
Other (including transferred) Number discharged
Number admitted
0
10,000
20,000
30,000
40,000
50,000
60,000
70,000
80,000
90,000
100,000
04:0
1 o
r ab
ove
03:5
1 to
04:
00
03:4
1 to
03:
50
03:3
1 to
03:
40
03:2
1 to
03:
30
03:1
1 to
03:
20
03:0
1 to
03:
10
02:5
1 to
03:
00
02:4
1 to
02:
50
02:3
1 to
02:
40
02:2
1 to
02:
30
02:1
1 to
02:
20
02:0
1 to
02:
10
01:5
1 to
02:
00
01:4
1 to
01:
50
01:3
1 to
01:
40
01:2
1 to
01:
30
01:1
1 to
01:
20
01:0
1 to
01:
10
00:5
1 to
01:
00
00:4
1 to
00:
50
00:3
1 to
00:
40
00:2
1 to
00:
30
00:1
1 to
00:
20
00:0
0 to
00:
10
Num
ber
of a
tten
danc
es
Duration in department (hours and minutes)
60 Other sites are Victoria Hospital, NHS Fife (73 per cent), the Western Infirmary, NHS Greater Glasgow and Clyde (82 per cent), Royal Alexandra Hospital, NHS Greater Glasgow and Clyde (82 per cent), Raigmore Hospital, NHS Highland (84 per cent), Hairmyres Hospital, NHS Lanarkshire (86 per cent) and Queen Margaret Hospital, NHS Fife (87 per cent).
61 ISD Scotland, 2010.62 Bed Statistics, ISD Scotland, 2009.

28
by ambulance, 86 per cent said the crew had explained their care and treatment well.
Supportforvulnerablegroupsisvariable
70.All emergency departments treat children and three are dedicated children’s emergency departments.63 Just under half of departments treat children in a separate area from adults.64 Seventy-three per cent of emergency departments have a child-friendly treatment area, for example with appropriate décor and toys.65 It is particularly important that emergency departments are child friendly as they may be the first point of contact for children who have suffered an injury or been abused. Although training and systems are in place, it is crucial that hospital staff share information with partner agencies to ensure any risk is acted upon. All emergency departments reported that they have procedures in place to help identify children at risk and staff receive training on child protection.
71.Two-thirds of departments have agreed procedures in place to identify vulnerable adults, but staff at a third of departments have not received any training to deal with vulnerable adults.66, 67 Emergency departments are a key point of contact for many people with mental health problems and NHS boards must do more to meet the needs of patients with mental health problems. In 2008/09, around 15,000 patients who attended emergency departments had a primary diagnosis relating to psychiatry. Only
three departments provided data on mental health service response times to the department and only Ninewells Hospital in NHS Tayside has carried out an audit of mental health response times recently. Our Overview of mental health services report noted that ambulance service and emergency department staff are being trained in suicide prevention but that a focus group of people with mental health problems felt that non-specialist staff did not always understand how best to deal with their problems.68
72.A number of research studies have highlighted the impact of alcohol misuse on emergency departments. In 2008/09, 12,393 patients received an alcohol and/or substance misuse primary diagnosis. In one year, from November 2008 to October 2009, the ambulance service dealt with 21,948 alcohol-related incidents, 69 per cent of which involved taking people to a hospital. As with mental health, the real figure will be much higher. For example, a patient presenting with an alcohol-related injury will be coded initially as injury/trauma. A recent audit conducted by the ambulance service found that 68 per cent of immediately life-threatening calls in city centres at the weekend are alcohol-related.
73.There is evidence that the number of children presenting at emergency departments under the influence of alcohol has increased in recent years. Centrally held data are not available but some NHS boards have carried out more detailed work to understand the current position. NHS QIS found
that alcohol was a contributory factor in nearly two per cent of all attendances by young people and 0.5 per cent of all emergency department attendances.69 The number and rate of inpatient alcohol-related discharges for children aged under 15 has been steady in recent years at a standardised rate of around 40 per 100,000 population. The rate for 15 to 19-year-olds is considerably higher, at 501 per 100,000 population in 2008/09, and has been increasing in recent years. This follows the national trend where inpatient alcohol-related discharges have been increasing.70 From July 2010, NHS boards can submit data to ISD Scotland stating whether alcohol was a factor in any attendances at emergency departments where this is recorded locally.
74.Facilities for people with a disability are also variable. While all departments reported they are accessible by wheelchair users, only seven of the 30 emergency departments audit facilities for disabled people and none of them involve people with a disability in the audit. Only 63 per cent have signs that are suitable for patients or visitors with a visual impairment, and 73 per cent have hearing loops in place but only around 60 per cent of departments with hearing loops regularly test them. Half of departments have information for patients in an easy-to-read format suitable for people with learning disabilities.
63 Defined as people aged under 16.64 Friendly healthcare environments for children and young people, NHS Estates, 2004, gives greater detail on designing a child-friendly environment. Care
must always be taken to ensure that designs are suitable for all users including children and people with disabilities. Planning teams should consider providing a separate children’s emergency department facility for all departments with over 70,000 attendances per year. Reference should be made to the Emergency Care Framework for Children and Young People, Scottish Executive, 2006.
65 Aberdeen Royal Infirmary treats children over the age of 14 and the Western Infirmary, Glasgow treats children over the age of 13 neither not responded to these questions.
66 A vulnerable adult is defined by the Scottish Government as someone who is ‘aged 18 years or over who is or may be in need of community care services for reasons of mental health or other disability, age or illness’ and ‘is or may be unable to take care of him or herself, or unable to protect him or herself against significant harm or exploitation’.
67 These calculations exclude emergency departments in children’s hospitals.68 Overview of mental health services, Audit Scotland, May 2009.69 Understanding alcohol misuse in Scotland. Harmful Drinking: Alcohol and young people, NHS Quality Improvement Scotland, February 2008. 70 Alcohol related statistics 2009/10, ISD Scotland.

Part 2. Waiting times and quality of care 29
75.Only half of emergency departments have information on the range of services available to the public in languages other than English.
Monitoringandreportingonthequalityofemergencycarearelimited
76.There is limited national reporting and benchmarking on the quality and clinical effectiveness of care provided at emergency departments. Total critical incidents and near misses increased from 1,475 in 2006/07 to
1,926 in 2008/09 but this may be due to better data recording.71 As a proxy measure of effectiveness of care, we looked at the number of unplanned patients returning to departments (excluding patients who had a planned appointment for follow-up treatment) within five days of their first attendance. Only ten departments could provide data, not enough to report on meaningful variation.72
77.The College of Emergency Medicine recommends treatment standards for conditions seen at
emergency departments, for example care standards for major trauma cases or administering pain relief. Seventeen per cent of emergency departments reported that they do not monitor against these standards and most others do not routinely monitor against all standards (Exhibit 18).73 Where these standards are monitored there is limited public reporting of the results. The Scottish Trauma Audit Group (STAG) is part of the ISD Scotland National Audit Team and conducts a range of audits within clinical priority areas. It is currently
Exhibit18NHS Dumfries and Galloway chest pain auditNHS Dumfies and Galloway have carried out monitoring against performance targets for chest pain recommended by the College of Emergency Medicine.
NHS Dumfries and Galloway conducted a chest pain audit in 2008 which was led by an emergency department consultant. Up to 30 per cent of medical admissions present with chest pain, most of whom come through the emergency department. The audit looked at how chest pain was managed in the emergency department at Dumfries and Galloway Royal Infirmary and attempted to monitor performance against targets recommended by the College of Emergency Medicine. The audit concluded that the emergency department was not meeting some of the recommended standards and that there was a lack of information available to accurately assess whether it was meeting the other standards.
Standard Target Dumfries and Galloway Royal Infirmary performance against target
Time taken from call for professional help to arrival at hospital
100 per cent in 30 minutes Information not available
Percentage of eligible patients receiving an electrocardiogram within 10 minutes of hospital arrival
90 per cent in 10 minutes Information not available
Percentage of eligible patients receiving thrombolysis within 30 minutes of hospital arrival
75 per cent in 30 minutes 57 per cent
Percentage of eligible patients receiving thrombolytic therapy within 60 minutes of calling for professional help
75 per cent in 60 minutes Information not available
Percentage of eligible patients who were given aspirin
90 per cent 84 per cent
Note: Thrombolysis is a treatment offered to patients who have an acute blood clot. A heart attack is caused by a clot in the coronary artery which supplies the heart. A heart attack can be treated with clot-dissolving drugs (thrombolytic therapy).
Source: Audit Scotland fieldwork, 2009
71 Audit Scotland fieldwork, 2009. Note that these data are largely under-reported, and hospitals were often unable to give annual breakdowns or systems were not able to differentiate between clinical and non-clinical incidents. Some hospitals were unable to separate out incidents relating to the emergency department.
72 The Healthcare Commission used this measure in a 2008 review of emergency and urgent care services.73 Gilbert Bain Hospital does not have dedicated medical staffing in the emergency department and is therefore excluded from this calculation.

30
conducting an audit of sepsis in emergency medicine and are due to publish their findings in November 2010.74
78.The Scottish Intercollegiate Guidelines Network (SIGN) recommends that patients with a hip fracture are transferred to a ward within two hours.75 In our Review of orthopaedic services report we noted that performance against this target reflects how well orthopaedic and emergency departments work together.76 In 2008, 28 per cent of patients with a hip fracture were moved from an emergency department to a ward within two hours. This ranged from three per cent in NHS Lothian to 54 per cent in NHS Fife. Sixty-five per cent of patients were transferred within three hours and 96 per cent within four hours.77
79.We asked staff about the impact of the four-hour standard on patient care and only 35 per cent of staff agreed that clinical care has improved since the introduction of the four-hour waiting time. NHS boards should ensure they have a system in place for monitoring outcomes for patients to ensure that the quality of care is maintained or improving.
80.The Scottish Government published The Quality Strategy in May 2010 which sets out the approach to quality in the NHS and the intention to develop 12 national Quality Outcome Measures including a measure on emergency admissions.78
Recommendations
The Scottish Government should:
• work with ISD Scotland and NHS QIS to develop formal measures to assess and monitor the quality and clinical effectiveness of care provided at emergency departments.
NHS boards should:
• work with the rest of the hospital and other services to further reduce delays at emergency departments, for example reviewing bed management arrangements and reducing length of stay
• ensure that appropriate facilities for children and vulnerable people are in place within emergency departments
• improve services for patients attending emergency departments with a mental health problem
• ensure that services at emergency departments meet the needs of patients with a disability.
74 Sepsis, or blood poisoning, is a life-threatening illness caused by the body overreacting to an infection.75 SIGN 56 Prevention and management of hip fracture in older people, Scottish Intercollegiate Guidelines Network, January 2002.76 Review of orthopaedic services, Audit Scotland, March 2010.77 Scottish Hip Fracture Audit report, ISD Scotland, 2008.78 The Quality Strategy, Scottish Government, May 2010.

31
Part3.Workingtogether
Closer working across the whole health and social care system is needed to make further service improvements.

32
Keymessages
• There is scope for emergency care services to improve how they manage demand. Not all emergency departments have a strategy in place to manage demand.
• There is a lack of comparable data on performance which means that the NHS cannot demonstrate that patients are cared for in the most appropriate setting while ensuring effective use of available resources.
• Attempts to reduce the number of people who attend emergency departments are not underpinned by evidence of what works or an assessment of the costs of different approaches.
Servicesmustworktogethermoreeffectivelytomanagedemand
81.Given the increasing demand for emergency department services and the current financial pressures facing the public sector, it is important that the NHS in Scotland is focused on managing services efficiently to make best use of available resources. There is much that the NHS can do to manage emergency services more efficiently. Forty per cent of emergency departments told us that they do not have a strategy to manage demand and most reported that partnership working could be improved (Exhibit 19).
82.In our survey, staff working in emergency departments expressed concern about inappropriate referrals from other services but not all departments monitor and feed back on inappropriate referrals. Just under 40 per cent of the doctors and nurses we surveyed had concerns about GP referrals in-hours, however, only seven departments regularly undertake an
audit of referrals from GPs and only three of those give feedback to the referring GP.
83.Only Stirling Royal Infirmary in NHS Forth Valley has a formal protocol with local care homes for attendances by their residents. Some NHS boards, such as NHS Tayside, have local agreements that nursing home staff should call a GP before dialling 999 for an ambulance, with the aim of reducing unnecessary journeys to the emergency department. Ninewells Hospital in NHS Tayside carried out an audit of emergency department referrals from care homes in 2009. Over a two-month period, on average, two referrals a day came from local care homes and nearly three-quarters were brought to the department by emergency ambulance. Almost half of the patients were discharged back to the care home and a further eight per cent were discharged with an outpatient appointment. An emergency department consultant reviewed the case notes for each patient and found that 41 per cent could have been seen by a GP or
district nurse or admitted directly to a ward. Of those patients who could have avoided going to the emergency department, nearly three-quarters were referred in the out-of-hours period.
84.There is a perception that NHS 24 is overly cautious and refers some patients unnecessarily to emergency departments. Over three-quarters of staff expressed concerns about referrals received from NHS 24. However, NHS 24 referrals account for less than four per cent of emergency department attendances. Only seven departments audit NHS 24 referrals and six feed back to NHS 24, despite there being a mechanism in place. NHS 24 routinely reviews referrals and has changed how its staff respond to patients where necessary.
85.Fewer staff expressed concerns about the appropriateness of ambulance service referrals, but only seven departments monitor these referrals and only five give feedback to the ambulance service.
Exhibit19Emergency department views on the effectiveness of partnership workingThere is scope to improve how well partners work together.
Source: Audit Scotland fieldwork, 2009
No positive effect
Not very effective
Scope to do more
Extremely effective
0
5
10
15
20
25
30
Other acute services
Out-of-hours services
NHS 24GPsAmbulance
Num
ber
of e
mer
genc
y de
part
men
ts
Service

Part 3. Working together 33
86.NHS boards, the ambulance service and NHS 24 must ensure that they work together to improve how they share information to meet patients’ needs. All emergency departments should have access to care plans and advance warning about any patients who are being brought to the department by ambulance, but the extent to which this happens across Scotland is variable. (Exhibit 20)
87.An Emergency Care Summary (ECS) aims to help clinicians treating patients who need urgent care. The ECS is used across Scotland and allows clinicians to view basic patient information to help diagnose and treat patients needing urgent care. We did not review the ECS as part of this audit.
Itisunclearhowemergencydepartmentattendanceswillbereduced
88.Most people who attend an emergency department decide to attend without first consulting another healthcare professional or are brought by ambulance. There is a perception among staff that a growing number of ‘inappropriate’ self-referrals are contributing to increasing demand at departments. While emergency departments may not be the most suitable place for some patients, the difficulty in defining such patients is reflected in various research. Recent work carried out by the Primary Care Foundation found that there is good evidence that the majority of patients choose the correct level of
care.79 It also highlighted there is a risk that educating patients not to use emergency departments will have a negative impact on some of the most vulnerable patients, who for cultural, personal or socio-economic reasons, turn to the emergency department for their care and will effectively be denied access to the health service.
89.Recent work commissioned by the Department of Health in England identified the percentage of patients attending emergency departments who could be more appropriately cared for in primary care as between ten and 30 per cent, compared with 60 per cent previously cited in England.80, 81
90.There is limited evidence that the NHS has explored real alternatives to emergency department attendances and assessed whether other services could accommodate additional activity and the cost of this work. Almost three-quarters of the staff we surveyed feel that a policy of redirecting patients who do not require treatment at an emergency department would be an effective way of reducing attendances. However, just under half of departments report that they have not investigated whether any patients could have been seen in a more suitable setting.
91.The Scottish Government has allocated £18,000 to each NHS board to undertake a patient education campaign to promote the best use of unscheduled care services, though there is limited evidence of the benefits of this work. It is not always easy for patients to make this decision themselves and choose the most appropriate service. There is also limited evidence to show that patient education on the use of emergency departments can change attendance patterns. Most patients we surveyed who attended an emergency department said they would do the
Exhibit20Information sharing across the NHSThere is scope to improve how partners share information to deliver better patient care.
Source: Audit Scotland fieldwork, 2009
Did not report any arrangements in place to share this information
In-hours only
Under development
24-hour access
0
5
10
15
20
25
30
Acc
ess
to in
form
atio
n on
inbo
und
ambu
lanc
es
Acc
ess
to p
lans
for
patie
nts
with
men
tal
hea
lth p
robl
ems
Acc
ess
to p
allia
tive
car
e pl
ans
Acc
ess
to c
are
plan
s
for p
atie
nts
with
long
-term
con
ditio
ns
Num
ber
of e
mer
genc
y de
part
men
ts
79 Primary Care and Emergency Departments, Primary Care Foundation, March 2010.80 Ibid.81 Healthcare for London: A Framework for Action, Professor Darzi, July 2007.

34
same again if faced with the same situation. This does not mean that patient education initiatives are not effective but NHS boards need to be cautious about the extent to which they will actually reduce attendances.
92.We asked patients who went straight to an emergency department their reasons for doing this.82 Urgency was the most commonly cited reason for self-referral with almost half saying that this was the main reason. Only 13 per cent of people said that the main reason for attending an emergency department was that it was more convenient than other services. Few people said that they attended an emergency department as there were no other services that they could access – seven per cent cited a lack of GP availability; and three per cent were not aware of any alternative NHS services. Further details of our patient survey can be found on our website.
93.NHS Grampian, in partnership with the Scottish Government, has developed a pilot social marketing campaign based around the Choose Well campaign, which was developed in England to promote the correct use of emergency care services.83 This work found that although patients believed they accessed NHS services appropriately, there were several barriers for patients:
• a lack of transport
• lack of access to other services (not enough staff or limited appointment times)
• a lack of knowledge about where to go and in what circumstances.
Alternativestoemergencydepartmentshavenotbeenthoroughlyevaluated
94.To support shifting care from acute hospitals to community care, the Scottish Government set a HEAT target for NHS boards to achieve reductions in the rates of attendances at emergency departments over the period 2007/08 to 2010/11. The Scottish Government expected that emergency department attendances would decrease as better provision and use of primary care services, better preventative and continuous care in the home, and improved self-care was put in place. Since the target was set, demand rose by three per cent from the month ending March 2008 to March 2010.
95.NHS boards submitted local targets to the Scottish Government in February 2009. These set out how boards would work towards delivery of the 2010/11 HEAT target. In April 2010, the Scottish Government extended the deadline as the work that NHS boards had done to underpin the local targets was less than expected. The Scottish Government and NHS boards are currently revising these targets which are now to be delivered as part of the HEAT targets for 2011/12. The local targets will not be published until November 2010.
96.Initial local targets gave baselines and planned reductions in numbers but did not give details of the number of patients who could be seen elsewhere and the settings to which this activity could be shifted. There was also limited analysis of whether other services have resources to handle this shift, although the Scottish Government Emergency Access Delivery Team had asked boards to do this work in January 2009. Some NHS boards did give examples of how they
were to achieve the reductions, for example through links with long-term condition pathways and focusing on preventing emergency admissions.
97.There is limited quantitative evidence about which patients NHS boards can divert to other services and whether these services have the capacity to cope with these patients. There is also little evidence of any economic benefit of treating patients elsewhere.84 Currently just over half of emergency departments report that they have a policy for dealing with patients who do not need to be seen in an emergency department.
98.Ambulance service staff have a greater role now in treating patients, which helps to reduce pressure on other services. In 2008/09, almost 50,000 patients were treated at the scene, almost ten per cent of all emergency calls. An additional 168,802 calls were stopped at the Emergency Medical Dispatch Centre. There are other ambulance service initiatives aimed at helping to reduce the number of people being transferred to hospital, such as ‘see and treat’ during the out-of-hours period. This involves a paramedic and an Emergency Care Practitioner nurse working together as a team attending 999 calls and out-of-hours home visits. There is scope to develop these models to help support acute hospitals to manage demand.
99.Over 70 per cent of emergency departments are co-located with a primary care out-of-hours centre, and around 60 per cent have an agreed or written protocol for referrals between the emergency department and primary care out-of-hours services.85 This aims to make sure that patients are referred to the most appropriate service. Most departments cannot provide detail of how many patients they have directed to other services.86
82 We asked for factors that contributed to their decision and also their main reason for attending an emergency department.83 Developed by Knowles Trust in 2007.84 Work carried out in 1996 found cases could be more economically dealt with by GPs. Cost effectiveness of treating primary care patients in accident and
emergency: a comparison between general practitioners, senior house officers, and registrars, J Dale, H Lang, J A Roberts, J Green and E Glucksman, British Medical Journal; 311: 1996.
85 At Raigmore Hospital there is no agreed/written protocol between the emergency department and primary care out-of-hours centre; however, during certain periods, the same members of staff will attend to patients presenting to both the emergency department and the primary care out-of-hours centre.
86 Data on this are being collected from June 2010.
Part 3. Working together 35
Given gaps in the data it is difficult to see how departments can routinely identify and refer patients to other services and understand the impact that this would have on their capacity to treat these patients (Case study 2).
100.We found no relationship between emergency departments that are co-located with out-of-hours centres and the average number of attendances at emergency departments or the percentage of
attendances referred by out-of-hours services. However, data recording issues are likely to affect the association. The National Audit Office highlighted the importances of the integration of out-of-hours services with emergency departments.87 This helps ensure that patients needing non-urgent care rather than emergency care could be treated more effectively by the out-of-hours service and reduces demand on emergency departments. NHS Borders has co-located its out-of-hours services with the emergency department. This involves having a GP from the out-of-hours service working within the emergency department between ten in the morning and six at night. GPs have developed additional skills in emergency medicine and are able to act as a senior medical presence when the emergency department consultant is not available. On a monthly basis the emergency department GP sees around a quarter of all attendances.
101.There are 59 nurse or GP-led minor injuries sites across 11 NHS boards.88 These units provide treatment to just under 200,000 patients a year for less serious injuries, such as sprains, cuts and grazes. The work of these units and the staffing involved varies across Scotland. Overall, in 2008/09 minor injuries units across Scotland treated 181,942 patients. This varied from 159 patients in Moffat Community Hospital to 35,408 at the Western General Hospital, NHS Lothian.89 Almost all accept referrals directly from the ambulance service and in 2008/09, around 10,000 emergency patients were taken by ambulance to minor injuries sites across Scotland.90, 91 Over half of respondents to our staff survey said that the ambulance service and
Casestudy2Results of local audits examining scope to redirect patients from the emergency department NHS Tayside has a policy in place to redirect any patients who have experienced their symptoms for three days or more and patients attending with a minor illness or problem which would normally be treated by a GP. These patients are reviewed by a senior clinician but may be sent on to see their GP or redirected to out-of-hours services for treatment. In 2000, an audit was carried out at Ninewells Hospital over a two-month period and 179 patients were identified as fitting the criteria to be redirected. Around three-quarters of those patients attended the emergency department during the in-hours period.1 Eighty-two per cent attended with continuing symptoms and 73 per cent had experienced their symptoms for more than a week. The majority of patients (77 per cent) were advised to see their GP and, of those, just under half went to see their GP. Twenty-three patients were seen in the emergency department but only one patient was admitted to hospital for further care.2
NHS Lothian is conducting a pilot study at the Royal Infirmary of Edinburgh to assess whether patients attending the emergency department could be treated in primary care. The study involves having a GP co-located within the emergency department, Monday to Friday between midday and 6pm. Ten conditions have been identified as being suitable for primary care treatment. Patients attending with one or more of the ten conditions are seen by the GP. During the first two months of the project, December 2009 to February 2010, 191 patients were seen (four per cent of all emergency department attendances). This ranged from one patient to nine patients a day. Latest data for May 2010 show that referrals have increased to just over five per cent of all emergency department attendances. The study is still in progress but initial findings suggest that only small numbers of patients attending the emergency department could be seen by a GP.
Notes:1. In-hours is defined as Monday to Friday from eight in the morning to six at night.2. A study of patients redirected from an Accident and Emergency Department, McGugan & Morrison, Scot Med J 2000;45:144-147.
Source: Audit Scotland fieldwork, 2009
87 The provision of our out-of-hours care in England, NAO, May 2006.88 No minor injuries unit in NHS Shetland and NHS Orkney. The minor injuries unit at Stobhill Hospital in NHS Greater Glasgow and Clyde opened in 2009;
however, data in this report relate to 2007/08 and 2008/09.89 Data for attendances at minor injuries units are new and unplanned attendances only.90 Audit Scotland fieldwork, 2009. The ambulance service data show small numbers are also taken to the five minor injuries units who reported they do not
accept referrals from the ambulance service.91 This covers the minor injuries units that were part of our audit only.

36
NHS 24 should refer more patients to minor injuries units. There may be potential for more patients to be referred and we did not look in detail at the efficiency of these units. However, there is significant variation in the services available at these sites. This makes it challenging for the ambulance service to know where best to take patients depending on their condition and for NHS 24 to know where to refer patients.
102.Over 1,000 patients across Scotland attended emergency departments more than ten times in 2008/09, but just over half of emergency departments monitor these patients to help improve the care they receive. Scottish Patients at Risk of Readmission and Admission (SPARRA) is a risk prediction tool, developed by ISD Scotland to identify patients at greatest risk of emergency inpatient admission. Only 16 hospitals with emergency departments use SPARRA routinely and NHS boards have highlighted concerns that SPARRA data are out-of-date.
Recommendations
The Scottish Government should:
• evaluate the impact of alternatives to emergency departments on other services in terms of cost, activity, capacity and quality of care, and ensure that good practice is shared.
The Scottish Government and NHS boards should:
• ensure clear guidelines are available to partner services and the public on the services provided at minor injuries units.
NHS boards, the ambulance service, NHS 24 and GPs should:
• identify the scope for referring patients to minor injuries units, using clinically appropriate guidelines
• ensure there is consistency across NHS boards in out-of-hospital care initiatives
• ensure systems are in place for tracking patients who frequently attend emergency departments and explore the opportunities to improve experience for these patients
• do more to understand locally the variation in referrals to emergency departments and review and feed back any concerns about referrals to partner services to help manage demand
• ensure that initiatives for reducing attendances at emergency departments are underpinned by evidence of their effectiveness and the impact on patient care, costs and the wider health and social care system.

37
Appendix1.Project advisory groupAudit Scotland would like to thank the members of the advisory group for their advice and support throughout the audit.
Member Organisation
Kevin Begbie Information Manager, Unscheduled Care Collaborative, NHS Greater Glasgow and Clyde
Dr David Bell GP, Aberdeen
Kathleen Bessos Deputy Director, Shifting the Balance of Care, Scottish Government
Dr George Crooks Medical Director, NHS 24 and Scottish Ambulance Service
Dr Jason Long Consultant in Emergency Medicine, Southern General Hospital, NHS Greater Glasgow and Clyde
Fiona MacKenzie Programme Principal, Unscheduled Care Information, ISD Scotland
Dr Bill Morrison Consultant in Emergency Medicine, Ninewells Hospital, NHS Tayside and Chair of the Scottish Board of the College of Emergency Medicine
Stephanie Philips Acting General Manager, Planning and Performance, Scottish Ambulance Service
Elizabeth Porterfield Head of Strategy and Planning Team, Healthcare Policy and Strategy Directorate, Healthcare Planning Division, Scottish Government
Note: Members of the project advisory group sat in an advisory capacity only. The content and conclusions of this report are the sole responsibility of Audit Scotland.
38
Appendix2.MethodologyWe looked at how well emergency services meet the needs of patients, whether best use is made of available resources, and how effectively services are working together to meet the needs of patients. This report focuses on emergency departments, but we have also examined the links with NHS 24, the ambulance service and general practice.
In this study we analysed available information on emergency healthcare activity and costs from a range of sources. Specifically the published information used is as follows:
Fbtit
•
•
•
•
• NHS Scotland Accident and Emergency Waiting Times, A&E data mart, ISD Scotland, 2010. This was used for:
– number of attendances at minor injuries units
– performance against the four-hour waiting time standard.
• Scottish Health Service Costs (SFR 5.3), ISD Scotland, 1999–2009. This was used for:
– total emergency department inpatient costs
– emergency department inpatient medical and nursing staff costs
– trends in emergency department attendances over time.
• Scottish Health Service Costs (SFR 5.7), ISD Scotland, 1999–2009. This was used for:
– total emergency department outpatient costs
– emergency department outpatient medical and nursing staff costs
– trends in emergency department attendances over time.
ourteen sites across eight NHS oards made amendments to he published ISD Scotland cost nformation during validation of he data.
Scottish Health Service Costs (R910), ISD Scotland, 2007–2009. This was used for:
– total cost of providing an accident and emergency ambulance service
– average cost per accident and emergency ambulance incident.
Hospital Profiles, ISD Scotland, 2009. This was used for:
– overall average staffed beds in the hospital.
Scottish GP Access Survey, Scottish Government, 2008/09. This was used for:
– ability to access GP services within two working days
– ability to book a GP appointment in advance.
Delayed Discharge Census, ISD Scotland, January 2010. This was used for:
– number of patients declared clinically ready for discharge from hospital and experiencing a delay.
• Parliamentary Question S3W-28836, The Scottish Parliament, 2009. This was used for:
– trends in median emergency department waiting times.
• Emergency Admissions Analysis on Admissions and Bed Days, ISD Scotland, March 2010. This was used for:
– numbers of emergency admissions over time.
• Multiple Emergency Admissions Analysis on Admissions and Bed Days, ISD Scotland, March 2010. This was used for:
– numbers of multiple emergency admissions over time.
In addition to this published information, we commissioned ISD Scotland to provide information on:
• emergency department arrivals and discharges by hour of the day and day of the week
• emergency department attendances by discharge type for ten-minute waiting time intervals
• reasons for waiting times in the emergency department of greater than four hours

39
• the number of discharges and the discharge destination from the emergency department in the final ten and 20 minutes of the four-hour target, compared to earlier discharges
• total hospital emergency admissions.
Where published information was unavailable, we directly collected information from 30 emergency departments across Scotland on:
• facilities available in the emergency department
• service set up
• performance information and monitoring
• IT systems and tele-medicine
• critical incidents and near misses
• patient complaints
• joint working and information sharing
• detailed breakdowns of emergency department activity1
• further breakdowns of emergency department waiting time information2
• workforce and cost information.3
Some emergency departments were unable to provide us with workforce information for specific staff groups for all years. This applied to nursing staff at Western Isles Hospital in NHS Western Isles in 2007, 2008 and
2009, and medical staff at Monklands District General, Wishaw District General and Hairmyres Hospital, in NHS Lanarkshire and the Royal Hospital for Sick Children, Edinburgh in 2007 and 2008.
In some emergency departments, staff work on a rotational basis with other emergency departments in the NHS board. In these circumstances emergency departments were not always able to apportion staff time to a specific emergency department. Consequently, Victoria Hospital and Queen Margaret Hospital in NHS Fife provided combined workforce and cost information, as did Aberdeen Royal Infirmary and the Royal Aberdeen Children’s Hospital in Grampian and Ninewells Hospital and Perth Royal Infirmary in NHS Tayside. We collected workforce information from 59 minor injuries units.
NHS Lothian were unable to provide us with discharge information for any of their three emergency departments (Edinburgh Royal Infirmary, St John’s Hospital and The Royal Hospital for Sick Children, Edinburgh) in a comparable format to other emergency departments.
The Scottish Ambulance Service provided us with information on:
• workload
• performance against response time targets
• referral sources into the ambulance service
• call transfer between the ambulance service and NHS 24
• the prevalence of alcohol- related incidents
• clinical outcome measures
• numbers of hospital attendances avoided by seeing and treating patients
• volume of inter-hospital transfers conducted by the ambulance service.
We also gathered information from NHS 24 on:
• total volume of calls
• performance against response time targets
• call dispositions (whether they passed the caller to another service)
• call transfer between NHS 24 and the ambulance service.
Four NHS boards were selected as sample boards where we conducted interviews with emergency department service managers to further our understanding. This sample (NHS Fife, NHS Grampian, NHS Greater Glasgow and Clyde and NHS Lothian) represents a mix in terms of size, emergency department attendances, rurality and performance against the four-hour waiting time target. We also interviewed staff at the ambulance service, NHS 24 and the Scottish Government.
We commissioned George Street Research to conduct a patient survey on our behalf. This involved a telephone survey with 1,208 adults
1 Gilbert Bain Hospital in NHS Shetland also provides a primary care out-of-hours service within the emergency department and the activity information submitted by Gilbert Bain also includes primary care out-of-hours activity.
2 Gilbert Bain Hospital in NHS Shetland also provides a primary care out-of-hours service within the emergency department which is covered by the four-hour waiting time standard.
3 Belford Hospital, Caithness General Hospital, Lorne and Islands District General Hospital, all NHS Highland, classed themselves as having an emergency department type service and submitted information on some questions as part of this audit. These departments do not have the systems in place to collect detailed activity data and have therefore been excluded from the Scotland figure in the report (with the exception of the total attendance and total cost of emergency department figures). Balfour Hospital in Orkney also has an emergency department type service but information systems were not in place until July 2009, so they were unable to submit detailed data and therefore have been excluded from the Scotland figure in the report (with the exception of the total attendance and total cost of emergency department figures). The Vale of Leven Hospital also submitted information as an emergency department, but as this is a nurse-led minor injuries unit open 12 hours a day, we have not included it as part of the main emergency department data set (with the exception of the total attendance and total cost of emergency department figures).

40
who had attended an emergency department either themselves or in their capacity as a carer for someone else, in the preceding 12 months. Our sample was stratified by NHS board to reflect patterns of emergency department usage across Scotland. More information about our patient survey is available on our website.
We conducted a postal survey of medical and emergency nurse practitioner staff at emergency departments across Scotland. Key contacts at each NHS board distributed questionnaires to staff and we received 180 completed responses. The response rate represents approximately 25 per cent of the medical and emergency nurse practitioner workforce in emergency departments in Scotland. More information on our staff survey is available on our website.

Appendix3.Self-assessment checklist for NHS boardsThe checklist on the next few pages sets out some of the high-level practical issues around emergency care services raised in this report. NHS boards should assess themselves against each statement and consider which statement most accurately reflects their current situation. This approach will enable boards to identify what actions need to be taken forward.
Issu
eA
sses
smen
t of c
urre
nt p
ositi
onC
omm
ents
No
– ac
tion
ne
eded
No
– bu
t ac
tion
in
hand
Yes
– in
pla
ce
but n
eeds
im
prov
ing
Yes
– in
pla
ce
and
wor
king
w
ell
Not
ap
plic
able
We
have
wor
ked
with
the
Scot
tish
Gov
ernm
ent t
o de
velo
p ro
bust
be
nchm
arki
ng d
ata
to e
nsur
e av
aila
ble
reso
urce
s ar
e be
ing
used
ef
fect
ivel
y an
d en
sure
con
sist
ency
in
term
inol
ogy
and
stan
dard
s
acro
ss s
ervi
ces.
We
accu
rate
ly a
pply
ISD
Sco
tland
em
erge
ncy
depa
rtm
ent d
ata
defin
ition
s, in
clud
ing
the
defin
ition
fo
r sel
f-ref
erra
l, an
d en
sure
that
st
aff a
re tr
aine
d an
d ap
ply
the
defin
ition
s ap
prop
riate
ly.
We
have
wor
ked
with
the
Scot
tish
Gov
ernm
ent t
o re
view
the
bene
fits
of th
e us
e of
sho
rt-s
tay
war
ds/
obse
rvat
ion
units
and
wor
ked
toge
ther
to d
evel
op g
uida
nce
on
best
wor
king
pra
ctic
e to
info
rm h
ow
serv
ices
sho
uld
be c
onfig
ured
.
We
have
exp
lore
d th
e sc
ope
for G
Ps
to re
fer e
mer
genc
y pa
tient
s di
rect
to
the
rele
vant
adm
issi
on u
nit i
n th
e ho
spita
l with
out fi
rst a
tten
ding
the
emer
genc
y de
part
men
t.
We
have
wor
ked
with
ISD
Sco
tland
to
exp
lore
var
iatio
n in
att
enda
nce
rate
s an
d ra
tes
of a
dmis
sion
.
We
have
revi
ewed
the
effe
ctiv
enes
s of
hol
ding
pla
nned
clin
ics
with
in th
e em
erge
ncy
depa
rtm
ent.
41

42Is
sue
Ass
essm
ent o
f cur
rent
pos
ition
Com
men
ts
No
– ac
tion
ne
eded
No
– bu
t ac
tion
in
hand
Yes
– in
pla
ce
but n
eeds
im
prov
ing
Yes
– in
pla
ce
and
wor
king
w
ell
Not
ap
plic
able
We
have
wor
ked
with
ISD
Sco
tland
to
dev
elop
mea
sure
s of
cas
e-m
ix to
he
lp w
ith b
ench
mar
king
ser
vice
s.
We
have
wor
ked
with
the
rest
of
the
hosp
ital a
nd o
ther
ser
vice
s to
fu
rthe
r red
uce
dela
ys a
t em
erge
ncy
depa
rtm
ents
, for
exa
mpl
e re
view
ing
bed
man
agem
ent a
rran
gem
ents
and
re
duci
ng le
ngth
of s
tay.
We
have
ens
ured
that
app
ropr
iate
fa
cilit
ies
for c
hild
ren
are
in p
lace
w
ithin
em
erge
ncy
depa
rtm
ents
.
We
have
impr
oved
ser
vice
s fo
r peo
ple
atte
ndin
g em
erge
ncy
depa
rtmen
ts
with
a m
enta
l hea
lth p
robl
em.
We
have
ens
ured
that
ser
vice
s at
em
erge
ncy
depa
rtm
ents
mee
t the
ne
eds
of p
atie
nts
with
a d
isab
ility.
We
have
wor
ked
with
the
Scot
tish
Gov
ernm
ent t
o en
sure
that
cle
ar
guid
elin
es a
re a
vaila
ble
to p
artn
er
serv
ices
and
the
publ
ic o
n th
e se
rvic
es p
rovi
ded
at m
inor
in
jurie
s un
its.
We
have
iden
tified
the
scop
e fo
r re
ferr
ing
patie
nts
to m
inor
in
jurie
s un
its, u
sing
clin
ical
ly
appr
opria
te g
uide
lines
.

43Is
sue
Ass
essm
ent o
f cur
rent
pos
ition
Com
men
ts
No
– ac
tion
ne
eded
No
– bu
t ac
tion
in
hand
Yes
– in
pla
ce
but n
eeds
im
prov
ing
Yes
– in
pla
ce
and
wor
king
w
ell
Not
ap
plic
able
We
have
wor
ked
with
oth
er b
oard
s to
ens
ure
ther
e is
con
sist
ency
in
our a
ppro
ach
to o
ut-o
f-hos
pita
l ca
re in
itiat
ives
.
We
ensu
re th
at s
yste
ms
are
in p
lace
fo
r tra
ckin
g pa
tient
s w
ho fr
eque
ntly
at
tend
em
erge
ncy
depa
rtm
ents
and
ex
plor
e th
e op
port
uniti
es to
impr
ove
the
expe
rienc
e fo
r the
se p
atie
nts.
We
have
car
ried
out w
ork
to
unde
rsta
nd lo
cal v
aria
tion
in re
ferr
als
to e
mer
genc
y de
part
men
ts a
nd
revi
ew a
nd fe
ed b
ack
any
conc
erns
ab
out r
efer
rals
to p
artn
er s
ervi
ces
to
help
man
age
dem
and.
We
ensu
re th
at in
itiat
ives
for
redu
cing
att
enda
nces
at e
mer
genc
y de
part
men
ts a
re u
nder
pinn
ed b
y ev
iden
ce o
f the
ir ef
fect
iven
ess
and
the
impa
ct o
n pa
tient
car
e, c
osts
an
d th
e w
ider
hea
lth a
nd s
ocia
l ca
re s
yste
m.

Emergency departmentsIf you require this publication in an alternative format and/or language, please contact us to discuss your needs.
You can also download this document at: www.audit-scotland.gov.uk
Audit Scotland, 110 George Street, Edinburgh EH2 4LHT: 0845 146 1010 E: [email protected]
ISBN 978 1 906752 95 8 AGS/2010/7
Printed on Revive 100 Uncoated, a Forest Stewardship Council (FSC) certified recycled grade containing 100% post consumer waste and manufactured at a mill certified with ISO 14001 environmental management standard. The pulp used in this product is bleached using an Elemental Chlorine Free process (ECF).