emergency department task group - central east...
TRANSCRIPT

Emergency Department Task Group
Presentation of Draft Final Report to CE LHIN Board
June 6, 2008

Presentation Overview
1. Provide a context for the report and recommendations
2. Describe the Emergency Department Task Group (ED Task Group) process
3. Identify main accomplishments
4. Outline recommendations
5. Introduce the implementation plan/process
6. Identify Next Steps

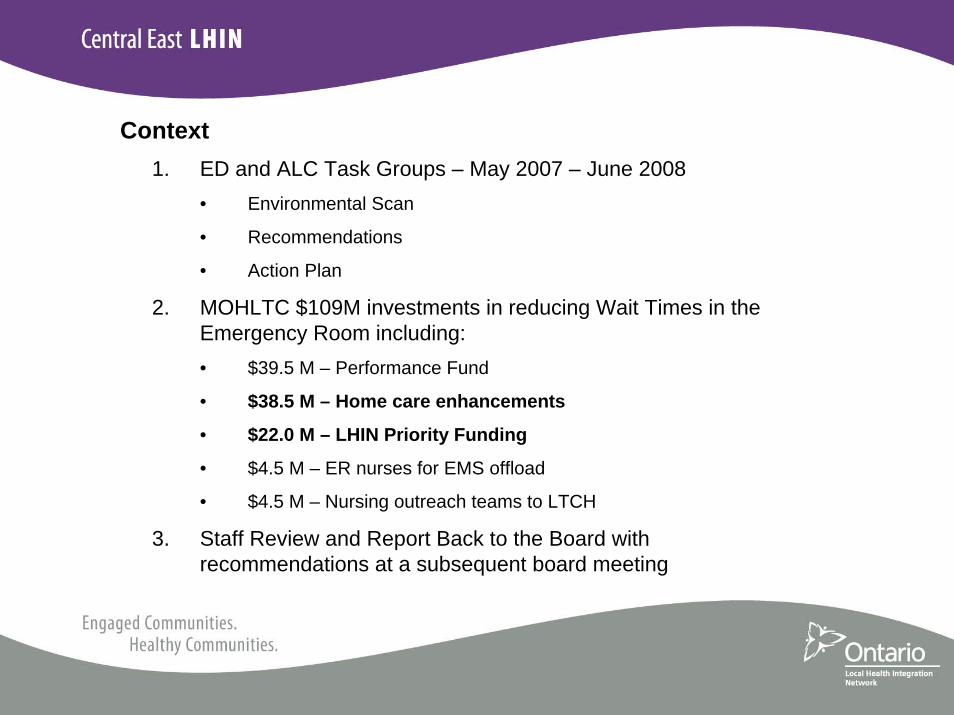
Context1. ED and ALC Task Groups – May 2007 – June 2008
• Environmental Scan
• Recommendations
• Action Plan
2. MOHLTC $109M investments in reducing Wait Times in the Emergency Room including:• $39.5 M – Performance Fund
• $38.5 M – Home care enhancements
• $22.0 M – LHIN Priority Funding
• $4.5 M – ER nurses for EMS offload
• $4.5 M – Nursing outreach teams to LTCH
3. Staff Review and Report Back to the Board with recommendations at a subsequent board meeting

Emergency Department Task Group :
• formed in spring 2007 by CE LHIN and Central East Executive Council (CEEC)
• a nominated group of multidisciplinary health care providers and management staff from health care facilities and services across the CE LHIN
• developed into a committed, dedicated, expert team
Introduction

ED Task Group Membership
Dr. Tom Stavro Sholdoff – RVHS - Chair
Debbie Watson – HHHS – Vice-Chair
Linda Bradshaw
Marion Tink – LHC
Mary Derks – NHH
Arden Eldridge – RVHS
Chris Jones – RVHS
Louise Leblanc – TSH
Dr. Kathy Chapman - RMH
Peter McIntyre – Toronto EMS
Paula Podolski – WMHC
Colleen Howson – PRHC
Dr. Christopher Jyu – TSH, RVHS
Ian Macdonald – Peterborough EMS
Jean Kish – Central East CCAC
Dr. Thomas Chan – TSH
Steve McNenly – Durham Region EMS

Emergency Department Task Group :
Mandate:
“… examine internal hospital practices and strategies that will improve Emergency Department efficiency and reduce wait times. This includes patient flow practices, physician resources, team approaches to patient care, access to diagnostic services, ambulance off-load times and on-call coverage.”
Mandate
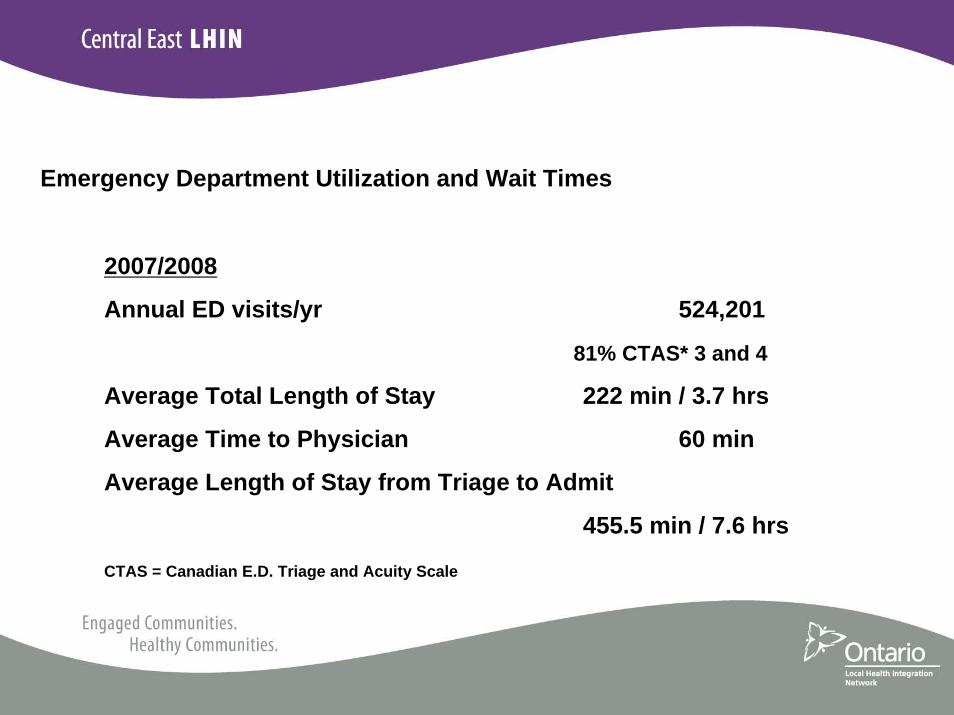
Emergency Department Utilization and Wait Times
2007/2008
Annual ED visits/yr 524,201
81% CTAS* 3 and 4
Average Total Length of Stay 222 min / 3.7 hrs
Average Time to Physician 60 min
Average Length of Stay from Triage to Admit
455.5 min / 7.6 hrs
CTAS = Canadian E.D. Triage and Acuity Scale

1. Seminal Documents/Reports
2. ED Process Map – identification of patient flow and barriers at each step for each hospital
3. Staff Consultation Survey – ED staff and administrators across the LHIN
4. Survey of CE LHIN Innovative and Best Practices
5. Environmental Scan - Utilization, Staffing and Wait Times
6. Planning Partner Consultations
Evidence-based Strategy – Information Sources:


• Improving Access to Emergency Services: A System Commitment. By the Hospital Emergency Department and Ambulance Effectiveness Working Group. Schwartz, B. 2005
• Improving Access to Emergency Care: Addressing System Issues, Report of the Physician Hospital Care Committee (PHCC), August 2006
• Core Service Role of Small Hospitals in Ontario Report, the Ontario Joint Policy and Planning Committee (JPPC) Multi-site/Small Hospitals Advisory Group, December 2006
• Emergency Room Wait Times Strategy, draft reports, 2008
• Emergency Department Reporting System (EDRS), October 2007-ongoing
1. Seminal Documents/Reports

• Created an ED patient flow map to identify key steps in a patient
journey “into, through and “out” of the ED for each CTAS level (1, 2-3,
4-5)
• Identified issues/barriers at each step in the process for each hospital
• Summarized similarities for all CE LHIN hospitals
• Identified ‘priority’ issues at each step
2. ED Process Map

Emergency Department Process Map
Ambulance
Transfer from other
Department
Walk-In
Delay (Of Load or Waiting Room)
Patient arrives in the Emergency
Department - triaged by RN
Assigned a room immediately
Seen by Nurse and Physician upon arrival at
ED Room
Admit or Transfer
Patient to be Admitted
Wait for Bed
Patient Admitted to
Floor
Patient transferred to
alternate facility
Patient to be Discharged Patient Home
Wait for Ambulance6
Patient to be transferred to
another facility
Medical Directives initiated to expedite
treatment
Wait to be seen
Patient seen by RN assigned in
ED room
Wait to be seen
Patient assessed by Physician
Wait for Treatment
Discharge Home
Yes
No
Wait for Discharge Planning
CTAS Level
CTAS 1
CTAS 2-51
2
34
5
53 4
6
6 78 9
7
8 9
10 11
12
13
10

Biweekly meetings were scheduled and hosted at each ED across the CE LHIN
Meetings to include:
1. Tour of each hospital’s ED
2. Completion of staff survey – comprised of three questions
• Host for each meeting approached hospital personnel - frontline staff, managers and administrators
• Respondents provided a diversity of views• Staff were assured of the confidentiality of their responses to
encourage the free exchange of ideas
3. Staff Consultation Survey

1. What is your most significant challenge/barrier that you face day-to-day?
2. What concerns would you like to see addressed by the ED Task Group on your behalf?
3. What keeps you working here in this ED? (Question for ED nursing and medical personnel)
3. (cont’d) Staff Consultation Survey
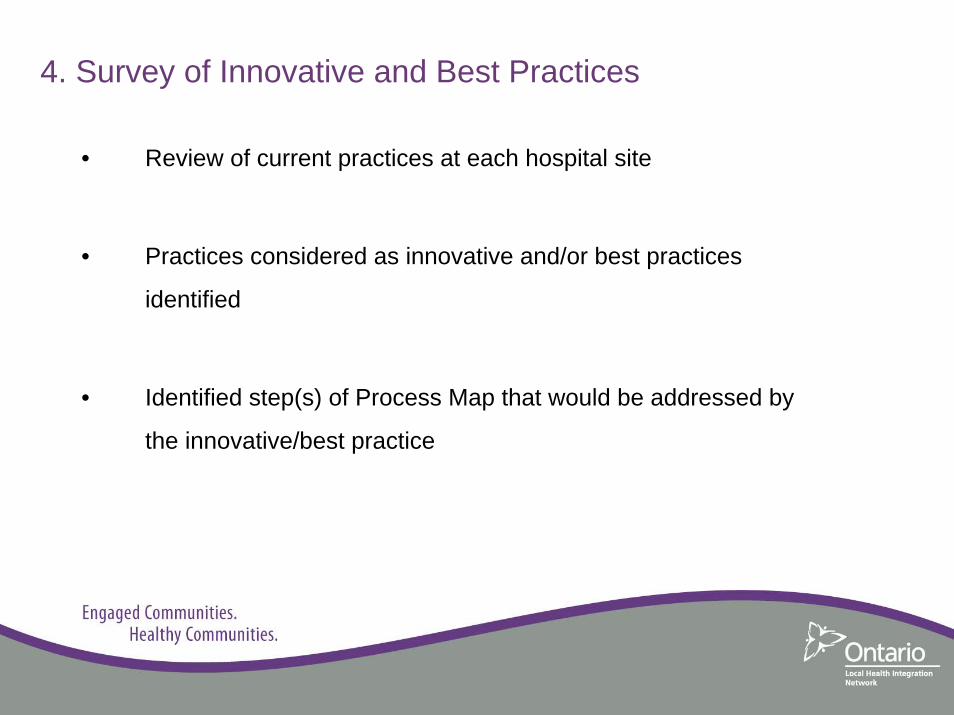
• Review of current practices at each hospital site
• Practices considered as innovative and/or best practices
identified
• Identified step(s) of Process Map that would be addressed by
the innovative/best practice
4. Survey of Innovative and Best Practices

Indicators include:
• # of beds by type
• Primary catchment area
• Annual visits by CTAS level
• Existence of fast track, rapid assessment, clinical decision unit, -ve pressure rooms,
overflow ED beds, CT, MRI, 24 hr lab and x-ray
• Staffing
– physicians, nurses, NPs, crisis team, GEM, CCAC case manager
• Wait Times – by CTAS
– length of stay, triage to admit, decision to admit, off load, time to physician
• Summarized for the CE LHIN
5. Utilization, Staffing and Wait Times

• Collaboratives
• Steering Committees
– MHA
– CDPM
– SCFS
– Ehealth
• Task Groups
– ALC
– Rehabilitation
6. Planning Partner Consultations

• timely and efficient transfer of patients to an appropriate service/facility
• development of a common referral process• patient flow blocks (e.g. offload delays)• need for qualified professional staff• access to diagnostics• long wait times to consultative services• staff safety and security• ongoing education of staff• ALC issues• access to mental health beds/services• role of/interface with primary care
Biggest Challenges….

Recommendations – interface?, cost implications? initiation timeframes, implementation
timeframes, link to Enabler, implementation lead(s)
5 Priority Areas 1. Patient Flow in ED (18)
• Standardization• Equipment/Diagnostics• Technology/Ehealth• Access• Bed Utilization
2. Staffing/HR (5)
3. Transportation Service (2)
4. Protected ED Budget (1)
5. Staff safety/security (2)

Implementation
5 Priority Projects
1. LEAN processes
2. Human Resources: Recruitment and Retention
3. Human Resources: Credentialing / Scheduling
4. Patient Transport
5. Safety / Security
Steering Committee
• Continuation of Task Group as a Steering Committee to oversee and drive implementation

Next Steps
• Publication of report
• Distribution at Symposium
• Staff recommendations to CE LHIN Board
• Implementation

Alternate Level of Care Task Group
Presentation of Draft Final Report to CE LHIN Board
June 6, 2008

Presentation Overview
1. Provide a context for the report and recommendations
2. Describe the Alternate Level of Care Task Group (ALC Task Group) process
3. Identify main accomplishments
4. Outline recommendations
5. Introduce the implementation plan/process
6. Identify Next Steps
Context1. ED and ALC Task Groups – May 2007 – June 2008
• Environmental Scan
• Recommendations
• Action Plan
2. MOHLTC $109M investments in reducing Wait Times in the Emergency Room including:• $39.5 M – Performance Fund
• $38.5 M – Home care enhancements
• $22.0 M – LHIN Priority Funding
• $4.5 M – ER nurses for EMS offload
• $4.5 M – Nursing outreach teams to LTCH
3. Staff Review and Report Back to the Board with recommendations at a subsequent board meeting

ALC Background
Definition:
An ALC patient is one that has finished the acute care phase of their treatment but remains in an acute care bed in hospital.
Classification process:1. patient's physician gives an order to change the level-of-care from acute
care2. requests a transfer for the patient3. patient then waits placement to an alternate setting
• Sometimes a patient is admitted as an ALC patient because alternate care is not available

Alternate Level of Care• A high number of ALC patient or patient days of stay may indicate
inefficient use of acute care beds or placement processes, lack of access to long-term or rehab care, and/or lack of community support services
• High rates of ALC increase emergency and surgical wait times
• ALC is a broad and complex issue which represents regional and system-level problems related to integration, capacity and patient flow efficiencies
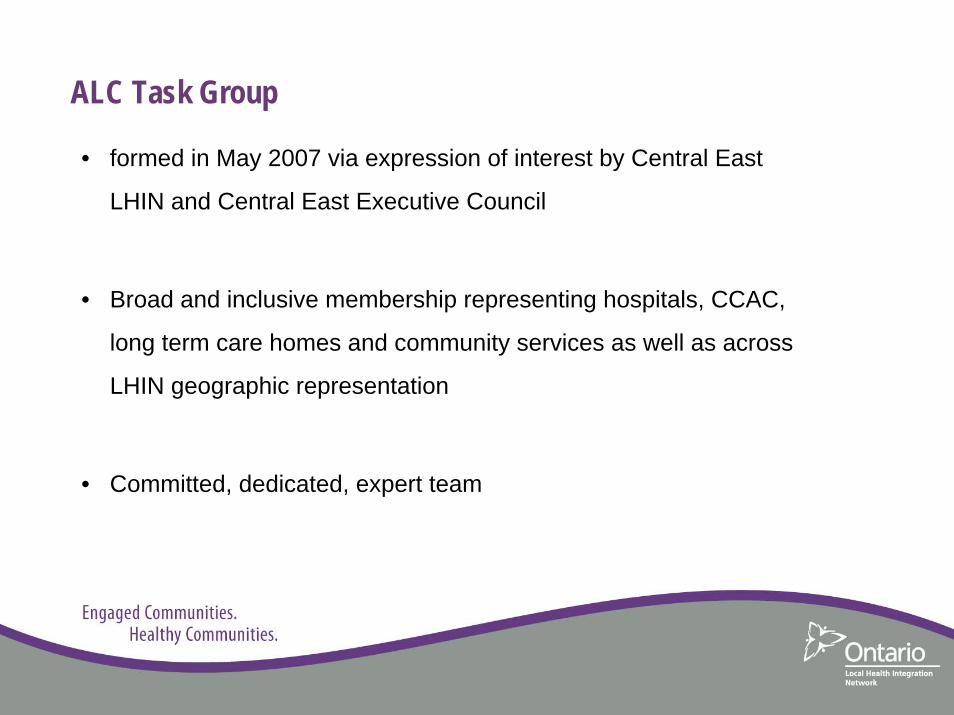
ALC Task Group
• formed in May 2007 via expression of interest by Central East
LHIN and Central East Executive Council
• Broad and inclusive membership representing hospitals, CCAC,
long term care homes and community services as well as across
LHIN geographic representation
• Committed, dedicated, expert team

ALC Task Group MembershipKaren Southwell - Lakeridge Health Corporation
Andrew Marsden - Central East LHIN
Craig McCleary - Canadian Red Cross
Shailesh Nadkarni - Peterborough Regional Health Centre
Sheila Neuburger - Whitby Mental Health Centre -Chair
Carol Smith Romeril - Ross Memorial Hospital
Lesreen Romain - Victorian Order of Nurses
Joni Wilson - St. Joseph’s At Fleming
Nancy Veloso - The Scarborough Hospital
Brian Laundry - Central East LHIN
Glyn Boatswain - Rouge Valley Health System –Vice Chair
Janet Burn - Northumberland Hills Hospital
Judy Byrdine - Admin SupportWhitby Mental Health Centre
Sharon Chapman-SheehanCentral East CCAC Peterborough
Marshall Elliott -Community Living Kawartha Lakes
Melanie Flood - Haliburton Highlands Health Services
Carol Gordon - Kawartha Participation Projects
Diane Southwell - Campbellford Memorial Hospital

Purpose
1) Conduct Environmental Scan:
To determine the underlying causes and contributing factors
to ALC issues in Central East, and
2) Develop Action Plan:
To recommend some practical ways that can be
implemented locally to help alleviate and/or eliminate the
ALC pressures in Central East.

Vision
We envision a proactive system approach to ensure
client/patient access to the right care at the right time and
the right place with the right resources.
Right Care, Right Place, Right Time
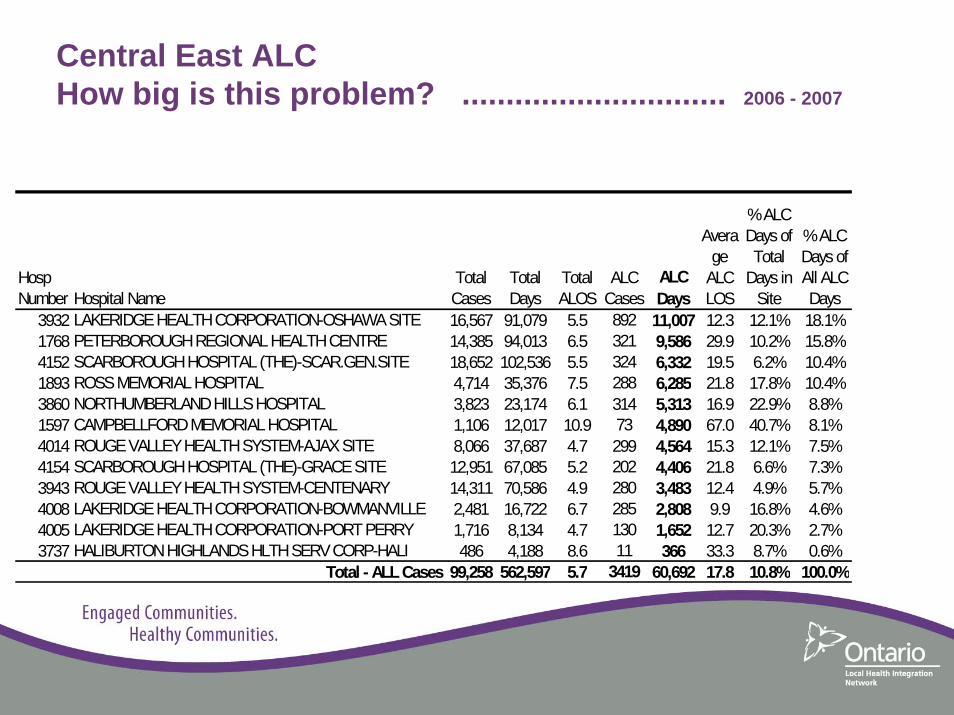
Hosp Number Hospital Name
Total Cases
Total Days
Total ALOS
ALC Cases
ALC Days
Average
ALC LOS
% ALC Days of Total
Days in Site
% ALC Days of All ALC Days
3932 LAKERIDGE HEALTH CORPORATION-OSHAWA SITE 16,567 91,079 5.5 892 11,007 12.3 12.1% 18.1%1768 PETERBOROUGH REGIONAL HEALTH CENTRE 14,385 94,013 6.5 321 9,586 29.9 10.2% 15.8%4152 SCARBOROUGH HOSPITAL (THE)-SCAR.GEN.SITE 18,652 102,536 5.5 324 6,332 19.5 6.2% 10.4%1893 ROSS MEMORIAL HOSPITAL 4,714 35,376 7.5 288 6,285 21.8 17.8% 10.4%3860 NORTHUMBERLAND HILLS HOSPITAL 3,823 23,174 6.1 314 5,313 16.9 22.9% 8.8%1597 CAMPBELLFORD MEMORIAL HOSPITAL 1,106 12,017 10.9 73 4,890 67.0 40.7% 8.1%4014 ROUGE VALLEY HEALTH SYSTEM-AJAX SITE 8,066 37,687 4.7 299 4,564 15.3 12.1% 7.5%4154 SCARBOROUGH HOSPITAL (THE)-GRACE SITE 12,951 67,085 5.2 202 4,406 21.8 6.6% 7.3%3943 ROUGE VALLEY HEALTH SYSTEM-CENTENARY 14,311 70,586 4.9 280 3,483 12.4 4.9% 5.7%4008 LAKERIDGE HEALTH CORPORATION-BOWMANVILLE 2,481 16,722 6.7 285 2,808 9.9 16.8% 4.6%4005 LAKERIDGE HEALTH CORPORATION-PORT PERRY 1,716 8,134 4.7 130 1,652 12.7 20.3% 2.7%3737 HALIBURTON HIGHLANDS HLTH SERV CORP-HALI 486 4,188 8.6 11 366 33.3 8.7% 0.6%
Total - ALL Cases 99,258 562,597 5.7 3419 60,692 17.8 10.8% 100.0%
Central East ALC How big is this problem? .............................. 2006 - 2007

Putting it another way …
The total number of ALC Days has increased from 40,845 in
Fiscal 2004-2005 to 60,692 as of year-end Fiscal 2006-2007.
60,692 ALC Bed Days = 166.3 Bed Equivalents
365 Days in a Year
OR
1 *Ross Memorial Hospital
(*167 Average Acute Beds Staffed and Operating)
Investigative Process• Review of seminal reports
• Received presentations re: various initiatives/projects – Flo Collaborative– CE CCAC services
• Process Map and identification of operational barriers for all hospitals as reported from the “front-lines”
• Collected ALC and socio-demographic data

Patient Flow Process Map
Recommendations
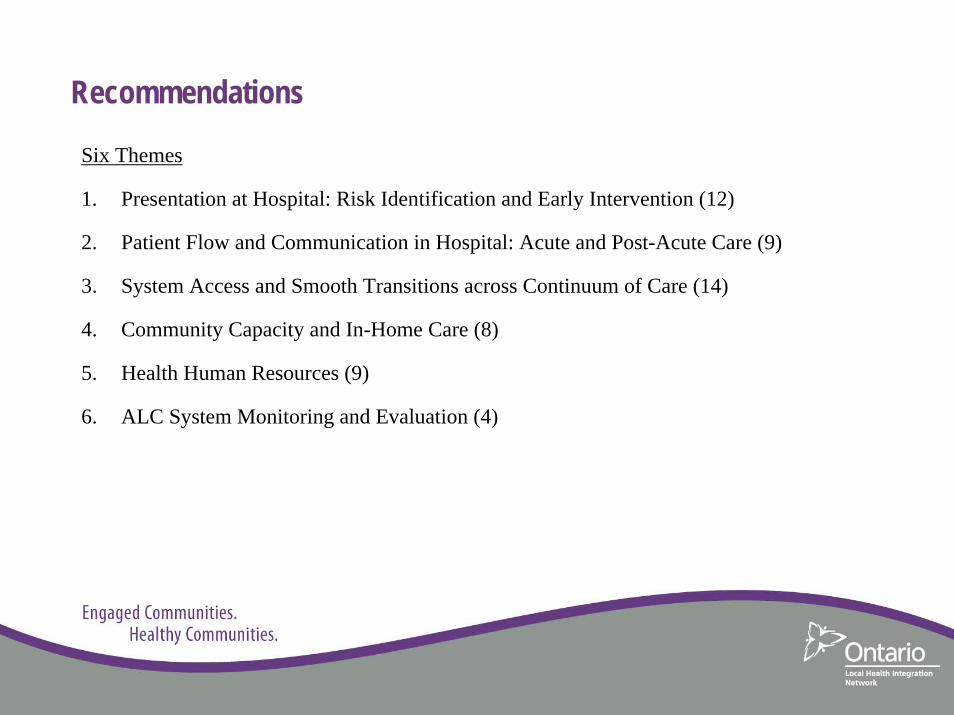
Six Themes
1. Presentation at Hospital: Risk Identification and Early Intervention (12)
2. Patient Flow and Communication in Hospital: Acute and Post-Acute Care (9)
3. System Access and Smooth Transitions across Continuum of Care (14)
4. Community Capacity and In-Home Care (8)
5. Health Human Resources (9)
6. ALC System Monitoring and Evaluation (4)

Implementation Priorities (condensed)1. Utilize standardized risk screening and assessment tools for the early identification 2. Provide specialized staff resources in each hospital Emergency Department 3. Implement a Central East LHIN standard policy framework 4. Expand definition and recognition of ALC beyond acute care bed spaces 5. Provide in-hospital activation/exercise program to maintain optimal functioning6. Increase the availability of housing by using retirement homes and/or supportive housing 7. Create Behavioural Support Unit(s) within LTCHs that include short-stay transitional beds 8. Implement enhanced/comprehensive community services discharge planning process 9. Increase community support services for in-home personal support, homemaking and
caregiver respite 10. Develop a Health Human Resource Strategy 11. Undertake a Research Study to determine the percentage of hospital patients waiting for a
LTCH placement that could be cared for elsewhere more appropriately12. Create a Central East LHIN Alternate Level of Care Implementation Committee 13. Extend CCAC service maximums

Next Steps
• Publication of report
• Distribution at Symposium
• Staff recommendations to CE LHIN Board
• Implementation