eme summer research internship program 2021
TRANSCRIPT
In March 2020, the COVID-19 pandemic broke out in the United States. Due to the considerable reduction of urban and air transportations and the decline in some commercial and architectural developments, the energy demand has decreased dramatically. This caused the price of natural gas to decline.
Background
• To investigate how companies within the Pennsylvania gas industry utilized their shut-in strategies in response to the negative impact of COVID.
• To compare the shut-in rate of all horizontal wells within the Pennsylvania gas industry by the top 5 companies from 2019 to 2020.
• To discover the internal shut-in decision made by the EQT company in 2020.• Locate the shut-in wells operated by the EQT company.• Compare the wells’ average daily production change before and after shut-
in.
Objectives
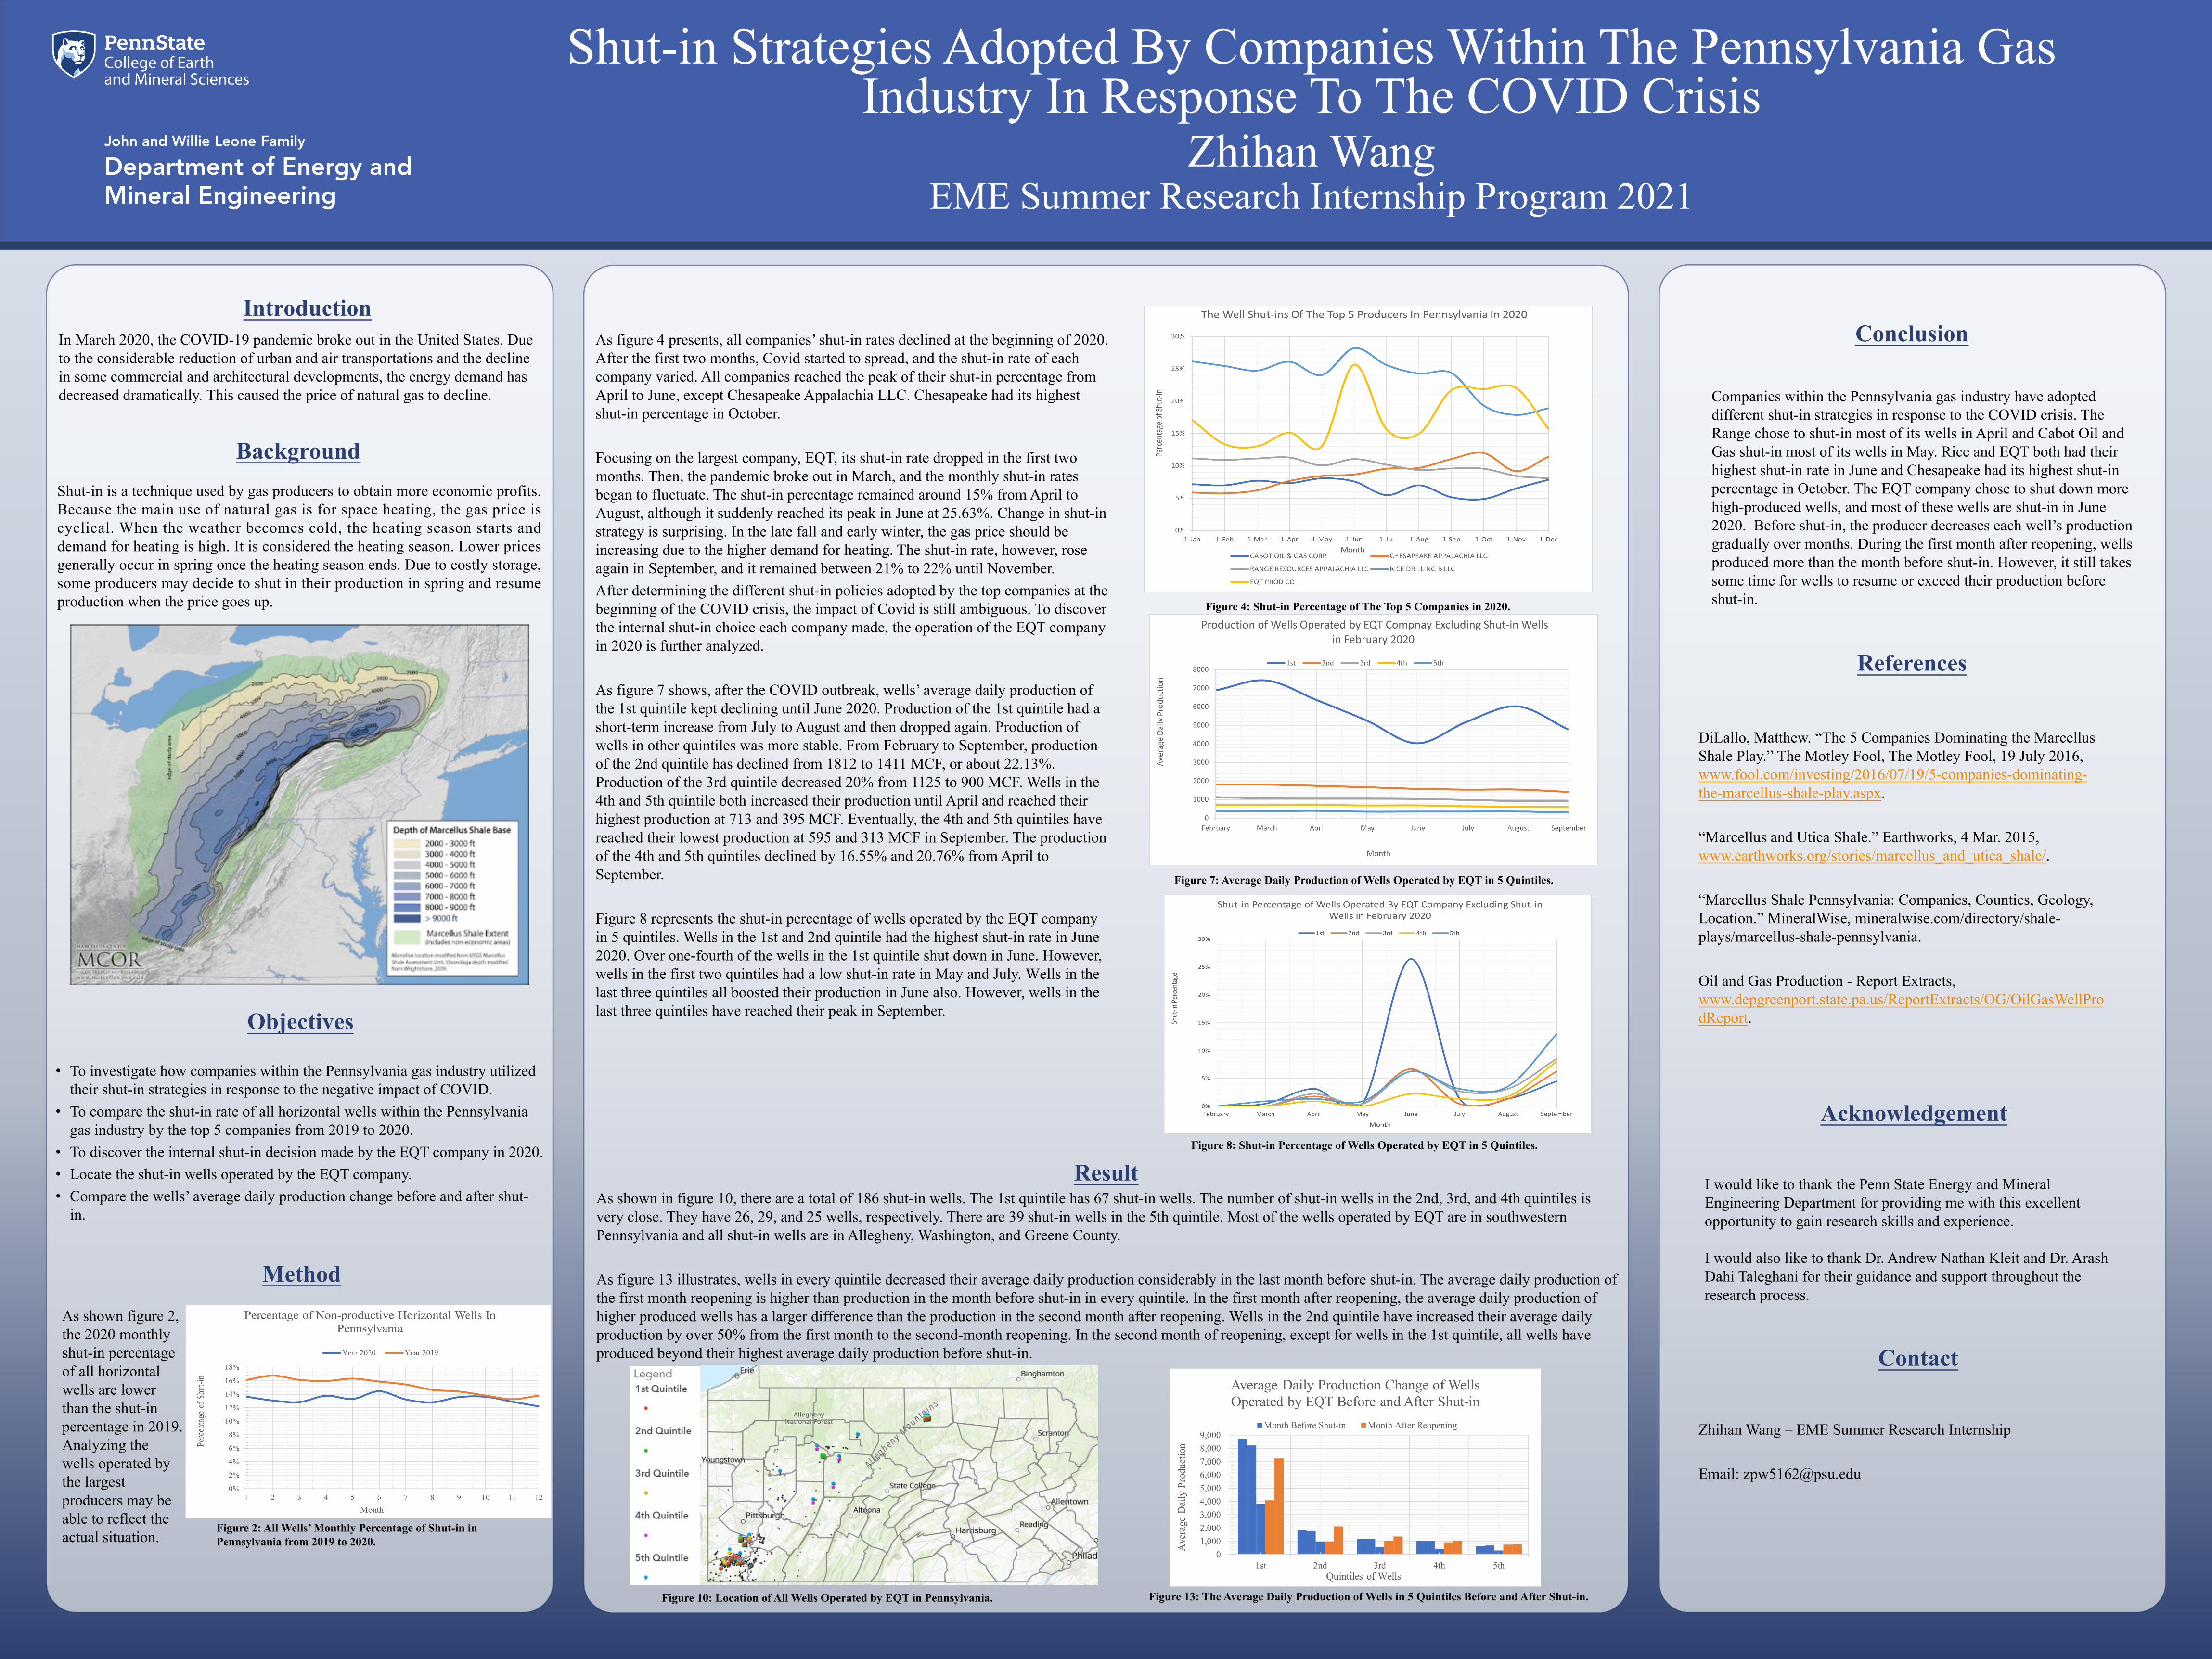
As figure 4 presents, all companies’ shut-in rates declined at the beginning of 2020. After the first two months, Covid started to spread, and the shut-in rate of each company varied. All companies reached the peak of their shut-in percentage from April to June, except Chesapeake Appalachia LLC. Chesapeake had its highest shut-in percentage in October.
Focusing on the largest company, EQT, its shut-in rate dropped in the first two months. Then, the pandemic broke out in March, and the monthly shut-in rates began to fluctuate. The shut-in percentage remained around 15% from April to August, although it suddenly reached its peak in June at 25.63%. Change in shut-in strategy is surprising. In the late fall and early winter, the gas price should be increasing due to the higher demand for heating. The shut-in rate, however, rose again in September, and it remained between 21% to 22% until November. After determining the different shut-in policies adopted by the top companies at the beginning of the COVID crisis, the impact of Covid is still ambiguous. To discover the internal shut-in choice each company made, the operation of the EQT company in 2020 is further analyzed.
As figure 7 shows, after the COVID outbreak, wells’ average daily production of the 1st quintile kept declining until June 2020. Production of the 1st quintile had a short-term increase from July to August and then dropped again. Production of wells in other quintiles was more stable. From February to September, production of the 2nd quintile has declined from 1812 to 1411 MCF, or about 22.13%. Production of the 3rd quintile decreased 20% from 1125 to 900 MCF. Wells in the 4th and 5th quintile both increased their production until April and reached their highest production at 713 and 395 MCF. Eventually, the 4th and 5th quintiles have reached their lowest production at 595 and 313 MCF in September. The production of the 4th and 5th quintiles declined by 16.55% and 20.76% from April to September.
Figure 8 represents the shut-in percentage of wells operated by the EQT company in 5 quintiles. Wells in the 1st and 2nd quintile had the highest shut-in rate in June 2020. Over one-fourth of the wells in the 1st quintile shut down in June. However, wells in the first two quintiles had a low shut-in rate in May and July. Wells in the last three quintiles all boosted their production in June also. However, wells in the last three quintiles have reached their peak in September.
Method
As shown in figure 10, there are a total of 186 shut-in wells. The 1st quintile has 67 shut-in wells. The number of shut-in wells in the 2nd, 3rd, and 4th quintiles is very close. They have 26, 29, and 25 wells, respectively. There are 39 shut-in wells in the 5th quintile. Most of the wells operated by EQT are in southwestern Pennsylvania and all shut-in wells are in Allegheny, Washington, and Greene County.
As figure 13 illustrates, wells in every quintile decreased their average daily production considerably in the last month before shut-in. The average daily production of the first month reopening is higher than production in the month before shut-in in every quintile. In the first month after reopening, the average daily production of higher produced wells has a larger difference than the production in the second month after reopening. Wells in the 2nd quintile have increased their average daily production by over 50% from the first month to the second-month reopening. In the second month of reopening, except for wells in the 1st quintile, all wells have produced beyond their highest average daily production before shut-in.
Result
Conclusion
Companies within the Pennsylvania gas industry have adopted different shut-in strategies in response to the COVID crisis. The Range chose to shut-in most of its wells in April and Cabot Oil and Gas shut-in most of its wells in May. Rice and EQT both had their highest shut-in rate in June and Chesapeake had its highest shut-in percentage in October. The EQT company chose to shut down more high-produced wells, and most of these wells are shut-in in June 2020. Before shut-in, the producer decreases each well’s production gradually over months. During the first month after reopening, wells produced more than the month before shut-in. However, it still takes some time for wells to resume or exceed their production before shut-in.
References
DiLallo, Matthew. “The 5 Companies Dominating the Marcellus Shale Play.” The Motley Fool, The Motley Fool, 19 July 2016, www.fool.com/investing/2016/07/19/5-companies-dominating-the-marcellus-shale-play.aspx. “Marcellus and Utica Shale.” Earthworks, 4 Mar. 2015, www.earthworks.org/stories/marcellus_and_utica_shale/. “Marcellus Shale Pennsylvania: Companies, Counties, Geology, Location.” MineralWise, mineralwise.com/directory/shale-plays/marcellus-shale-pennsylvania. Oil and Gas Production - Report Extracts, www.depgreenport.state.pa.us/ReportExtracts/OG/OilGasWellProdReport.
Contact
Zhihan Wang – EME Summer Research Internship
Email: [email protected]
EME Summer Research Internship Program 2021Zhihan Wang
Shut-in Strategies Adopted By Companies Within The Pennsylvania Gas Industry In Response To The COVID Crisis
Introduction
Shut-in is a technique used by gas producers to obtain more economic profits. Because the main use of natural gas is for space heating, the gas price is cyclical. When the weather becomes cold, the heating season starts and demand for heating is high. It is considered the heating season. Lower prices generally occur in spring once the heating season ends. Due to costly storage, some producers may decide to shut in their production in spring and resume production when the price goes up. Figure 4: Shut-in Percentage of The Top 5 Companies in 2020.
Figure 2: All Wells’ Monthly Percentage of Shut-in in Pennsylvania from 2019 to 2020.
Figure 7: Average Daily Production of Wells Operated by EQT in 5 Quintiles.
Figure 8: Shut-in Percentage of Wells Operated by EQT in 5 Quintiles.
Figure 13: The Average Daily Production of Wells in 5 Quintiles Before and After Shut-in.Figure 10: Location of All Wells Operated by EQT in Pennsylvania.
Acknowledgement
I would like to thank the Penn State Energy and Mineral Engineering Department for providing me with this excellent opportunity to gain research skills and experience.
I would also like to thank Dr. Andrew Nathan Kleit and Dr. Arash Dahi Taleghani for their guidance and support throughout the research process.
As shown figure 2, the 2020 monthly shut-in percentage of all horizontal wells are lower than the shut-in percentage in 2019. Analyzing the wells operated by the largest producers may be able to reflect the actual situation.