emc analysis of powerline systems
TRANSCRIPT

EMC ANALYSIS OF POWERLINE SYSTEMS
F I N A L R E P O R T
J U L Y 2 0 0 4
Markus Schneider
Patrick Favre Marcos Rubinstein

EMC ANALYSIS OF POWERLINE SYSTEMS JULY 2004
2
1 EXECUTIVE SUMMARY
The main goal of this project is to analyse: • The PLC (powerline communication) market
o Indoor o Outdoor (Access)
• The different standards • The technologies • The behaviour of the modems
PLC current situation:
• The Access PLC systems are not significantly present in Europe. This situation may be due to a strong penetration of the market by the ADSL and cable modem technologies.
• The Indoor PLC modem market is dominated by the Homeplug compliant devices. This standard has been established by a consortium of the biggest telecommunication companies. The HomePlug modem market is growing very quickly. Those modems can be bought in many stores in Switzerland.
• American standards (FCC part 15) are much more permissive than European Standards (EN55022)
• The performance of the HomePlug modems tested in the course of this project can be qualified as good.
The main conclusion of our report is that:
• HomePlug modems tested did not respect the EN55022 standard. • They are at least 25 dB above the specified limit for the HomePlug Frequency
band.

EMC ANALYSIS OF POWERLINE SYSTEMS JULY 2004
3
2 TABLE OF CONTENT
1 Executive summary...............................................................................................................2 2 Table of content ....................................................................................................................3 3 Introduction...........................................................................................................................5 4 Powerline modem market....................................................................................................6
4.1 Outdoor modems (Access) .............................................................................................7 4.2 Indoor modem (Home)...................................................................................................9
5 Modem hardware analysis................................................................................................. 11 6 Homeplug specification .................................................................................................... 12
6.1 Homeplug AV................................................................................................................ 12 6.2 Homeplug 1.0................................................................................................................. 12
6.2.1 Frequency band................................................................................................ 12 6.2.2 The tranceiver:.................................................................................................. 14 6.2.3 Transmission mode ......................................................................................... 15 6.2.4 Physical frame structure.................................................................................. 15
7 Standards ............................................................................................................................. 16 7.1 FCC (USA) ..................................................................................................................... 16
7.1.1 Limits ................................................................................................................. 16 7.1.2 Measurement setup.......................................................................................... 17
7.2 EN 55022 (Europe) ...................................................................................................... 18 7.2.1 Limits ................................................................................................................. 18 7.2.2 Measurement setup.......................................................................................... 19
7.3 NB30 (Germany) ........................................................................................................... 20 7.3.1 Limits ................................................................................................................. 20 7.3.2 Measurement setup.......................................................................................... 20
7.4 MPT1570 (United Kindom) ........................................................................................ 21 7.4.1 Limits ................................................................................................................. 21 7.4.2 Measurement setup.......................................................................................... 21
7.5 Comparison of the Standards ...................................................................................... 22 7.5.1 Conducted limits .............................................................................................. 22 7.5.2 Radiated limits .................................................................................................. 23 7.5.3 Radiated and conducted limits ....................................................................... 24 7.5.4 Conversion factors between conducted and radiated levels...................... 24 7.5.5 Other factors .................................................................................................... 25 7.5.6 Conversion between Peak and Quasi-Peak detectors for HomePlug measurements ..................................................................................................................... 26
8 PLC modems homologation ............................................................................................ 28 8.1 Current homologation in the Usa ............................................................................... 28 8.2 Current homologation in Europe ............................................................................... 28 8.3 Impedance stabilisation network (ISN and T-ISN) for conducted measurements 29 8.4 Futur homologation in Europe ................................................................................... 30
9 Tests & Measurements...................................................................................................... 31 9.1 General analysis ............................................................................................................. 31
9.1.1 Interaction between two Homeplug networks on the same powerline... 32 9.2 Frequency analysis ......................................................................................................... 33
9.2.1 Comparison of the Modems .......................................................................... 33 9.2.2 Homeplug frequency band conducted measurements ............................... 33

EMC ANALYSIS OF POWERLINE SYSTEMS JULY 2004
4
9.2.3 Harmonic analysis below 100MHz ............................................................... 35 9.2.4 Emission Courrent behavior .......................................................................... 36 9.2.5 Disturbance reaction ....................................................................................... 38
10 Summary and conclusion.................................................................................................. 41 11 References ........................................................................................................................... 42 12 Appendix ............................................................................................................................. 43
12.1 Current behaviour measurements .......................................................................... 43 12.2 Corinex Modem ........................................................................................................ 46 12.3 Devolo Modem ......................................................................................................... 48 12.4 Niroda Modem.......................................................................................................... 50 12.5 Modem Zeus.............................................................................................................. 52 12.6 Zeus Modem (Wall mount usb).............................................................................. 54 12.7 DecametriC radio amateur frequency bands......................................................... 56 12.8 Radiated measurements setup ................................................................................. 59 12.9 Radiated measurements results with Zeus bridge modems................................ 60 12.10 Comparison between indoor modems................................................................... 64 12.11 Comparison between outdoor modems................................................................ 66 12.12 Comparison between powerline chipsets .............................................................. 68

EMC ANALYSIS OF POWERLINE SYSTEMS JULY 2004
5
3 INTRODUCTION
Powerline systems (also known as plc systems) have been in full evolution for several years. Numerous manufacturers have since begun studying and producing such systems.
Existing powerline systems offer lower data rates than Ethernet, ADSL and 802.11 wireless LAN systems but, in the future, they are likely to achieve comparable transmission speeds. Indeed, the current powerline rates of 2.5 and 14 Mbps are expected to increase up to 100 Mbps and there is talk of chipsets being developed for 200 Mbps, although these number need still to be confirmed.
The great advantage of powerline communication is that it uses the existing mains
network and it does not need any new wiring to be deployed. The mains network exists currently in most parts of the world. In some countries, while very few homes have phone lines, the great majority has been wired for electric power. In those countries, ADSL is not a viable solution and powerline is an attractive alternative.
The fact that plc systems use the existing electric utility wiring is actually a mixed
blessing since the power cables' low symmetry makes them good radiators. In fact, one of the main problems with plc modems is the radiated emission and electric field. The plc modems transmit information on frequencies between 1 MHz and 30 MHz. All countries specify standards in which limits for these emissions are set and must be respected. Although efforts are constantly underway to harmonise EMC and EMI standards and regulations, there are still considerable differences between countries around the world.
Before equipment can be sold on the market, it must prove that it complies with the
applicable standards. For each electric piece of equipment, a special homologation procedure must be used.
As part of this project, we will define a measurement setup to test plc modems and to compare our measurement with the European standards.
We will also analyse the current situation of the plc technology and its market share and potential.
We have organised this report in four parts dealing with both, American and
European systems: • PLC market analysis • Modem analysis • Comparison of standards • Measurements

EMC ANALYSIS OF POWERLINE SYSTEMS JULY 2004
6
4 POWERLINE MODEM MARKET
The powerline market is separated in two distinct categories: • Outdoor modems (Access) characterised by:
o Special approvals o Low volume production o High cost o Currently: not available for the masses
• Indoor modems (Home) characterised by: o Standard EMC approvals (EN55022 in Europe) o High volume production o Low cost o Mass market usage
This chapter will provide a detailed analysis of this market.

EMC ANALYSIS OF POWERLINE SYSTEMS JULY 2004
7
4.1 OUTDOOR MODEMS (ACCESS)
The first observation is that the EU market seems to be dominated by cable and ADSL technology (maybe due to data-rate limitation for PLC technology). On the other hand, we find more PLC systems in developing countries and in the USA.
In Figure 1, we can see the main manufacturers and their operating regions
Figure 1: Access modem manufacturers Although the majority of manufacturers do not easily furnish information about their
systems, we still succeeded in collecting the following information: Table 1: Access modem comparison
Manufacturers Data rate [Mbps] Chipset Modulation
Amperion 45 / 6 (Wireless) * * Powercomm * * *
Ambient 45 DS2 * Current
Technologies * * *
telkonet 14 * * Easyplug 45 DS2 *
Ilevo 45 * * Xeline 8 Samsung * Ascom 2.25 (indoor)/4.5 (outdoor) * GMSK
Main.net 2.5 Itran ACSK * Information not available
Other manufacturers
XELINE (Asia) ILEVO (Sweden)
ASCOM
MAIN.NET
Rest of the world POWERCOMM AMPERION
CURRENT TECHNOLOGIES TELKONET
EASYPLUG AMBIENT
USA (FCC)
…
…

EMC ANALYSIS OF POWERLINE SYSTEMS JULY 2004
8
This market is clearly separated into two areas: • USA
o Several systems are available (PLC on high voltage lines and wireless LAN for the last few hundred meters
o Push toward high data rates (45 Mbps) in the USA (only FCC compliance)
• Rest of the world except Europe o Non US units are concentrated in emerging regions like Russia, South
America and Africa o Not distributed via mass market distribution channels, no detailed
data-sheets are available. Conclusion for the access modems:
• Hardly any operational systems in Europe. Only some trial tests. • Viability only in developing countries (due to the lack of infrastructure for
ADSL and cable network.) • Not distributed through mass market distribution network • Technical information unavailable
At present, there exists only one operational plc access system in Switzerland
(Fribourg). On the other hand, Homeplug modems are widely available at electronics stores. Most perturbation problems are therefore not expected from the plc access modems produced by Ascom, but rather from the Homeplug certified modems that are being mass-produced and marketed in our country!
PLC access modems will not be studied further in the context of this project. However, measurements on access modems could be made if BAKOM requests it at a later point in time.

EMC ANALYSIS OF POWERLINE SYSTEMS JULY 2004
9
4.2 INDOOR MODEM (HOME)
In Figure 2, we separate the indoor market into three groups based on the specification on which they are based.
Figure 2: PLC indoor modem chipsets grouped by the specification on which they are
based Home appliance modems are outside the scope of the present study since they are
not likely to generate disturbances due to the low bit rates used and to the fact that they are EN55022 compliant. Home appliance modems are characterised by:
o Low bit rate o Very low cost o Frequency band below 150kHz o Low disturbance (EN55022 standard respected)
The group identified as “others” in Figure 2 refers to modems that represent a very
small part of the plc market. Little or no information is available on them. The third group is based on the Homeplug specification. The following observations
can be made: o Homeplug is an alliance of manufacturers founded in 2000. That year,
they produced the Homeplug 1.0 specification, whose details will be explained later on in this report.
o Homeplug modems represent 99% of the market o All indoor modems found on the market for this study are currently
Homeplug certified
Domosys
Home appliance
National Philips Sainco
Homeplug
DS2
Telewise
Valence
Conexant Cogency
Intellon
Others
Itran Motorola
Polytrax
…
…
…

EMC ANALYSIS OF POWERLINE SYSTEMS JULY 2004
10
Above we saw that 99% of the market is Homeplug compliant. In Figure 3, we see that Intellon occupies 60% of the Homeplug chipset market. An explanation for this percentage could be that Intellon is one of the founding members of the Homeplug alliance.
Figure 3: Leaders of the PLC chipset market Conclusion for the indoor modems:
• Modems are available in the whole world. • The market is dominated by Homeplug certified modems. More than 99% at
present. • Technical information for Homeplug modems is readily available. That is not
the case for the other modems! Due to the wide domination of the EU market by Homeplug modems, this study will
focus on an in-depth analysis of those modems only! In Switzeralnd al Homeplug modems use Intellon chipsets!
146
3
Intellon
Cogency
Others
n° of OEM using the chipset

EMC ANALYSIS OF POWERLINE SYSTEMS JULY 2004
11
5 MODEM HARDWARE ANALY SIS
Two important observations can be made about PLC modems sold in Europe: • They are CE compliant • They are Homeplug certified
Table 2 shows the differences among the modems ordered to date.
Table 2: Modem ordered for our analysis and measurements
Trademark Standard Chipset Analog Front End
Type Ordered in Unit price [CHF]
Corinex FCC/CE Intellon Intellon Bridge (ETH) USA 200 Corinex FCC/CE Intellon Intellon Bridge (ETH) USA/Switzerland 200 Niroda FCC/CE Intellon Niroda Bridge (ETH) France 230 Devolo CE Intellon Intellon Wall mount (ETH) Switzerland 170 Zeus CE Intellon Zeus Wall mount (USB) Switzerland 140 Zeus CE Intellon Zeus Bridge (ETH) Switzerland 180
For our analysis, we attacked the following three questions:
• What are the differences and similarities in the hardware? o All ordered modems use an Intellon chipset o The analog front-end (LNA + PA) is customized even if the Intellon
front-end module (hybrid circuit) seems to be used by most manufacturers.
o The printed circuit board design is different for each one of the manufacturers
o The output transformer (important part of the harmonics filter) is different for each modem
• What standards are respected? o Modems available in Switzerland are CE compliant but not
necessarily FCC compliant o Zeus and Devolo modems are not sold in the USA
• What is the difference between American and European modems? o The first remark to be made is that most American vendors reject
orders coming from Europe. We could obtain modems from one of them only.
o The Corinex modem we obtained is the same in the USA and in Europe. The only difference seems to be the marking on the device (CE label for the European and FCC for the American version)

EMC ANALYSIS OF POWERLINE SYSTEMS JULY 2004
12
6 HOMEPLUG SPECIFICATION
The Homeplug alliance is a partnership of companies active in powerline communication networks.
The Homeplug alliance produced Homeplug Specification version 1.0 in 2000. Work is currently in progress on the next version, called the Homeplug AV (Audio Video) specification.
6.1 HOMEPLUG AV
The release of this new specification is scheduled for July 2004. The only information that is currently available is the data rate:
• Data rate up to 100 Mbps • Effective data rate up to 50 Mbps
6.2 HOMEPLUG 1.0
As mentioned above, the Homeplug 1.0 specification was released in 2000. Currently, most of the modems are Homeplug certified. The following discussion is based on the description of the Homeplug 1.0 protocol presented in [2]. Some of the salient characteristics of these modems are:
• Data rate up to 14 Mbps (Effective data rate up to 6 Mbps) • 56-bit DES encryption for superior security and privacy • Easy integration with all manufacturers compliant with Homeplug 1.0 • LAN connectivity anywhere a power outlet exists
6.2.1 FREQUENCY BAND
The Physical layer of Homeplug uses OFDM (Orthogonal Frequency Division Multiplexing) in a band from 4.49 MHz to 20.7 MHz. The band is used as follows:
• 0 – 25 MHz divided into 128 evenly spaced carriers • 84 carriers (23-106) fall within the used band • 8 carriers are permanently masked to avoid radio amateur bands. • => 76 effective carriers available for data transmission
• The bandwidth of the carrier is equal to 195.3 kHz

EMC ANALYSIS OF POWERLINE SYSTEMS JULY 2004
13
Table 3: Carriers frequencies of the Homeplug specification
Carrier number
Carrier frequency
[MHz] Carrier number
Carrier frequency
[MHz] Carrier number
Carrier frequency
[MHz] Carrier number
Carrier frequency
[MHz] 1 4.4922 22 8.5938 43 12.6953 64 16.79692 4.6875 23 8.7891 44 12.8906 65 16.99223 4.8828 24 8.9844 45 13.0859 66 17.18754 5.0781 25 9.1797 46 13.2813 67 17.38285 5.2734 26 9.375 47 13.4766 68 17.57816 5.4688 27 9.5703 48 13.6719 69 17.77347 5.6641 28 9.7656 49 13.8672 70 17.96888 5.8594 29 9.9609 50 14.0625 71 18.16419 6.0547 30 10.1563 51 14.2578 72 18.3594
10 6.25 31 10.3516 52 14.4531 73 18.554711 6.4453 32 10.5469 53 14.6484 74 18.7512 6.6406 33 10.7422 54 14.8438 75 18.945313 6.8359 34 10.9375 55 15.0391 76 19.140614 7.0313 35 11.1328 56 15.2344 77 19.335915 7.2266 36 11.3281 57 15.4297 78 19.531316 7.4219 37 11.5234 58 15.625 79 19.726617 7.6172 38 11.7188 59 15.8203 80 19.921918 7.8125 39 11.9141 60 16.0156 81 20.117219 8.0078 40 12.1094 61 16.2109 82 20.312520 8.2031 41 12.3047 62 16.4063 83 20.507821 8.3984 42 12.5 63 16.6016 84 20.7031
The grey shading marks the radio bands which are not used by the Homeplug systems. The decametric frequency bands are in Table 28 (see the Appendix).
Figure 4: In red the carriers frequencies of the Homeplug specification and in blue the measured spectrum.
Figure 4 shows the PSD mask defined in the Homeplug specification (dashed red line) and the PSD measured on a Homeplug compliant modem model Zeus.

EMC ANALYSIS OF POWERLINE SYSTEMS JULY 2004
14
6.2.2 THE TRANCEIVER:
A block diagram of the OFDM transceiver is shown in Figure 5. Let us look at the transmitter end first (top of Figure 5).
• The FEC (Forward Error Correction) block uses two levels of coding: A Reed-Solomon block encoder for burst disturbance error correction and a convolutional encoder for random disturbance error correction.
• The Tone Mapping block groups the data bits and maps them onto the constellation points of the modulation method (the modulation methods are addresses in the next section). It selects both, the type of modulation, and the OFDM carriers to be used.
• The Inverse Fast Fourier Transform (IFFT) block implements the IFFT used in OFDM to modulate the constellation points onto the carrier waveforms.
• The Analog front end (AFE) block provides final power amplification and low noise preamplification.
Figure 5: OFDM Transceiver Let us now turn our attention to the receiver.
• The analog front end (AFE) block takes care of the analog signal processing and adaptation from the powerline.
• The Fast Fourier Transform (FFT) block performs the time to frequency-domain conversion needed for the detection of the OFDM signal. It demodulates the carrier waveforms onto constellation points using the tone map.
• The tone unmapping block uses the knowledge of the modulation method to unmap the constellation points onto data bits.
• The Forward Error Correction (FEC) block carries out Reed-Solomon decoding for burst disturbance error correction and it uses the Viterbi algorithm to decode the convolutional coding for random disturbance error correction.
FEC Tone mapping IFFT AFE
FEC decoding
Tone unmapping FFT AFE
Synchro Channel adaptation
Receive data
Transmit data
Powerline

EMC ANALYSIS OF POWERLINE SYSTEMS JULY 2004
15
6.2.3 TRANSMISSION MODE
Homeplug specifies two transmission modes: • ROBO mode (Robust OFDM)
o Used for Channel estimation o All carriers use the same modulation: Differential Binary Phase Shift
Keying (DBPSK) o No channel adaptation
• OFDM mode o All carriers use the same modulation, either DBPSK or DQPSK o Channel adaptation
Homeplug uses channel adaptation (Channel estimation) to determine the carriers to be used and the modulation method to be applied. Channel estimation occurs when transmission using the existing Tone map fails. A tone map is considered to have expired if:
o the link is new o it has not been used successfully for 30 seconds o the sender had to revert to ROBO mode
The channel estimation is not performed more frequently than once every 4.5 seconds averaged over any 5 minutes interval. Homepug defines 139 physical data rates available from 1 - 14.1 Mbps
6.2.4 PHYSICAL FRAME STRUCTURE
Figure 6 illustrates the structure of the physical frame. The PHY frame is separated into two parts: One of the parts contains the payload. It uses channel adaptation for transmission. The other one contains the delimiter transmitted without channel adaptation so that all receivers can decode the signal correctly.
Figure 6: Homeplug 1.0 PHY frame format: (a) PHY frame format and (b) Frame Control (FC)

EMC ANALYSIS OF POWERLINE SYSTEMS JULY 2004
16
7 STANDARDS
In this chapter we present an overview of the different standards applied in the USA and Europe. We will begin with an introduction to the standards before giving a general comparison of the limits for conducted and radiated emission levels.
The setup currently used for plc modem testing will be explained in the next chapter. All limits are given for class B equipment, which is intended primarily for use in the
domestic environment 7.1 FCC (USA)
The Federal Communications Commission (FCC)[3] set principally radiated limits for the whole frequency band but it specifies also conducted limits below 1.705 MHz.
The radiated levels are very permissive and allow plc modems to attain higher data rates than the European standards do, as shown in Figure 9 (Section 7.5.3).
7.1.1 LIMITS
7.1.1.1 Conducted limits
For measurements on plc modems, we are not directly concerned by conducted limits because Homeplug specifies an operating frequency range above 1.705 MHz (see Table 4). The powerline will not be influenced by a Homeplug modem for all frequencies below that limit.
Table 4: FCC conducted limits
Frequency of emission [MHz] Quasi-peak limits [µV] Band [kHz] 0.535 -1.705 1000 9
7.1.1.2 Radiated emission limits
The radiated emission limit specified in the boldfaced line of Table 5, is important because it define the limit in the Homeplug frequency band (4 MHz to 20 MHz).
Table 5: FCC radiated emission limits
Frequency [MHz] Quasi-peak limits [µV/m] Measurement distance [m] 0.009 – 0.490 2400/f(kHz) 300 0.490 – 1.705 24000/f(kHz) 30 1.705 – 30.0 30 30 30 – 88 100 3 88 – 216 150 3 216 - 960 200 3 Above 960 500 3

EMC ANALYSIS OF POWERLINE SYSTEMS JULY 2004
17
7.1.2 MEASUREMENT SETUP
The FCC specifies conducted measurements with an artificial mains network (AMN) for frequencies below 1.705 MHz. Radiated emission measurements, on the other hand, are made for the whole frequency range with a dipole antenna at a distance of 30m.
For both measurements it is clearly specified that the modem must be in maximum emission mode with its accessories attached.
7.1.2.1 Conducted measurements
The main characteristics for conducted measurements are summarized in Table 6.
Table 6: FCC conducted measurements main characteristics
Frequency 535kHz – 1.705 MHz
Detector Quasi-peak Band 9 kHz Antenna AMN Modem mode Maximum emission and
accessories attached
7.1.2.2 Radiated emission measurements
Table 7 contains information corresponding to radiated measurements as specified by the FCC.
Table 7: FCC radiated measurements main characteristics
Frequency – 1.705 MHz 1.705 MHz – 108 MHz
Detector Quasi-peak (peak) Quasi-peak (peak) Band 6 dB (CISPR16.1) 6 dB (CISPR16.1) Antenna Dipole Dipole Distance [m] 30 30 Maximum frequency [MHz]
30 1000
Site Open field Open field Modem mode Maximum emission
and accessories attached
Maximum emission and accessories attached
Some details of the FCC testing are neglected here because of the focus on European
approvals

EMC ANALYSIS OF POWERLINE SYSTEMS JULY 2004
18
7.2 EN 55022 (EUROPE)
The EN55022 [4] does not specify any limits for plc systems. It specifies mains port limits and telecommunication ports limits but no limits for multi-purpose ports. This standard requires conducted measurements below 30 MHz and radiated measurements for frequencies above 30 MHz.
7.2.1 LIMITS
7.2.1.1 Conducted limits
In Table 8 we see the conducted limits for the mains ports. They are given in quasi-peak and in average levels.
Table 8: EN55022 limits for conducted disturbance at the mains ports of
class B equipment
Limits [dB(µV)] Frequency range [MHz] Quasi-peak Average
0.15 – 0.5 66 – 56 56 – 46 0.5 - 5 56 46 5 – 30 60 50
The first observation we can make is that the conducted limits for
telecommunications ports are higher than for the mains ports. These limits are also given in current levels.
Table 9: EN55022 limits of conducted common mode (asymmetric mode)
disturbance for class B equipment at telecommunications ports
Voltage limits [dB(µV)] Current limits [dB(µA)] Frequency range [MHz] Quasi-peak Average Quasi-peak Average
0.15 – 0.5 84 – 74 74 - 64 40 – 30 30 – 20 5 – 30 74 64 30 20
7.2.1.2 Radiated emission limits
For the radiated limits it is important to note that the limits are given at a distance of 10m.
Table 10: EN55022 limits for radiated disturbance of class B ITE at a measuring distance of 10 m
Frequency [MHz] Quasi-peak limits [dBµV/m]
30 - 230 30 230 - 1000 37

EMC ANALYSIS OF POWERLINE SYSTEMS JULY 2004
19
7.2.2 MEASUREMENT SETUP
An important point to stress is that the modem used in the measurement setup does not need to be forced to a “maximum emission mode”.
We explain the general measurement setup below. It is not specific to plc modems because of the lack of specifications for the multi-purpose port in EN55022 as already mentioned at the beginning of this section. (see also Section 8.4)
7.2.2.1 Conducted measurement
Details of the measurements on the mains port and on the telecommunications port are given in Table 11. The only difference is the use, for the mains port, of an artificial mains network (AMN) and, for the communications port, of a line impedance stabilization network (LISN)
Table 11: EN55022 conducted measurements main characteristics
Frequency 0.15 MHz – 30 MHz mains port
0.15 MHz – 30 MHz communications port
Detector Quasi-peak (peak) Quasi-peak (peak) Measurement band
At -6 dB (CISPR16.1) (recommended 9 kHz)
At -6 dB (CISPR16.1) (recommended 9 kHz)
Antenna AMN LISN Modem mode
Normal operation mode with accessories attached
Normal operation mode with accessories attached
7.2.2.2 Radiated emission measurement
Table 12 describes radiated emission measurements.
Table 12: EN55022 radiated measurements main characteristics
Frequency 30 MHz – 230 MHz
Detector Quasi-peak (peak) Measurement band At -6 dB (CISPR16.1) (recommended 9 kHz) Antenna Dipole Distance 10m Height 1m and 4m

EMC ANALYSIS OF POWERLINE SYSTEMS JULY 2004
20
7.3 NB30 (GERMANY)
The German Regulatory Authority for Telecommunications and Posts, Reg TP, established the NB30 limits which are based on radiated measurements. The measurement setup is described in reference [5].
7.3.1 LIMITS
Contrary to the two previously discussed standards, the limits are given in peak levels. It is difficult to make a direct comparison with other standards since the conversion factor depends on the measurement setup. The NB30 limits are given in Table 13. Some conversion factors are also given in reference [5].
Table 13: NB30 radiated emission limits at a measuring distance of 3 m
Frequency [MHz] Peak limits
[dBµV/m] Band [kHz]
0.009 – 0.15 40 – 20 log(f/MHz) 0.2 0.15 – 1 40 – 20 log(f/MHz) 9 1 – 30 40 – 8.8 log(f/MHz) 9 30 - 1000 27 120 1000 – 3000 40 1000
7.3.2 MEASUREMENT SETUP
The salient characteristics of the NB30 radiated measurement setup are given in Table 14.
Table 14: NB30 radiated measurements main characteristics
Frequency [MHz] 0.009 – 30 30 - 3000
Antenna Loop Bi-log Measurement distance [m] 3 3 Detector Quasi-peak Quasi-peak Modem mode Maximum emission Maximum emission
The Regulatory Authority for Telecommunications and Posts specifies a correlation
factor between Quasi-peak and peak levels since the measurement setup uses a quasi-peak detector and the radiated emission limits are given in peak levels. (Reg TP 322 MV 05 Part 1 [5])

EMC ANALYSIS OF POWERLINE SYSTEMS JULY 2004
21
7.4 MPT1570 (UNITED KINDOM)
The MPT1570 standard [6] specified limits up to 30 MHz up until January 2003. The current version specifies radiated limits below 1.6 MHz only. PLC modems do not need to be compliant with this standard since they operate in another frequency band. Table 15 contains the current MPT1570 limits and it is given for information only.
7.4.1 LIMITS
Table 15: MPT1570 radiated emission limits
Frequency [MHz] Peak limits
[dBµA/m] Measurement
distance [m]
0.009 – 0.15 49 – 20 log(f/kHz) 3 0.15 – 1.6 -1.5 – 20 log(f/MHz) 1
7.4.2 MEASUREMENT SETUP
Notice that this setup is the only one that specifies the use of a peak detector. This is coherent with the fact that the limits are given in terms of peak levels, as defined in Table 14. Some aspects of the measurement specification are given in Table 16.
Table 16: MPT1570 radiated measurements main characteristics
Frequency [MHz] 9 kHz – 150 kHz 150 kHz – 1.6 MHz
Detector Peak Peak Measurement distance [m] 200 Hz 9 kHz Antenna Loop Loop Measurement distance [m] 3 1 Modem mode Not specified Not specified

EMC ANALYSIS OF POWERLINE SYSTEMS JULY 2004
22
7.5 COMPARISON OF THE STANDARDS
A comparison of the different standards is not straightforward since every standard uses its own limits and measurement setup.
• The FCC specifies conducted limits in µV and radiated emission limits in µV/m and uses quasi-peak levels at a distance of 30m.
• EN55022 specifies conducted limits in dBµV and dBµA. It uses average or quasi-peak levels. Radiated limits are defined above 30 MHz in dBµV/m
• NB30 specifies radiated emission limits in dBµV/m and it uses peak levels. The measurement detector is, however, a quasi-peak detector and the measurements are made at a distance of 3m
• MPT1570 specifies radiated emission limits in dBµA/m and it uses peak levels at a distance of 1m or 3m
A further important difference is the mode of operation of the modem during the measurement. While FCC and NB30 specify a “maximum emission mode”, EN55022 currently specifies a “normal operation mode”.
7.5.1 CONDUCTED LIMITS
The FCC limit is between the communications and mains port limit of the EN55022 but out of the HomePlug frequency band. This comparison shows also that the mains port limit is much stricter than the communications port limits.
Figure 7: Standards limits comparison for conducted measurements
20.00
30.00
40.00
50.00
60.00
70.00
80.00
90.00
0.1 1 10 100f [MHz]
Lim
it [d
BuV
]
EN55022 conducted limit (comm port) EN55022 conducted limit (main port)
FCC conducted limit

EMC ANALYSIS OF POWERLINE SYSTEMS JULY 2004
23
7.5.2 RADIATED LIMITS
This comparison shows a considerable difference between the FCC and NB30 limits within the Homeplug frequency band. Although EN55022 does not specify limits in the Homeplug frequency band, the specified limits above 30MHz are similar to those of the FCC.
Figure 8: Standards limits comparison for radiated measurements To allow a comparison, all of the values have been converted to 3m quasi-peak values of electric field strength dBµV/m.
20.00
30.00
40.00
50.00
60.00
70.00
80.00
90.00
0.001 0.01 0.1 1 10 100 1000f [MHz]
E [d
B(u
V/m
)]
NB30 radiated limit MPT1570 radiated limit
FCC radiated limit EN55022 radiated limitMeasurement at 3m with Quasi-Peak detector

EMC ANALYSIS OF POWERLINE SYSTEMS JULY 2004
24
7.5.3 RADIATED AND CONDUCTED LIMITS
To compare radiated and conducted measurements limits, we take into consideration the following factors:
• Conversion factor from Peak to Quasi-Peak limits (see Section 7.5.6) • Distance correction factor (see Section 7.5.5) • Conversion between conducted and radiated measurements (see Section 7.5.4)
In the following graph we compare only norms that define limits in the HomePlug frequency band.
Figure 9: Standards comparison in radiated limits measurements in the HomePlug
frequency band
7.5.4 CONVERSION FACTORS BETWEEN CONDUCTED AND RADIATED LEVELS
The relation between a current level and its associated radiated fields depends on many factors, including the symmetry of the cable, the geometry and the frequency. It is therefore difficult to establish this relation exactly. Although constant factors are an oversimplification in most cases, they are commonly used because they provide a way to make first order comparisons. France telecom has established the following conversion factors [9]
20.00
30.00
40.00
50.00
60.00
70.00
80.00
90.00
0.001 0.01 0.1 1 10 100f [MHz]
E [d
B(u
V/m
)]
EN55022 conducted limit (comm port) NB30 radiated limit
EN55022 conducted limit (main port) FCC radiated limit
Measurement at 3m and Quasi-peak detector Conversion factor between conducted and radiated levels is -28.5dB

EMC ANALYSIS OF POWERLINE SYSTEMS JULY 2004
25
Table 17: Conversion factors from France Telecom R&D
Conducted (power, 50Ω) Factors Radiated
dBm/Hz (10kHz EN55022) + 67 dB dBµA/m (3m EN55022)
dBm/Hz (10kHz) - 37 dB dBµA/m (10m outdoor) dBm/Hz (1Hz NB30) + 50 dB dBµA/m (3m NB30) dBm/Hz (10kHz comm CE) + 50 dB dBµA/m (alim CE) dBm/Hz (single) + 27 dB dBµA/m (indoor) dBm/Hz (single) + 10 dB dBµA/m (3m) dBm/Hz (single) - 3 dB dBµA/m (10m outdoor) We selected the EN55022 factor +67dB (boldface in Table 17) and, after
straightforward calculation, we obtained our correlation factor, given in Table 18, between conducted (in a T-ISN, according to current CE homologation) and radiated levels.
Table 18: Conversion factor between conducted and radiated limits
dBµV -28.5 dB dB(µV/m)
This factor will be verified experimentally in a future project.
7.5.5 OTHER FACTORS
Some other conversion factors used for the standards comparison are given in tables 19 through 22 below.
Table 19: Conducted conversion between current and voltage levels
µA 150 Ω µV dB(µA) + 44 dB dB(µV)
Table 20: Radiated conversion between electric and magnetic field
µA/m 377 Ω µV/m dB(µA/m) + 51.5 dB dB(µV/m)
Table 21: Conversion between Voltage and power levels
µV u^2/Zc mW dB(µV) -90-10*log(Zc) dBm
Table 22: Distance correction
Level at distance X [dB] +20*log(X/Y) Level at distance Y [dB]

EMC ANALYSIS OF POWERLINE SYSTEMS JULY 2004
26
7.5.6 CONVERSION BETWEEN PEAK AND QUASI-PEAK DETECTORS FOR HOMEPLUG MEASUREMENTS
To determine the conversion factor between Peak and Quasi-Peak detectors, we use the PMM8000Plus. This piece of equipment uses Peak, Quasi-Peak and Average hardware detectors.
To determine this factor we made several measurements whose results are illustrated in figures 10 and 11:
• Maximum transfer rate ( 14 Mbps) to obtain maximum disturbance.
Figure 10: Conducted measurement of two modems Zeus in maximum transfer rate mode. (Quasi-Peak time = 500ms, Peak time = 2 ms, Average time = 10 ms and BW=9kHz)
• Low transfer rate ( 1Mbps).
Figure 11: Conducted measurement of two modems Zeus in low transfer rate mode.
(Quasi-Peak time = 500ms, Peak time = 2 ms, Average time = 10 ms and BW=9kHz) From the measured data, we calculated the conversion factor twice: The first one is
the analysis on the full band (1 to 30 MHz) and the second one is the analysis in the HomePlug band only ( 4 to 20 MHz). The results are given in Table 23.

EMC ANALYSIS OF POWERLINE SYSTEMS JULY 2004
27
Table 23: Measurements of the conversion factor for several modems
Average value for the modem Corinex Devolo Niroda Zeus Zeus USB
Difference Peak-Qpeak [dB] (1-30MHz) -6.61 -6.74 -7.66 -6.38 -7.70Peak-Qpeak [dB] (4-20MHz) -6.34 -6.19 -6.92 -6.33 -6.66Peak-Average [dB] (1-30MHz) -14.06 -14.30 -15.49 -13.93 -16.57
Maximum rate (14 Mbps)
Peak-Average [dB] (4-20MHz) -13.38 -13.25 -13.94 -13.58 -15.20
Peak-Qpeak [dB] (1-30MHz) -8.60 -8.61 -8.76 -8.24 -8.35Peak-Qpeak [dB] (4-20MHz) -8.18 -7.96 -8.15 -7.74 -7.79Peak-Average [dB] (1-30MHz) -28.31 -28.44 -24.72 -24.90 -28.29
Rate of 1 Mbps
Peak-Average [dB] (4-20MHz) -27.56 -27.35 -23.62 -23.64 -27.41 Table 24 contains the mean values of the measurements given in Table 23.
Table 24: Conversion factor between Peak/Quasi-Peak and Peak/Average
Mean 1-30MHz 4-20MHz
Mean of the two measurement
Peak-Qpeak [dB] -7.016 -6.49 -6.75Maximum rate (14 Mbps) Peak-Average [dB] -14.87 -13.86 -14.37
Peak-Qpeak [dB] -8.51 -7.96 -8.24Maximum rate
1 Mbps Peak-Average [dB] -26.93 -25.92 -26.42
The conversion factor between Peak and Quasi-Peak changes about 1.5 dB between the measurement with full and low bandwidth. But for the factor between Peak and Average the difference is approximately a factor of 2.
It is difficult to determine an exact value for this factor but if we round off the values
for maximum rate and low rate, we obtain the following factor: Table 25: Conversion factor between Peak and Quasi-Peak detectors
Peak -7 dB Quasi-Peak

EMC ANALYSIS OF POWERLINE SYSTEMS JULY 2004
28
8 PLC MODEMS HOMOLOGATION
In this section, we will analyse the current and future approval procedure for the plc modems in the USA and in Europe.
8.1 CURRENT HOMOLOGATION IN THE USA
The FCC standard clearly specifies the measurement setup for PLC modems as shown below:
• Quasi-peak detector • Modem in maximum emission mode with accessories attached. This means
that the modem under test is connected to another device and that it is transferring data so that the radiated emission is maximum.
• Radiated measurement o Dipole antenna o Frequency: 9 kHz – 108 MHz o Open field test site o Distance of 30m
• Conducted measurement o LISN o Frequency: 535 kHz – 1.705 MHz
8.2 CURRENT HOMOLOGATION IN EUROPE
The European standard EN55022 does not currently contain any special specifications for PLC modems but the following arrangement has been used to certify them for the mass market:
• Conducted measurement with non standardized T-ISN at the mains port • Telecommunications port limits used • Frequency: 150 kHz – 30 MHz • Quasi-peak detector • Modem in normal operating mode (minimum emission) with accessories
attached. Unlike the FCC specification, the European setup allows the measurement to be made in the standard operating mode.
In the following sections, we will compare the different ISN's specified in the European standard.

EMC ANALYSIS OF POWERLINE SYSTEMS JULY 2004
29
8.3 IMPEDANCE STABILISATION NETWORK (ISN AND T-ISN) FOR CONDUCTED MEASUREMENTS
The EN55022 standard specifies, for conducted measurements, the ISN whose schematic is given in Figure 12.
Figure 12: Impedance stabilisation network (ISN) specified in EN55022.
The current conducted measurement uses a non standardized ISN. The T-ISN is an
ISN with a longitudinal conversion loss (LCL) of 30dB as shown in Figure 13 below. The modems currently on the EU market were certified using this T-ISN.
Figure 13: Impedance stabilisation network with an LCL factor of 30dB (T-ISN)

EMC ANALYSIS OF POWERLINE SYSTEMS JULY 2004
30
This non standard T-ISN was designed by professor Hirsch from the University of Dortmund (D) [7].
The T-ISN specified in the “future” EN55022 is similar to the currently used T-ISN but with an LCL of 36 dB as shown in Figure 9.
Figure 14: Impedance stabilisation network with an LCL factor of 36dB (T-ISN)
8.4 FUTUR HOMOLOGATION IN EUROPE
Although no one appears to know exactly how modems will be certified in the future, two solutions are the most likely candidates:
• The first one is presented in a CENELEC draft [8]: o Conducted measurement at the multi-purpose port o Communication function inactive using an AMN with mains port
limits o Communication function active using a T-ISN (as shown above) with
telecommunications port limits • The second follows NB30:
o Radiated measurement at a distance of 3m with NB30 limits and measurement setup.

EMC ANALYSIS OF POWERLINE SYSTEMS JULY 2004
31
9 TESTS & MEASUREMENTS
Our main goal was to determine whether or not the PLC modems currently on the European market are EN55022 compliant. We also investigated the factors that influence the emission level.
To do this, we separated our measurements in three parts, each with its own objective:
• General analysis: Analyse the difference of emission field with different modems in different emission modes.
• Conducted measurement according to EN55022: Qualify conducted emissions with the European standard for the modems currently on the market
• Radiated measurement according to EN55022: Check the harmonics above 30 MHz
9.1 GENERAL ANALYSIS
For all conducted measurements we used the same base configuration illustrated in Figure 15. The modems were connected to the LISN which was in turn connected to an EMC filter. The computer and measurement equipment was directly connected to the powerline.
Figure 15: General measurement setup A network with two different modems work equally well as with two identical
modems. We observed the following points: • The maximum rate is identical under all configurations (about 8 Mbps*) but
we notice small instabilities in the transmission rate (of the order of 200 kbps) probably due to errored frames.
• The connection was always restored after an interruption if two identical modems were used.
• Sometimes the connexion could not be restored after a long interruption with two different modems.
* The transfer rate measurements were made with a program called Analyser and the transferred data were generated with TfGen. With this system we obtained a maximum transfer rate of 8 Mbps but with a file transfer program such as ftp we obtained half that rate (4 Mbps).
PLC modem 1
PLC modem 2 PC 2
LISN EMC filterPC 1
Powerline
Measurement equipment

EMC ANALYSIS OF POWERLINE SYSTEMS JULY 2004
32
9.1.1 INTERACTION BETWEEN TWO HOMEPLUG NETWORKS ON THE SAME POWERLINE
It is possible to establish two separate networks at the same time on the same powerline as shown in Figure 16. We refer to each PC as PCi, where I is the number of the modem installed on it. To set up a network, for example between PC1 and PC2, the same network name is given to each modem using the modem’s configuration utility.
Figure 16: Measurement setup with two different networks
• All observations given in the previous section are valid for the case of two
networks. • Two networks work perfectly on the same powerline at the same time. • To establish a connection between to modems, they must be in the same
network. In Figure 16, PC1 could not reach PC3. • The available bit rate is uniformly divided between the two connections.
• If there is one transfer between PC1 and PC2 and a second between PC3 and PC4 the band rate is divided into two (about 4 Mbps for each connexion).
• If the transfer between PC1 and PC2 is stopped, the band rate of the second transfer is doubled (to about 8 Mbps).
• If we reactivate the first connexion, the rate is once again divided (about 4 Mbps for each connexion).
• It is also possible to establish two connections (transfer) between two PCs on the same network and the functionality is the same as the transfer in two separate networks.
The main remark is that the Homeplug system is very robust but sometimes it was
difficult to establish a connection between two modems due to the modems’ configuration.
PC with modem 1
PC with modem 2
PC with modem 3
PC with modem 4
Powerline
Network 1 Network 2

EMC ANALYSIS OF POWERLINE SYSTEMS JULY 2004
33
9.2 FREQUENCY ANALYSIS
We made the general frequency analysis in conducted measurements with an LISN (Certifiate below 30 MHz). The measurements take into consideration the frequency response of the LISN below 100 MHz.
9.2.1 COMPARISON OF THE MODEMS
From Figure 17 we observe that the general apperance of the measured voltage spectrum is very similar for all of the modems. A difference can be noted at frequencies higher than 55 MHz for the Zeus wall mount modem (usb).
Figure 17: Conducted measurement below 100 MHz of all tested modems
The mean difference of all bridge modems is about 4.5 dB in the range 150 kHz to 100 MHz. For this calculation, we chose to leave out the Zeus wall-mount modem because of the oscillatory behaviour of the measurement in the upper frequency band.
In Figure 7 all the measurements were made with identical at each end of the connection. We observed also that, even if two different modems are used, the mean difference remains essentially unchanged.
We tested the Corinex modems from the USA (110V and FCC compliant) and did not observe any difference when compared to their European counterparts (Corinex modem, 220V and CE compliant). The frequency behaviour of the amplitude spectrum was also observed to be identical.
9.2.2 HOMEPLUG FREQUENCY BAND CONDUCTED MEASUREMENTS
In the previous section, we saw that the HomePlug based modems were all very similar in the range 150 kHz to 30 MHz. For that reason, the analysis presented in this section is limited to the Zeus modem. However, measurements for all of the modems can be found in the Appendix.
In Figure 18, we show that the modem’s conducted emissions are up to 25 dB above the EN55022 limit when the modem operates at maximum transfer.

EMC ANALYSIS OF POWERLINE SYSTEMS JULY 2004
34
Figure 18: Conducted measurement of two modems Zeus in maximum transfer rate mode. (Quasi-Peak time = 500ms, Peak time = 2 ms, Average time = 10 ms and BW=9kHz)
In the following figure, we show the emission level both, with the modem operating at a 1 Mbps transfer rate, and when it is operating at maximum transfer rate. Interestingly, although the measurements for the two transmission rates look different, the spectra are identical if max hold is used during the measurement.
Figure 19: Conducted measurement of two modems Zeus. The red trace the modems are in a transfer rate mode of 1 Mbps and the violet trace in maximum transfer rate mode
(Peak time = 2 ms and BW=9kHz)

EMC ANALYSIS OF POWERLINE SYSTEMS JULY 2004
35
In Figure 20, the modems are in standby mode and we observe that the modem is 25 dB under the EN55022 limit.
Figure 20: Conducted measurement of two Zeus modems in standby mode. (Peak time = 2ms and BW=9kHz)
9.2.3 HARMONIC ANALYSIS BELOW 100MHZ
In Figure 21, we show the harmonic disturbance of a HomePlug modem. We can consider that this electric field is under the EN55022 limit. The measurement setup and the complete radiated measurements are given in the Appendix.
Figure 21: Radiated measurement of two Zeus modems in maximum transfer rate mode. (Peak time = 2 ms and BW=120kHz)

EMC ANALYSIS OF POWERLINE SYSTEMS JULY 2004
36
9.2.4 EMISSION COURRENT BEHAVIOR
To determine how the modem output current behaves as a function of the load, we changed the load of the powerline and measured the current on it. The schematic of the system that allowed us to change the load is shown in Figure 29 in the Appendix.
Figure 22 shows the current on the powerline from the Zeus bridge modem without additional load.
Figure 22: Current measurement without additional load Figures 25, 26 and 27 in the Appendix show the current behaviour from 1 MHz to
25 MHz. We selected a single frequency, 15 MHz, to study the behaviour of the modems over the whole frequency band and we used that frequency as a basis for comparison of the different modems. The choice of that particular frequency was based on the following observations:
• The selected frequency is in the middle of the band. • The current at that frequency exhibits a strong dependence on the load. • The maximum current was measured at 15 MHz for a wide range of load
impedances.

EMC ANALYSIS OF POWERLINE SYSTEMS JULY 2004
37
In Figure 23, we have plotted the “normalized” current at 15 MHz as a function of
the load for 5 modems. Here, the term “normalized” indicates that all currents have been referenced to the current measured for a load of 150Ω. That load corresponds to the normalised load of an ISN according to EN55022 (CISPR16.1).
We can see form Figure 23 that the various modems exhibit different current behaviour characteristics. We observed that, while the Devolo modems have a 16 dB difference between 22Ω and 2,2kΩ, the difference is only 7 dB for the Niroda modems for the same load interval.
Figure 23: Comparison between the output stage from Homeplug modems We can see that the current measured using an LISN (150Ω), is, on average, 6 dB
smaller that the current measured under a 2,2kΩ load. This suggests that the HomePlug modems would radiate more on real
installations than on the EN55022 compliance setup (connected to an LISN). We explained before that, almost all of the HomePlug modems use the same Intellon
chipset, although the output stage may be different. This, however, should not influence the radiated field of the modems appreciably.

EMC ANALYSIS OF POWERLINE SYSTEMS JULY 2004
38
9.2.5 DISTURBANCE REACTION
9.2.5.1 Narrowband disturbance
To study the behaviour of the modems in the presence of narrow-band disturbances, we used a clamp to introduce a narrow-band signal whose width was equal to the bandwidth of a carrier, about 300 kHz.
9.2.5.1.1 Statique narrowband disturbance
We set the frequency of the narrow-band signal to different frequencies within the Homeplug frequency band and we increase its amplitude in an attempt to disturb the PLC connection. We were not able to disturb the connection even with a disturbance much higher than the PLC signal level.
Seeing that this disturbance has not effect we repeated the test, this time varying slowly the central frequency of the disturbance as explained in the next section.
9.2.5.1.2 Dynamic narrowband disturbance
For this measurement, we proceeded as follows: We set the frequency of the narrow-band signal to 10 MHz and changed its amplitude until the desired signal to noise ratio was reached (this is the value noted in the first column in Table 26). We then varied the central frequency of the narrowband disturbance slowly between 5 MHz and 15 MHz (Figure 24) and we observed the effect on the bandwidth of the PLC connection. The results were written in Table 26.
Interestingly, regardless of the central frequency of the narrowband signal, the bandwidth of the connection was not influenced until the SNR was much smaller than 0 dB.
Figure 24: Narrowband disturbance with center frequency variation
Modems signal level
5 MHz Frequency variation 15 MHz Frequency
300 kHz
SNR@10 MHz

EMC ANALYSIS OF POWERLINE SYSTEMS JULY 2004
39
Table 26: Measurement with variable frequency narrowband disturbance
SNR [dB]
@10 MHz Effect on the bandwidth of the connection
18 No effect on the bandwidth
1 Rate went down to 6 Mbps. Stayed most of the time at 7.3
Mbps
-8 Rate went down to 5 Mbps. Oscillated between 6.5 Mbps
and 7 Mbps most of the time
-12 Rate went down to 2 Mbps. Oscillated most of the time between 4 Mbps and 6 Mbps ( important disturbance)
-14 Rate went down to 1 Mbps. Oscillated most of the time between 3 Mbps and 6 Mbps ( important disturbance)
The connection began to be disturbed by the narrowband disturbance when the
signal to noise ratio got to SNR= -4dB and the bit rate fell to 5 Mbps. The HomePlug modem was able to adapt its carriers very fast and, even in the
presence of a considerable disturbance level and the transfer rate remained at a level that can be considered as acceptable for the user.

EMC ANALYSIS OF POWERLINE SYSTEMS JULY 2004
40
9.2.5.2 Wideband disturbance
A normalised burst disturbance was introduced to analyse its effect on the bandwidth of the PLC system.
Table 27 shows the signal to noise ratio due to the disturbance for several frequencies and the corresponding effect on the transfer rate.
Table 27: Transfer rate behaviour with wideband disturbance (Burst)
SNR [dB]
@3 MHz
SNR [dB]
@6 MHz
SNR [dB]
@10 MHz
SNR [dB]
@15 MHz
SNR [dB]
@20 MHz
Effect on the transfer rate
- - - - - No effect. 7.3 Mbps
25 16 4 14 18 Oscillation between 7.3
Mbps and 4.8 Mbps, most of the time at 7.3 Mbps
24 8 -2 8 12 Identical as before
17 7 -6 8 10 Oscillation with a lowest rate at about 3.8 Mbps
15 6 -8 8 10
Oscillation between 7.3 Mbps and 4.8 Mbps but
most of the time remaining at 4.8 Mbps
15 6 -9 7 10 Identical as before The transfer rate was disturbed lightly. Even with a SNR@10MHz of -9dB, the
transfer rate stayed at 4.8Mbps.
9.2.5.3 Remark
We can make several remarks about the disturbance reaction: The Homeplug system is essentially undisturbed by static narrowband signals. Although dynamic narrowband signals disturb the Homeplug system by
reducing the throughput, the communication does not be shut down. As with dynamic narrowband disturbances, wideband signals disturb the
Homeplug system but not to kill the communication altogether. In light of the results presented in this chapter, we can conclude that the HomePlug
system is very robust.

EMC ANALYSIS OF POWERLINE SYSTEMS JULY 2004
41
10 SUMMARY AND CONCLUSION
At present, Homeplug compliant devices represent by far the biggest market share of
the Indoor PLC modem market. The HomePlug specification was prepared by a consortium of some of the biggest telecommunications companies. The HomePlug modem market is developing rapidly. Compliant modems can be bought in many stores in Switzerland.
Most radiation problems in Europe are likely to come from the HomePlug modems
since currently available Access systems are not attractive enough for the consumer due in part to the fact that the ADSL and cable modem technologies are very well established.
This project began last year, when the HomePlug modem market in Europe was in its early stages of development. While only a few stores carried HomePlug modems then, practically every computer store sells these products nowadays at prices half as high as last year’s.
The standards are all different. Every state or continent specifies its own standards
and it is therefore difficult to compare them correctly. American standards (FCC part 15) are much more permissive than European Standards (EN55022)
The European standard will be modified soon but it is not yet known whether or not HomePlug will become compliant with EN55022.
In Section 7, we presented the conversion factor between radiated and conducted measurements determined from a document from France Telecom [9]. We did not verify this factor in real measurements. Work is in the planning stages to carry out this verification using a special setup in an open area site in the near future.
The performance of the HomePlug modems tested in the course of this project can
be qualified as good. A network can be established very fast in most cases and the network is resilient to narrowband interference.
All HomePlug modems are similar in the following points:
• The functionalities and performance in a Windows 2000 environment • The current behaviour with under different load conditions on the line • The radiated electrical field
The observed differences were small enough to be neglected. Perhaps one of the most important conclusions of this study is that
HomePlug modems did not respect the EN55022 standard. Their emissions are at least 25 dB above the specified limit for the HomePlug Frequency band.

EMC ANALYSIS OF POWERLINE SYSTEMS JULY 2004
42
11 REFERENCES
[1] Prof Michel Ianoz “Electromagnetic effects due to PLC and work progress in different standardization bodies” November 2002
[2] M. K. Lee, R. E. Newman, H. A. Latchman, S. Katar and L. Yonge “HomePlug 1.0 powerline communication LANs-protocol description and performance results” May 2003
[3] American standard “FCC part 15” [4] European standard “CISPR22 Fourth edition” 2003 [5] FrequBZPV “Reg TP 322 MV 05 Part 1” October 2001 [6] Radio communications agency “MPT1570 Radiation limits and measurement
specification” january 2003 [7] Holger Hirsch “Radiation of PLC Systems” [8] CISPR/I/44/CD “EMC of Information technology, multimedia equipment and
receivers” December 2002 [9] France Telecom R&D “EMC aspects of Power Line Telecommunication”

EMC ANALYSIS OF POWERLINE SYSTEMS JULY 2004
43
12 APPENDIX
12.1 CURRENT BEHAVIOUR MEASUREMENTS
Figure 25: Current measurement: Top trace without load and bottom trace with 22Ω load
Figure 26: Current measurement: Top trace without additional load and bottom trace with 220Ω additional load

EMC ANALYSIS OF POWERLINE SYSTEMS JULY 2004
44
Figure 27: Current measurement: Top trace without additional load and bottom trace with a 2200Ω additional load
Figure 28: Detailed characteristic of the output stage from the Zeus bridge modem

EMC ANALYSIS OF POWERLINE SYSTEMS JULY 2004
45
Figure 29: Schematic to change the load of the powerline to measure the current behaviour
of the modems
Load
Modems 2x 220µH
2x 50nF
470 kΩ
Powerline

EMC ANALYSIS OF POWERLINE SYSTEMS JULY 2004
46
12.2 CORINEX MODEM
Figure 30: Conducted measurement of two Corinex modems in maximum transfer rate mode. (Quasi-Peak time = 500ms, Peak time = 2 ms, Average time = 10 ms and
BW=9kHz)
Figure 31: Conducted measurement of two Corinex modems in 1 Mbps transfer rate mode. (Quasi-Peak time = 500ms, Peak time = 2 ms, Average time = 10 ms and BW=9kHz)

EMC ANALYSIS OF POWERLINE SYSTEMS JULY 2004
47
Figure 32: Conducted measurement of two Corinex modems in standby mode. (Peak time
= 2 ms and BW=9kHz)
Figure 33: Conducted measurement of two Corinex modems. The red trace corresponds to the modems being in a transfer rate mode of 1 Mbps and the violet trace in maximum
transfer rate mode (Peak time = 2 ms and BW=9kHz)

EMC ANALYSIS OF POWERLINE SYSTEMS JULY 2004
48
12.3 DEVOLO MODEM
Figure 34: Conducted measurement of two Devolo modems in maximum transfer rate
mode. (Quasi-Peak time = 500ms, Peak time = 2 ms, Average time = 10 ms and BW=9kHz)
Figure 35: Conducted measurement of two Devolo modems in 1 Mbps transfer rate mode. (Quasi-Peak time = 500ms, Peak time = 2 ms, Average time = 10 ms and BW=9kHz)

EMC ANALYSIS OF POWERLINE SYSTEMS JULY 2004
49
Figure 36: Conducted measurement of two Devolo modems in standby mode. (Peak time
= 2 ms and BW=9kHz)
Figure 37: Conducted measurement of two Devolo modems. The red trace corresponds to
the modems operating at a transfer rate mode of 1 Mbps and the violet trace corresponds to maximum transfer rate mode (Peak time = 2 ms and BW=9kHz)

EMC ANALYSIS OF POWERLINE SYSTEMS JULY 2004
50
12.4 NIRODA MODEM
Figure 38: Conducted measurement of two Niroda modems in maximum transfer rate
mode. (Quasi-Peak time = 500ms, Peak time = 2 ms, Average time = 10 ms and BW=9kHz)
Figure 39: Conducted measurement of two Niroda modems in 1 Mbps transfer rate mode.
(Quasi-Peak time = 500ms, Peak time = 2 ms, Average time = 10 ms and BW=9kHz)

EMC ANALYSIS OF POWERLINE SYSTEMS JULY 2004
51
Figure 40: Conducted measurement of two Niroda modems in standby mode. (Peak time
= 2 ms and BW=9kHz)
Figure 41: Conducted measurement of two Niroda modems. The red trace corresponds to
the modems set to a transfer rate mode of 1 Mbps and the violet trace to the maximum transfer rate mode (Peak time = 2 ms and BW=9kHz)

EMC ANALYSIS OF POWERLINE SYSTEMS JULY 2004
52
12.5 MODEM ZEUS
Figure 42: Conducted measurement of two Zeus modems in maximum transfer rate mode.
(Quasi-Peak time = 500ms, Peak time = 2 ms, Average time = 10 ms and BW=9kHz)
Figure 43: Conducted measurement of two Zeus modems in 1 Mbps transfer rate mode.
(Quasi-Peak time = 500ms, Peak time = 2 ms, Average time = 10 ms and BW=9kHz)
EMC ANALYSIS OF POWERLINE SYSTEMS JULY 2004
53
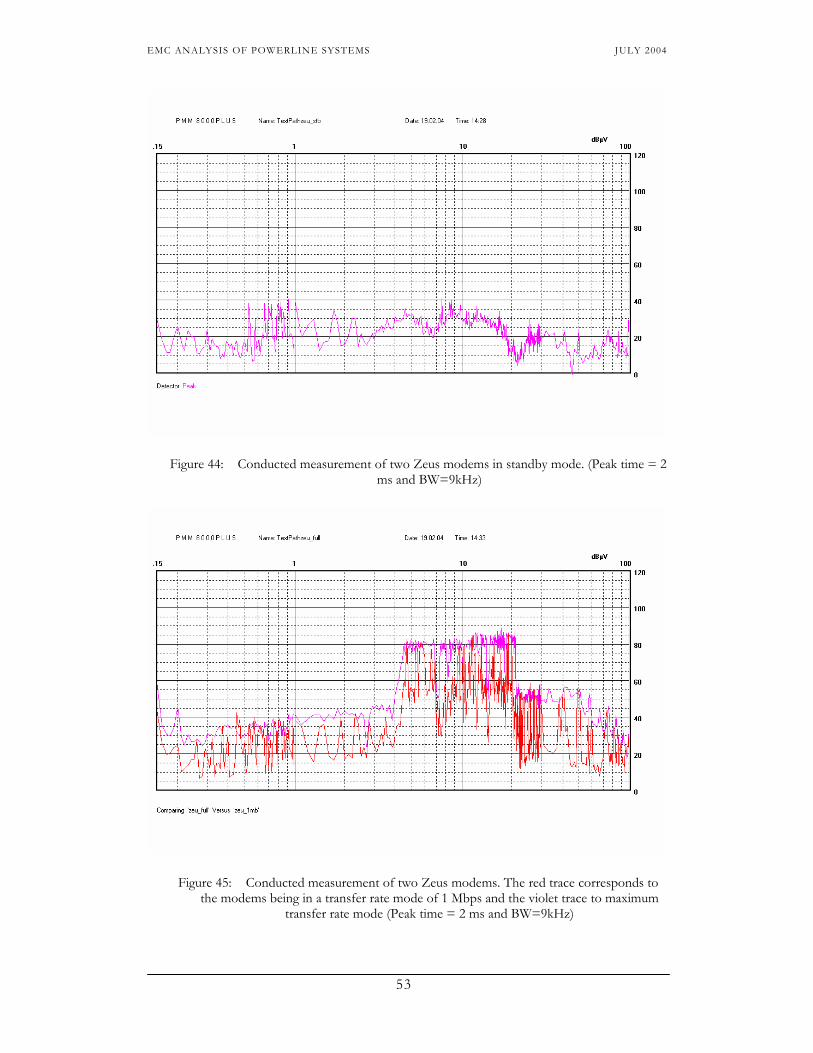
Figure 44: Conducted measurement of two Zeus modems in standby mode. (Peak time = 2
ms and BW=9kHz)
Figure 45: Conducted measurement of two Zeus modems. The red trace corresponds to
the modems being in a transfer rate mode of 1 Mbps and the violet trace to maximum transfer rate mode (Peak time = 2 ms and BW=9kHz)

EMC ANALYSIS OF POWERLINE SYSTEMS JULY 2004
54
12.6 ZEUS MODEM (WALL MOUNT USB)
Figure 46: Conducted measurement of two Zeus modems (wall mount usb) in maximum
transfer rate mode. (Quasi-Peak time = 500ms, Peak time = 2 ms, Average time = 10 ms and BW=9kHz)
Figure 47: Conducted measurement of two Zeus modems (wall mount usb) in 1 Mbps
transfer rate mode. (Quasi-Peak time = 500ms, Peak time = 2 ms, Average time = 10 ms and BW=9kHz)

EMC ANALYSIS OF POWERLINE SYSTEMS JULY 2004
55
Figure 48: Conducted measurement of two Zeus modems (wall mount usb) in standby
mode. (Peak time = 2 ms and BW=9kHz)
Figure 49: Conducted measurement of two Zeus modems (wall mount usb). The red trace
corresponds to the modems being in a transfer rate mode of 1 Mbps and the violet trace to maximum transfer rate mode (Peak time = 2 ms and BW=9kHz)

EMC ANALYSIS OF POWERLINE SYSTEMS JULY 2004
56
12.7 DECAMETRIC RADIO AMATEUR FREQUENCY BANDS
Table 28: Decametric frequency bands
Meter Band Frequency Band Homeplug removed carriers [MHz]
1750 meters 165-190 kHz 160 meters 1800-1950 kHz 80 meters 3.50-3.90 MHz 40 meters 7.00-7.30 MHz 7.03 MHz, 7.23 MHz 30 meters 10.10-10.15 MHz 10.2 MHz 20 meters 14.00-14.350 MHz 14.06 MHz 14.26 MHz 14.45 MHz 17 meters 18.068-18.168 MHz 17.97 MHz 18.16 MHz 15 meters 21.00-21.45 MHz 12 meters 24.89-24.99 MHz 11 meters 27.12 MHz 10 meters 28.00-29.70 MHz 6 meters 50.00-54.00 MHz 2 meters 144.0-148.0 MHz 0.7 meters 430-440 MHz

EMC ANALYSIS OF POWERLINE SYSTEMS JULY 2004
57
Figure 50: Conducted measurement of two Zeus modems in maximum transfer rate mode. (Peak time = 2 ms and BW=9kHz)
Figure 51: Conducted measurement of two Zeus modems in maximum transfer rate mode.
(Peak time = 2 ms and BW=9kHz)

EMC ANALYSIS OF POWERLINE SYSTEMS JULY 2004
58
Figure 52: Conducted measurement of two Zeus modems in maximum transfer rate mode.
(Peak time = 2 ms and BW=9kHz)
Figure 53: Conducted measurement of two Zeus modems in maximum transfer rate mode.
(Peak time = 2 ms and BW=9kHz)

EMC ANALYSIS OF POWERLINE SYSTEMS JULY 2004
59
12.8 RADIATED MEASUREMENTS SETUP
• The radiated measurements according to the EN55022 / CISPR16 norms. • Frequency measurements between 30 MHz and 240 MHz in tree parts
Table 29: PMM8000Pus measurement configuration
Frequency [MHz] 30 to 60 60 to 120 120 to 240
Step [kHz] 100 100 100 BW [kHz] 120 120 120 Peak time [ms] 2 2 2 Quasi-Peak time [ms] 500 500 500 • Determine the maximum radiated field for horizontal and vertical polarisation:
• Measurement with peak detector • Antenna height variation between 0.3m and 1.7m • 360° horizontal rotation of the modems under test with the turntable
• Final measurement for each orientation • Measurement with quasi-peak detector • Antenna height and turntable orientation according to the maximum
radiated field • Measurement configuration
Figure 54: Radiated measurements configuration
1
7
6 5
4
3 2
77 cm
1.5 m
3m1 Control computer 2 EMI Test signal analyser: PMM8000Plus 3 Amplifier: AR LM1000B 4 Bicone antenna: Schwarzbeck 9106 5 Powerline modems: Zeus bridge 6 Transfer and modem control computer 7 LISN: R&S ESH3-Z5 8 Turntable
Anechoic chamber
8

EMC ANALYSIS OF POWERLINE SYSTEMS JULY 2004
60
12.9 RADIATED MEASUREMENTS RESULTS WITH ZEUS BRIDGE MODEMS
Figure 55: Radiated measurement, horizontal polarisation (modem in maximum emission
mode)
Figure 56: Radiated measurement at 3m, vertical polarisation (modem in maximum emission mode)

EMC ANALYSIS OF POWERLINE SYSTEMS JULY 2004
61
Figure 57: Radiated measurement at 3m, horizontal polarisation (modems in maximum emission mode)
Figure 58: Radiated measurement at 3m, vertical polarisation (modems in maximum emission mode)

EMC ANALYSIS OF POWERLINE SYSTEMS JULY 2004
62
Figure 59: Radiated measurement at 3m, horizontal polarisation (Computers only without
modems)
Figure 60: Radiated measurement at 3m, vertical polarisation (Computers only without modems)

EMC ANALYSIS OF POWERLINE SYSTEMS JULY 2004
63
Figure 61: Radiated measurement at 3m, horizontal polarisation (modems in standby mode)
Figure 62: Radiated measurement at 3m, vertical polarisation (modems in standby mode)

EMC ANALYSIS OF POWERLINE SYSTEMS JULY 2004
64
12.10 COMPARISON BETWEEN INDOOR MODEMS
Table 30: Comparison between indoor modems
N° Manufacturer Port Type Homeplug Chipset Standards Web ATL60140 Archnet USB/ETH www.archnetco.com 102094 Conexant 1.0 CX11656 www.conexant.com USB-Homeplug Cogency USB Wall mount 1.0 Cogency FCC www.cogency.com PL9720-ETH Asoka ETH Wall mount 1.01 Intellon FCC www.asokausa.com PL9720-USB Asoka USB Wall mount 1.01 Intellon FCC www.asokausa.com F5D4070 Belkin ETH Wall mount yes (Intellon) www.belkin.com F5D4050 Belkin USB Wall mount yes (Intellon) www.belkin.com PE-902-EB Gigafast ETH Bridge 1.0 Cogency www.gigafast.com PE-909-UI Gigafast USB Wall mount 1.0 Cogency www.gigafast.com PE-901-UI Gigafast USB Bridge 1.0 Cogency www.gigafast.com PowerNet Corinex ETH/USB/PCI Bridge/Wall mount 1.01 Intellon FCC CE www.corinex.com Intelligent_PowerNet Corinex ETH Bridge 1.01 Intellon FCC CE www.corinex.com Wireless_PowerNet Corinex ETH/WLAN Bridge 1.01 Intellon FCC CE www.corinex.com dima ETH/USB Wall mount yes Intellon FCC CE EN NB30 www.power-surfer.com DHP-100 D-link ETH Wall mount 1.0 FCC CE www.d-link.com P-LAN Goldpfeil ETH/USB Bridge / Wall mount www.elcon-system.de RD51X1-USB Intellon USB Wall mount 1.0 Intellon FCC www.intellon.com GHPU21 IOGEAR USB Wall mount 1.0 Intellon www.iogear.com GHPU01 IOGEAR USB Bridge 1.0 Intellon www.iogear.com GHPB21 IOGEAR ETH Bridge 1.0 Intellon www.iogear.com Netplug Bridge lanergy ETH/USB Bridge yes Cogency FCC CE EN www.lanergy.com Netplug PCI lanergy ETH PCI card yes Cogency FCC CE EN www.lanergy.com PLUSB10 Linksys USB Wall mount 1.0 Intellon FCC www.linksys.com PLEBR10 Linksys ETH Bridge 1.0 Intellon FCC www.linksys.com XE602 Netgear ETH Bridge 1.0 Intellon FCC www.netgear.com

EMC ANALYSIS OF POWERLINE SYSTEMS JULY 2004
65
N° Manufacturer Port Type Homeplug Chipset Standards Web XA601 Netgear USB Bridge 1.0 Intellon FCC www.netgear.com XE102 Netgear USB Wall mount 1.0 Intellon FCC www.netgear.com NeverWire combo Phonex ETH/USB Wall mount 1.0 Intellon www.phonex.com NeverWire 14 Phonex ETH Bridge 1.0 Intellon www.phonex.com SS2501 Siemens USB Wall mount 1.0 Cogency FCC www.speedstream.com SS2502 Siemens ETH Wall mount 1.0 Cogency FCC www.speedstream.com SS2521 Siemens WLAN Wall mount 1.0 Cogency FCC www.speedstream.com SS2524 Siemens ETH Router 1.0 Cogency FCC www.speedstream.com M51 STT ETH Bridge 1.0 Intellon FCC CE www.stt.com.tw M53 STT ETH Wall mount 1.0 Intellon FCC CE www.stt.com.tw U21 STT USB Bridge 1.0 Intellon FCC CE www.stt.com.tw U22 STT USB Wall mount 1.0 Cogency FCC CE www.stt.com.tw U23 STT USB Wall mount 1.0 Intellon FCC CE www.stt.com.tw P11 STT ETH PCI card 1.0 Intellon FCC CE www.stt.com.tw DPL100 VCOMM ETH Bridge yes Intellon www.vcomm.com.au DPL100-U VCOMM USB Bridge yes Intellon www.vcomm.com.au 3574 zeus ETH Bridge 1.0 Intellon FCC CE www.broadband.ch 3575 zeus USB Wall mount 1.0 Intellon FCC CE www.broadband.ch enikia ETH Bridge yes Enikia www.enikia.com lugh ETH/USB Wall mount oui Cogency Microlink dlan devolo USB Wall mount yes Intellon CE EN www.devolo.de Microlink dlan devolo ETH Wall mount yes Intellon CE EN www.devolo.de MHP-21XX Microlink ETH/USB Wall mount 1.0 Intellon FCC www.microlinkcomm.com MHP-31XX Microlink ETH/USB Bridge 1.01 Intellon FCC CE EN www.microlinkcomm.com MHP-51XX Microlink ETH/USB Bridge 1.01 Intellon FCC CE EN www.microlinkcomm.com MHP-11XX Microlink Card 1.0 Intellon www.microlinkcomm.com
Data as of November 2003

EMC ANALYSIS OF POWERLINE SYSTEMS JULY 2004
66
12.11 COMPARISON BETWEEN OUTDOOR MODEMS
Table 31: Comparison between outdoor modems
Manufacturer Name N° Chipset DistanceMax bit rate Standards Modulation Frequency Web
ILEVO Central TPE 400m 45 Mbps CE www.ilevo.com Répéteur IR 400m 45 Mbps Home CPE 400m 45 Mbps
ASCOM Modem APA-45i/o
100m (indoor) 300m (outdoor)
2.25Mbps (indoor) 4.5Mbps (outdoor)
EN55022 NB30 CE GMSK
1.6MHz -12MHz (indoor) 15MHz -30MHz (outdoor) www.ascom.com
Gateway APG-45B
100m (indoor) 300m (outdoor)
2.25Mbps (indoor) 4.5Mbps (outdoor) GMSK
1.6MHz -12MHz (indoor) 15MHz -30MHz (outdoor)
Accès Point APM-45ap
100m (indoor) 300m (outdoor) 4.5Mbps sym GMSK
1.6MHz -12MHz (indoor) 15MHz -30MHz (outdoor)
Master APM-45o/i
100m (indoor) 300m (outdoor)
2.25Mbps (indoor) 4.5Mbps (outdoor) GMSK
1.6MHz -12MHz (indoor) 15MHz -30MHz (outdoor)
Mainnet Central CuPlus Itran (ds2 / Enikia)? 2.5Mbps NB30 ACSK 4MHz-20MHz www.mainnet-plc.com
Modem NtPlus 2.5Mbps ACSK 4MHz-20MHz Répéteur RpPlus 2.5Mbps ACSK 4MHz-20MHz Management NmPlus Ambient Central S-node DS2 www.ambientcorp.com Transformateur X-node Répéteur R-node Gateway GW-node

EMC ANALYSIS OF POWERLINE SYSTEMS JULY 2004
67
Manufacturer Name N° Chipset DistanceMax bit rate Standards Modulation Frequency Web
Ambient Modem U-node Xeline Gateway SM-100 samsung 400m 8Mbps FCC OFDM www.xeline.com Gateway MM-100 400m 8Mbps OFDM Central SU-100 400m 8Mbps OFDM CU-100 400m 8Mbps OFDM Management ES-100
CurrentTechnologies Central CT-Backhaul
www.currenttechnologies.com
Bridge CT-Bridge
Coupler CT-Coupler
Modem Modem Homeplug 1.0
Amperion Falcon 1000MV
45Mbps / 6 Mbps WiFi (HomePlug) www.amperion.com
Lynx 1000MV
45Mbps / 6 Mbps WiFi
PowerComm Modem www.powercommsystems.com
Coupler Repeater Management SCADA Easyplug indoor DS2 45Mbps www.easyplug.com outdoor Telkonet Modem 14Mbps www.telkonet.com Gateway 14Mbps Coupler DS2 www.ds2.es
Data as of November 2003

EMC ANALYSIS OF POWERLINE SYSTEMS JULY 2004
68
12.12 COMPARISON BETWEEN POWERLINE CHIPSETS
Table 32: Comparison between powerline chipsets
N° Manufacturer Homeplug 1.0 Max bit rate Modulation Frequency band Web CS1102 Cogency yes www.cogency.com Piranha Cogency yes 14Mbps www.cogency.com CX11656 Conexant yes 14Mbps OFDM www.conexant.com DSS4200 ds2 no 45Mbps OFDM 1MHz-38MHz www.ds2.es INT5130 Intellon yes OFDM www.intellon.com ITM1-BIP Itran no 2.5Mbps CDMA www.itrancomm.com VS6801 Telewise yes OFDM www.telewisecomm.com Valence yes
Data as of November 2003