ema efpia workshop breakout session 2 · ema efpia workshop breakout session 2 assessing the...
TRANSCRIPT
EMA EFPIA workshopEMA EFPIA workshop
Breakout Session 2Breakout Session 2
Assessing the Probability of Drug-Induced
QTc-Interval Prolongation During Early Clinical
Drug Development
Oscar Della PasquaGSK
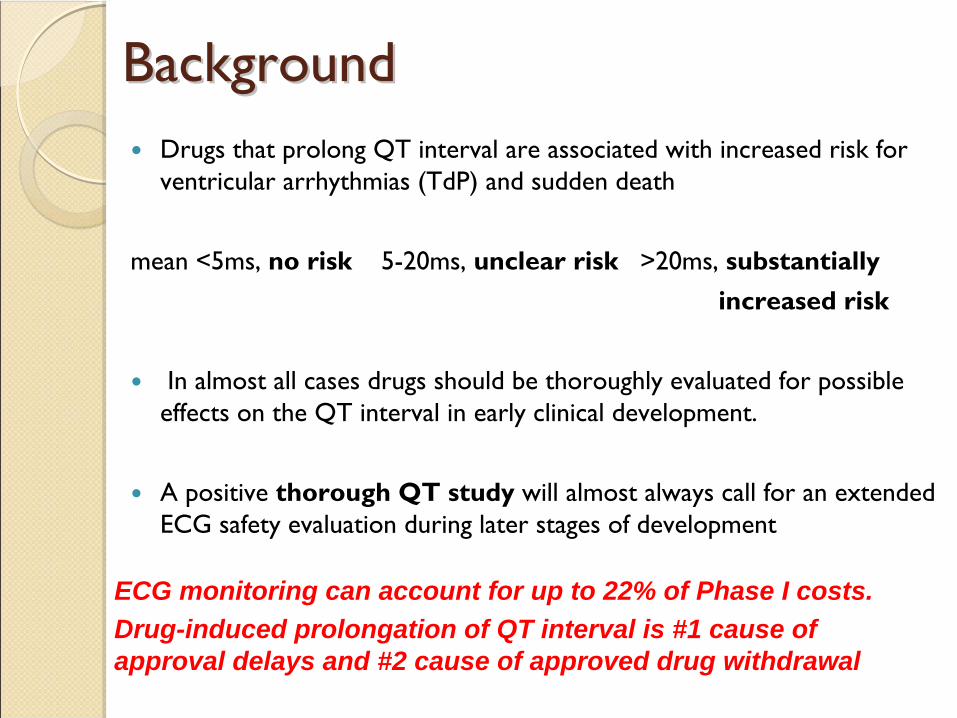
BackgroundBackground
ECG monitoring can account for up to 22% of Phase I costs.Drug-induced prolongation of QT interval is #1 cause of approval delays and #2 cause of approved drug withdrawal
Drugs that prolong QT interval are associated with increased risk for ventricular arrhythmias (TdP) and sudden death
mean <5ms, no risk
5-20ms, unclear risk
>20ms, substantiallyincreased risk
In almost all cases drugs should be thoroughly evaluated for possible effects on the QT interval in early clinical development.
A positive thorough QT study will almost always call for an extended ECG safety evaluation during later stages of development

Background Background -- TQTTQT
Issues with double-delta method◦
Exposure information is not taken into consideration
◦
Possible high false-positive rates
Time
Q
Tc
a negative TQT is one in which the upper bound of the 95% one-sided confidence interval for the largest time-matched mean effect of the drug on the QTc interval excludes 10 ms
10 ms threshold
ICH E14 –
recommends the double-delta methods for
analysing and interpreting ECG findings

Modelling of QT interval prolongationModelling of QT interval prolongation
CslopetARRQTQT
)(
242cos0
individual heart rate correction circadian rhythm exposure-effect
•QT0
is the intercept of the QT-RR relationship
•Sex included as covariate
•Inter-occasion variability
•α
–
individual heart rate correction factor (Fredericia α
= 0.33, Bazett α
= 0.5)
•C is the predicted concentration of drug at time of ECG measurement
We propose the use of a parametric Bayesian approach to describe
QT interval and assess the probability of prolongation during First-Time-in-
Human trials
0 500 1000 1500 2000 2500 3000 3500
0.0
0.2
0.4
0.6
0.8
1.0
Concentration Moxifloxacin (ng/ml)P
roba
bilit
y of
an
Incr
ease
in Q
T of
>10
ms
0 500 1500 2500 3500
02
46
810
1214
Concentration Moxifloxacin (ng/ml)
Incr
ease
in Q
T (m
s)

FTIH StudiesFTIH Studies
What is a FTIH study?◦
Phase I program during which PK, PD, safety and tolerability are evaluated◦
Traditionally small, dose escalated◦
Healthy volunteers or patients may be included
Can modelling of FTIH study data provide evidence of a compound’s liability for QTc interval prolongation?
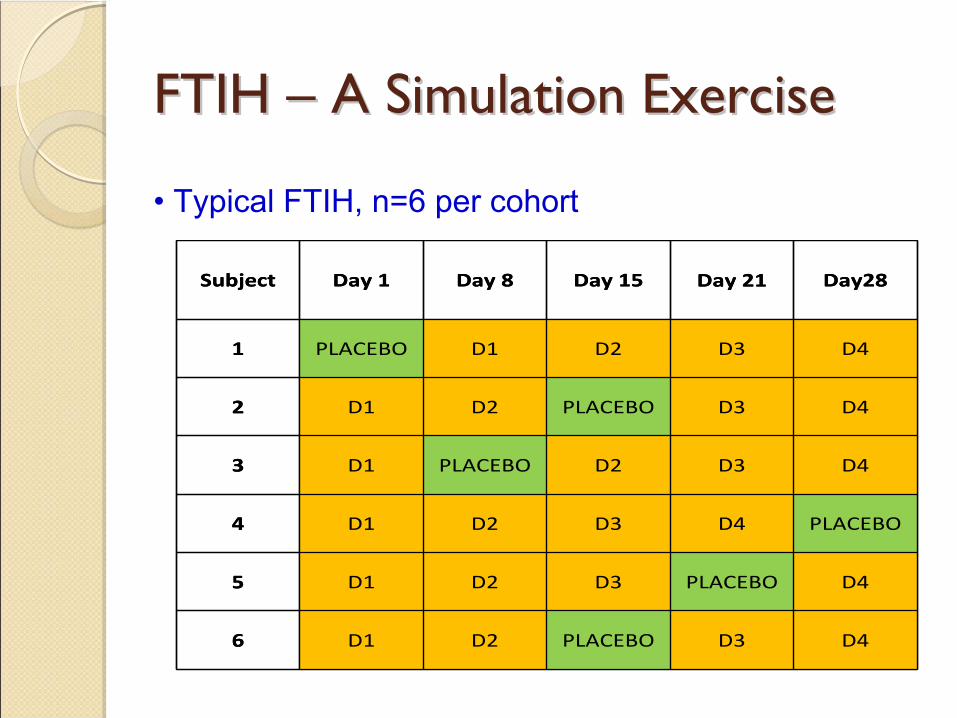
FTIH FTIH –– A Simulation Exercise A Simulation Exercise
• Typical FTIH, n=6 per cohort
Subject Day 1 Day 8 Day 15 Day 21 Day28
1 PLACEBO D1 D2 D3 D4
2 D1 D2 PLACEBO D3 D4
3 D1 PLACEBO D2 D3 D4
4 D1 D2 D3 D4 PLACEBO
5 D1 D2 D3 PLACEBO D4
6 D1 D2 PLACEBO D3 D4
Subject Day 1 Day 8 Day 15 Day 21 Day28
1 PLACEBO D1 D2 D3 D4
2 D1 D2 PLACEBO D3 D4
3 D1 PLACEBO D2 D3 D4
4 D1 D2 D3 D4 PLACEBO
5 D1 D2 D3 PLACEBO D4
6 D1 D2 PLACEBO D3 D4

• Modified FTIH, n=6 per cohort
Subject Day 1 Day 8 Day 15 Day 21 Day28 Day 35
1 PLACEBO D1 D2 D3 D4 MOXI
2 D1 D2 PLACEBO D3 D4MOXI
3 D1 PLACEBO D2 D3 D4MOXI
4 D1 D2 D3 D4 PLACEBOMOXI
5 D1 D2 D3 PLACEBO D4MOXI
6 D1 D2 PLACEBO D3 D4MOXI
Subject Day 1 Day 8 Day 15 Day 21 Day28 Day 35
1 PLACEBO D1 D2 D3 D4 MOXI
2 D1 D2 PLACEBO D3 D4MOXI
3 D1 PLACEBO D2 D3 D4MOXI
4 D1 D2 D3 D4 PLACEBOMOXI
5 D1 D2 D3 PLACEBO D4MOXI
6 D1 D2 PLACEBO D3 D4MOXI
FTIH FTIH –– A Simulation Exercise A Simulation Exercise

Comparison Comparison -- protocol designs protocol designs
TQT◦
3 pre-dose baseline obs.◦
13 post-dose obs.
◦
Crossover, placebo controlled, single dose◦
N = 16, 30, 46, 60◦
Analysis method: double-delta
FTIH◦
3 pre-dose baseline obs.◦
12 post-dose obs.
◦
Crossover, placebo controlled, dose escalation◦
N = 12, 18, 27◦
Analysis method: Bayesian hierarchical model

M&S Results M&S Results ––
FTIH typical designFTIH typical design
QT-prolonging drug Negative control
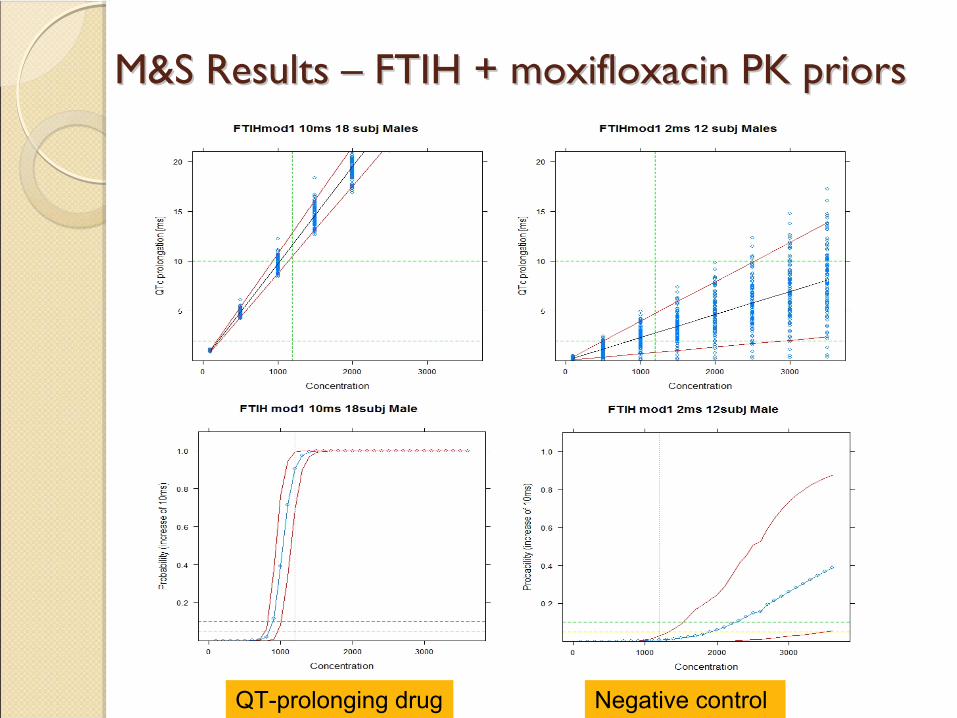
M&S Results M&S Results ––
FTIH + moxifloxacin PK priorsFTIH + moxifloxacin PK priors
QT-prolonging drug Negative control

Sensibility/ SpecificitySensibility/ Specificity
TQT
CRbl 16 CRbl 30 CRbl 46 CRbl 600,71 0,965 0,94 1
1 1 1 11 1 1 11 1 1 1
SpecificitySensitivitySpecificitySensitivity
DD
BUGS
4 ms var on SLP
False positive ratesCrossover 2 ms Crossover 5 ms Crossover 10 ms

False Negative / False Positive RatesFalse Negative / False Positive Rates
Bayesian with P(10 ms inc)>99%
Bayesian with P(10 ms inc)>95%
Bayesian with P(10 ms inc)>90%
FTIH
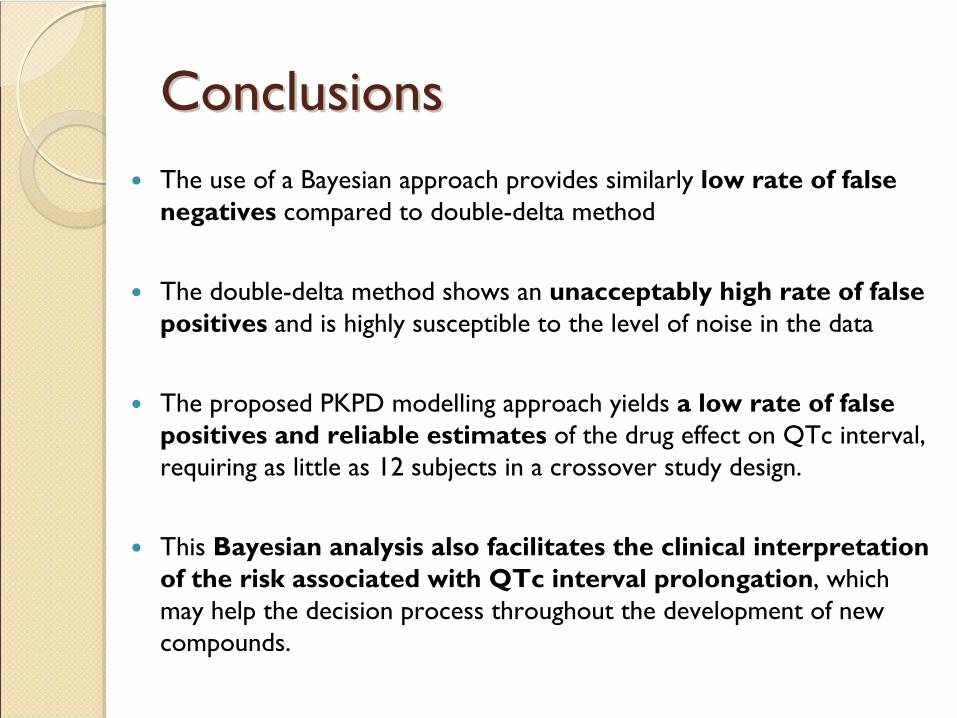
ConclusionsConclusions
The use of a Bayesian approach provides similarly low rate of false negatives compared to double-delta method
The double-delta method shows an unacceptably high rate of false positives
and is highly susceptible to the level of noise in the data
The proposed PKPD modelling approach yields
a low rate of false positives and reliable estimates
of the drug effect on QTc interval,
requiring as little as 12 subjects in a crossover study design.
This Bayesian analysis also facilitates the clinical interpretation of the risk associated with QTc interval prolongation, which may help the decision process throughout the development of new compounds.

Backup slidesBackup slides
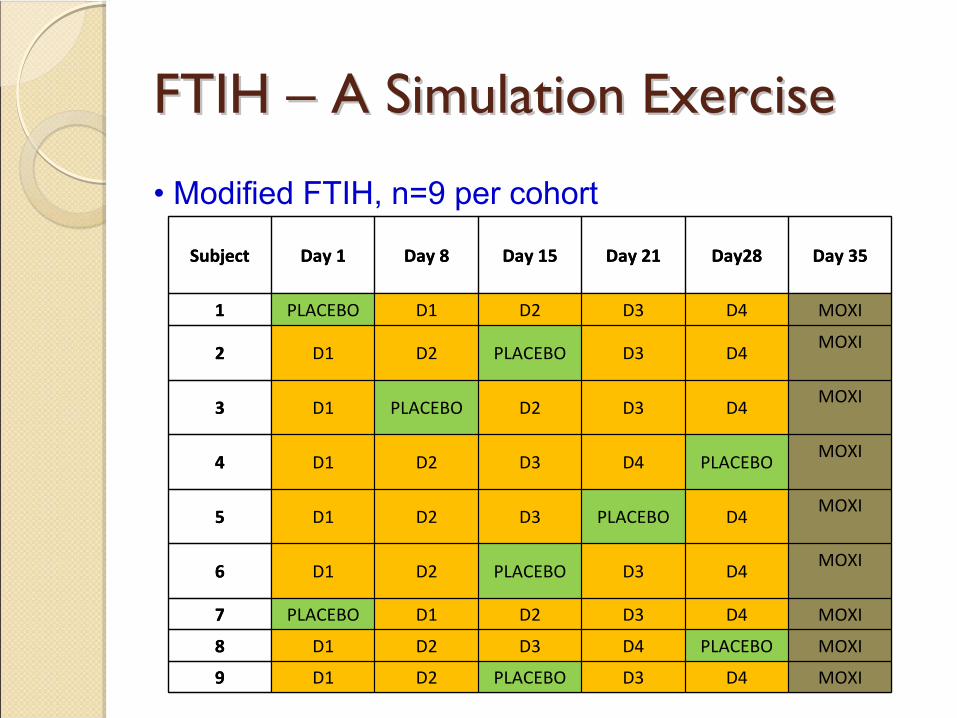
• Modified FTIH, n=9 per cohort
Subject Day 1 Day 8 Day 15 Day 21 Day28 Day 35
1 PLACEBO D1 D2 D3 D4 MOXI
2 D1 D2 PLACEBO D3 D4MOXI
3 D1 PLACEBO D2 D3 D4MOXI
4 D1 D2 D3 D4 PLACEBOMOXI
5 D1 D2 D3 PLACEBO D4MOXI
6 D1 D2 PLACEBO D3 D4MOXI
7 PLACEBO D1 D2 D3 D4 MOXI
8 D1 D2 D3 D4 PLACEBO MOXI
9 D1 D2 PLACEBO D3 D4 MOXI
Subject Day 1 Day 8 Day 15 Day 21 Day28 Day 35
1 PLACEBO D1 D2 D3 D4 MOXI
2 D1 D2 PLACEBO D3 D4MOXI
3 D1 PLACEBO D2 D3 D4MOXI
4 D1 D2 D3 D4 PLACEBOMOXI
5 D1 D2 D3 PLACEBO D4MOXI
6 D1 D2 PLACEBO D3 D4MOXI
7 PLACEBO D1 D2 D3 D4 MOXI
8 D1 D2 D3 D4 PLACEBO MOXI
9 D1 D2 PLACEBO D3 D4 MOXI
FTIH FTIH –– A Simulation Exercise A Simulation Exercise

Simulation MethodSimulation Method
QTc
Conc
Mean
effect
baselineQTc0
Δy
Δx
CmaxConcentrations from PK model
QTc
Slope = Δy/Δx
Variability = 1 or 4 ms

M&S Results M&S Results ––
FTIH + moxifloxacin armFTIH + moxifloxacin arm
QT-prolonging drug Negative control

DefinitionsDefinitions
•
Definition of false positive (drug effect = 2 or 5 ms): Double-delta or Bayesian analysis does detect >10 ms effect
•
Definition of false negative (drug effect =10 ms): Double-delta or Bayesian analysis does not detect >10 ms effect
ReferencesReferences
1. Chain, A.S.Y., Krudys, K., Danhof, M., Della Pasqua, O.
Assessing the Probability of Drug-Induced QTc-Interval Prolongation During Clinical Drug Development.
Clin Pharmacol Ther 90, 867-875 (2011).
2. Anne Chain, Francesco Bellanti, Meindert
Danhof, Oscar Della Pasqua.
Can First-Time-In-Human Trials Replace Thorough QT Studies?, PAGE 20 (2011) Abstr
2172 [www.page-meeting.org/?abstract=2172]