elsevier editorial system(tm) for global environmental...
TRANSCRIPT

Elsevier Editorial System(tm) for Global
Environmental Change
Manuscript Draft
Manuscript Number:
Title: Global typology of coastal urban vulnerability under rapid
urbanization
Article Type: Research paper
Keywords: Coastal cities; cluster analysis; vulnerability-generating
mechanism; socio-ecological system; quantitative indication
Corresponding Author: Dipl-Geogr. Till Sterzel,
Corresponding Author's Institution: climate-babel
First Author: Till Sterzel
Order of Authors: Till Sterzel; Matthias Lüdeke, Dr.; Carsten Walther;
Marcel T Kok; Diana Sietz, Dr.; Paul L Lucas
Manuscript Region of Origin: Southeast Asia
Abstract: Coastal urban areas are urbanizing at unprecedented rates -
particularly in non-OECD countries. Combinations of long-standing and
emerging challenges generate vulnerability by threatening human well-
being and ecosystems alike. On an intermediate scale of complexity this
study provides a first spatially explicit global systematization of these
heterogeneous challenges into typical urban vulnerability profiles using
largely sub-national data. A cluster analysis of urban expansion, urban
population growth, marginalization, government effectiveness, exposures
and sensitivities to climate-related extreme events, low-lying
settlement, and wetland prevalence reveals a global typology of seven
clearly distinguishable urban vulnerability profiles. These profiles have
typical combinations of vulnerability-generating mechanisms and processes
assigned to them. Using ample city case studies for testing the
plausibility, we show that combinations of such mechanisms in extreme
forms are driving vulnerability in the profiles, and which coastal
locations are similar in this regard. Climate extreme vulnerability and
government effectiveness further differentiate the huge asymmetries in
coastal urban vulnerability. Against the background of underlying global
trends we point out profile characteristics that can have implications
for prioritizing systemic responses and future case studies, and then
propose entry points for generic profile-based vulnerability reduction.
Our findings contribute new insights into opportunities for sharing
experience and vulnerability reducing measures between socio-ecologically
similar urban areas in the rapidly urbanizing coastal fringe.
Till Sterzel Lindenstraße 11 14467 Potsdam +49 (0)170 9333 581 [email protected]
Global Environmental Change Editorial Office
Potsdam, October 1st, 2015
Dear Editorial Office:
This letter is to request the review of the submitted manuscript „Global typology of
coastal urban vulnerability under rapid urbanization“ for publication in Global
Environmental Change.
The manuscript is the result of a research collaboration of researchers from the Potsdam
Institute for Climate Impact Research (PIK), the Netherlands Environmental Assessment
Agency (PBL), Wageningen University, and climate-babel.
I have suggested four reviewers based on content-related and methodological expertise
regarding the submitted manuscript.
Thank you for your time and consideration.
Sincerely,
Till Sterzel
Cover Letter
Global typology of coastal urban vulnerability under rapid
urbanization
Till Sterzel#*, Matthias K.B. Lüdeke*, Carsten Walther*, Marcel T. Kok+, Diana Sietz++, Paul L. Lucas+
#climate-babel, Lindenstraße 11, 11467 Potsdam
*Potsdam Institute for Climate Impact Research, Research Domain II – Climate Impacts and Vulnerabilities,
Telegraphenberg, 14473 Potsdam, Germany
+ PBL Netherlands Environmental Assessment Agency, 3720 AH Bilthoven, The Netherlands
++ Wageningen University and Research Centre, Sociology of Development and Change, Hollandseweg 1, Bode 18, 6706 KN
Wageningen, The Netherlands
Corresponding author: Till Sterzel, [email protected]
Acknowledgements
The authors acknowledge the financial support from the Federal Ministry for the Environment, Nature
Conservation, and Nuclear Safety of Germany who supports this work within the framework of the
International Climate Protection Initiative. The funders had no role in study design, data collection and analysis,
decision to publish, or preparation of the manuscript.
This research was funded in part by the Netherlands Environmental Assessment Agency (PBL) Project E555075.
We thank Henk Hilderink for helpful discussions on the methodology. We also thank Steffen Kriewald for
valuable support in comparing different global digital elevation models.
*Title page (with author details, acknowledgements or affiliations)
Global typology of coastal urban vulnerability under rapid
urbanization
Abstract
Coastal urban areas are urbanizing at unprecedented rates – particularly in non-OECD countries. Combinations
of long-standing and emerging challenges generate vulnerability by threatening human well-being and
ecosystems alike. On an intermediate scale of complexity this study provides a first spatially explicit global
systematization of these heterogeneous challenges into typical urban vulnerability profiles using largely sub-
national data. A cluster analysis of urban expansion, urban population growth, marginalization, government
effectiveness, exposures and sensitivities to climate-related extreme events, low-lying settlement, and wetland
prevalence reveals a global typology of seven clearly distinguishable urban vulnerability profiles. These profiles
have typical combinations of vulnerability-generating mechanisms and processes assigned to them. Using
ample city case studies for testing the plausibility, we show that combinations of such mechanisms in extreme
forms are driving vulnerability in the profiles, and which coastal locations are similar in this regard. Climate
extreme vulnerability and government effectiveness further differentiate the huge asymmetries in coastal
urban vulnerability. Against the background of underlying global trends we point out profile characteristics
that can have implications for prioritizing systemic responses and future case studies, and then propose entry
points for generic profile-based vulnerability reduction. Our findings contribute new insights into opportunities
for sharing experience and vulnerability reducing measures between socio-ecologically similar urban areas in
the rapidly urbanizing coastal fringe.
Keywords: Coastal cities, cluster analysis, vulnerability-generating mechanism, socio-ecological system,
quantitative indication
Introduction
Urbanization is a defining phenomenon of our time (Hoornweg et al. 2011). Having reached 3.2 bn in 2011
(UNDESA 2012), urban population has increased by over factor four since 1950, and has lead to a concentration
of 40% of the world’s population on a narrow coastal band that takes up 7% of the Earth’s surface (McGranahan
et al. 2007). The locus of the most rapid urbanization is the developing world, where more than 95% of the net
global population increase is projected to be concentrated in cities in the coming decades (UNDESA 2012;
UNDESA 2008). Cities are disproportionately located along rivers and coastlines (Grimm et al. 2008). Urban
areas are generally more coastal than rural areas (McGranahan et al. 2007), and urban areas are growing faster
on coasts than inland (Seto et al. 2011a; McGranahan et al. 2007). Although the bulk of world population
growth is taking place in small and medium-sized cities (Grubler et al. 2012), they are commonly overlooked in
favor of larger and more iconic cities in case studies and meta-analyses.
Rapid urbanization is further contextualized by biophysical and socioeconomic characteristics operating on
multiple temporal and spatial scales. Urban life is radically changing its coastal environments through
unmanaged population increase (Grimm et al. 2008), urban expansion (Seto et al. 2011a), and resource demand
(Bloom 2011). At the same time, coastal cities are heavily influenced by global change, and particularly at risk of
flooding due to tropical storms and sea-level rise (Handmer et al. 2012). All of these characteristics can assume
extreme forms in coastal urban areas.
Altogether, long-standing and emerging challenges are compounding in coastal cities due to the magnitude
and acceleration of transitions (Tanner et al. 2009). These challenges risk to outpace efforts to reduce
vulnerability in urban areas in rapidly growing low- and middle-income nations (O’Brien et al. 2012; UN-HABITAT
2011a; UNISDR 2011) by increasing exposures and sensitivities in urban populations and ecosystems alike
(McGranahan et al. 2007), and overstretching municipal management and planning capacities (Grubler et al.
2012; Prasad et al. 2009).
Manuscript (including figures and tables, w/o author details)Click here to view linked References

Despite these converging characteristics in coastal urban areas across the developing world, and the resulting
increases in vulnerability of their populations to them, there is a lack of integrating studies on a global scale
that systematize these human-environment interactions. For example, Garschagen & Romero-Lankao (2013)
point out the greater scientific attention the linkages between different components of vulnerability deserve
under urbanization, because it can identify entry points to enhance adaptive capacity at the national level.
Regional and local case study literature shows that vulnerability in fast-growing urban coastal zones is
heterogeneous, and that the challenges outlined above are unevenly distributed geographically. This makes it
challenging to scale up successful vulnerability-reducing measures (Sietz et al. 2011). At the same time, there is
a need for regional or global-coverage vulnerability (reduction) analysis, which requires generic insights that
acknowledge local specifics and still constitute a global picture. Highlighting in how far outcomes of case
studies are also characteristic or relevant for similar urban areas elsewhere could contribute to scaling up
successful vulnerability-reducing measures through transfer between urban areas that are systematically
similar.
In view of this scaling challenge and the need for an integrated perspective on the forces shaping the
vulnerability of cities, a number of studies have used integrated qualitative and quantitative methods for
systematizing generic global overviews of socio-ecological problems. On a subnational level, Kok et al. (2015;
2010) and Sietz et al. (2011) characterize and map the typical mechanisms and processes influencing livelihoods
in global drylands regarding their socio-ecological vulnerability. The typical mechanisms and processes provide
entry points for scaling up vulnerability reducing measures. Focusing on large, densely populated, rapidly
growing urban areas, yet on a national scale, Kropp et al (2001) and Lüdeke et al (2004) characterize a typical
cause-effect “favela syndrome” and categorize countries according to the dynamics and intensity of this
exemplary non-sustainable human-environment interaction. Crona et al (2015) use social–ecological syndromes
to understand impacts of international seafood trade on small-scale fisheries. They identify three distinct
syndromes, with the degree of institutional enforcement playing a key role throughout.These approaches are
based on the hypothesis that it is possible to identify a limited number of typical dynamic cause-effect
relationships at an intermediate level of complexity which allow to subsume comparable case studies of socio-
ecological problems across the globe. Other studies focus on human-environment problems based on present
or projected future climatic risks in a limited number of coastal cities or urban areas. McGranahan et al (2007)
assess the geographic- and climate change-related risks for urban settlement in the heavily populated low
elevation coastal zone (LECZ). Hanson et al (2011) and Hallegatte et al (2013) quantify current and future
economic impacts of climate change-induced sea level rise and flooding for 3o and 136 coastal cities using
future climate projections, respectively. Tanner et al. (2009) assess climate change resilience in ten rapidly
urbanizing cities in predominantly coastal settings in developing countries. De Sherbinin et al (2007) examine
vulnerabilities of three coastal megacities to current and future climate hazards using a vulnerability
framework considering multiple synergistic stresses and socio-ecological characteristics.
To our knowledge, this paper is the first spatially explicit study to systematize urban vulnerability under rapid
urbanization in the global coastal fringe. We present a global systematization of rapidly growing urban coasts
according to typical manifestations of mechanisms and processes that increase urban vulnerability under
forces of global change. Using sub-national and national data we systematically profile the current situation in
these urban areas on an intermediate level of complexity based on quantifying similarities in their socio-
ecological problems. For this we apply a formalized method based on clustering (Kok et al. 2015; Janssen et al.
2012) which has been applied before to identify and interpret general mechanisms which similarly create
vulnerability in global drylands on regional and local scales (Sietz 2014; Sietz et al. 2012; Sietz et al. 2011; Kok et
al. 2010). We address and answer the following research questions:
(1) In how far do urban coasts share characteristic, typical mechanisms making them vulnerable under rapid
urbanization?
(2) How are these areas positioned to deal with these mechanisms and reduce vulnerability?

Methods and data
Our method for systematizing how and where vulnerability is typically generated follows a method of
vulnerability analysis on an intermediate level of complexity and spatial scale proposed by Kok et al (2015). It
consists of the following steps: Drawing from a multitude of vulnerability-generating mechanisms documented
in the literature we list and briefly characterize well-documented mechanisms that have been found to typically
generate vulnerability in coastal urban areas. Then we identify indicator datasets that render information on
the most important dimensions of the vulnerability-creating mechanisms. Finally, we subject these indicators
to an established cluster analysis (Janssen et al. 2012; Lüdeke et al. 2014) to address in how far and where
typical combinations of the vulnerability-creating mechanisms occur. Thereby each resulting cluster signifies an
urban vulnerability profile.
Vulnerability-generating mechanisms and processes
First we clarify the use of specific terminology. We understand a vulnerability-generating mechanism as a
cause-effect relationship in which a vulnerability relevant process a drives b (e.g. rapid urban population
increase a drives urban expansion b). Thereby the mechanism is that a drives b, while b can be driven by
multiple processes. A vulnerability-generating process is a progressing vulnerability-relevant phenomenon, and
can generate vulnerability through one or multiple mechanisms. The introduction of this paper shows that the
process of rapid urban population increase (a) generates urban vulnerability through a variety of mechanisms.
Through an extensive literature review we now specify seven typical mechanisms that generate vulnerability in
situations of rapid coastal urbanization, and give examples of cities where they have been documented. They
reflect the complex interplay between socioeconomic and biophysical factors, and show linkages between
each other. We continue the numeration from above, notwithstanding rapid urban population increase’s role
as the main process and driver.
Urban expansion (b) - Urban land expansion is driving large-scale land cover change in developing countries
across the globe (Seto et al. 2012; Seto et al. 2011a). Less-developed countries are generally experiencing much
higher levels of both urban expansion and its main driver – rapid population growth (Angel 2011). Importantly
so, urban expansion is faster in low elevation coastal zones than in other places (Seto et al. 2011a). Thereby
exposure to climate extremes is typically increased (UN-HABITAT 2011a). This mechanism has been exemplarily
documented for coastal cities including Accra, Bangkok (Shlomo 2011), Tel Aviv, Algiers, and Manila (Angel et
al. 2010).
Wetland loss (c) - Wetlands and floodplains provide important functions and services for the urban and
surrounding populations, e.g. flood regulation functions for attenuating negative consequences of climate
extremes (Costanza et al. 2008). Unchecked urban expansion is leading to unprecedented degradation and
destruction of such coastal ecosystems through increased demand for land (Baird 2009) and encroachment
(Seto et al. 2012; McGranahan et al. 2007; Bravo de Guenni et al. 2005). The degradation of these functions
through encroachment has increased urban inhabitants’ exposure and sensitivity to floods (Bravo de Guenni et
al. 2005; Hardoy et al. 2001), and has serious implications for the livelihoods of societies dependent on their
functions or services (Nicholls 2004). This was illustrated in New Orleans through Hurricane Katrina in 2005
(Törnqvist & Meffert 2008).
d) Management overstretch - Rapid urbanization is increasing the vulnerabilities in urban populations by
overstretching municipal management and planning capacities (Grubler et al. 2012; Prasad et al. 2009; Tanner
et al. 2009). The rapid endogenous and exogenous urban growth can overwhelm basic urban services,
especially if municipal adaptive capacity is initially low. This comes as new challenges arise before long-standing
ones have been dealt with (Tanner et al. 2009). For example, future increase of climate change is poised to
further stretch management capacities in coastal areas (Alam & Rabbani 2007, Dodman et al. 2011, De Sherbinin
et al. 2007). This mechanism of overstretched management and planning has exemplarily been illustrated in
case studies from Dhaka (Alam & Rabbani 2007), Dar es Salaam (Dodman et al. 2011), and Mumbai (De
Sherbinin et al. 2007). We subsume management and planning under “management” in the following.
e) Marginalization - Rapid population increase is often absorbed into the urban fabric through an increase of
densely populated informal settlements (Prasad et al. 2009). The growth of informal settlements has been
largely driven by poverty and marginalisation of poor and less equipped populations in and around megacities
in many developing countries (Bravo de Guenni et al. 2005; Douglas et al. 2008) and is frequently
underestimated (Kit & Lüdeke 2013). Such settlements have less capacities to deal with shocks, e.g. climate
extremes (Handmer et al. 2012; Huq et al. 2007; Hardoy et al. 2001) such as tropical cyclones and floods
(Handmer & Dovers 2007), and less capacities to deal with subsequent negative impacts (Bull-Kamanga 2003).
This particularly holds true where poor management, and low building and infrastructure quality coincide with
densely populated areas (Prasad et al. 2009). This mechanism has been observed in numerous coastal cities in
India (Revi 2008), or Iliolo City in the Phillipines (Rayos Co 2010).
f) Vulnerable settlement development – Under inadequate urban planning and unchecked growth informal
settlements outlined above commonly encroach more risk-prone areas where exposure to floods and cyclones
is high (Cardona et al. 2012; Kit et al. 2011; Satterthwaite 2007). These areas are avoided by wealthier groups
due to their higher exposure (Prasad et al. 2009). This leads to an increase in vulnerable populations and
population density with low building qualities in floodplains. This mechanism has been observed in cities such
as Lagos (Adelekan 2010), Mumbai (Chatterjee 2010), and Esmeraldas, Ecuador (Luque et al. 2013), and for
many urban poor in large African coastal cities (Douglas et al. 2008).
g) Generation of exposure and sensitivity to climate extremes - Rapid and unplanned urbanization is a key
driver of vulnerability to climate extremes (Cardona et al. 2012). Coastal cities are already disproportionately
exposed and sensitive to climate extremes, e.g. cyclones (Hanson et al. 2011; Nicholls et al. 2007) and floods
(Mondal & Tatem 2012; Hanson et al. 2011), which threaten human well-being (Handmer et al. 2012). Sections of
most of the largest cities on the African coast are currently at risk of flooding (IPCC 2012; Adelekan 2010; Awuor
et al. 2008). Exemplary cities subject to climate extremes include Dhaka (storm surges, UN-HABITAT 2011a)
Sorsogon City, Philippines (Taifuns, Button et al. 2013), Mumbai, Rio de Janeiro, Shanghai (Floods, De Sherbinin
et al. 2007).
h) Sea-level rise driven settlement exposure - While future estimates of the number of additional people at
risk from coastal flooding vary widely (Hinkel et al. 2014), all indicate a considerable increase due to surging
populations in low-lying areas and to sea-level rise. The ongoing superimposition of sea-level rise (driven by
subsidence and climate change) on current flood levels increases climate extreme vulnerability in coastal cities
(Frazier et al. 2010), regardless of a change of e.g. the tropical cyclone climate (Törnqvist & Meffert 2008). This
poses a major challenge to coastal management both in terms of adapting to rising storm surge levels and to
rising flood levels (UN-HABITAT 2011a; Wilbanks et al. 2007), and compounds existing vulnerabilities of low-
lying populations. This mechanism has been exemplarily illustrated for cities such as Cotonou, Benin (Dossou &
Glehouenou-Dossou 2007) or Dar Es Salaam (Dodman et al. 2011).
This paper formalizes the current situation in coastal urban areas. It is important to note that climate change is
expected to regionally increase damages from climate extremes in the coming decades, with far reaching
implications (IPCC 2013; Seneviratne et al. 2012; UN-HABITAT 2011a; Nicholls 2004). We acknowledge this
projected increase in the characterization of each urban vulnerability profile we identify with a broad
qualitative outlook on climate change-driven increases of cyclone and flood exposures, and sea-level. This
increase could dramatically compound vulnerability through mechanisms documented above under
urbanization (UN-HABITAT 2011a), e.g. through further wetland loss through sea-level rise and urban expansion
(Syvitski et al. 2009).
Data for indication and cluster analysis
On the basis of the rapid urban population increase and the seven documented mechanisms we choose 11
quantitative indicators with global coverage for coastal urban vulnerability under rapid growth (Table 1).
Indicators are chosen that capture the most important processes or conditions that describe the vulnerability-
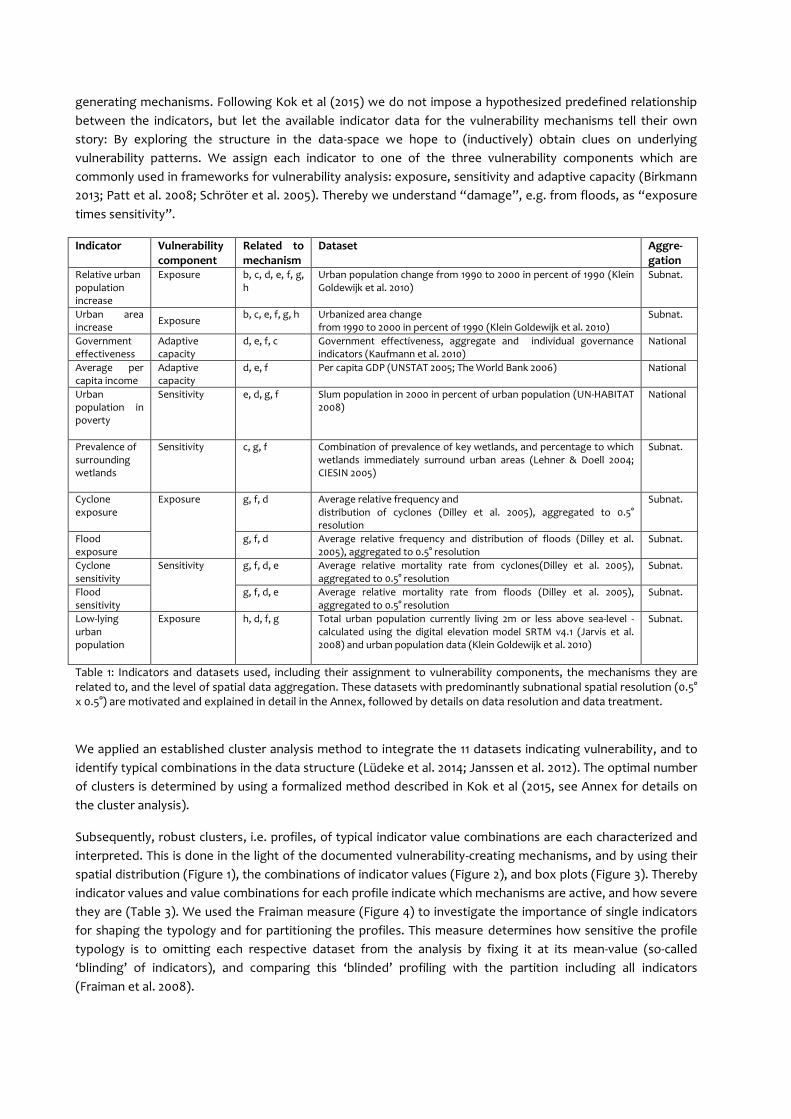
generating mechanisms. Following Kok et al (2015) we do not impose a hypothesized predefined relationship
between the indicators, but let the available indicator data for the vulnerability mechanisms tell their own
story: By exploring the structure in the data-space we hope to (inductively) obtain clues on underlying
vulnerability patterns. We assign each indicator to one of the three vulnerability components which are
commonly used in frameworks for vulnerability analysis: exposure, sensitivity and adaptive capacity (Birkmann
2013; Patt et al. 2008; Schröter et al. 2005). Thereby we understand “damage”, e.g. from floods, as “exposure
times sensitivity”.
Indicator Vulnerability component
Related to mechanism
Dataset Aggre- gation
Relative urban population increase
Exposure b, c, d, e, f, g, h
Urban population change from 1990 to 2000 in percent of 1990 (Klein Goldewijk et al. 2010)
Subnat.
Urban area increase
Exposure b, c, e, f, g, h Urbanized area change
from 1990 to 2000 in percent of 1990 (Klein Goldewijk et al. 2010) Subnat.
Government effectiveness
Adaptive capacity
d, e, f, c Government effectiveness, aggregate and individual governance indicators (Kaufmann et al. 2010)
National
Average per capita income
Adaptive capacity
d, e, f Per capita GDP (UNSTAT 2005; The World Bank 2006) National
Urban population in poverty
Sensitivity e, d, g, f Slum population in 2000 in percent of urban population (UN-HABITAT 2008)
National
Prevalence of surrounding wetlands
Sensitivity c, g, f Combination of prevalence of key wetlands, and percentage to which wetlands immediately surround urban areas (Lehner & Doell 2004; CIESIN 2005)
Subnat.
Cyclone exposure
Exposure g, f, d Average relative frequency and distribution of cyclones (Dilley et al. 2005), aggregated to 0.5° resolution
Subnat.
Flood exposure
g, f, d Average relative frequency and distribution of floods (Dilley et al. 2005), aggregated to 0.5° resolution
Subnat.
Cyclone sensitivity
Sensitivity g, f, d, e Average relative mortality rate from cyclones(Dilley et al. 2005), aggregated to 0.5° resolution
Subnat.
Flood sensitivity
g, f, d, e Average relative mortality rate from floods (Dilley et al. 2005), aggregated to 0.5° resolution
Subnat.
Low-lying urban population
Exposure h, d, f, g Total urban population currently living 2m or less above sea-level - calculated using the digital elevation model SRTM v4.1 (Jarvis et al. 2008) and urban population data (Klein Goldewijk et al. 2010)
Subnat.
Table 1: Indicators and datasets used, including their assignment to vulnerability components, the mechanisms they are related to, and the level of spatial data aggregation. These datasets with predominantly subnational spatial resolution (0.5° x 0.5°) are motivated and explained in detail in the Annex, followed by details on data resolution and data treatment.
We applied an established cluster analysis method to integrate the 11 datasets indicating vulnerability, and to
identify typical combinations in the data structure (Lüdeke et al. 2014; Janssen et al. 2012). The optimal number
of clusters is determined by using a formalized method described in Kok et al (2015, see Annex for details on
the cluster analysis).
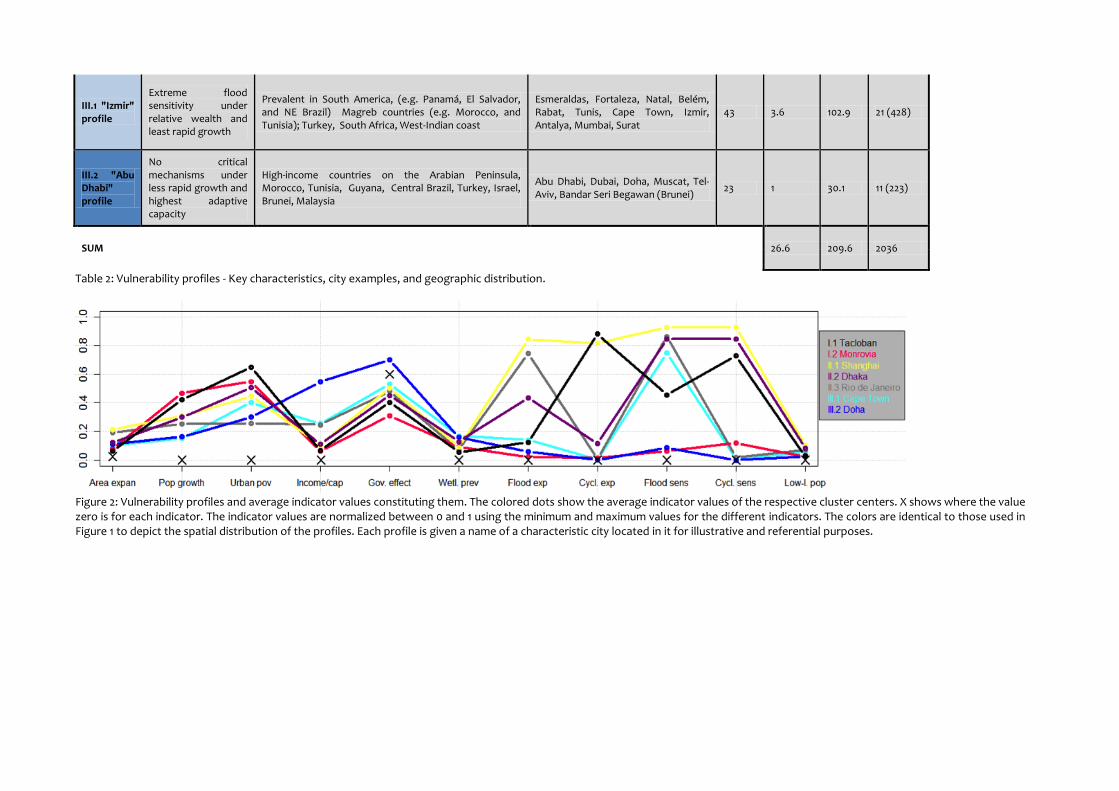
Subsequently, robust clusters, i.e. profiles, of typical indicator value combinations are each characterized and
interpreted. This is done in the light of the documented vulnerability-creating mechanisms, and by using their
spatial distribution (Figure 1), the combinations of indicator values (Figure 2), and box plots (Figure 3). Thereby
indicator values and value combinations for each profile indicate which mechanisms are active, and how severe
they are (Table 3). We used the Fraiman measure (Figure 4) to investigate the importance of single indicators
for shaping the typology and for partitioning the profiles. This measure determines how sensitive the profile
typology is to omitting each respective dataset from the analysis by fixing it at its mean-value (so-called
‘blinding’ of indicators), and comparing this ‘blinded’ profiling with the partition including all indicators
(Fraiman et al. 2008).

Results and characterization
Our analysis shows that 84 out of 196 countries (43%) and 153 countries with a coastline (55%) are experiencing
rapid coastal urbanization (>2.25%/a, see Annex). The overwhelming majority of this rapid urban growth (and
thus the spatial distribution of the profiles) is taking place in low and middle-income countries (Figure 1). Table
2 summarizes key characteristics, examples of cities, geographical distribution, and population statistics for
each of the seven profiles.
The Fraiman measure shows a differentiated picture of the indicators’ relative importance, and an even
distribution between 0.5 and 1 (Figure 4). Climate extreme exposures and sensitivities, and government
effectiveness are the most important indicators for partitioning the profiles and shaping the typology. The
most important indicators are exposure and sensitivity to floods, followed by sensitivity and exposure to
tropical cyclones. Government effectiveness and income are the next most important indicators. Next is urban
population increase, even though our analysis is confined to fast growing urban areas: Even within these areas
the degree of increase is an important cluster-separating indicator. Average income and urban population in
poverty are similarly important. Ecosystem degradation, urban extent change, and low-lying urban population
are less distinctive. Overall, the environmental indicators are slightly more important for separating the
clusters than the socioeconomic indicators.

Figure 1: Spatial distribution of the seven urban vulnerability profiles under rapid coastal urbanization, and examples of cities located in these profiles. See Figure 2 for the respective profiles.

Profile group and profile
Key characteristics Examples of countries and geographical regions Examples of cities located in profile No. of coun-tries
% of world
total of urban pop.
Urban pop. (m)
% of typology (No. of
0.5° grid cells)
I: Fastest population growth hitting pronounced poverty under overstretched management
I.1 "Tacloban"
profile
Extreme concatenated biophysical and socioeconomic mechanisms under widespread poverty
Most prevalent in cyclone-prone Madagascar and Mozambique; Myanmar, Central Philippines, Belize; absent in South America
Small and middle-sized cities such as Toamasina, Mahajanga, Quelimane, Angoche, Sittwe, Tacloban, Labasa, Belize City
16 0.5 14.9 6.9 (140)
I.2 "Monrovia
" profile
Most rapid urbanization and most severe poverty under lowest adaptive capacity
Most prevalent in Least Developed Countries, Sub-Saharan West African and on Equatorial coasts; Yemen, Eritrea, Pakistan, Myanmar, Eastern Indonesian Archipelago, Solomon Islands, Vanuatu; Nonexistent in Latin America
Monrovia (Liberia), Conakry (Guinea), Lomé (Togo), Libreville (Gabon), Swakopmund (Namibia), Massawa (Eritrea), Rangoon (Myanmar), Krong Koh Kong (Cambodia), Balikpapan (Indonesia)
41 1.8 51.4 18 (366)
II: Rapid population growth and most rapid expansion intensify high flood damages under moderate adaptive capacity
II.1 "Manila" profile
Extreme flood and cyclone damages are hitting fastest expansion and largest low lying populations
Subtropical coasts under tropical cyclone influence in Asia and Central America, majority of Philippines, China, Vietnam, and Bangladesh; India (Bay of Bengal); nonexistent in Africa, virtually nonexistent in the southern hemisphere
Manila, Guangzhou, Shanghai, Fuzhou, Chittagong, Da Nang, Kolkata, Santo Domingo, San Juan, Puerto Cabezas
12 5.2 149.1 11.6 (237)
II.2 "Dhaka" profile
Highest sensitivities to climate extremes, and highest sea-level-rise-driven settlement exposure under less effective governments
Subtropical coasts under less tropical cyclone exposure in Asia (Southern Philippines, Indian - Bay of Bengal) and Central America (Belize, Guatemala, Honduras), The Caribbean (Southern Haiti and Dominican Republic)
Dhaka and Khulna, Chennai, Karachi, Maputo, Bhubaneshwar, Haiphong, Jacmel, Santa Marta (Columbia)
23 2.7 78.3 10.6 (215)
II.3 "Rio de Janeiro” profile
High flood damages from rapid urban expansion and reduced natural protection
Southern Brazil, Ecuador, Peru, Columbia, Venezuela, Algeria, South Africa, Lebanon, NW India, SE India, Mekong Delta, Indonesia (Java, Sumatra), Southern Malaysia
Rio de Janeiro, Sao Paolo, Maracaibo, Caracas, Cartagena, Algiers, Istanbul, Oran, Durban, Accra, Luanda, Beirut, Ho Chi Minh City, Jakarta, Kuala Lumpur
39 7.3 209.6 21 (427)
III: Few and less extreme mechanisms under slower growth and high adaptive capacity
III.1 "Izmir" profile
Extreme flood sensitivity under relative wealth and least rapid growth
Prevalent in South America, (e.g. Panamá, El Salvador, and NE Brazil) Magreb countries (e.g. Morocco, and Tunisia); Turkey, South Africa, West-Indian coast
Esmeraldas, Fortaleza, Natal, Belém, Rabat, Tunis, Cape Town, Izmir, Antalya, Mumbai, Surat
43 3.6 102.9 21 (428)
III.2 "Abu Dhabi" profile
No critical mechanisms under less rapid growth and highest adaptive capacity
High-income countries on the Arabian Peninsula, Morocco, Tunisia, Guyana, Central Brazil, Turkey, Israel, Brunei, Malaysia
Abu Dhabi, Dubai, Doha, Muscat, Tel-Aviv, Bandar Seri Begawan (Brunei)
23 1 30.1 11 (223)
SUM 26.6 209.6 2036
Table 2: Vulnerability profiles - Key characteristics, city examples, and geographic distribution.
Figure 2: Vulnerability profiles and average indicator values constituting them. The colored dots show the average indicator values of the respective cluster centers. X shows where the value zero is for each indicator. The indicator values are normalized between 0 and 1 using the minimum and maximum values for the different indicators. The colors are identical to those used in Figure 1 to depict the spatial distribution of the profiles. Each profile is given a name of a characteristic city located in it for illustrative and referential purposes.
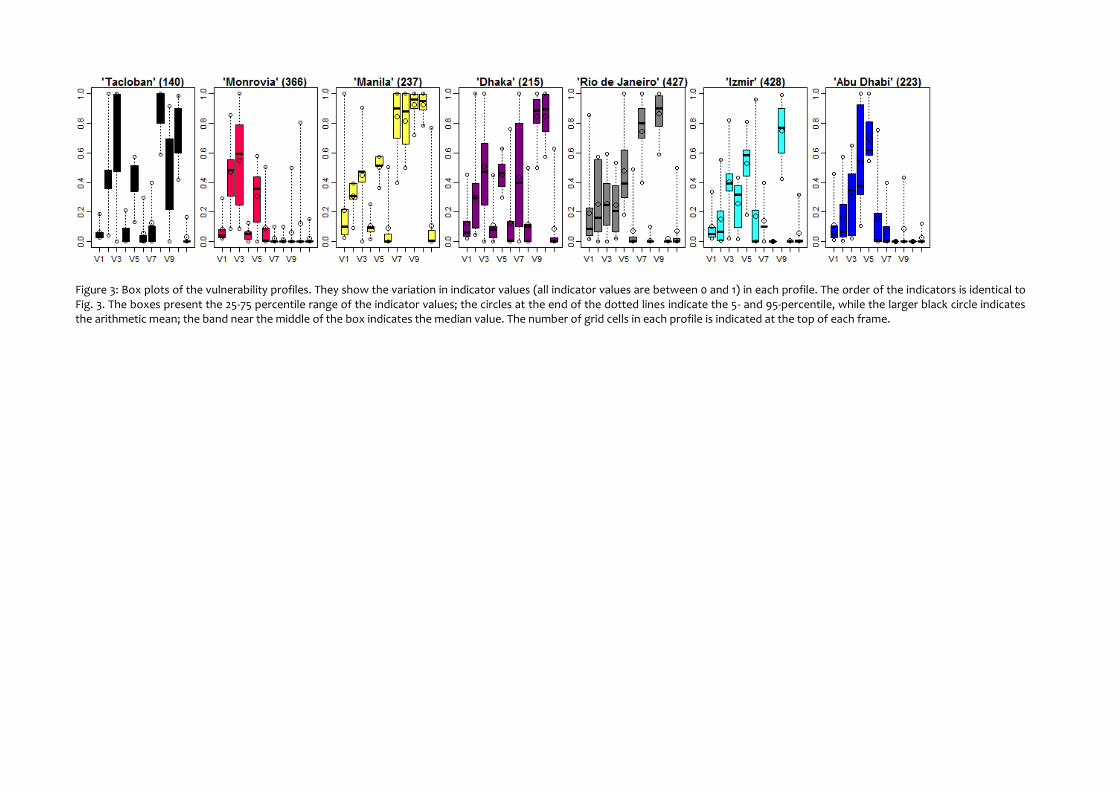
Figure 3: Box plots of the vulnerability profiles. They show the variation in indicator values (all indicator values are between 0 and 1) in each profile. The order of the indicators is identical to Fig. 3. The boxes present the 25-75 percentile range of the indicator values; the circles at the end of the dotted lines indicate the 5- and 95-percentile, while the larger black circle indicates the arithmetic mean; the band near the middle of the box indicates the median value. The number of grid cells in each profile is indicated at the top of each frame.
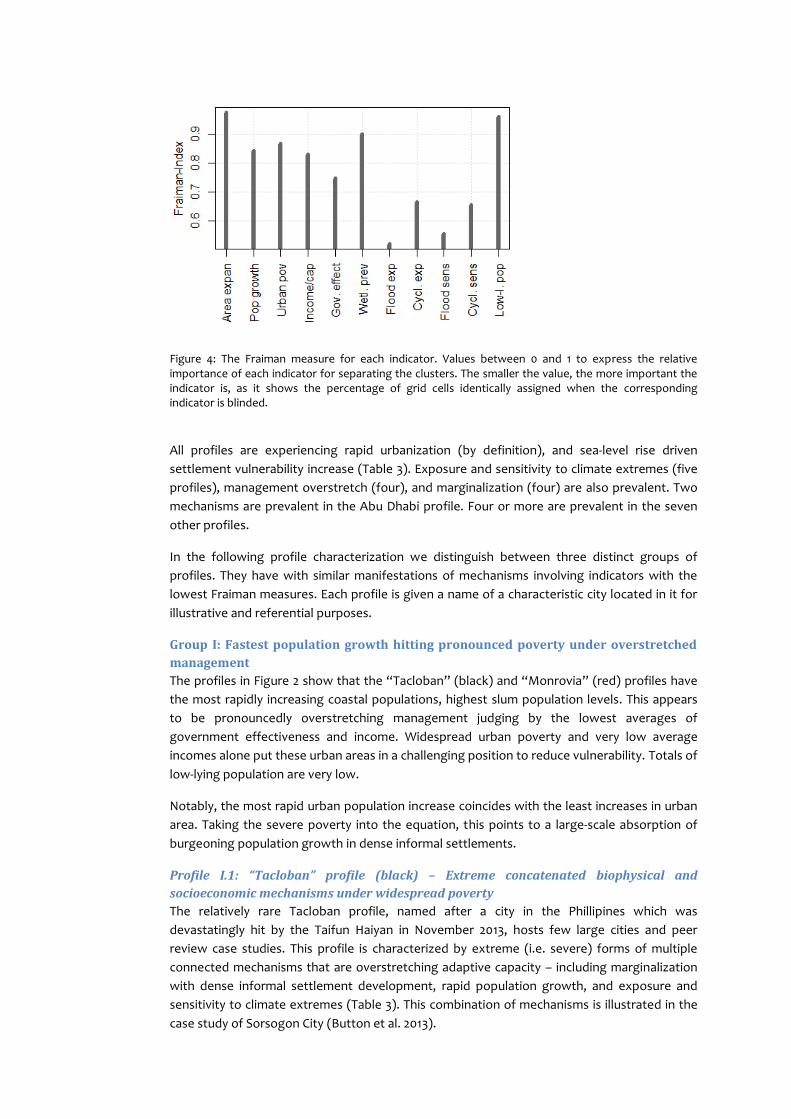
Figure 4: The Fraiman measure for each indicator. Values between 0 and 1 to express the relative importance of each indicator for separating the clusters. The smaller the value, the more important the indicator is, as it shows the percentage of grid cells identically assigned when the corresponding indicator is blinded.
All profiles are experiencing rapid urbanization (by definition), and sea-level rise driven
settlement vulnerability increase (Table 3). Exposure and sensitivity to climate extremes (five
profiles), management overstretch (four), and marginalization (four) are also prevalent. Two
mechanisms are prevalent in the Abu Dhabi profile. Four or more are prevalent in the seven
other profiles.
In the following profile characterization we distinguish between three distinct groups of
profiles. They have with similar manifestations of mechanisms involving indicators with the
lowest Fraiman measures. Each profile is given a name of a characteristic city located in it for
illustrative and referential purposes.
Group I: Fastest population growth hitting pronounced poverty under overstretched
management
The profiles in Figure 2 show that the “Tacloban” (black) and “Monrovia” (red) profiles have
the most rapidly increasing coastal populations, highest slum population levels. This appears
to be pronouncedly overstretching management judging by the lowest averages of
government effectiveness and income. Widespread urban poverty and very low average
incomes alone put these urban areas in a challenging position to reduce vulnerability. Totals of
low-lying population are very low.
Notably, the most rapid urban population increase coincides with the least increases in urban
area. Taking the severe poverty into the equation, this points to a large-scale absorption of
burgeoning population growth in dense informal settlements.
Profile I.1: “Tacloban” profile (black) – Extreme concatenated biophysical and
socioeconomic mechanisms under widespread poverty
The relatively rare Tacloban profile, named after a city in the Phillipines which was
devastatingly hit by the Taifun Haiyan in November 2013, hosts few large cities and peer
review case studies. This profile is characterized by extreme (i.e. severe) forms of multiple
connected mechanisms that are overstretching adaptive capacity – including marginalization
with dense informal settlement development, rapid population growth, and exposure and
sensitivity to climate extremes (Table 3). This combination of mechanisms is illustrated in the
case study of Sorsogon City (Button et al. 2013).
Under such a combination of extreme circumstances high cyclone exposure translates into
high cyclone sensitivity. In fact, the African cities listed in Table 2 are considered the cities the
most at risk to cyclones in all of Africa (Brecht et al. 2013). This suggests that on a global scale
hydrometeorological climate extremes are not stalling rapid growth and urban expansion in
risk-prone areas. Klose and Webersik (2010; 2011) demonstrated this in the case of tropical
storms in Haiti over time. Under these circumstances, the lowest urban expansion rate of any
profile additionally indicates an absorption of burgeoning population increase through dense
informal settlement, which worsens existing risks for poor households – a well-developed
argument in developing countries (McCarney et al. 2011; Tanner et al. 2009). Given this type of
climate-extreme sensitive settlement under widespread poverty, and the lowest prevalence
of surrounding wetlands, flood sensitivity appears to be relatively moderate. This is explained
by low exposure to floods apart from cyclone-driven storm surges due to low totals of low-
lying urban population. Relatively low flood damages and do not act as an ‘early warning sign’
for the potential increases of climate extreme frequency and damages (due to the sensitivity)
to be expected under future climate change.
Profile I.2: “Monrovia” profile (red) – Most rapid urbanization and most severe poverty
under lowest adaptive capacity
The Monrovia profile is prevalent in Least Developed Countries, and nonexistent in Latin
America. It is particularly prevalent on Sub-Saharan West African and equatorial coasts. Three
mechanisms are discernible in the profile which is most adversely positioned to reduce
existing vulnerabilities. The profile shows a characteristic combination of extreme forms of
growth, marginalization, and management overstretch: Judging by the least effective
governments and very high poverty levels the world’s fastest coastal population increase is
overstretching management. This is in line with findings for the confluence of poverty, most
rapid urbanization, and overstretched urban response options in Least Developed Countries
(Garschagen & Romero-Lankao 2013; Cohen 2006). Under these circumstances the lowest
expansion rate indicates an absorption of the soaring urban population increase through
dense informal settlement. Exposure and sensitivity to climate extremes is characteristically
low and show the minimal indicator value spread in the box plot. This signifies particularly
distinct and influential profile characteristics (Figure 3). According to Hanson et al. (2011),
cities in this profile such as Rangoon and Lomé will have some of the highest proportional
increases of population exposed to flooding by the 2070s.
Group II: Rapid population growth and fastest expansion intensify high flood damages
under moderate adaptive capacity
Under low to moderate income and government effectiveness the Manila, Dhaka, and Rio de
Janeiro profiles display extreme forms of three inextricably linked processes and conditions:
the highest flood exposures and sensitivities, the largest low-lying population totals, and the
fastest urban expansion rates. In mechanistic terms, this hints to a vast urban expansion into
flood-prone low-lying areas. If this mechanism would prevail under future sea-level rise and a
potential climate change-driven increase of flood extremes and frequency, then flood
damages would further increase without more effective regulation of rapid urban expansion.
High sensitivity to cyclones in two of the profiles further complicates this combination of
mechanisms for local authorities. Surrounding wetlands exist as flood-regulating buffers, but
need effective protection from degradation through rapid urban expansion.
Profile II.1: “Manila” profile (yellow) – Extreme flood and cyclone damages are hitting
fastest expansion and largest low-lying populations
The particularly distinct Manila profile is prevalent in tropical cyclone-prone urban coasts in
subtropical South and Southeast Asia. The extreme exposure and sensitivity to two climate
extremes distinguish this profile from the related Dhaka and Rio de Janeiro profiles. The
narrow indicator value distributions in the box plot signify a particularly distinct profile in the
data space.
The profile is affected by all seven mechanisms, indicating a severe confluence of problems.
Urban coasts with the fastest urban expansion and largest low-lying populations are suffering
the highest overall damages from climate extremes, and therefore appear to highly
vulnerable to future sea-level rise. Both this combination and the severe forms are markedly
illustrated in the case study of Shanghai (De Sherbinin et al. 2007).
Relatively high marginalization, low average income, and rapid growth suggest that prevalent
low-lying areas are also inhabited by vulnerable marginalized populations in informal
settlements. In fact, in Manila informal settlements at risk to coastal flooding make up 35% of
the population (UN-HABITAT 2007). This combination is also illustrated in the aforementioned
case study for Shanghai. The large low-lying populations are line with a global ranking of
population exposed to current coastal flooding in large port cities (Hanson et al. 2011; Nicholls
et al. 2007), of which three of the four highest ranked cities are located in this profile
(Shanghai, Guangzhou, and Kolkata). The low prevalence of surrounding wetlands shows that
few natural flood-regulating ecosystems exist, possibly because they have already been
diminished by urban expansion. Overall, the extreme flood sensitivity in the Manila profile
indicates a high vulnerability to sea-level rise due to its superimposition on coastal flood and
storm surge levels. (Hanson et al. 2011; Nicholls et al. 2007) find that other cities in this profile,
i.e. Shanghai, Guangzhou, Kolkata, Chittagong, and Ningo, will be among the cities most
exposed to coastal flooding in the 2070s due to sea-level rise and storm surge.
However, the notably high level of government effectiveness for these socioeconomic
conditions does suggest a greater efficacy of management. Its level is comparable to profiles
with much higher average income, less poverty and less challenging combinations of
mechanisms. This may explains why climate extreme sensitivity is comparable to profiles with
much lower climate extreme exposures and lower government effectiveness (Dhaka and
Tacloban profiles).
Profile II.2: “Dhaka” profile (purple) – Highest sensitivities to climate extremes, and
highest sea-level-rise driven settlement exposure under less effective governments
The Dhaka profile is prevalent in subtropical coasts under cyclone exposure in Asia, Central
America, and The Caribbean. Differential analysis with the Manila profile (II.1) reveals the most
important distinguishing feature of this profile: Despite its significantly lower exposures to
climate extremes, and slightly lower adaptive capacity, its sensitivities are similarly extreme.
This can be explained by a combination of multiple severe manifestations of mechanisms.
Seven mechanisms are discernible. Fast expansion, high marginalization and large low-lying
populations are exerting considerable pressure on urban areas with ineffective governments
and poor adaptive capacity. Under these circumstances moderate climate extreme exposure
translates into very high sensitivity. This is in line with insights into tropical storm impact on
population growth in Haïti, especially in densely populated hazard-prone urban areas (Klose
2011; Klose & Webersik 2010). The combination of pressures with climate extreme sensitivity
hints to markedly overstretched management. This is illustrated in the case of Chennai where
uncontrolled urban expansion, blockage and encroachment of natural drainage systems,
which are largely inhabited by slum settlements, have increased coastal and riverine flooding.
The flooding overstretches a lacking flood control response and drainage systems (Gupta &
Nair 2010). Under these circumstances the relative abundance of flood-regulating wetlands
alone does not significantly reduce high flood and cyclone-related sensitivity.
Such extreme sensitivity to floods and storm surges has also been observed in Dhaka (UN-
HABITAT 2011a), and also in Maputo (Douglas et al. 2008), where even moderate flooding
events largely affect the urban poor. This brings us to the conclusion that the urban coastal
fringes in the Dhaka profile are most adversely positioned to deal with climate extremes and
and future sea-level rise. This suggests that the protection of relatively abundant existing
wetlands is all the more important, but must be linked with additional vulnerability reducing
measures. Again, present damages from cyclones are not acting as an ‘early warning’ signal
for potentially greater frequency and intensity, and thus larger damages to larger populations,
expected under climate change.
Profile II.3.: “Rio de Janeiro” profile (grey) - High flood damages from rapid urban
expansion and reduced natural protection
The Rio de Janeiro profile is prevalent in flood prone deltas and monsoonal climates. The
profile is discernable in clusterings yielding two to six clusters as well, making it a particularly
distinct, robust structure in the data space (Figure 3). The high flood exposure and sensitivity
are similar to the Manila and Dhaka profiles, but there is essentially no tropical cyclone
activity.
Five mechanisms are discernible. The high flood damages appear to be a result of
combinations of very high flood exposure, concomitant fast-paced urban expansion which
may be responsible for reduced natural flood protection, and relatively prevalent settlement
in low-lying areas. This combination has been observed in a case study in Rio de Janeiro on
vulnerability to current climate hazards (De Sherbinin et al. 2007). At the same time, the
socioeconomic situation in cities such as Rio, Durban, or Kuala Lumpur is clearly more
favorable than in the related Manila and Dhaka profiles: Socioeconomic disparities are low,
and adaptive capacity is comparable to the wealthiest profiles. This explains the lower flood
vulnerability: While low-lying settlement is prevalent, marginalization is markedly low (a
distinguishing feature of the profile). Nevertheless, the Rio case study illustrates that leaving
combinations of vulnerability-generating mechanisms unchecked may accentuate flood
vulnerability through future climate change, and sea-level rise in particular.
Group III: Few and less extreme mechanisms under slower growth and high adaptive
capacity
Mechanisms and combinations thereof are less severe or absent in the Izmir and Abu Dhabi
profiles. Characteristically, the “slowest” population growth rates coincide with the highest
average income and government effectiveness. Climate extreme exposures are low. Under
these conditions the dark and light blue profiles are under the least pressure from
vulnerability-generating mechanisms, and most favorably positioned to reduce existing
vulnerabilities. This suggests that management is not as overstretched on the one hand, and is
responsible for less severe manifestations of mechanisms on the other. For example, there is
less pressure on abundant wetlands - possibly due to low expansion rates, or the effective
restriction of settlement and degradation. In addition, marginalization is less evident.
Profile III.1: “Izmir” profile (light blue) - Extreme flood sensitivity under least rapid
growth and relative wealth
The Izmir profile is prevalent in middle-income countries. The three mechanisms that ware
discernible are all linked to high flood sensitivity, resembling combinations observable in other
profiles. However, what distinguishes this profile from the wealthier Abu Dhabi profile and
other flood-sensitive profiles is the sensitivity under low exposure, relatively high income, and
relatively effective governments. The profile-based explanation for such flood sensitivity is the
high level of informal slum populations in flood-sensitive areas, which has been illustrated for
Esmeraldas, Ecuador (Luque et al. 2013) and Mumbai. In fact, the greatest socioeconomic
disparities in any profile hint to a marginalization of poor populations in flood-prone areas and
a high differential impact of floods. This is exemplified by cities such as Cape Town and
Mumbai (cities with pronounced social disparities), where informal low-lying settlements lack
drainage infrastructure ( u heibir iervogel 200 ; evi, atterthwaite, Arag n-Durand, et
al. 2014). Under these circumstances the high prevalence of surrounding wetlands alone are
insufficient to reduce major flood sensitivity.
Urban areas in this profile show a discrepancy between their relatively high capacity to adapt
and relatively high poverty rates and flood sensitivity, showing that capacity to adapt does
not necessarily mean adapting. On this basis present damages do not act as an ‘early warning’
for the much larger flood damages to be expected under climate change.
Profile III.2: “Abu Dhabi” profile (dark blue) – No critical mechanisms under less rapid
growth and highest adaptive capacity
The Abu Dhabi profile is prevalent in high-income countries. Two vulnerability-generating
mechanisms are discernible, which is the smallest amount for any profile. No severe forms of
mechanisms are discernible. Population growth is relatively slow. Effective government and
high average income indicate a significantly higher adaptive capacity than in any other profile.
At the same time exposure and sensitivity to cyclones and floods are the lowest, emphasizing
an advantageous position from a managerial point of view. Therefore this profile starkly
contrasts the fast-growing and managerially overstretched profiles in low-and middle income
countries.
However, in the future, flood vulnerability can increase through the combination of an
increase of rapid current urban expansion into wetlands (and other low-lying areas) and sea-
level rise. This combination has been pointed out for unplanned rapid urbanization in coastal
cities on the Arabian Peninsula (El-Raey 2009). While the profile would be best positioned to
contain this combination of mechanisms, its advantageous position may lead to ignoring
climate change adaptation requirements. This has been described for the urban planning
regulations in the Arab region (Tolba & Saab 2009).

Table 3: Typical mechanisms and processes, and combinations thereof, generating vulnerability in each vulnerability profile. “x” means discernible. “xx” indicates an extreme form of activity, e.g. extremely rapid urbanization. a) is a process, while b) through g) are mechanisms related to a).
Profile Number of mechanisms (out of 7)
Typical combinations of mechanisms described and interpreted in text
a) Rapid urban
population increase
b) Urban expansion
c) Wetland
loss
d) Management overstretch
e) Margina- lization
f) Vulnerable settlement
development
g) Exposure and
sensitivity to climate
extremes
h) Sea-level rise driven settlement exposure
Tacloban 6
a,e,g drive d (management overstretch) g,e,h drive d (no “early warning”) a,e,f,h,c drive g (large flood damages)
xx x xx xx x xx x
Monrovia 4 a,e drive d (management overstretch) a,d,e drive f (dense informal settlement development)
xx xx xx xx x
Manila 7
a,b,e,g drive d (management overstretch) b,e,f,h drive g (large flood damages) a,b,e,h,c drive g (“perfect storm” of flood vulnerability) a,b,h drive g (rapid expansion and large low-lying settlement)
x xx xx x x xx xx xx
Dhaka 6
a,b,e,g drive d (management overstretch) b,e,f,h drive g (large flood damages) a,b,e,f,h drive g (large flood damages) g,e,h drive d (no “early warning”) a,b,h drive g (rapid expansion and large low-lying settlement)
x x xx x xx xx xx
Rio 5 b,f,h drive g (large flood damages) a,b,h,c drive g (large flood damages)
x xx x x x x
Izmir 3 a,f,g,h drive g (large flood damages) g,e,h drive d (no “early warning”)
x x xx x
Abu Dhabi 2 a,b drive g (rapid expansion risks sea-level rise driven settlement development) x x
x

Discussion and conclusions
Combinations of extreme forms of mechanisms are driving urban vulnerability
Compounding forces of global change can risk to outpace vulnerability reduction in rapidly growing low- and
middle-income countries (UNI D 2011; O’Brien et al. 2012). If management overstretch is an indication of this
risk, then our study suggests such an outpacing is in effect in rapidly urbanizing coasts in over 50 countries. The
three profiles that show the clearest signs of overstretch (Tacloban, Monrovia, and Dhaka profiles) account for
36% of all rapidly growing urban coasts, and 145mn people (5% of the global urban population) in 57 countries.
Adding the less overstretched Manila profile increases the numbers to 47%, 294mn, and 10% in 58 countries,
respectively.
The profile-based explanation for management overstretch is combinations of multiple mechanisms - as
opposed to a single mechanism – whereas each mechanism shows an extreme (i.e. severe, or very adverse)
form (Table 3). “Combinations” signifies that the mechanisms are connected through cause-effect
relationships, while we do not investigate the strength of the connections. The most impoverished urban
coasts (Monrovia profile) indicate the activity of four mechanisms – a relatively low number. However, the
extreme forms explain why the respective governments are significantly overstretched. What drives
vulnerability here is the combination of particularly rapid urbanization (a key vulnerability-generating process
in itself), and severe forms of poverty, marginalization, and ineffective governments. A variety of case studies
in the Results section amply illustrates such combinations throughout profiles on a local scale.
Combinations of extreme mechanisms also drive vulnerability to floods under rapid urbanization throughout
the typology. Flood vulnerability has been largely driven by socioeconomic processes and factors in the past -
noted causes include poverty, ecosystem degradation, and poorly governed rapid urbanization (Ranger et al.
2011; Hanson et al. 2011; Revi 2008; Huq et al. 2007). Our results show where extreme forms of each of these
causes are typically combined to drive high flood vulnerability, namely in the impoverished Tacloban profile. In
the Manila, Rio, and Dhaka profiles fast expansion is a more critical indicator for high flood vulnerability. In the
Manila profile extreme forms of multiple mechanisms are concatenated to a “perfect storm”: The highest
urban expansion (mechanism b) is leading to wide-spread flood-prone settlement in low-lying areas (h) and
massive wetland loss (c) that leads to less attenuation of damage under high flood exposure (g) and very rapid
urban population growth (a).
In these four profiles this documented chain of mechanisms in extremis suggests a further accentuation of
extreme flood vulnerability through sea-level rise and potential increases of extreme event exposure. That is
unless mindful responses are successfully integrated in development plans ( evi, atterthwaite, Arag n-
Durand, et al. 2014; Lavell et al. 2012). This requires cross-level building of socio-ecological resilience (Adger et
al. 2005), and systemic integration of disaster risk management, poverty reduction and adaptation policy
(Lavell et al. 2012; O’Brien et al. 2012). Given the vast spatial distribution of urban areas in question, we suggest
that this also requires replicating good practices in systemically similar situations.
Climate extremes and ineffective governments are additionally driving urban vulnerability
Our results show that indicators for climate extreme vulnerability are key for globally systematizing coastal
urban vulnerability. Exposure and sensitivity to climate extremes play a direct role in five profiles and three
mechanisms. The corresponding datasets allow for differentiating combinations of exposure, sensitivity and
adaptive capacity to floods and cyclones between profiles. This confirms the large differences in adaptive
capacity in urban centers pointed out by Revi et al. (2014) for the rapidly urbanizing coastal fringe.
Based on our results we suggest that profiles are particularly threatened by climate-change driven future
increases in flood and cyclone exposures and sensitivities when these components do not currently act as an
“early warning signal”. This exemplarily applies to profiles with high sensitivity to cyclones (Dhaka profile) or
floods (Tacloban and Izmir profiles) under low to moderate exposure, and moderate to extreme levels of
urban population in poverty. This combination is discernible in 38.5% of the rapidly growing urban coast (196mn
people, 6.8% of the global urban population) in 58 countries. Moderate flood and cyclone exposures in these
profiles are already translating into damages that are associated with much higher exposures in other profiles.
This suggests a relatively low capacity for natural disaster prevention or post-disaster management. These
findings are particularly concerning in view of sea-level-rise and large-scale settlement expansion of vulnerable
communities into low-lying areas.
From this viewpoint we argue that the Monrovia profile will encounter serious problems if the very low current
climate extreme exposure increases through sea-level rise. The lowest capacity for vulnerability reduction
suggests that these urban areas have little experience, and the fewest means, to respond to a flood exposure
increase with (tropical cyclone increase is limited physically because the profile is currently largely confined to
equatorial areas).
Entry points for vulnerability reduction- examples from profiles vulnerable to floods
Rapid urbanization can play an important role in economic development (Tacoli et al. 2008), and offer
opportunities for vulnerability reduction (Birkmann et al. 2010; Garschagen & Romero-Lankao 2013).
Combinations of mechanisms hint at entry points for reducing vulnerability, which we explore for flood
vulnerability reduction under rapid growth in selected profiles in the following. Given the generic nature of this
study, these entry points target national and international institutions which focus on urban risk reduction and
cities interested in contextualizing their city among peers with systemically similar generation of vulnerability.
Ultimately, measures based on these entry points need to be contextualized locally.
The combination of the most severe forms of multiple flood-related mechanisms in the Manila profile calls for
integrated measures to reduce extreme exposure and sensitivity to floods and cyclones. Formidable measures
include channeling extremely rapid expansion, and protecting scarce remaining wetlands and widespread low-
lying settlements. This would require a complex, effective orchestration of action on all levels of government
and stakeholders. And we do suggest, based on its profile, that the Manila profile shows a unique capacity for
flood and cyclone vulnerability reduction to build on. Governments in this profile appear to be relatively
efficient at translating their limited adaptive capacity into reduction of flood vulnerability in a highly
disadvantageous situation: Sensitivity is comparable to values in other profiles showing significantly less
frequent flood and cyclone activity. This characteristic suggests entry points for flood vulnerability reduction
that utilize or require this kind of efficacy for leverage. This initailly suggests prioritizing large-scale, national
projects that integrate „hard“ infrastructural adaptation, such as di e-building, land use-planning, and “soft”
measures such as wetland protection in view of sea-level rise and unprecedented urban expansion. But beyond
this, experience can explain the efficacy, and appears to have accumulated to another unique advantage to
build on for flood reduction in the Manila profile: Given the geographic concentration of these urban areas in
subtropical cyclone paths, “soft” disaster responses have been refined under regular climate extremes
through decades of experience on the ground. An example for the development of effective responses
following major disasters is the community-based initiative the homeless People’s Federation of the Philippines

(Carcellar et al. 2011; evi, atterthwaite, Arag n-Durand, et al. 2014). This approach can be a resource for other
urban profiles in comparable situations to draw from.
The Izmir, Dhaka and Tacloban profiles are characterized by high flood sensitivity and much lower flood
exposure. In view of potential increases under climate change, we suggest entry points for flood vulnerability
reduction that jointly enhance adaptive capacity of flood sensitive communities and increase the effectiveness
of government-led flood vulnerability reduction on the ground. Huq et al. (2007) indicate that vulnerability
reduction requires pro-poor urban climate adaptation policies, which is particularly effective under
involvement of households, communities, and various levels of government (UN-HABITAT 2011b). However,
the evident existence of pronounced social disparities in the wealthy Izmir profile suggests poor top-down
organizational abilities for implementing such measures. In a context where governments lack resources or
will, collective organization in the affected communities may be a more promising way of reducing vulnerability
(De Sherbinin et al. 2007). Taking overstretched planning, widespread poverty and intense population pressure
in the Dhaka and Tacloban profiles into account, flood vulnerability reduction measures may simply be lacking
in many areas, thus requiring additional endogenous and exogenous measures: Regarding measures involving
collective organization, multiple cities in Africa and Asia have shown the potential of upgrading informal
settlements for vulnerability reduction to extreme events (Revi et al. 2014).
Discussion of the method
Like all statistical analyses this study comes with its limitations and caveats. The first limitation is the specificity
of a few indicators which show a large spread around their cluster center value (i.e. streteched central
quartiles, which always span up to 50% of the data range, see Figure 3). This means that the cluster
membership of a grid cell might not say much about this specific indicator - here it is important that the cluster
center value of such an indicator should not play a decisive role in the interpretation of the cluster. A second
limitation is the separate treatment of each urban area grid cell. Hence our results are not distinctly assigned to
urban agglomerations, or cities, according to their administrative boundaries. However, the reason for this
design is clear: It is not feasible to unambiguously assign comparable subnational data to all rapidly urbanizing
coastal cities with global coverage. The third limitation is the use of national-level data when subnational data
was either unavailable (e.g. for government effectiveness), or unfeasible (for GDP per cap), for capturing local
vulnerability-generating phenomena in urban areas. At the same time, national level GDP per cap helps to
differentiate low-, middle, and high-income countries and indicate the resources a national economy can
mobilize for vulnerability reduction, e.g. for climate change adaptation (Revi, Satterthwaite, Aragón-Durand, et
al. 2014). Besides this we ruled out using the potentially feasible subnational dataset of ‘‘gross cell product’’
per cap (Nordhaus 2006), because numerous coastal countries with rapid growth lack the data. Fourth, there
are other human-environment interactions that conceivably generate vulnerability in cities, such as landslides.
Although landslides are also noted as climate related-hazards in some urban areas, they are of significantly less
overall importance judging by the literature. In addition, we found that data on frequency and mortality
revealed a significantly high positive correlation with the respective flood datasets.
Conclusions
Using an established cluster analysis on largely sub-national data, we have constructed and discussed a
spatially explicit global systematization of the heterogeneous, yet characteristic, processes and mechanisms
that typically generate urban vulnerability under rapid urbanization. Our analysis advances the knowledge on
links of global trends and vulnerabilities in coastal urban areas under rapid urbanization in low- and middle
income countries, and where different combinations thereof happen similarly. This analysis shows that local

vulnerability-generating mechanisms recurrently formulated in a multitude of city-based case studies can be
robustly identified across regions that are socio-ecologically similar for a more generic global overview.
The main drivers of vulnerability under rapid coastal urbanization in our global overview are a) chain-like
combinations of extreme, i.e. severe, biophysical and socio-economic pressures (that we labeled mechanisms),
and b) vulnerability to floods and cyclones. Huge asymmetries exists between different urban profiles
regarding these drivers, and how they are positioned reduce vulnerability. The different combinations we
identify are useful for contextualizing fast-growing urban coasts against a background of the underlying global
trends of urbanization and urban expansion, and future climate extreme increase. First, income and
government effectiveness decrease with the rate of urban population growth, while urban poverty increases.
Second, interrelated mechanisms generating vulnerability are dramatically stacked against urban areas with
the least capacity to reduce vulnerability (Monrovia and Tacloban profiles). These areas are experiencing the
world’s most rapid coastal population growth rates and lowest urban expansion rates, and the most prevalent
poverty. Third, these extremes are combined with high vulnerabilities to climate extremes in specific urban
areas in Madagascar, Northern Mozambique, Small Island Developing States, Myanmar, and parts of the
Philippines (“Tacloban” profile). Fourth, the fastest urban area expansion is occurring in urban areas with the
most populous settlement of low-lying areas, and where large damages from floods, cyclones, or both, prevail.
This appears to be in line with the finding that expansion is growing faster in the low-elevation coastal zone
(Seto et al. 2011b). Fifth, these characteristics mean that patterns of rapid coastal urban development - i.e.
most rapid growth, and most rapid urban expansion - are in direct conflict with climate extreme vulnerability
reduction. In order to reduce risk, which is the critical issue for climate adaptation in low- and middle-income
nations (Satterthwaite 2009), this calls for a mindful, integrated approach of urban land use planning and
climate adaptation.
Response options are usually identified for a specific place or identified at a generic level (Jäger & Kok 2007;
Mortimore 2009). We suggest that a systems-based, typological approach on a generic level can facilitate
scaling up successful place-based vulnerability reduction. Vulnerability profiles may aid in exploring how
specific urban areas across the globe, which share similar socio-ecological systems and vulnerability-creating
contexts, could share the same response options, as corroborated by Kok et al (2015) and Sietz (2011). Thereby
the similar problem structure initially suggests a similar response to the same intervention.
Given the limited amount of resources available for vulnerability reduction strategies, a context specific “city
matching” may be useful for climate adaptation funds for more targeted and effective reduction efforts in
cities under rapid coastal urbanization. This can aid in the urgently needed upscaling and replication of
vulnerability-reducing measures that were successful in specific coastal urban areas by showing which other
areas they may be transferrable to (Kok et al. 2015; Sietz et al. 2011). For example, experience from pioneering
cities regarding climate risk management in the Manila profile may be transferrable to multiple urban areas in
this profile, or to a profile with similar combinations of mechanisms.
Follow-up studies should corroborate the value of this study for integrating development and climate
adaptation in certain types of cities. First, despite the lack of attention it receives in urban vulnerability studies,
clarifying the influence of city size on combined vulnerabilities would be valuable for an effective placement of
adaptation measures. This is important because the world’s population growth is in fact concentrated in small
and medium-sized cities in low and middle-income countries (UNDESA 2012). Second, this leads to questions of
the scaling of vulnerability-related properties with city size in view of socio-ecological change. This could be a
valuable investigation into predicting social properties using scaling relations of urban systems according to
Bettencourt (2013) and Bettencourt and West (2010). Finally, this study can provide the basis for analyzing
dynamics of the urban vulnerability profiles under projected socio-economic and environmental change, and
what this means for future risk management. Using the same methodology, Luedeke et al. (2014) have
conducted such a study for detecting and understanding change in patterns of drylands vulnerability.
References
Adelekan, I.O., 2010. Vulnerability of poor urban coastal communities to flooding in Lagos, Nigeria. Environment
and Urbanization, 22(2), pp.433–450. Available at:
http://eau.sagepub.com/cgi/doi/10.1177/0956247810380141 [Accessed February 5, 2014].
Adger, W.N. et al., 2005. Social-ecological resilience to coastal disasters. Science, 309(5737), pp.1036–9. Available
at: http://www.ncbi.nlm.nih.gov/pubmed/16099974.
Alam, M. & Rabbani, M.D.G., 2007. Vulnerabilities and responses to climate change for Dhaka. Environment and
Urbanization, 19(1), pp.81–97. Available at: http://eau.sagepub.com/cgi/doi/10.1177/0956247807076911
[Accessed November 19, 2014].
Angel, S., 2011. The dimensions of global urban expansion: Estimates and projections for all countries, 2000-2050.
Progress in Planning, 75(2), pp.53–107.
Angel, S., Parent, J. & Civco, D.L., 2010. The Persistent Decline in Urban Densities: Global and Historical
Evidence of “Sprawl,”
Awuor, C.B., Orindi, V.A. & Adwera, A.O., 2008. Environment and Urbanization the case of Mombasa , Kenya.
Environment and Urbanization, 20(1), pp.231–242.
Baird, R.C., 2009. Coastal urbanization: the challenge of management lag. Management of Environmental Quality:
An International Journal, 20(4), pp.371–382. Available at:
http://www.emeraldinsight.com/10.1108/14777830910963726 [Accessed March 17, 2014].
Ben-Hur, A., Elisseeff, A. & Guyon, I., 2002. A stability based method for discovering structure in clustered data. In
Pacific Symposium on Biocomputing. Pacific Symposium on Biocomputing. pp. 6–17. Available at:
http://www.ncbi.nlm.nih.gov/pubmed/11928511.
Bettencourt, L. & West, G., 2010. A unified theory of urban living. Nature, 467(7318), pp.912–3. Available at:
http://www.ncbi.nlm.nih.gov/pubmed/20962823.
Bettencourt, L.M. a, 2013. The origins of scaling in cities. Science (New York, N.Y.), 340(6139), pp.1438–41.
Available at: http://www.ncbi.nlm.nih.gov/pubmed/23788793 [Accessed February 25, 2014].
Birkmann, J. et al., 2010. Adaptive urban governance: New challenges for the second generation of urban adaptation
strategies to climate change. Sustainability Science, 5(2), pp.185–206. Available at:
http://www.springerlink.com/index/10.1007/s11625-010-0111-3 [Accessed July 21, 2011].
Birkmann, J., 2013. Measuring vulnerability to promote disaster- resilient societies and to enhance adaptation:
conceptual frameworks, definitions. In Measuring vulnerability to natural hazards. UNU Press.
Bloom, D.E., 2011. 7 Billion and Counting. Science (New York, N.Y.), 333(6042), pp.562–9. Available at:
http://www.ncbi.nlm.nih.gov/pubmed/21798935 [Accessed March 21, 2014].
Bravo de Guenni, L. et al., 2005. Regulation of Natural Hazards: Floods and Fires. In Millenium Ecosystem
Assessment Vol 1. Ecosystems and Human Well-Being: Current State and Trends. Findings of the Conditions
and Trends Working Group. Washington D.C: Island Press.
Brecht, H., Deichmann, U. & Wang, H.G., 2013. A Global Urban Risk Index, Washington D.C.
Bull-Kamanga, L., 2003. From everyday hazards to disasters: the accumulation of risk in urban areas. Environment
and Urbanization, 15(1), pp.193–204. Available at:
http://eau.sagepub.com/cgi/doi/10.1177/095624780301500109 [Accessed July 15, 2010].
Button, C. et al., 2013. Vulnerability and resilience to climate change in Sorsogon City, the Philippines: learning
from an ordinary city? Local Environment: The International Journal of Justice and Sustainability, 18(6).
Carcellar, N., Co, J.C.R. & Hipolito, Z.O., 2011. Addressing disaster risk reduction through community-rooted
interventions in the Philippines: experience of the Homeless People’s Federation of the Philippines.
Environment and Urbanization, 23(2), pp.365–381.
Cardona, O.D. et al., 2012. Determinants of Risk: Exposure and Vulnerability. In C. B. Field et al., eds. Managing
the Risks of Extreme Events and Disasters to Advance Climate Change Adaptation. A Special Report of
Working Groups I and II of the Intergovernmental Panel on Climate Change (IPCC). Cambridge UK:
Cambridge University Press, pp. 65–108.
Chatterjee, M., 2010. Slum dwellers response to flooding events in the megacities of India. Mitigation and
Adaptation Strategies for Global Change, 15(4), pp.337–353. Available at:
http://link.springer.com/10.1007/s11027-010-9221-6 [Accessed March 19, 2014].
Church, J. et al., 2013. Sea Level Change. In Climate Change 2013: The Physical Science Basis. Contribution of
Working Group I to the Fifth Assessment Report of the Intergovernmental Panel on Climate Change.
CIESIN, 2005. Gridded Population of the World Version 3 (GPWv3). Socioeconomic Data and Applications Center
(SEDAC), Columbia University. Available at: sedac.ciesin.columbia.edu/gpw.
Cohen, B., 2006. Urbanization in developing countries: Current trends, future projections, and key challenges for
sustainability. Technology and Society, 28(1-2), pp.63–80.
Costanza, R. et al., 2008. The Value of Coastal Wetlands for Hurricane Protection. AMBIO: A Journal of the Human
Environment, 37(4), pp.241–248.
Crona, B.I. et al., 2015. Using social–ecological syndromes to understand impacts of international seafood trade on
small-scale fisheries. Global Environmental Change, 35, pp.162–175. Available at:
http://linkinghub.elsevier.com/retrieve/pii/S0959378015300133.
Dilley, M. et al., 2005. Natural Disaster Hotspots - A Global Risk Analysis, Washington D.C.
Dodman, D., Kibona, E. & Kiluma, L., 2011. Tomorrow is too Late : Responding to Social and Climate
Vulnerability in Dar es Salaam , Tanzania, Available at: http://www.unhabitat.org/grhs/2011.
Dossou, K.M.R. & Glehouenou-Dossou, B., 2007. The vulnerability to climate change of Cotonou (Benin): the rise
in sea level. Environment and Urbanization, 19(1), pp.65–79. Available at:
http://eau.sagepub.com/cgi/doi/10.1177/0956247807077149 [Accessed November 12, 2014].
Douglas, I. et al., 2008. Unjust waters: climate change, flooding and the urban poor in Africa. Environment and
Urbanization, 20(1), pp.187–205. Available at: http://eau.sagepub.com/cgi/doi/10.1177/0956247808089156
[Accessed January 31, 2014].
El-Raey, M., 2009. Coastal Areas - Impact of Climate Change: Vulnerability and Adaptation. In M. K. Tolba & N.
W. Saab, eds. Arab Environment : Climate Change Impact of Climate Change on Arab Countries. Lebanon,
pp. 47–62.
Fraiman, M., Justerl, A. & Svarc, M., 2008. Selection of variables for cluster analysis and classification rules.
Journal of the American Statistical Association, 103(483), pp.1294–1303.
Frazier, T.G. et al., 2010. Influence of potential sea level rise on societal vulnerability to hurricane storm-surge
hazards, Sarasota County, Florida. Applied Geography, 30(4), pp.490–505.
Garschagen, M. & Romero-Lankao, P., 2013. Exploring the relationships between urbanization trends and climate
change vulnerability. Climatic Change. Available at: http://link.springer.com/10.1007/s10584-013-0812-6
[Accessed November 17, 2014].
Grimm, N.B. et al., 2008. Global change and the ecology of cities. Science (New York, N.Y.), 319(5864), pp.756–60.
Available at: http://www.ncbi.nlm.nih.gov/pubmed/18258902.
Grubler, A. et al., 2012. Chapter 18 - Urban Energy Systems. In Global Energy Assessment - Toward a Sustainable
Future. Cambridge University Press, Cambridge, UK and New York, NY, USA and the International Institute
for Applied Systems Analysis, Laxenburg, Austria, pp. 1307–1400.
Gupta, A.K. & Nair, S.S., 2010. Flood risk and context of land-uses : Chennai city case. Journal of Georgraphy and
Regional Planning, 3(12), pp.365–372.
Hallegatte, S. et al., 2013. Future flood losses in major coastal cities. Nature Climate Change, 3(9), pp.802–806.
Available at: http://www.nature.com/doifinder/10.1038/nclimate1979 [Accessed March 19, 2014].
Handmer, J. & Dovers, S., 2007. Handbook of Disaster and Emergency Policies and Institutions, London, UK:
Earth Scan.
Handmer, J., Honda, Y. & Kundzewicz, Z., 2012. Changes in Impacts of Climate Extremes : Human Systems and
Ecosystems. In C. B. Field et al., eds. Managing the Risks of Extreme Events and Disasters to Advance
Climate Change Adaptation - A Special Report of Working Groups I and II of the Intergovernmental Panel on
Climate Change (IPCC). Cambridge UK: Cambridge University Press, pp. 231–290.
Hanson, S. et al., 2011. A global ranking of port cities with high exposure to climate extremes. Climatic Change,
104(1), pp.89–111. Available at: http://www.springerlink.com/index/10.1007/s10584-010-9977-4 [Accessed
December 9, 2010].
Hardoy, J.E., Mitlin, D. & Satterthwaite, D., 2001. Environmental Problems in an Urbanizing World, London, UK:
Earthscan.
Hinkel, J. et al., 2014. Coastal flood damage and adaptation costs under 21st century sea-level rise. Proceedings of
the National Academy of Sciences of the United States of America, 111(9), pp.3292–7. Available at:
http://www.pubmedcentral.nih.gov/articlerender.fcgi?artid=3948227&tool=pmcentrez&rendertype=abstract
[Accessed August 12, 2014].

Hoornweg, D. et al., 2011. Cities and Climate Change - Responding to an Urgent Agenda M. J. L. Daniel
Hoornweg, Mila Freire & E. Perinaz Bhada-Tata, and Belinda Yuen, eds., The World Bank. Available at:
https://openknowledge.worldbank.org/handle/10986/2312.
Huq, S. et al., 2007. Editorial: Reducing risks to cities from disasters and climate change. Environment and
Urbanization, 19(1), pp.3–15. Available at: http://eau.sagepub.com/cgi/doi/10.1177/0956247807078058
[Accessed November 28, 2014].
IPCC, 2013. Summary for Policy Makers. In T. F. Stocker et al., eds. Climate Change 2013 - The Physical Science
Basis. Contribution of Working Group I to the Fifth Assessment Report of the Intergovernmental Panel on
Climate Change. Cambridge: Cambridge University Press. Available at:
http://ebooks.cambridge.org/ref/id/CBO9781107415324.
IPCC, 2012. Summary for Policymakers. In C. B. Field et al., eds. Managing the Risks of Extreme Events and
Disasters to Advance Climate Change Adaptation. A Special Report of Working Groups I and II of the
Intergovernmental Panel on Climate Change. Cambridge UK: Cambridge University Press, pp. 3–21.
Jäger, J. & Kok, M., 2007. Vulnerability of people and the environment: challenges and opportunities. In Global
Environmental Outlook-4. Environment for Development. Nairobi, Kenya: . Earthscan, pp. 301–360.
Janssen, P., Walther, C. & Lüdeke, M.K.B., 2012. Cluster Analysis to Understand Socio-Ecological Systems - A
Guideline, Potsdam. Available at: urn:nbn:de:kobv:b103-pik1264.
Jarvis, A. et al., 2008. Hole-filled SRTM for the globe version 4. Available from the CGIAR-CSI SRTM 90m
Database. Available at: http://srtm.csi.cgiar.org.
Kaufmann, D., Kraay, A. & Mastruzzi, M., 2010. The Worldwide Governance Indicators: Methodology and
Analytical Issues, Available at: http://info.worldbank.org/governance/wgi/index.aspx#home.
Kit, O. & Lüdeke, M., 2013. Automated detection of slum area change in Hyderabad, India using multitemporal
satellite imagery. ISPRS Journal of Photogrammetry and Remote Sensing, 83, pp.130–137. Available at:
http://linkinghub.elsevier.com/retrieve/pii/S0924271613001561 [Accessed December 9, 2014].
Kit, O., Lüdeke, M. & Reckien, D., 2011. Assessment of climate change-induced vulnerability to floods in
Hyderabad/India using remote sensing data. In K. Otto-Zimmermann & K. Dordrecht, eds. Resilient Cities -
Cities and Adaptation to Climate Change. Dordrecht: Springer Netherlands, pp. 35–44. Available at:
http://link.springer.com/10.1007/978-94-007-0785-6 [Accessed October 4, 2014].
Klein Goldewijk, K., Beusen, A. & Janssen, P., 2010. Long-term dynamic modeling of global population and built-
up area in a spatially explicit way: HYDE 3.1. The Holocene, 20(4), pp.565 – 573. Available at:
http://hol.sagepub.com/cgi/doi/10.1177/0959683609356587 [Accessed July 6, 2010].
Klose, C.D., 2011. Evidence for higher tropical storm risks in Haiti due to increasing population density in hazard
prone urban areas. Environmental Research Letters, 6(4).
Klose, C.D. & Webersik, C., 2010. Long-term impacts of tropical storms and earthquakes on human population
growth in Haiti and the Dominican Republic. In Nature Precedings. Available at:
http://dx.doi.org/10.1038/npre.2010.4737.1.
Kok, M. et al., 2015. A new method for analysing socio-ecological patterns of vulnerability. Regional
Environmental Change. Available at: http://link.springer.com/10.1007/s10113-014-0746-1 [Accessed January
5, 2015].
Kok, M.T.J. et al., 2010. Quantitative analysis of patterns of vulnerability to global environmental change, Den
Haag: Netherlands Environmental Assessment Agency (PBL). Available at:
http://www.pbl.nl/bibliotheek/rapporten/550025005.pdf [Accessed July 28, 2011].
Kropp, J. P., Lüdeke, M.K.B., Reusswig, F., 2001. Global Analysis and Distribution of Unbalanced Urbanization
Processes: The Favela Syndrome. GAIA, 1(2).
Lavell, A. et al., 2012. Climate change: new dimensions in disaster risk, exposure, vulnerability, and resilience. In C.
B. Field et al., eds. Managing the Risks of Extreme Events and Disasters to Advance Climate Change
Adaptation. Report of Working Groups I and II of the Intergovernmental Panel on Climate Change (IPCC).
Cambridge: Cambridge University Press, pp. 25–64.
Lehner, B. & Doell, P., 2004. Development and validation of a global database of lakes, reservoirs and wetlands.
Journal of Hydrology, 296(1-4), pp.1–22. Available at:
http://linkinghub.elsevier.com/retrieve/pii/S0022169404001404.
Lüdeke, M.K.B. et al., 2014. Understanding Change in Patterns of Vulnerability, Potsdam, Germany. Available at:
urn:nbn:de:kobv:b103-pik1274.
Lüdeke, M.K.B., Petschel-held, G. & Schellnhuber, H., 2004. Syndromes of Global Change : The First Panoramic
View. GAIA, 13(1), pp.42–49.
Luque, A., Edwards, G. & Lalande, C., 2013. The local governance of climate change: new tools to respond to old
limitations in Esmeraldas, Ecuador. Local Environment, 18(6).
Macqueen, J., 1967. Some Methods for Classification and Analysis of Multivariate Observations. In Proceedings of
the conference Fifth Berkeley Symposium on Mathematical Statistics and Probability. pp. 281–297.
McCarney, P. et al., 2011. Cities and Climate Change - The challenges for governance. In C. Rosenzweig et al., eds.
Cities and climate change. Climate Change and Cities: First Assessment Report of the Urban Climate Change
Research Network. Cambridge UK, pp. 249–269.
McGranahan, G., Balk, D. & Anderson, B., 2007. The rising tide: assessing the risks of climate change and human
settlements in low elevation coastal zones. Environment and Urbanization, 19(1), pp.17–37. Available at:
http://eau.sagepub.com/cgi/doi/10.1177/0956247807076960.
Mehrota, S. et al., 2011. Cities, Disasters, and Climate Risk. In C. Rosenzweig et al., eds. Climate Change and
Cities (ARC3). Cambridge: Cambridge University Press, pp. 15–42.
Mondal, P. & Tatem, A.J., 2012. Uncertainties in measuring populations potentially impacted by sea level rise and
coastal flooding. PloS one, 7(10), p.e48191. Available at:
http://www.pubmedcentral.nih.gov/articlerender.fcgi?artid=3480473&tool=pmcentrez&rendertype=abstract
[Accessed February 27, 2014].
Mortimore, M., 2009. Dryland opportunities: a new paradigm for people, ecosystems and development, Gland.
Mukheibir, P. & Ziervogel, G., 2007. Developing a Municipal Adaptation Plan (MAP) for climate change: the city
of Cape Town. Environment and Urbanization, 19(1), pp.143–158. Available at:
http://eau.sagepub.com/cgi/doi/10.1177/0956247807076912 [Accessed November 4, 2014].
Nicholls, R.J., 2004. Coastal flooding and wetland loss in the 21st century: changes under the SRES climate and
socio-economic scenario. Global Environmental Change, 14(1), pp.69–86.
Nicholls, R.J. et al., 2007. Ranking Port Cities with High Exposure and Vulnerability to Climate Extremes -
Executive Summary,
O’Brien, K. et al., 2012. Toward a Sustainable and Resilient Future Coordinating Lead Authors : Lead Authors :
Review Editors : Contributing Authors : In C. B. Field et al., eds. Managing the Risks of Extreme Events and
Disasters to Advance Climate Change Adaptation - A Special Report of Working Groups I and II of the
Intergovernmental Panel on Climate Change (IPCC). Cambridge UK: Cambridge University Press, pp. 437–
486.
Patt, A.. et al., 2008. Vulnerability Research and Assessment to Support Adaptation and Mitigation: Common
Themes from the Diversity of Approaches. In de la V.-K. A. C. Patt, A.G. Schröter, D., Klein, R. J. T., ed.
Assessing Vulnerability to Global Environmental Change. Making Research Useful for Adaptation Decision
Making and Policy. London.
Prasad, N. et al., 2009. Climate Resilient Cities. A Primer on Reducing Vulnerabilities to Disasters,
Ranger, N. et al., 2011. An assessment of the potential impact of climate change on flood risk in Mumbai. Climatic
Change, 104(1), pp.139–167.
Rayos Co, J., 2010. Human Settlements Working Paper Series Community-driven disaster intervention :
Experiences of the Homeless People ’ s Federation, Available at:
http://www.iied.org/pubs/display.php?o=10587IIED.
Revi, A., 2008. Climate change risk: an adaptation and mitigation agenda for Indian cities. Environment and
Urbanization, 20(1), pp.207–229. Available at: http://eau.sagepub.com/cgi/doi/10.1177/0956247808089157
[Accessed February 23, 2014].
Revi, A., Satterthwaite, . ., Arag n-Durand, F., et al., 2014. Urban Areas. In C. B. Field et al., eds. Climate
Change 2014: Impacts, Adaptation, and Vulnerability. Part A: Global and Sectoral Aspects Contribution of
Working Group II to the Fifth Assessment Report of the Intergovernmental Panel on Climate Change.
Cambridge, pp. 535–612.
Revi, A., Satterthwaite, D.E., Aragón-Durand, F., et al., 2014. Urban Areas. In C. B. Field et al., eds. Climate
Change 2014: Impacts, Adaptation, and Vulnerability. Part A: Global and Sectoral Aspects. Contribution of
Working Group II to the Fifth Assessment Report of the Intergovernmental Panel on Climate Change.
Cambridge, UK, pp. 535–612.
Roth, V. et al., 2002. A Resampling Approach to Cluster Validation,
Satterthwaite, D., 2009. The implications of population growth and urbanization for climate change. Environment
and Urbanization, 21(2), pp.545–567. Available at:
http://eau.sagepub.com/cgi/doi/10.1177/0956247809344361 [Accessed February 25, 2014].
Satterthwaite, D., 2007. The transition to a predominantly urban world and its underpinnings,
Schröter, D., Polsky, C. & Patt, A.G., 2005. Assessing vulnerabilities to the effects of global change: an eight step
approach. Mitigation and Adaptation Strategies for Global Change, pp.573–596.
Seneviratne, S.I. et al., 2012. Changes in Climate Extremes and their Impacts on the Natural Physical Environment
Coordinating. In C. B. Field et al., eds. Managing the Risks of Extreme Events and Disasters to Advance
Climate Change Adaptation - A Special Report of Working Groups I and II of the Intergovernmental Panel on
Climate Change (IPCC). Cambridge UK: Cambridge University Press, pp. 109–230.
Seto, K.C., Fragkias, M. & Gu, B., 2011a. A Meta-Analysis of Global Urban Land Expansion. PLOS one, 6(8).
Seto, K.C., Fragkias, M. & Gu, B., 2011b. A Meta-Analysis of Global Urban Land Expansion. PLOS one, 6(8).
Seto, K.C., Güneralp, B. & Hutyra, L.R., 2012. Global forecasts of urban expansion to 2030 and direct impacts on
biodiversity and carbon pools. Proceeding of the National Academy of Sciences, pp.1–6.
De Sherbinin, A., Schiller, A. & Pulsipher, A., 2007. The vulnerability of global cities to climate hazards.
Environment and Urbanization, 19(1), pp.39–64. Available at:
http://eau.sagepub.com/cgi/doi/10.1177/0956247807076725 [Accessed July 11, 2014].
Shlomo, A. et al, 2011. The dimensions of global urban expansion: Estimates and projections for all countries, 2000-
2050. Progress in Planning, 75(2), pp.53–107.
Sietz, ., 2014. Regionalisation of global insights into dryland vulnerability: Better reflecting smallholders’
vulnerability in Northeast Brazil. Global Environmental Change, 25, pp.173–185. Available at:
http://www.sciencedirect.com/science/article/pii/S0959378014000247 [Accessed March 24, 2014].
Sietz, D., Lüdeke, M.K.B. & Walther, C., 2011. Categorisation of typical vulnerability patterns in global drylands.
Global Environmental Change, 21(2), pp.431–440. Available at:
http://linkinghub.elsevier.com/retrieve/pii/S0959378010001081 [Accessed August 7, 2012].
Sietz, D., Mamani Choque, S.E. & Lüdeke, M.K.B., 2012. Typical patterns of smallholder vulnerability to weather
extremes with regard to food security in the Peruvian Altiplano. Regional Environmental Change, 12(3),
pp.489–505. Available at: http://link.springer.com/10.1007/s10113-011-0246-5 [Accessed January 2, 2015].
Stehfest, E. et al., 2014. Integrated Assessment of Global Environmental Change with IMAGE 3.0. Model
description and policy applications E. Stehfest et al., eds., Available at:
http://www.pbl.nl/en/publications/integrated-assessment-of-global-environmental-change-with-IMAGE-3.0.
Svirejeva-Hopkins, A., 2008. Urbanization as a global ecological process. Global Ecology, pp.3672–3678.
Syvitski, J.P.M. et al., 2009. Sinking deltas due to human activities. Nature Geoscience, 2(10), pp.681–686.
Available at: http://dx.doi.org/10.1038/ngeo629 [Accessed June 30, 2010].
Tacoli, C., MacGranahan, G. & Satterthwaite, D., 2008. Urbanization, poverty and inequity: Is rural-urban migration
a poverty problem. or part of the solution? In G. Martine et al., eds. The New Global Frontier: Urbanization,
Poverty and Environment in the 21st Century. London: Earth Scan, pp. 37–54.
Tanner, T. et al., 2009. Urban Governance for Adaptation: Assessing Climate Change Resilience in Ten Asian
Cities, Brighton.
The World Bank, 2006. World Development Indicators. Available at: www.worldbank.org/data.
Tolba, M.K. & Saab, N.W., 2009. Arab Environment : Climate Change Impact of Climate Change on Arab
Countries, Available at: http://www.afedonline.org.
Törnqvist, T.E. & Meffert, D.J., 2008. Sustaining coastal urban ecosystems. Nature Geoscience, 1(12), pp.805–807.
Available at: http://www.nature.com/doifinder/10.1038/ngeo365.
UN-HABITAT, 2011a. Cities and Climate Change - Global Report on Human Settlements,

UN-HABITAT, 2011b. Cities and Climate Change - Global Report on Human Settlements 2011, Available at:
http://mirror.unhabitat.org/pmss/listItemDetails.aspx?publicationID=3086.
UN-HABITAT, 2007. Global Report on Human Settlements - Enhancing Urban Safety and Security, Available at:
http://mirror.unhabitat.org/pmss/listItemDetails.aspx?publicationID=2432.
UN-HABITAT, 2008. State of the world cities 2008/09,
UNDESA, 2006. World Urbanization Prospects: The 2005 Revision, New York.
UNDESA, 2008. World Urbanization Prospects: The 2007 Revision, New York.
UNDESA, 2012. World Urbanization Prospects: The 2011 Revision, New York.
UNISDR, 2011. Global Assessment Report on Disaster Risk Reduction, Geneva, Switzerland.
UNSTAT, 2005. National Accounts Main Aggregates Database. United Nations Statistics Division.
Ward, J.H., 1963. Hierarchical grouping to optimize an objective function. Journal of the American Statistical
Association, 58, pp.236–244.
Wilbanks, T.. et al., 2007. Industry , settlement and society. In M. L. Parry et al., eds. Cambridge, pp. 357–390.
Annex
Indication
Some indicator datasets quantify changes over time (rather than a state) in order to accommodate for rapid
coastal urbanization as a process. The selection of the temporal resolution to indicate change was guided by
the most recent, globally complete time frame available for this ensemble of datasets. Data addressing a state
is predominantly from 2000, and data addressing change is exclusively for the period from 1990 to 2000. A
complete set of the georeferenced datasets for a more recent time frame was not available, partly because
some datasets are not updated.
We differentiate urban population pressure into rapid urban population increase (rapid urbanization) and
urban area increase (urban expansion) as a key process and a key mechanism in coastal urban areas. The
increase of urban dwellers over time relative to the existing urban population is the best indication of the scale
of the unprecedented coastal urbanization (UNDESA 2006). We indicate this process using relative urban
population increase (Table 1) by calculating the urban population increase from 1990 to 2000, expressed in per
cent, based on subnational urban population data on a 0.1° x 0.1° scale (Klein Goldewijk et al. 2010). Urban area
increase, i.e. the rate at which urban areas are encroaching surrounding non-urban areas (including coastal
ecosystems), is analogously indicated using urbanized area change per grid cell from 1990 to 2000 with a
spatial resolution of 0.1° x 0.1° (Klein Goldewijk et al. 2010). These two indicators are also employed in
establishing the areas of interest for this study (see Spatial delineation).
A crucial factor for determining the differential vulnerability of the urban poor (as opposed to non-poor) is the
percentage of urban population living in slums (Mehrota et al. 2011). For an urban-specific quantification of
marginalized populations we use the percentage of urban population living in poverty, proxied with a dataset
of slum population in per cent of urban population in the year 2000 (UN-HABITAT 2008). The change of slum
population from 1990 to 2000 was not used because of a high amount of country values missing for 1990,
which would have excluded these areas from the entire study and thus compromised the goal of a global
overview.
Being an important determinant of livelihoods and urban vulnerability, we use a measure of financial welfare to
contextualize the urban population living in poverty through average national income. For this we apply a
second indicator for poverty, i.e. average per capita income expressed by average per capita GDP (The World
Bank 2006; UNSTAT 2005). Combinations of these indicator values provide interpretable insights into the
prevalence of more vulnerable settlement types and livelihoods, and distributions of income and inequality.
We assume a measurement of how effectively governments handle managerial and planning challenges with
its services and policies determines how urban governments are positioned to deal with novel challenges
compounding with long-standing ones. Therefore we quantify planning and management capacity with the
government effectiveness dataset from the Worldwide Governance Indicators (WGI) dataset (Kaufmann et al.
2010). Government effectiveness captures perceptions of the quality of public services, the quality of the civil
service and the degree of its independence from political pressures, the quality of policy formulation and
implementation, and the credibility of the government's commitment to such policies. Interpreting values from
this indicator with per capita GDP also provides interpretable insights into the efficacy of planning and
management in translating relative wealth into government effectiveness in the face of rapid global change.
Recognizing a lack of global datasets on ecosystems services for coastal urban contexts, we compiled a
dataset on wetland prevalence surrounding urban areas. We combined the prevalence of key wetlands per grid
cell with the percentage to which wetlands immediately surround urban areas using wetland distribution and
urban-rural population distribution datasets (CIESIN 2005; Lehner & Doell 2004). While changes in prevalence
are not accounted for due to a lack of further time slices for the input data, combinations of this indicator with
the urban area change rate indicator help understand the distribution of the pressure of urban expansion on
ecosystem functions and services of wetlands.
Next, quantifying climate-related floods and cyclones is key, because lives and livelihoods are particularly
exposed and sensitive to them in coastal cities (Handmer et al. 2012). We use the high-resolution database of
natural hazard frequency and mortality distributions from Dilley et al., 2005. Scrutiny of the definitions for the
database’s frequency and mortality distributions for these two extreme events concluded that they
respectively denote exposure and sensitivity. This allows for quantifying these components of extreme event
vulnerability on a comparable basis. The exposures to cyclones and floods are indicated by using the respective
frequency datasets (Dilley et al. 2005). Cyclone frequency is based on storm tracks, and flood frequency is
based on ocean-based and river-based flood events. The sensitivities to cyclones and floods are indicated by
using the respective datasets of relative cyclone and flood hazard mortality rates (Dilley et al. 2005). These
datasets are based on local and regional hazard specific mortality records from 1981-2000. The data was
aggregated and averaged from the original spatial resolution of 2.5’ x 2.5’ to 0.5° x 0.5° grid cells.
Finally, we take into account that surging population growth in low-lying areas is increasing exposure by
putting an increasing number of settlements at risk to sea level rise and sea level extremes. Factors generating
vulnerability to inundation include long-term climate change related sea level rise, but also the related increase
of base heights of climatic extreme event-related coastal floods (Seneviratne et al. 2012). Acknowledging
further influences on relative sea level rise observed in coastal urban areas, e.g. from ground-related processes

such as subsidence and salt water intrusion, we broadly indicate overall population exposure to sea level rise
beyond climate change-related factors alone. For this we calculated the urban population percentage per grid
cell living in areas up to 2m above sea level, using urban population data (Klein Goldewijk et al. 2010), urban
land cover data from MODIS, and the digital elevation model STRM90 v4.1 (Jarvis et al. 2008). While sea level
rise is projected to rise by 0.52 to 0.98 m by 2100 compared to 1985-2005 for RCP8.5 (Church et al. 2013), an
additional increased incidence and/or magnitude of extreme high sea level is considered likely in the early 21st
century and very likely by the late 21st century (IPCC 2013), with a high confidence that extremes will increase
with mean sea level (Seneviratne et al. 2012). Regional differences in the aforementioned forces determining
sea level rise were not considered due to limitations of datasets with global coverage.
Data resolution and preparation
In this paper we understand urbanization demographically as an increase in urban population through
exogenous and endogenous growth. In addition to being the driving force behind urban expansion, this
population-driven definition allows for the use of high resolution urban population and area change data that
applies consistent definitions over time (UNDESA 2012; Grubler et al. 2012). In principle, our approach takes
cities and urban areas of all population sizes into account. Motivated by attaining a global overview, and by the
availability of subnational data for the selected indicators, we specify urban areas using established high-
resolution rasterized urban population data as opposed to using administrative boundaries. Furthermore,
there is a lack of city-specific datasets with global coverage for the majority of both our socioeconomic and
biophysical indicators, particularly for small- and medium-sized cities.
We delineate the area of interest the - global coastal fringe facing rapid urbanization - using data for 0.5°lon x
0.5°lat grid cells with above average urban population growth, coastal proximity, and minimum urban
population (see Annex section “spatial delineation” for details). This reduced 66,663 land grids cells to a mask
of 2036 cells (2.7 % of total land area, see the annex for details on the criteria applied for this reduction).
A high, subnational spatial resolution of the datasets is desirable to allow for sufficient differentiation within
heterogeneous coastal zones, and to resolve distinctive properties that set these zones apart from the
hinterland and non-urbanized coastal zones. These criteria are met for all biophysical datasets and, crucially, for
datasets indicating urban population and area increase. As a result subnational datasets were used for 8 out of
11 indicators (Table 1). For more details regarding the use of three datasets with national values see the annex.
All datasets with a different initial resolution that 0.5°lon x 0.5°lat resolution used for the cluster analysis were
aggregated or disaggregated to this resolution. For the proxy datasets with higher spatial resolution this
meant averaging or summing up values within each 0.5° grid cell. For the three datasets with national values,
this meant assigning the country value to each grid cell within the country.
Only grids cells with a complete set of 11 indicators are admitted to the cluster analysis. The 11 datasets were
checked for correlation. Two out of 55 pairs revealed a correlation coefficient above 0.6 which are significant
at the .05 level: Flood exposure and flood sensitivity (0.62), and cyclone exposure and cyclone sensitivity
(0.73). This can be explained by the multitude of cyclones-sensitive low-income countries with limited means
for adaptation exposed to tropical cyclones and flooding, Including both components of vulnerability for
floods and cyclones was crucial in this study with a focus on vulnerability, and multiple profiles reveal distinct
differences between exposure and sensitivity. GDP per cap and government effectiveness have a correlation of
0.54 at the .05 level, showing that higher income countries tend to have more effective governments. Income
is not used to construct the government effectiveness indicator. Both signify important aspects of adaptive
capacity in view of urbanization, and show different degrees of importance for shaping the typology, so the
correlation does not outweigh including both in the cluster analysis.
Socioeconomic data with subnational resolution and global coverage is not always readily available. For this
reason national datasets were used for average per capita income, urban population in poverty, and
government effectiveness. We also motivate per capita GDP on a national level to enable a differentiation
between coastal urban fringes in low- or middle income countries.
Spatial delineation of rapidly urbanizing coastal fringe
First, all grid cells intersecting a buffer reaching 50 ilometers inland from the world’s coastlines were selected
using the IMAGE land-ocean coastline (Stehfest et al. 2014). From these coastal grid cells we selected cells with
a total urban population exceeding 1000. This ruled out both purely rural coastal populations and cells with
mar edly low country thresholds for defining what an “urban” settlement is, such as 250 inhabitants for
Norway, from unbalancing more commonly applied higher thresholds (Svirejeva-Hopkins 2008). Finally, only
coastal urban grid cells with an annual urban population change of at least 2.25% from 1990 to 2000 were
selected. This change rate denotes above average, or rapid, urban population increase of at least 25% from
1990 to 2000 according to the UN World Urbanization Prospects (UNDESA 2008). The resulting mask
overwhelmingly comprises areas in low- and middle-income countries. This is in line with them being the locus
of rapid urbanization (UNDESA 2012; UNDESA 2008).
Cluster analysis
Before the cluster analysis is applied all the indicators were normalized to a 0-1-range using their minimum and
maximum values. Each indicator is fed in to the cluster analysis with the same weight. We applied the widely
known partitioning K-means method (Macqueen 1967). The initial partition for the algorithm was delivered by a
hierarchical clustering, using the Ward-method on a subset of the data (Ward 1963).
The data points, meaning the grid cell within the rapidly urbanizing coastal mask with the features described
above, are assigned to the k given initial clusters. Then the centers of the clusters are calculated and
subsequently the objects are assigned to the nearest cluster centers. This procedure minimizes the total
within-cluster sum-of-squares (TSS) criterion until a breakup criterion is reached.
The optimal number of clusters is determined by analyzing the stability of the different partitions for various
numbers of clusters. Thereby the algorithm is repeated 200 times with changing initial conditions, and by
comparing pairs of cluster partitions we calculate a consistency measure, showing how much the two cluster
results vary. A lower variety and a higher consistency measure for a pre-given number of clusters imply a higher
similarity between to the underlying structure in the data. The method belongs to the stability based methods
(Ben-Hur et al. 2002; Roth et al. 2002).