elliott d. pollack & company freudian economics to: gfoaz budget forum october 21, 2011 by: jim...
TRANSCRIPT

Elliott D. Pollack & Company
Freudian EconomicsTo:
GFOAz Budget Forum
October 21, 2011
By:Jim Rounds
Senior V.P., Elliott D. Pollack & Company

Elliott D. Pollack & Company
Freudian EconomicsThe Stooges Go to Washington
To:
GFOAz Budget Forum
October 21, 2011
By:Jim Rounds
Senior V.P., Elliott D. Pollack & Company
Elliott D. Pollack & Company
Freudian EconomicsD.C. Budget Balancing Tools:LOTS OF SEATS STILL AVAIL!
To:
GFOAz Budget Forum
October 21, 2011
By:Jim Rounds
Senior V.P., Elliott D. Pollack & Company

Elliott D. Pollack & Company
Going from Economic to
Psychological
“Tell me about your mother”

Elliott D. Pollack & Company
Going from Economic to
Political…
“Whoop whoop!”
Elliott D. Pollack & Company
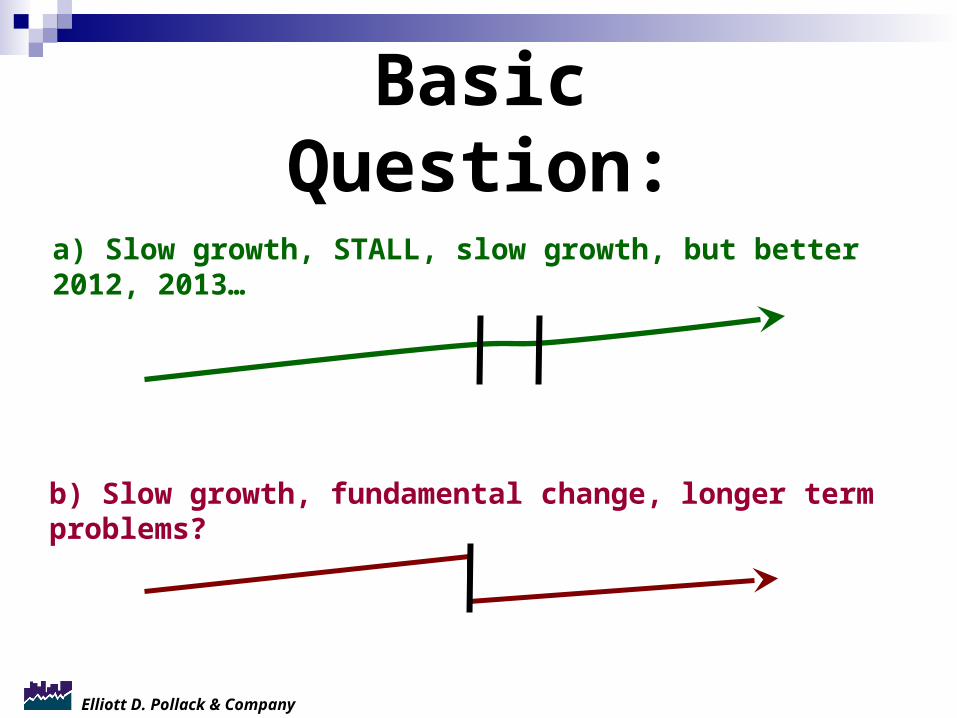
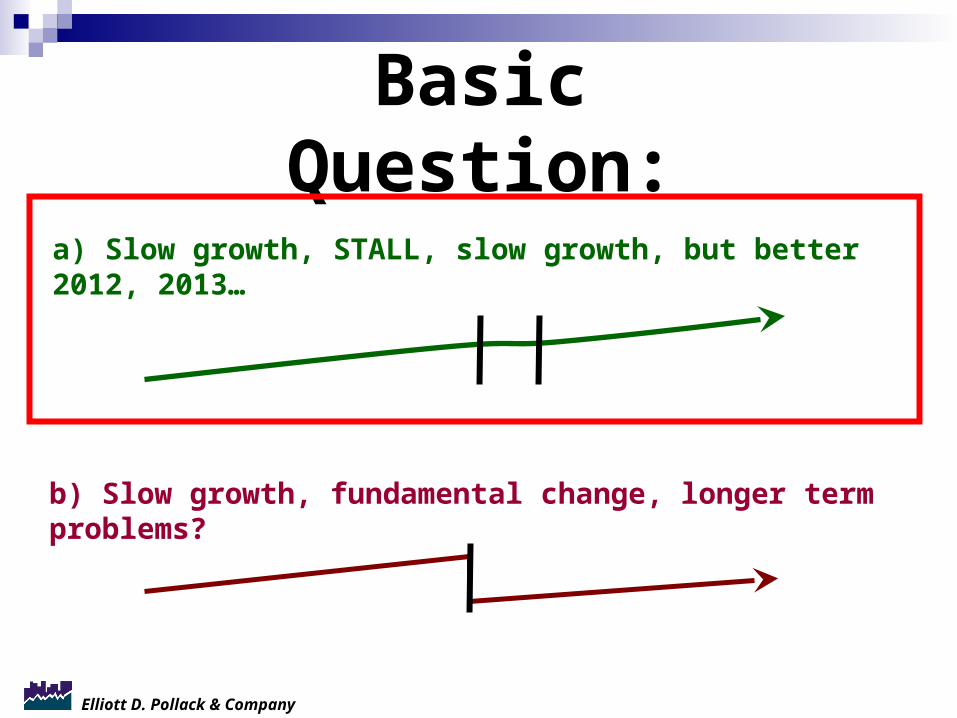
a) Slow growth, STALL, slow growth, but better 2012, 2013…
b) Slow growth, fundamental change, longer term problems?
Basic Question:

Elliott D. Pollack & Company
U.S. Conditions

Elliott D. Pollack & Company
Signs of a Double Dip – Look for Declines in these Main
Economic Categories
Real GDP Real Income Employment Industrial Production Wholesale – Retail Sales
Elliott D. Pollack & Company
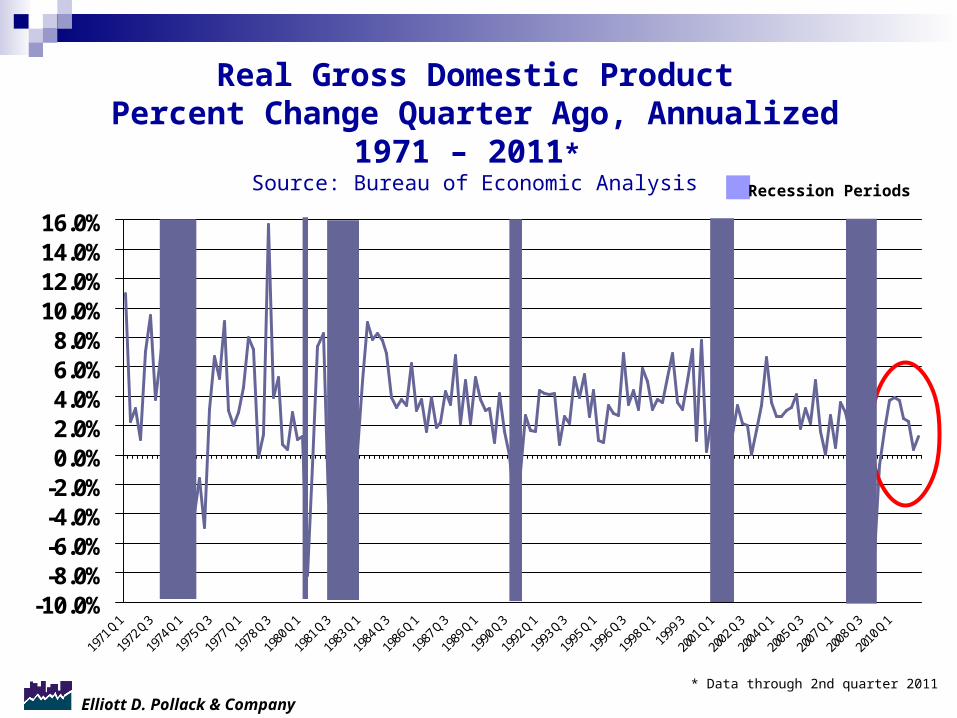
Real Gross Domestic ProductPercent Change Quarter Ago, Annualized
1971 – 2011* Source: Bureau of Economic Analysis
-10.0%-8.0%-6.0%-4.0%-2.0%0.0%2.0%4.0%6.0%8.0%
10.0%12.0%14.0%16.0%
1971 Q
1
1972 Q
3
1974 Q
1
1975 Q
3
1977 Q
1
1978 Q
3
1980 Q
1
1981 Q
3
1983 Q
1
1984 Q
3
1986 Q
1
1987 Q
3
1989 Q
1
1990 Q
3
1992 Q
1
1993 Q
3
1995 Q
1
1996 Q
3
1998 Q
1
1999 3
2001 Q
1
2002 Q
3
2004 Q
1
2005 Q
3
2007 Q
1
2008 Q
3
2010 Q
1
* Data through 2nd quarter 2011
Recession Periods
Elliott D. Pollack & Company
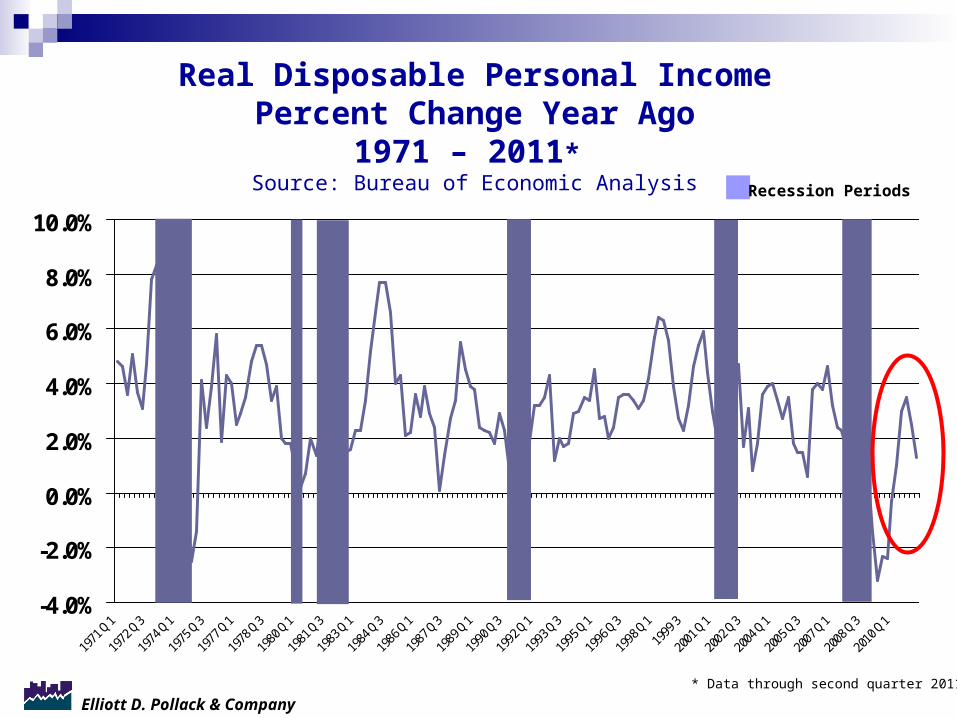
Real Disposable Personal IncomePercent Change Year Ago
1971 – 2011* Source: Bureau of Economic Analysis
-4.0%
-2.0%
0.0%
2.0%
4.0%
6.0%
8.0%
10.0%
1971 Q
1
1972 Q
3
1974 Q
1
1975 Q
3
1977 Q
1
1978 Q
3
1980 Q
1
1981 Q
3
1983 Q
1
1984 Q
3
1986 Q
1
1987 Q
3
1989 Q
1
1990 Q
3
1992 Q
1
1993 Q
3
1995 Q
1
1996 Q
3
1998 Q
1
1999 3
2001 Q
1
2002 Q
3
2004 Q
1
2005 Q
3
2007 Q
1
2008 Q
3
2010 Q
1
* Data through second quarter 2011
Recession Periods
Elliott D. Pollack & Company
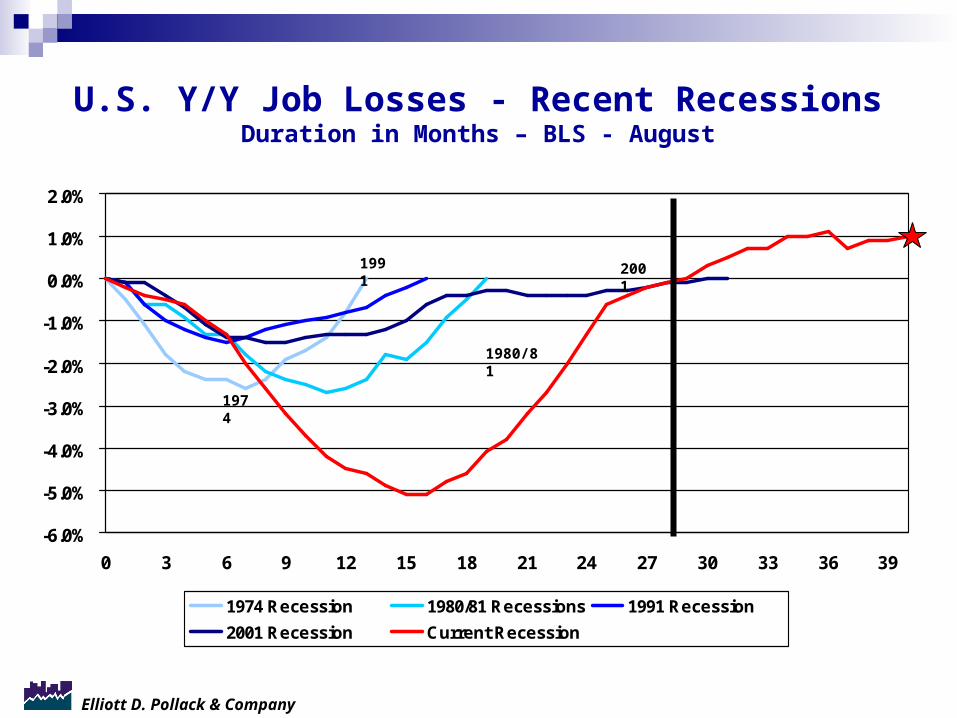
U.S. Y/Y Job Losses - Recent RecessionsDuration in Months – BLS - August
-6.0%
-5.0%
-4.0%
-3.0%
-2.0%
-1.0%
0.0%
1.0%
2.0%
0 3 6 9 12 15 18 21 24 27 30 33 36 39
1974 Recession 1980/81 Recessions 1991 Recession
2001 Recession Current Recession
1980/81
1974
20011991
Elliott D. Pollack & Company
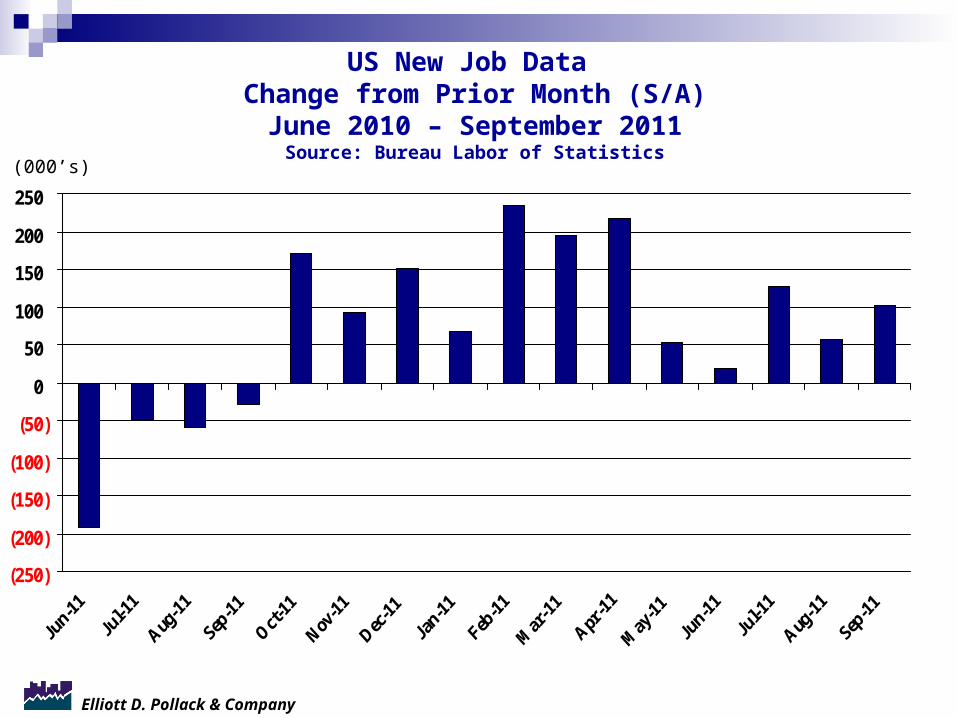
US New Job Data Change from Prior Month (S/A)June 2010 – September 2011
Source: Bureau Labor of Statistics
(250)
(200)
(150)
(100)
(50)
0
50
100
150
200
250
(000’s)

Elliott D. Pollack & Company
Industrial ProductionPercent Change Year Ago
1973 – 2011* Source: The Conference Board
-16%-14%-12%
-10%-8%-6%-4%-2%0%
2%4%6%8%
10%
12%14%16%
*Data through July 2011
Recession Periods
Elliott D. Pollack & Company
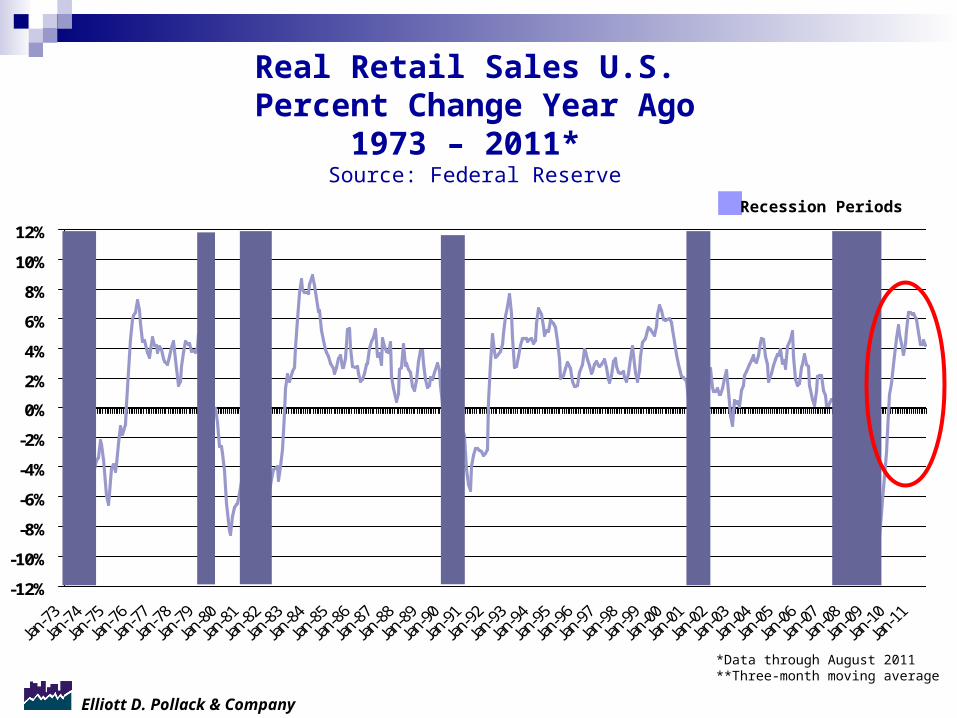
Real Retail Sales U.S. Percent Change Year Ago
1973 – 2011* Source: Federal Reserve
-12%
-10%
-8%
-6%
-4%
-2%
0%
2%
4%
6%
8%
10%
12%
*Data through August 2011**Three-month moving average
Recession Periods
Elliott D. Pollack & Company
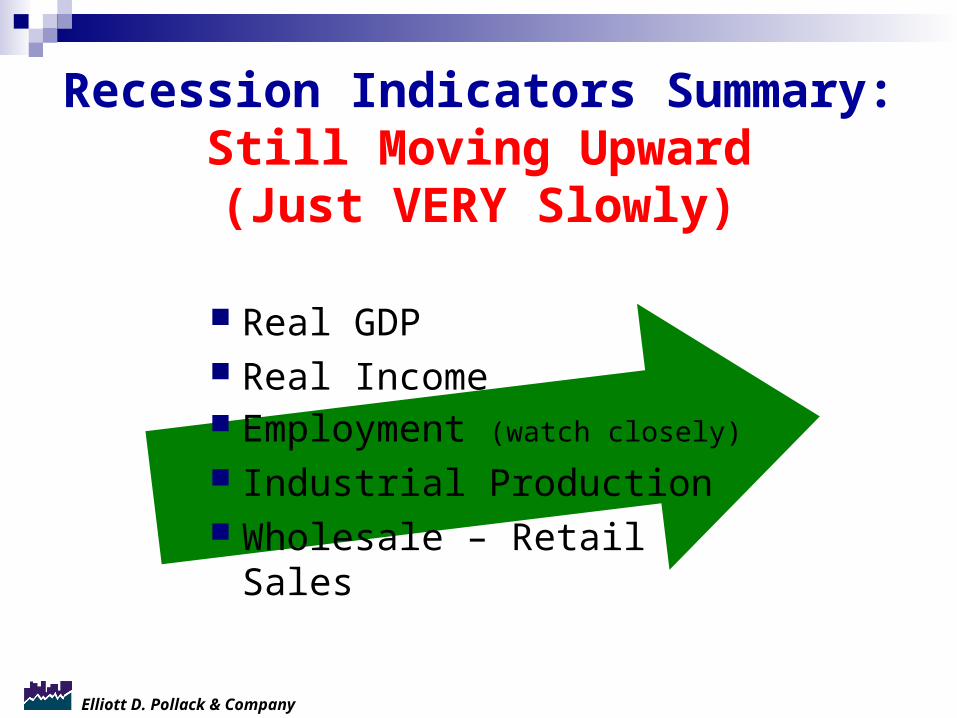
Recession Indicators Summary:Still Moving Upward(Just VERY Slowly)
Real GDP Real Income Employment (watch closely)
Industrial Production Wholesale – Retail Sales

Elliott D. Pollack & Company
Household Net Worth ($$$)1970 – 2011*
Source: Federal Reserve
0
10
20
30
40
50
60
70
•Data through second quarter 2011.
Recession Periods($ in trillions)
But still feel poor…

Elliott D. Pollack & Company
Consumer Confidence1978 – 2011*
Source: The Dismal Scientist
20
30
40
50
60
70
80
90
100
110
120
130
140
150
*Data through September 2011
Recession Periods
1985 Benchmark = 100

Elliott D. Pollack & Company
Jobs are being created but not quickly enough.
Those that have jobs are spending a little more but will remain cautious.
Most of those that don’t have jobs probably won’t anytime soon.
Wealth levels are improving but people still feel poor.
Will the additional uncertainty translate into reduced consumer spending?
Consumer Summary:

Elliott D. Pollack & Company
BusinessDepends on the sector…

Elliott D. Pollack & Company
Corporate Profit (Billions of Dollars, SA)
1975-2011*Source: BEA
0
200
400
600
800
1,000
1,200
1,400
1,600
1,800
2,000
*Data through second quarter 2011
Recession Periods
Elliott D. Pollack & Company
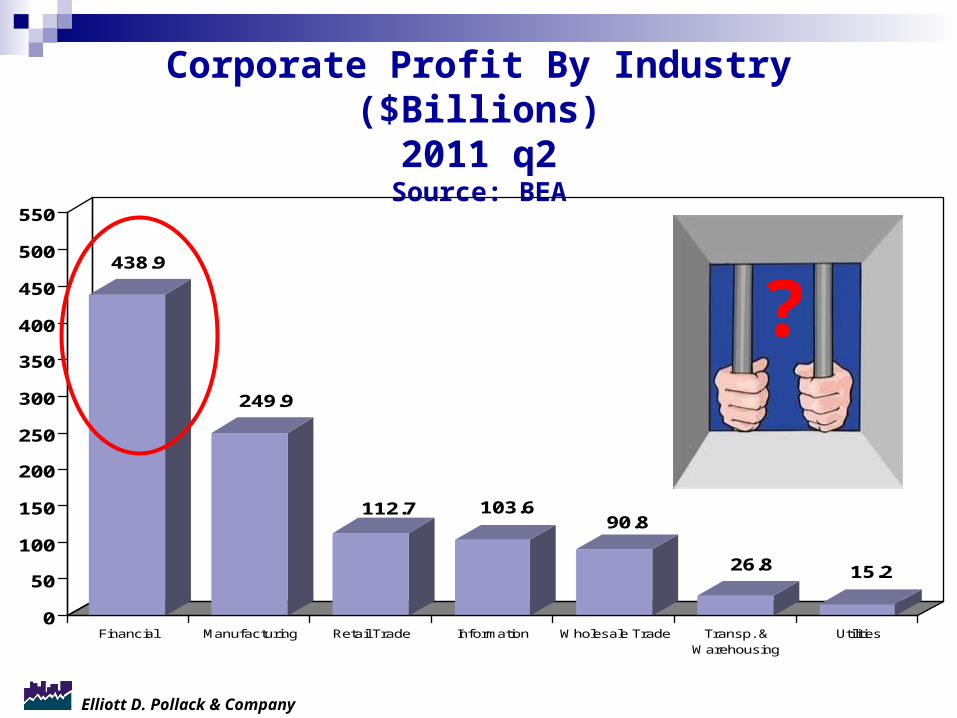
Corporate Profit By Industry ($Billions)2011 q2
Source: BEA
438.9
249.9
112.7 103.690.8
26.8 15.2
0
50
100
150
200
250
300
350
400
450
500
550
Financial Manufacturing Retail Trade Information Wholesale Trade Transp. &Warehousing
Utilities
?

Elliott D. Pollack & Company
U.S. Real Exports as a Percent of Real GDP
1971 – 2011* Source: Bureau of Economic Analysis
2.0%
4.0%
6.0%
8.0%
10.0%
12.0%
14.0%
1971 Q
1
1973 Q
1
1975 Q
1
1977 Q
1
1979 Q
1
1981 Q
1
1983 Q
1
1985 Q
1
1987 Q
1
1989 Q
1
1991 Q
1
1993 Q
1
1995 Q
1
1997 Q
1
1999 Q
1
2001 Q
1
2003 Q
1
2005 Q
1
2007 Q
1
2009 Q
1
2011 Q
1
Recession Periods
*Data through second quarter 2011
Elliott D. Pollack & Company
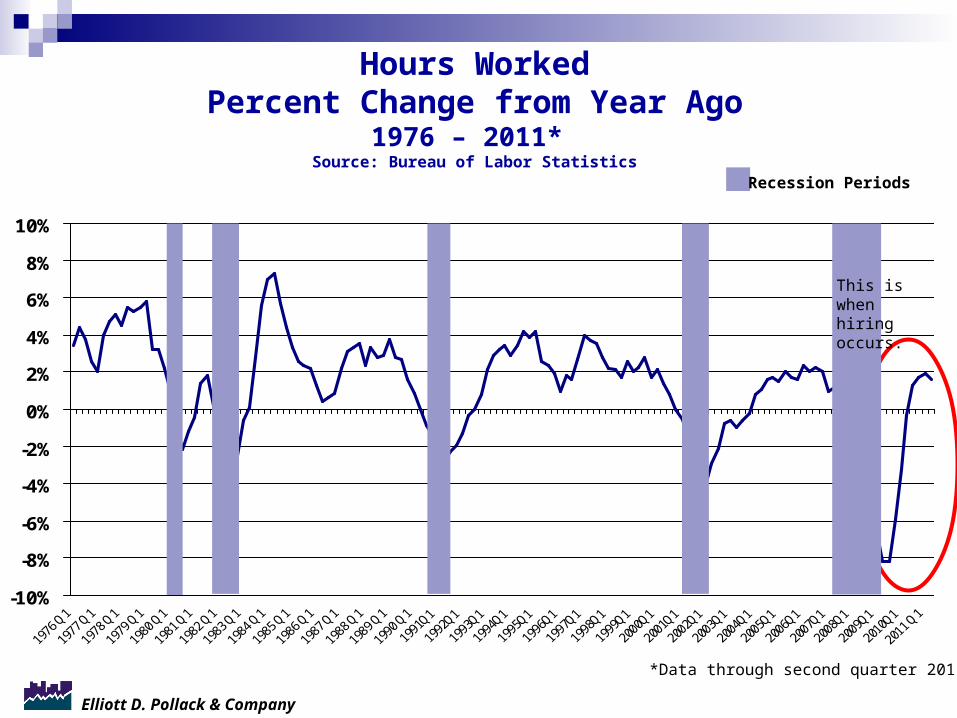
Hours WorkedPercent Change from Year Ago
1976 – 2011* Source: Bureau of Labor Statistics
-10%
-8%
-6%
-4%
-2%
0%
2%
4%
6%
8%
10%
Recession Periods
*Data through second quarter 2011
This is when hiring occurs.
Elliott D. Pollack & Company
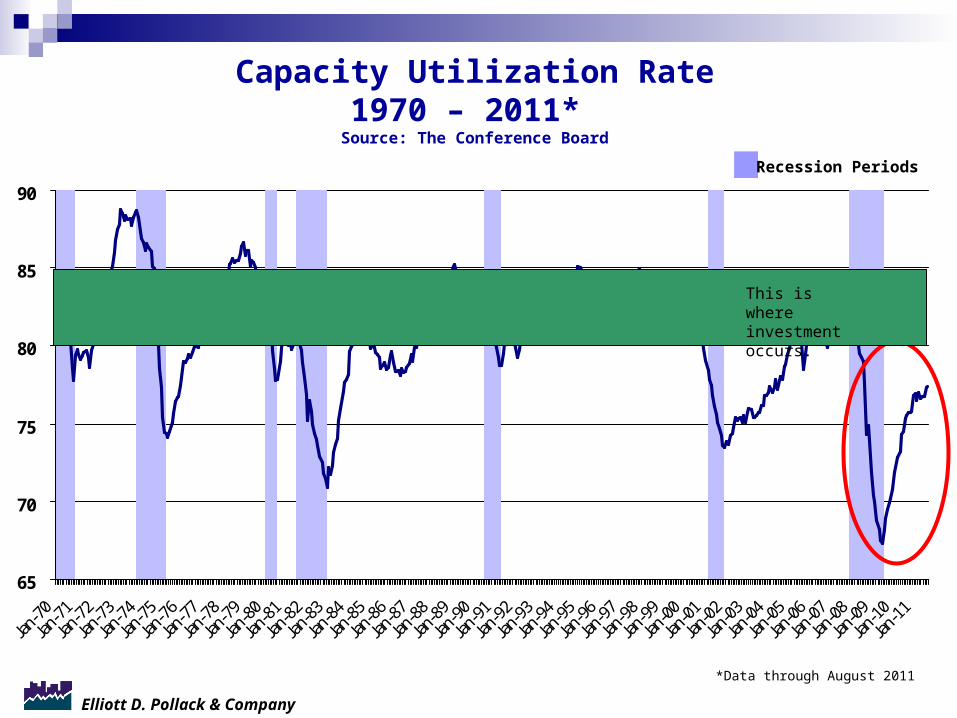
Capacity Utilization Rate1970 – 2011*
Source: The Conference Board
65
70
75
80
85
90
Jan-
70
Jan-
71
Jan-
72
Jan-
73
Jan-
74
Jan-
75
Jan-
76
Jan-
77
Jan-
78
Jan-
79
Jan-
80
Jan-
81
Jan-
82
Jan-
83
Jan-
84
Jan-
85
Jan-
86
Jan-
87
Jan-
88
Jan-
89
Jan-
90
Jan-
91
Jan-
92
Jan-
93
Jan-
94
Jan-
95
Jan-
96
Jan-
97
Jan-
98
Jan-
99
Jan-
00
Jan-
01
Jan-
02
Jan-
03
Jan-
04
Jan-
05
Jan-
06
Jan-
07
Jan-
08
Jan-
09
Jan-
10
Jan-
11
*Data through August 2011
Recession Periods
This is where investment occurs.

Elliott D. Pollack & Company
Profits are high, but…
Business spending on plant will be slow for now, but getting closer to seeing some limited investment. Delayed?
Hiring will still be relatively slow, but more pressure to hire soon. Delayed?
Lots of money sitting on the sidelines.
Business Summary:

Elliott D. Pollack & Company
U.S. Summary:Recovering but not recovered.
Lots of small shocks thus far but none have been game changers (Europe could possibly be
one though; anything unexpected possible?).
Stimulus package doesn’t address the real problem. Feds need to balance their
checkbook.
Elliott D. Pollack & Company
a) Slow growth, STALL, slow growth, but better 2012, 2013…
b) Slow growth, fundamental change, longer term problems?
Basic Question:

Elliott D. Pollack & Company
Arizona
Elliott D. Pollack & Company
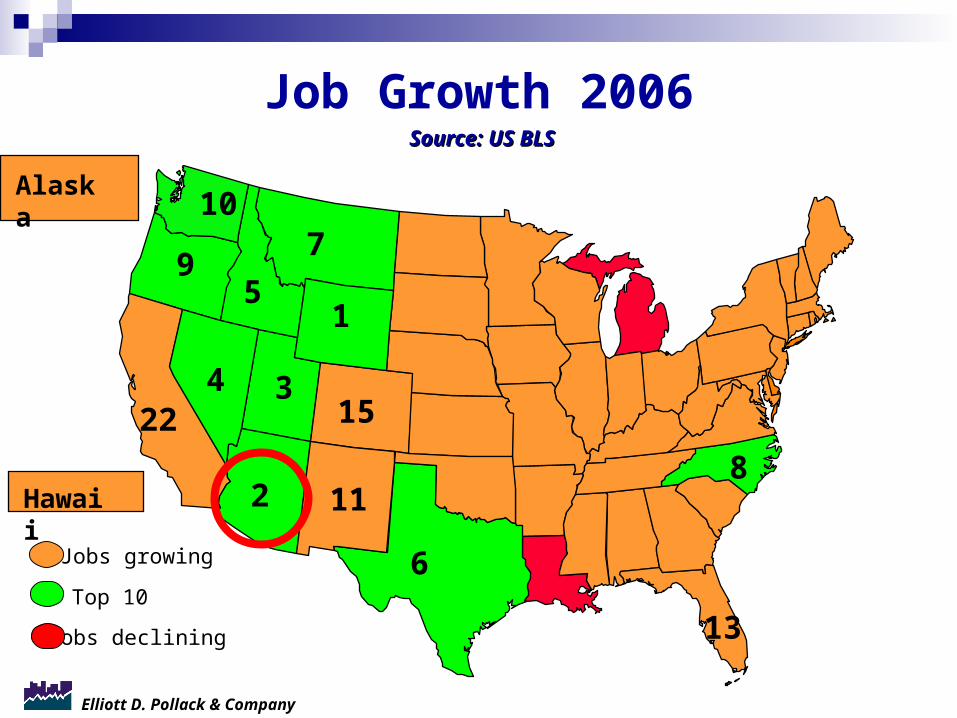
9
4
15
2
10
3
7
Job Growth 2006
11
15
6
22
8
Source: US BLSSource: US BLS
13
Jobs growing
Jobs declining
Top 10
Hawaii
Alaska
Elliott D. Pollack & Company
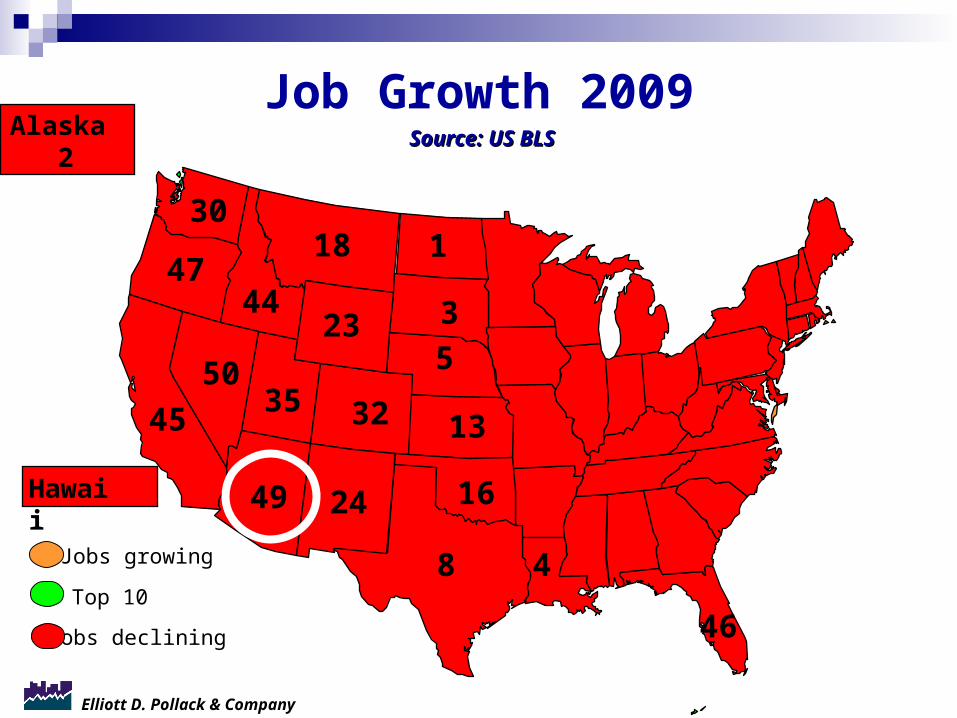
5
49
23
3545
4
32
8
24
47
50
44
1
16
3
Alaska 2
13
1830
Job Growth 2009Source: US BLSSource: US BLS
46
Jobs growing
Jobs declining
Top 10
Hawaii

Elliott D. Pollack & Company
19
9
August 2011 v August 2010
32
2
24 30
3
39
16
Job Growth Update: Arizona Ranked 32nd
45
29
1
5
20
Alaska 6
50
815
35Jobs growing
Jobs decliningTop 10
Hawaii
18
10
25
11
21
4
7
Elliott D. Pollack & Company
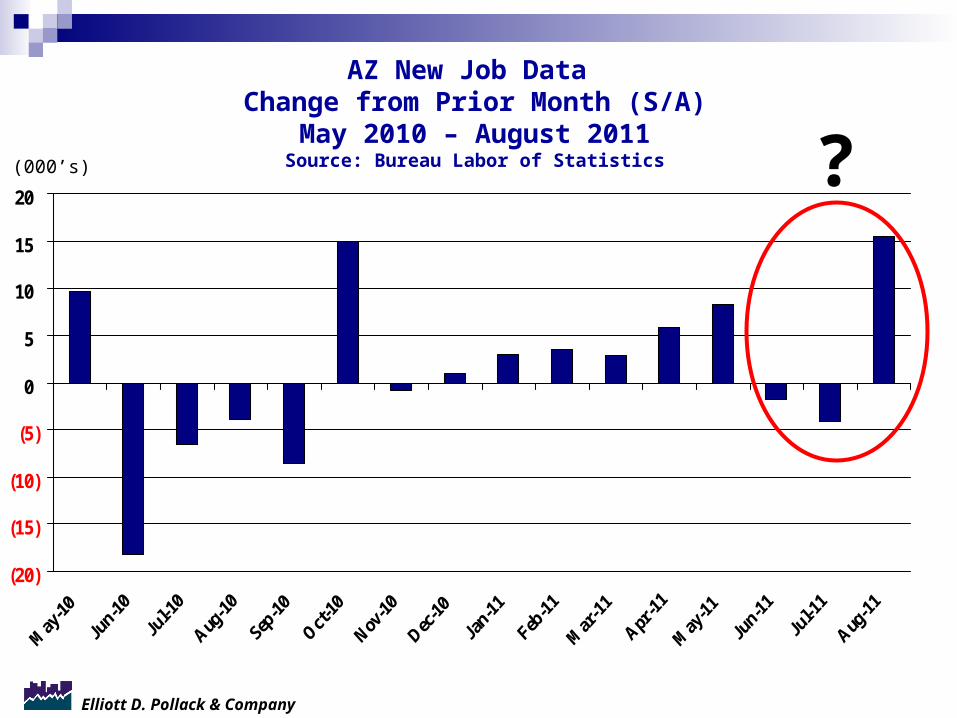
AZ New Job Data Change from Prior Month (S/A)
May 2010 – August 2011Source: Bureau Labor of Statistics
(20)
(15)
(10)
(5)
0
5
10
15
20
(000’s) ?
Elliott D. Pollack & Company
In 2008, 2009, and 2010 no one showed up! Or, at least
very few.

Elliott D. Pollack & Company
2.1%
3.7%
4.2%
4.7%
3.9%
3.3%
3.0%
3.1%
4.3%
5.1%
4.2%4.4%
2.9%
2.5%
1.3%
2.4%
2.8%
3.5%
4.3%
4.6%
4.2%4.2%
3.8%
4.3% 4.3%
3.1%
3.2%3.3%
3.4% 3.4%
2.7%2.5%
1.6%
1.0%1.0%
1.5%
2.0%
0%
2%
4%
6%
1976 1979 1982 1985 1988 1991 1994 1997 2000 2003 2006 2009 2012
Greater Phoenix Population Annual Percent Change 1976–2012*
Source: Arizona State University & Department of Commerce, Research Administration
2008 and 2009 are estimates put out by ADES and may be subject to substantial revision.
* 2011 & 2012 forecast is from Elliott D. Pollack & Co. Recession Periods
*2000-2010 estimates based on 2010 Census release
?
Elliott D. Pollack & Company
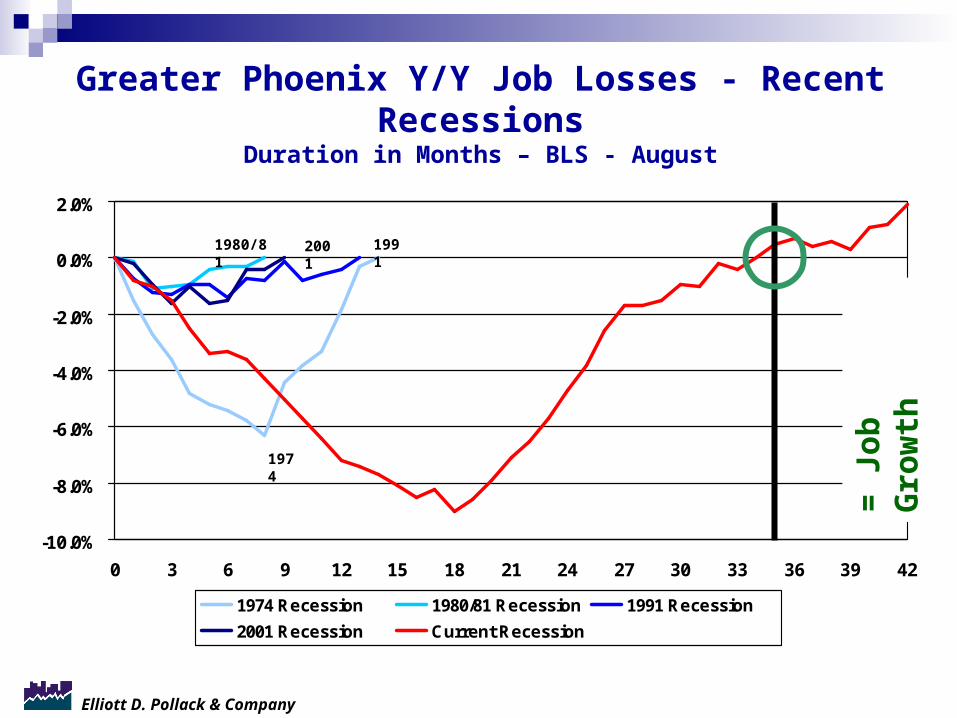
Greater Phoenix Y/Y Job Losses - Recent RecessionsDuration in Months – BLS - August
-10.0%
-8.0%
-6.0%
-4.0%
-2.0%
0.0%
2.0%
0 3 6 9 12 15 18 21 24 27 30 33 36 39 42
1974 Recession 1980/81 Recession 1991 Recession
2001 Recession Current Recession
1980/81
1974
2001 1991
= J
ob
Gro
wth

Elliott D. Pollack & Company
Greater Phoenix Employment* Source: Bureau of Labor Statistics
Sectors in Decline
Net
Change
Federal Government -1,000
Prof. & Bus. Services -4,200
*August 2011/August 2010
Sectors Improving
Net
Change
Education & Health Services 14,700
Leisure & Hospitality 7,100
Transp, Trade, & Utilities 4,900
Construction 2,300
Financial Activities 2,300
Manufacturing 1,900
Other services 1,800
State Government 600
Local Government 400
Mining 300
Information 200
Elliott D. Pollack & Company
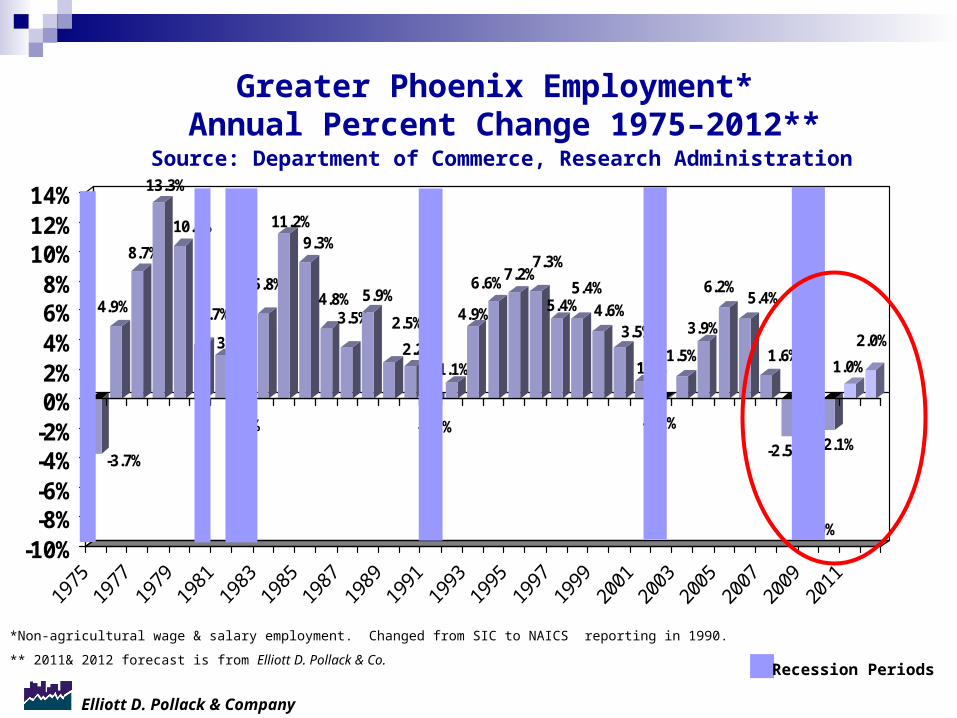
Greater Phoenix Employment* Annual Percent Change 1975–2012**
Source: Department of Commerce, Research Administration
-3.7%
4.9%
8.7%
13.3%
10.4%
3.7%
3.0%
-0.1%
5.8%
11.2%9.3%
4.8%3.5%
5.9%
2.5%
2.2%
-0.3%
1.1%
4.9%
6.6%7.2%7.3%
5.4%5.4%
4.6%3.5%
1.2%
-0.1%
1.5%
3.9%
6.2%5.4%
1.6%
-2.5%
-7.9%
-2.1%
1.0%
2.0%
-10%-8%-6%-4%-2%0%2%4%6%8%
10%12%14%
*Non-agricultural wage & salary employment. Changed from SIC to NAICS reporting in 1990.
** 2011& 2012 forecast is from Elliott D. Pollack & Co.
Recession Periods

Elliott D. Pollack & Company
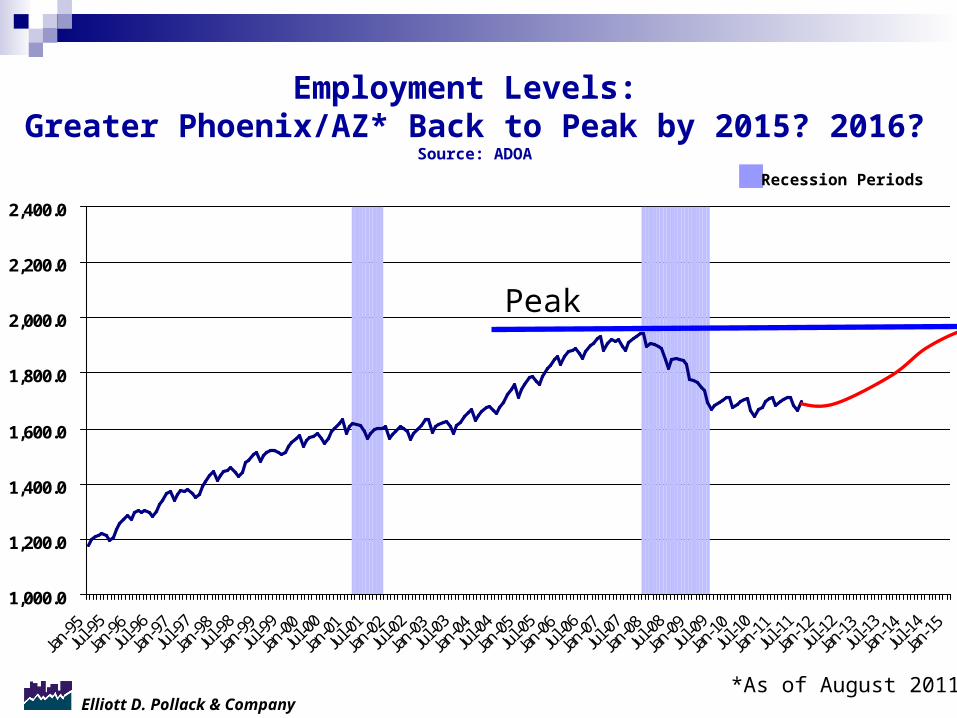
This is NOT a multi decade recovery…
Think 2015 – 2016 for full recovery, but growth before
then.
Elliott D. Pollack & Company
Employment Levels: Greater Phoenix/AZ* Back to Peak by 2015? 2016?
Source: ADOA
1,000.0
1,200.0
1,400.0
1,600.0
1,800.0
2,000.0
2,200.0
2,400.0
Recession Periods
Peak
*As of August 2011

Elliott D. Pollack & Company
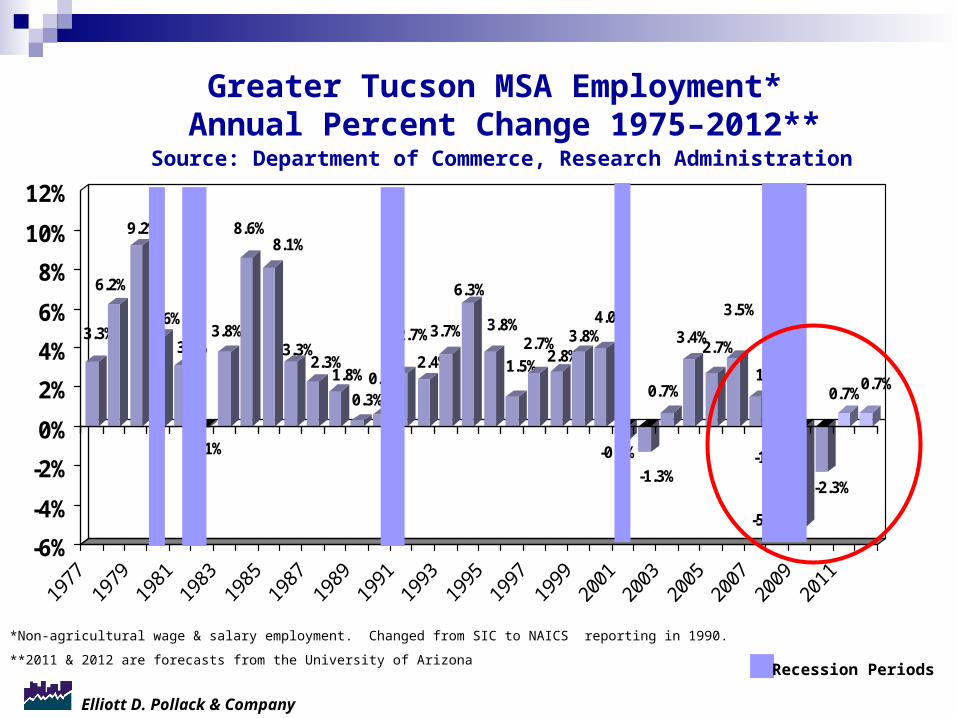
For individual communities: similar issues, just different
scale of impact.
Elliott D. Pollack & Company
Greater Tucson MSA Employment* Annual Percent Change 1975–2012**
Source: Department of Commerce, Research Administration
3.3%
6.2%
9.2%
4.6%
3.1%
-0.1%
3.8%
8.6%8.1%
3.3%2.3%
1.8%
0.3%0.6%
2.7%
2.4%
3.7%
6.3%
3.8%
1.5%2.7%
2.8%3.8%
4.0%
-0.7%
-1.3%
0.7%
3.4%2.7%
3.5%
1.5%
-1.0%
-5.1%
-2.3%
0.7%0.7%
-6%
-4%
-2%
0%
2%
4%
6%
8%
10%
12%
*Non-agricultural wage & salary employment. Changed from SIC to NAICS reporting in 1990.
**2011 & 2012 are forecasts from the University of Arizona
Recession Periods
Elliott D. Pollack & Company
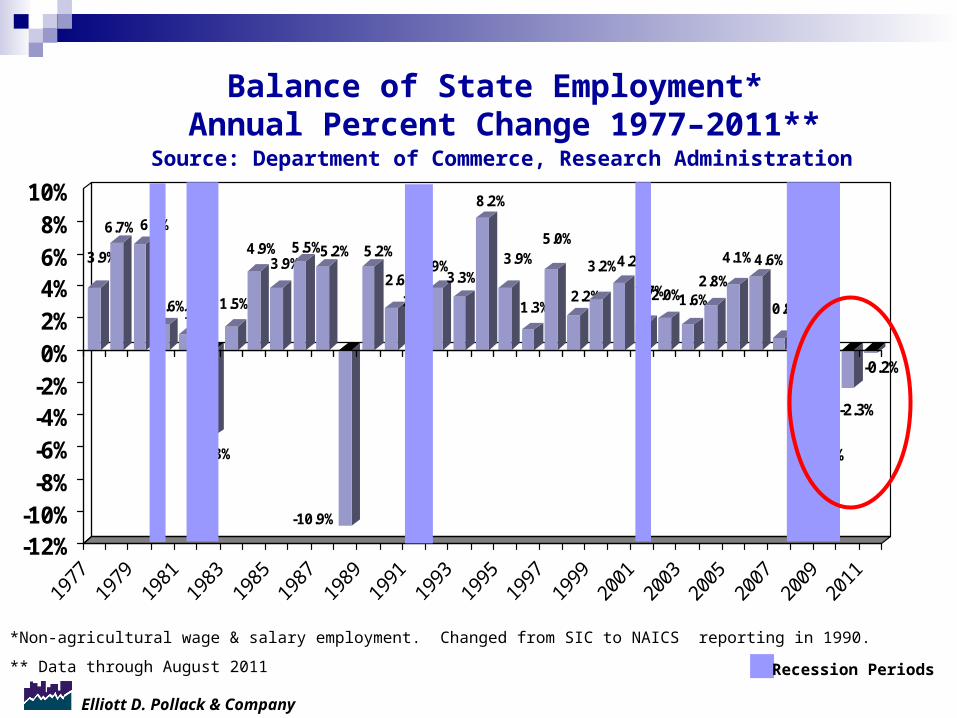
Balance of State Employment* Annual Percent Change 1977–2011**
Source: Department of Commerce, Research Administration
3.9%
6.7% 6.6%
1.6%1.0%
-5.3%
1.5%
4.9%3.9%
5.5%5.2%
-10.9%
5.2%
2.6%
2.2%
3.9%3.3%
8.2%
3.9%
1.3%
5.0%
2.2%
3.2%4.2%
1.7%2.0%1.6%2.8%
4.1%4.6%
0.8%
-2.2%
-5.5%
-2.3%
-0.2%
-12%-10%
-8%-6%-4%-2%0%2%4%6%8%
10%
*Non-agricultural wage & salary employment. Changed from SIC to NAICS reporting in 1990.
** Data through August 2011
Recession Periods

Elliott D. Pollack & Company
Single Family Housing
Elliott D. Pollack & Company
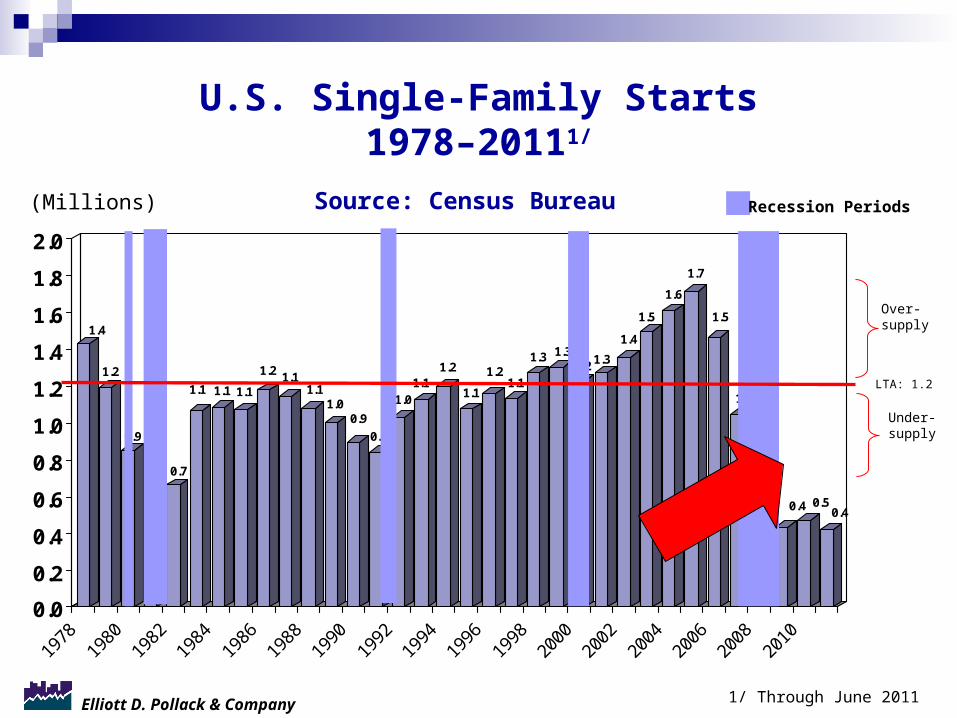
U.S. Single-Family Starts1978–20111/
Source: Census Bureau
1.4
1.2
0.9
0.7 0.7
1.1 1.1 1.1
1.2 1.11.1
1.00.9
0.8
1.01.1
1.2
1.1
1.21.1
1.3 1.31.2 1.3
1.4
1.5
1.6
1.7
1.5
1.0
0.6
0.4 0.50.4
0.0
0.2
0.4
0.6
0.8
1.0
1.2
1.4
1.6
1.8
2.0
1978
1980
1982
1984
1986
1988
1990
1992
1994
1996
1998
2000
2002
2004
2006
2008
2010
(Millions)
1/ Through June 2011
Recession Periods
Over-supply
Under-supply
LTA: 1.2
Elliott D. Pollack & Company
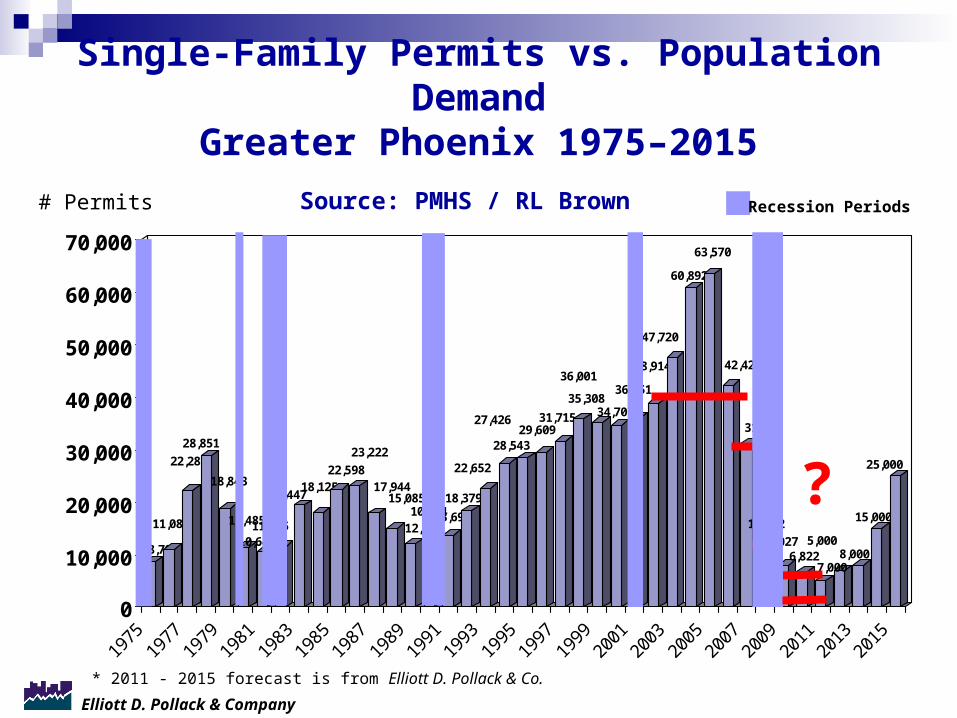
Single-Family Permits vs. Population DemandGreater Phoenix 1975–2015
Source: PMHS / RL Brown
8,705
11,081
22,281
28,851
18,843
11,485
10,64911,625
19,44718,125
22,598
23,222
17,94415,085
12,00010,61413,698
18,379
22,652
27,426
28,54329,609
31,715
36,001
35,30834,701
36,151
38,914
47,720
60,892
63,570
42,423
31,172
12,582
8,0276,822
5,000
7,0008,000
15,000
25,000
0
10,000
20,000
30,000
40,000
50,000
60,000
70,000
1975
1977
1979
1981
1983
1985
1987
1989
1991
1993
1995
1997
1999
2001
2003
2005
2007
2009
2011
2013
2015
# Permits Recession Periods
* 2011 - 2015 forecast is from Elliott D. Pollack & Co.
?
Elliott D. Pollack & Company
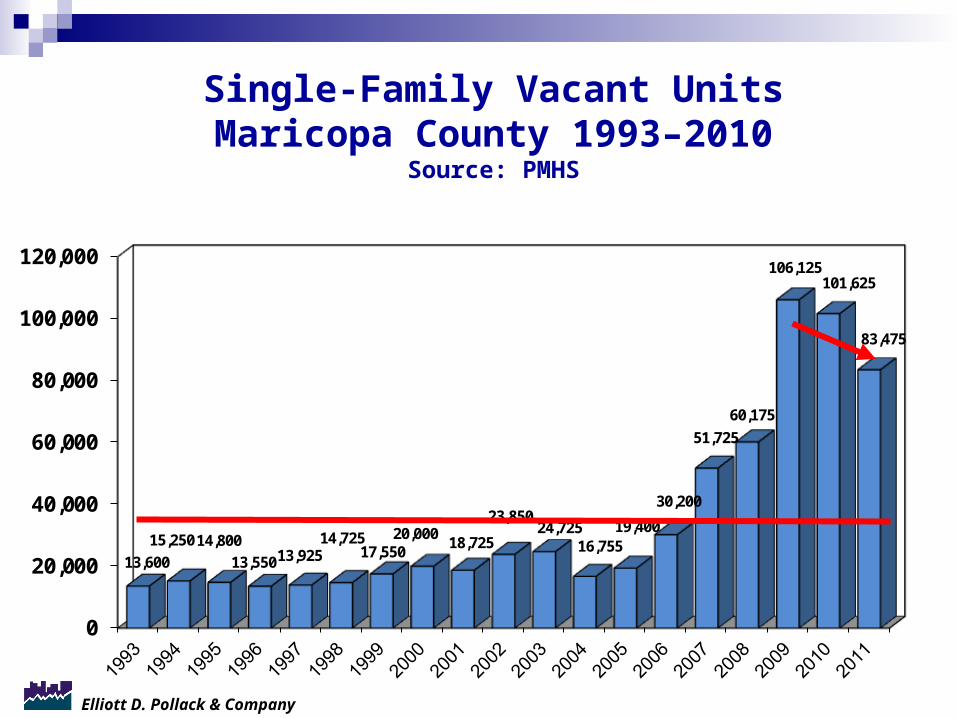
Single-Family Vacant UnitsMaricopa County 1993–2010
Source: PMHS
0
20,000
40,000
60,000
80,000
100,000
120,000
13,600
15,250 14,800
13,550 13,925 14,725
17,550 20,000
18,725
23,850 24,725
16,755 19,400
30,200
51,725
60,175
106,125 101,625
83,475
Elliott D. Pollack & Company
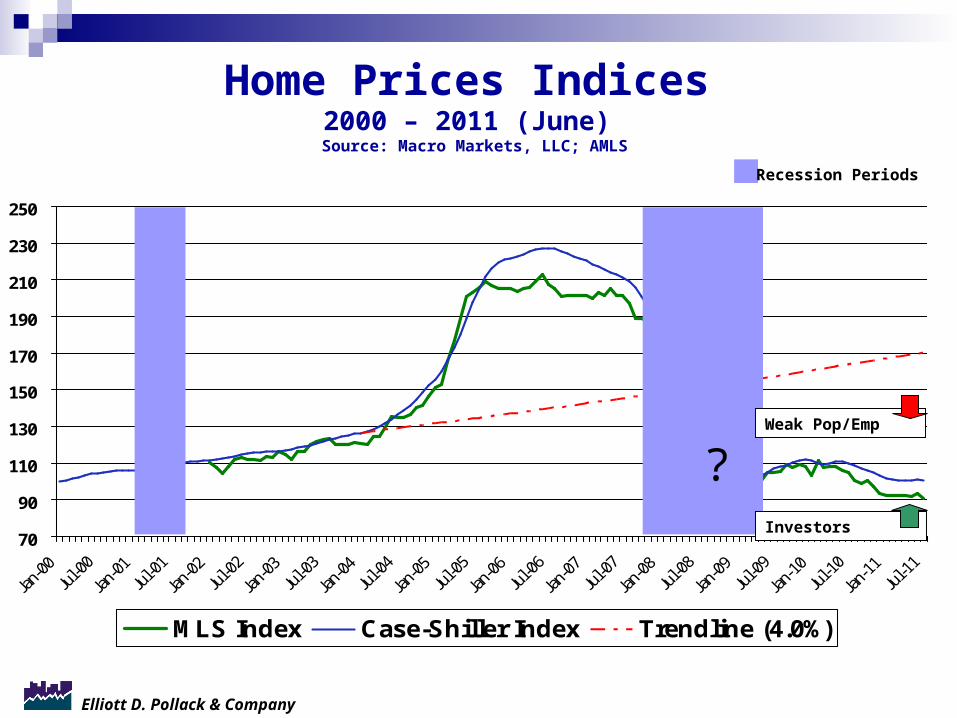
Home Prices Indices 2000 – 2011 (June)
Source: Macro Markets, LLC; AMLS
70
90
110
130
150
170
190
210
230
250
MLS Index Case-Shiller Index Trendline (4.0%)
Recession Periods
Weak Pop/Emp
Investors
?

Elliott D. Pollack & Company
Negative Equity in Homes Affects Ability to Sell or Buy
Source: First American Core Logic
50% of homes with mortgages in Arizona have negative equity.

Elliott D. Pollack & Company
Commercial
Elliott D. Pollack & Company
Commercial Markets
(Not making things worse anymore)
Elliott D. Pollack & Company
Revenue Question:
How long will commercial values be depressed?
Elliott D. Pollack & Company
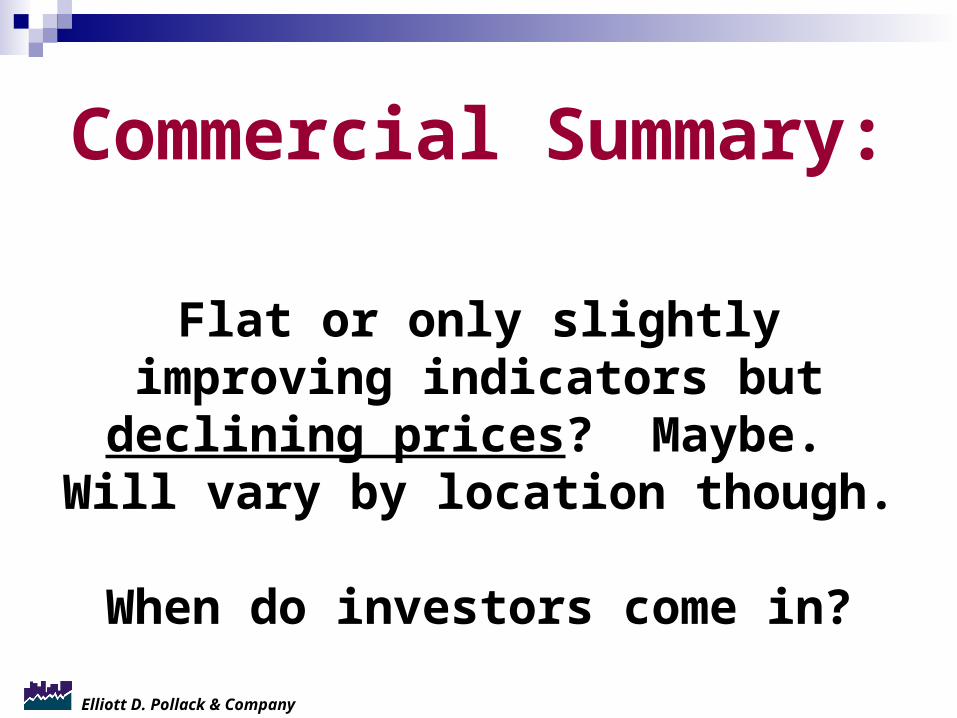
Commercial Summary:
Flat or only slightly improving indicators but declining prices?
Maybe. Will vary by location though.
When do investors come in?
Elliott D. Pollack & Company
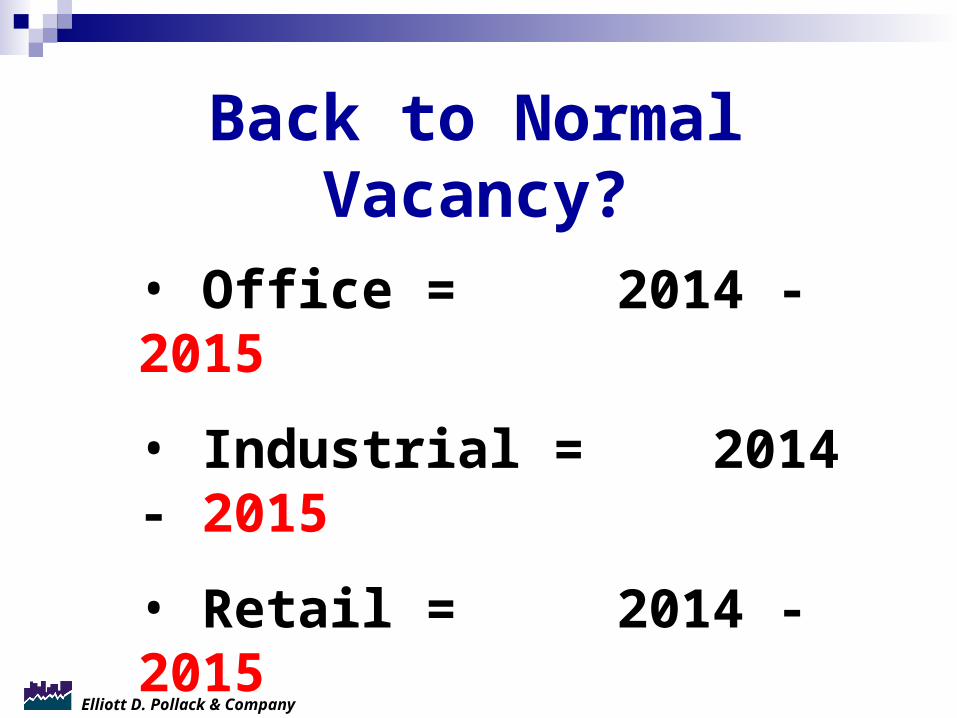
Back to Normal Vacancy?
• Office = 2014 - 2015
• Industrial = 2014 - 2015
• Retail = 2014 - 2015
Elliott D. Pollack & Company
Tax Revenues
Elliott D. Pollack & Company
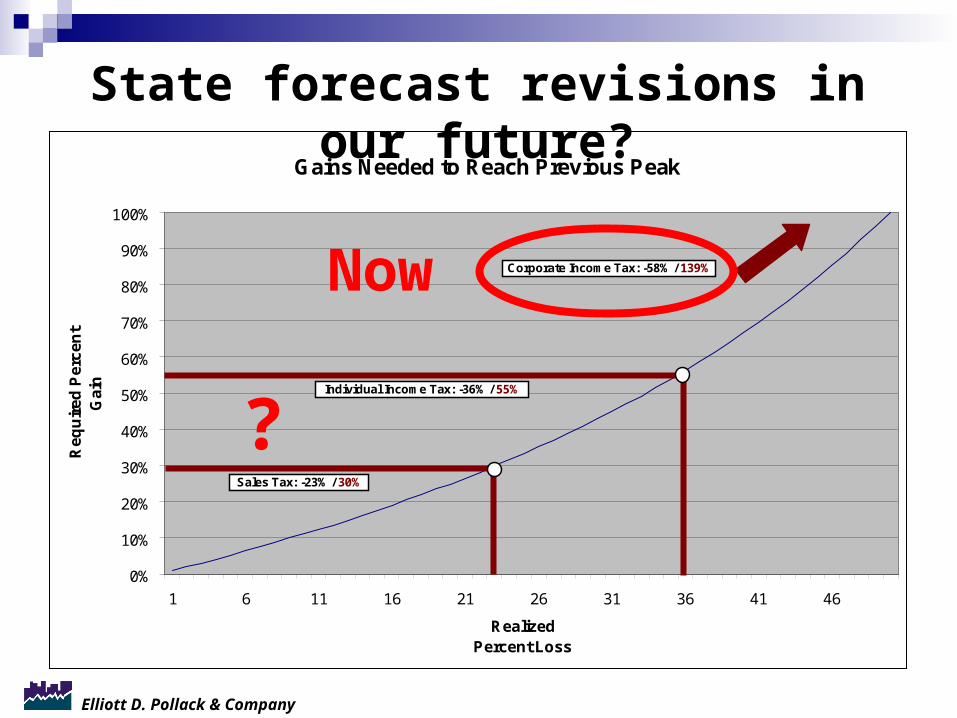
Gains Needed to Reach Previous Peak
0%
10%
20%
30%
40%
50%
60%
70%
80%
90%
100%
1 6 11 16 21 26 31 36 41 46
Realized Percent Loss
Re
qu
ire
d P
erc
ent
Ga
in
Sales Tax: -23% / 30%
Corporate Income Tax: -58% / 139%
Individual Income Tax: -36% / 55%
?
Now
State forecast revisions in our future?
Elliott D. Pollack & Company
But, local revenues related to single family and
commercial taxation will remain weak.

Elliott D. Pollack & Company
Hey Jim, your speeches suck. How about some
positive news?
Enjoy the rock!!!

Elliott D. Pollack & Company
Positives?

Elliott D. Pollack & Company
Phoenix-Mesa Employment Growth(Ranking among all metro areas greater than 1,000,000; 2011 August/August)
Source: Arizona State University, U.S. Bureau of Labor Statistics
YEAR RANK # of MSAs
1991 4 20 1992 5 20 1993 2 20 1994 1 20 1995 1 21 1996 1 23 1997 2 23 1998 1 24 1999 3 26 2000 8 26 2001 6 28 2002 5 28 2003 3 29 2004 4 29 2005 1 30 2006 1 31 2007 10 32 2008 29 32 2009 31 32 2010 31
32 2011 5 32
Elliott D. Pollack & Company
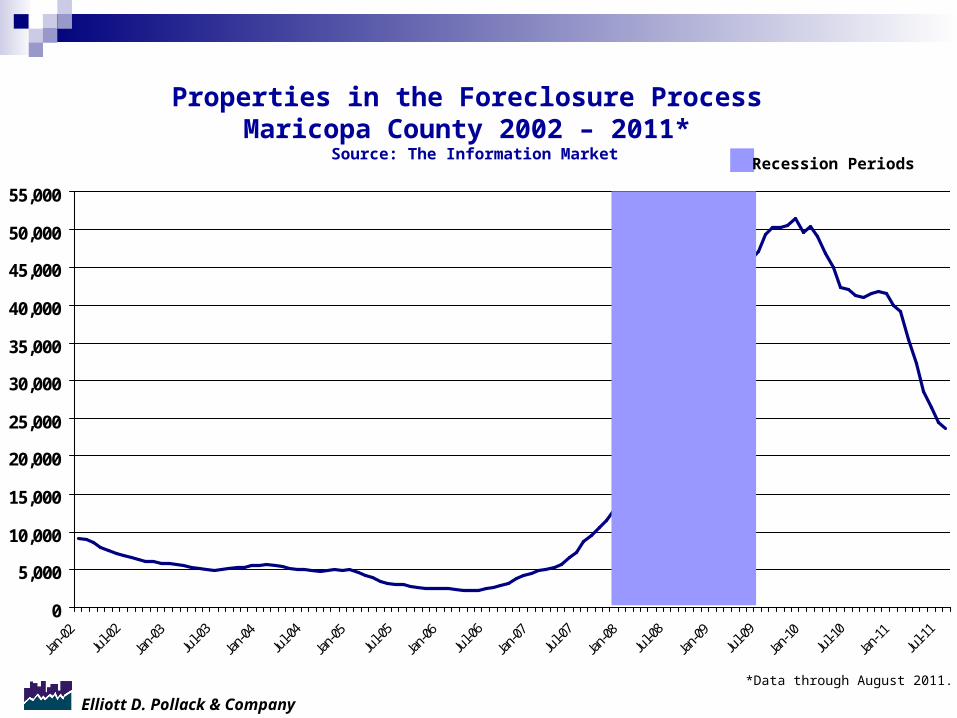
Properties in the Foreclosure Process Maricopa County 2002 – 2011*
Source: The Information Market
0
5,000
10,000
15,000
20,000
25,000
30,000
35,000
40,000
45,000
50,000
55,000
*Data through August 2011.
Recession Periods
Elliott D. Pollack & Company
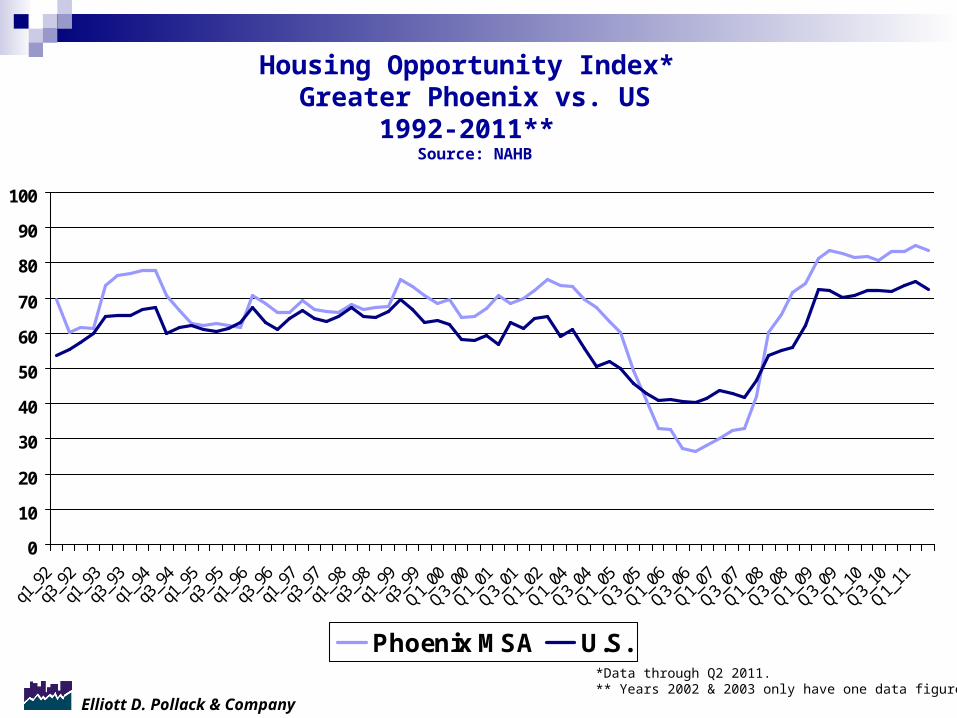
Housing Opportunity Index* Greater Phoenix vs. US
1992-2011** Source: NAHB
0
10
20
30
40
50
60
70
80
90
100
Phoenix MSA U.S.*Data through Q2 2011.** Years 2002 & 2003 only have one data figure
Elliott D. Pollack & Company
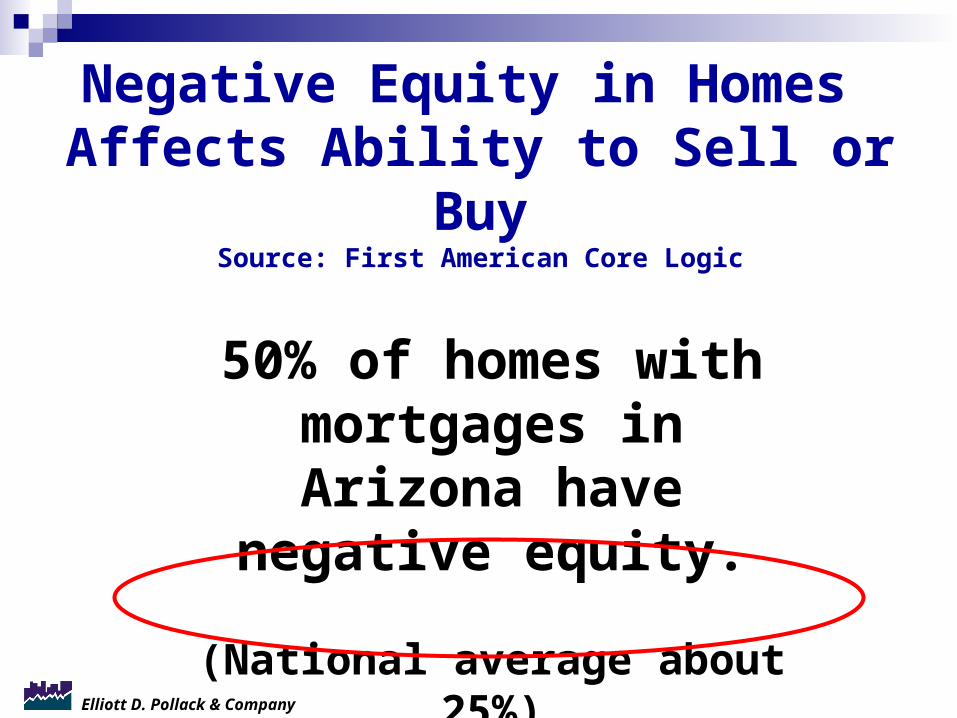
Negative Equity in Homes Affects Ability to Sell or Buy
Source: First American Core Logic
50% of homes with mortgages in Arizona have negative equity.
(National average about 25%)
Elliott D. Pollack & Company
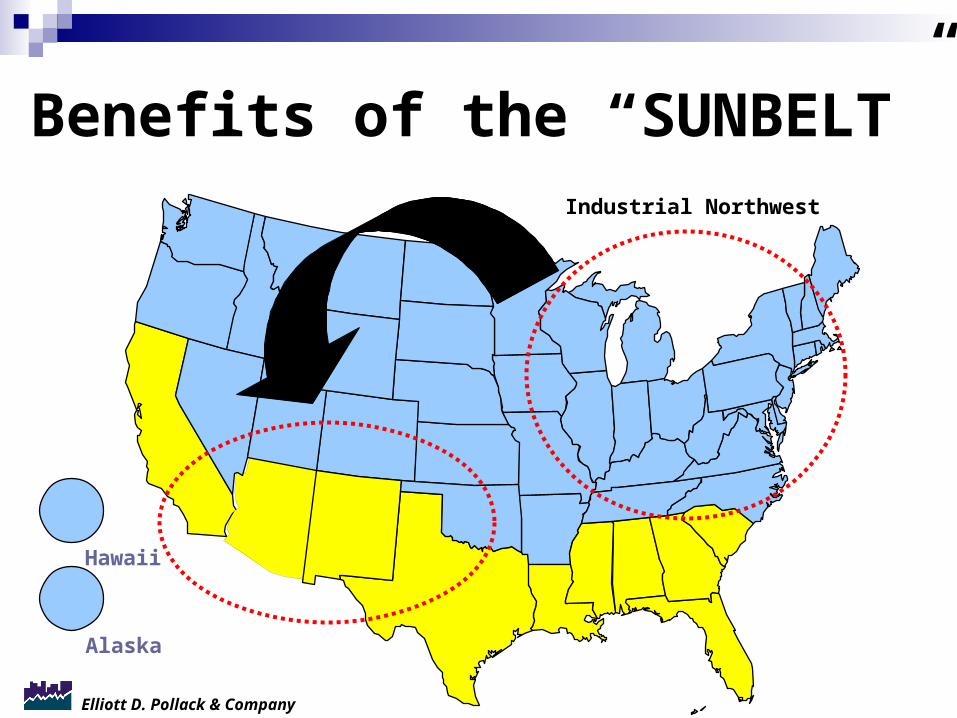
5
910
Benefits of the “SUNBELT”
Alaska
Hawaii
Industrial Northwest

Elliott D. Pollack & Company
What about the bad national press?
Yes, SB1070

Elliott D. Pollack & Company
• Governor impeached• Real estate depression• Defense cutbacks• AZ Scam• Martin Luther King Holiday Crisis• Keating• Keating 5• Every S&L taken over by RTC
Between 1987 and 1992

Elliott D. Pollack & Company
One survey shows that over 80% of current single family RENTERS would like to soon
own.
Some of these homes are thus permanently absorbed.
Elliott D. Pollack & Company
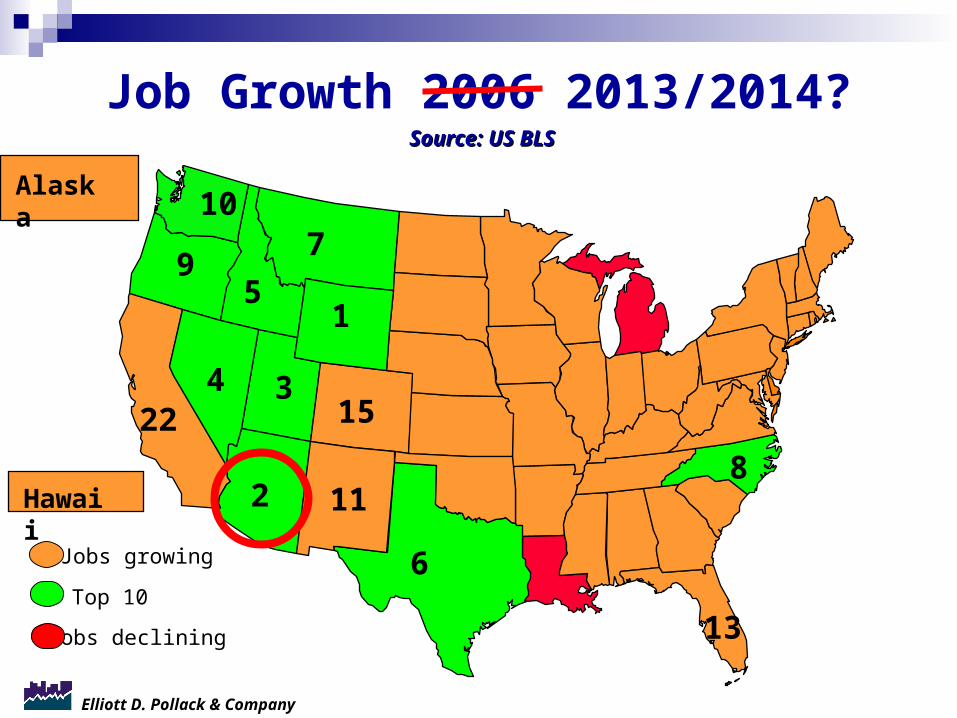
9
4
15
2
10
3
7
Job Growth 2006 2013/2014?
11
15
6
22
8
Source: US BLSSource: US BLS
13
Jobs growing
Jobs declining
Top 10
Hawaii
Alaska

Elliott D. Pollack & Company
Economic Competitiveness
Elliott D. Pollack & Company
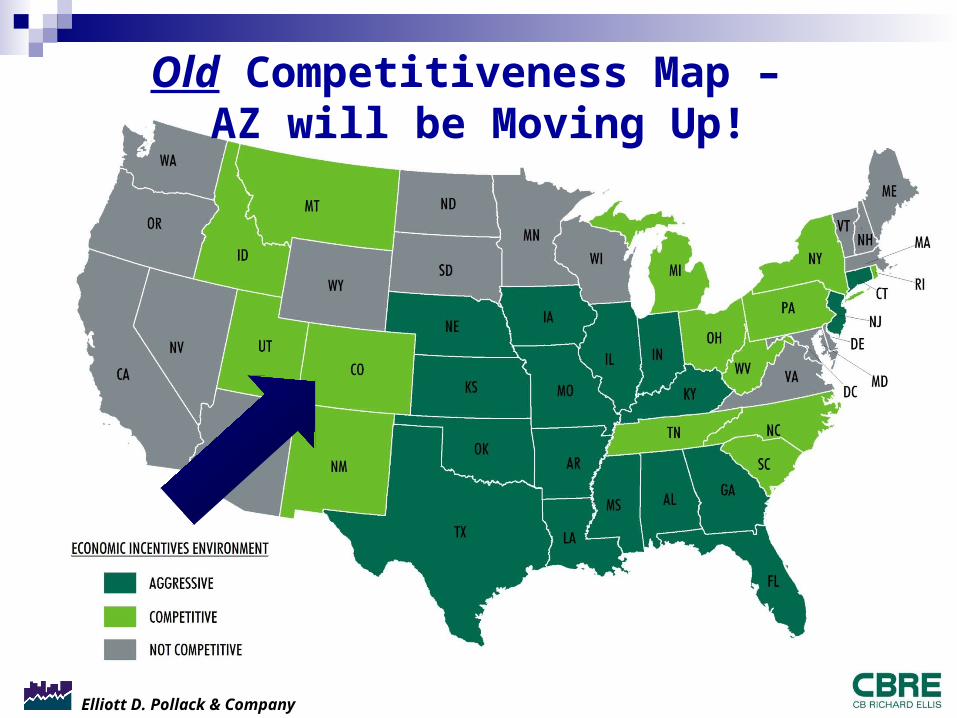
Old Competitiveness Map – AZ will be Moving Up!

Elliott D. Pollack & Company
Being addressed now…

Elliott D. Pollack & Company
1 Workforce skills
2 State and local tax scheme
3 Transportation infrastructure
4 Flexibility of incentives programs
5 Availability of incentives
6 Utility infrastructure
7 Land/building costs and supply
8 State economic development strategy
9 Permitting and regulatory structure
10 Higher education resources
Source: Site Selection Magazine
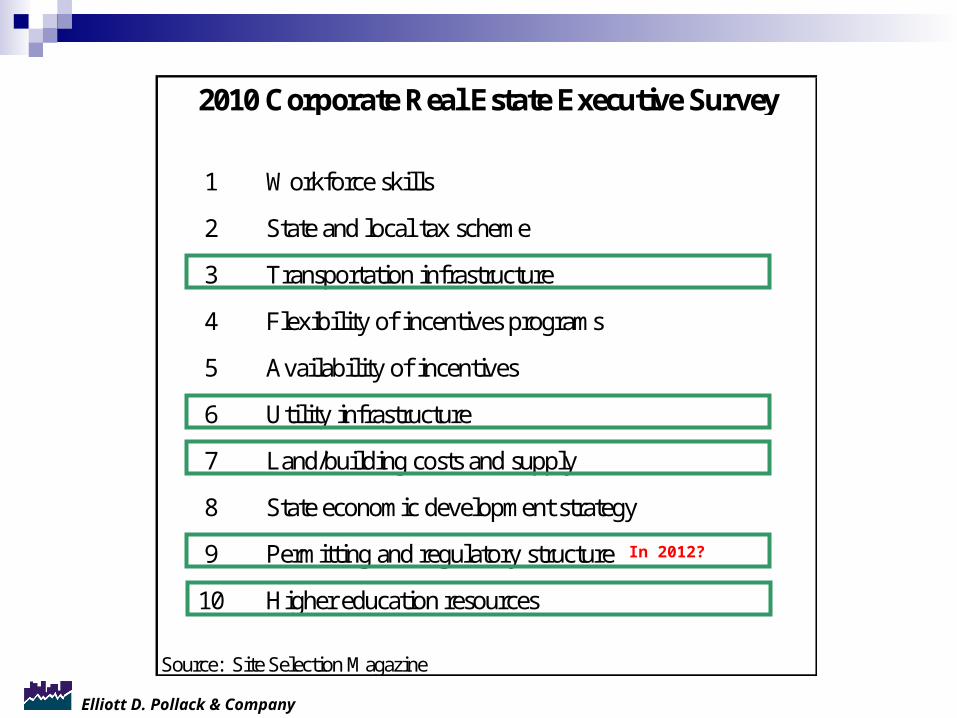
2010 Corporate Real Estate Executive Survey

Elliott D. Pollack & Company
What about the rest?
Elliott D. Pollack & Company
1 Workforce skills
2 State and local tax scheme
3 Transportation infrastructure
4 Flexibility of incentives programs
5 Availability of incentives
6 Utility infrastructure
7 Land/building costs and supply
8 State economic development strategy
9 Permitting and regulatory structure
10 Higher education resources
Source: Site Selection Magazine
2010 Corporate Real Estate Executive Survey
In 2012?
Elliott D. Pollack & Company
Policymakers finally started to understand how our economy functions.
We now have some economic development “tools.”
But, we need to see if the state and locals, the “tool man,” can use the tools properly and with a common vision, or “blueprint.”
Economic Development Summary:
Elliott D. Pollack & Company
We will continue to grow faster than the rest of the country over the long run.
If we do things right we might even grow in terms of quality.
Coordination among all of the E.D. entities will be critical.
Economic Development Summary:

Elliott D. Pollack & Company
Something still needs to be done about statewide tourism
promotion.

Elliott D. Pollack & Company
Elliott D. Pollack & Company
Arizona Summary
Elliott D. Pollack & Company
Performance Measures?
Falling far results in: - Strong rates of growth that seemingly don’t match the reported “levels” of activity. - Strong rankings that seemingly don’t match what we read in the paper. - Panic and opinions that the world is 100% different than before. Not necessarily true, we need to maintain some perspective.

Elliott D. Pollack & Company
Full Recovery: STILL 2015 / 2016?
Fully recovered in terms of: 1) Housing oversupply; 2) Commercial vacancy rates; 3) Retail sales activity; 4) Employment levels. 5) Tax revenues? Probably.

Elliott D. Pollack & Company
There is even a BOOM for Arizona out there…somewhere.

Elliott D. Pollack & Company
But, can we also grow in terms of quality?
Elliott D. Pollack & Company 83
ELLIOTT D. POLLACK & Company
7505 East Sixth Avenue, Suite 100 Scottsdale, Arizona 85251
480-423-9200 P / 480-423-5942 F / www.arizonaeconomy.com / [email protected]
• Economic and Fiscal Impact Analysis/Modeling
• Real Estate Market and Feasibility Studies
• Litigation Support
• Revenue Forecasting
• Keynote Speaking
• Public Finance and Policy Development
• Land Use Economics
• Economic Development