elliott bay/duwamish restoration...
TRANSCRIPT

1
Source Control Summary for theDuwamish Diagonal Cleanup
Project Addendum
Elliott Bay/Duwamish Restoration Program
Prepared for theElliott Bay/Duwamish Restoration Program Panel
by theKing County Department of Natural Resources and Parks
King County Department ofNatural Resources and Parks
201 S. Jackson St. Ste. 500Seattle, WA 98104-3855
(206) 684-1280(FAX) (206) 684-1741
April 2002

2
This information is available on request in accessible formats forpeople with disabilities by calling (206) 684-1280 (voice) orTTY 711.

SOURCE CONTROL SUMMARY DOCUMENTFOR DUWAMISH/DIAGONAL SEDIMENT CLEANUP PROJECT
PREPARED APRIL 2002 BY KING COUNTYREVISIONS MAY 20, 2002
TABLE OF CONTENTS
1. INTRODUCTION
2. OVERVIEW OF SOURCE CONTROL ACTIVITIES AND CONCLUSIONS
3. DISCHARGE PIPES AND ASSOCIATED SOURCE CONTROL ACTIONS
3.1. Diagonal CSO/SD Discharge3.2. Duwamish CSO/Emergency Bypass3.3. Historic Diagonal Avenue Sewage Treatment Plant3.4. Diagonal Avenue South Storm Drain
4. INDUSTRY AND BUSINESS INSPECTIONS FOR SOURCE CONTROL
4.1. City Storm Water Inspection Program4.2. KC Industrial Waste Program4.3. Regional Hazardous Waste Program4.4. EPA Enforcement Action4.5. CERCLA and MTCA Programs
5. INVESTIGATION OF OIL SHEEN FROM DIAGONAL CSO/SD
5.1. Investigation5.2. Tie to 4-Methyl Phenol In River Sediments
6. DIAGONAL CSO/SD PIPE CLEANING PLAN
6.1. Pipe Cleaning6.2. Chemical Samples Of Diagonal Pipe Sediments
7. SAMPLES OF PIPE SEDIMENT AND PIPE WATER
7.1. Pipe Sediment Data7.2. Pipe Effluent Samples7.3. Comparison To SMS Or Water Quality Criteria
8. PHTHALATE RECONTAMINATION POTENTIAL
8.1. Recontamination Modeling
8.2. Phthalate Toxicity8.3. Factors Supporting Remediation
9. INPUT OF CHEMICALS FROM ADJACENT PROPERTY
9.1. Surface Runoff9.2. Ground Water9.3. Bank Erosion
10. DREDGING ACTIVITIES AS PCB RECONTAMINATION SOURCE
10.1. PCB Recontamination10.2. Future Maintenance Dredging Projects
11. SLIP # 1 PCB SPILL AND CLEANUP ACTIONS
12. INSTITUTIONAL CONTROLS NEEDED TO PROTECT CAP
13. MONITORING OF CAPPING PROJECT
13.1. Short-Term Construction Monitoring13.2. Long-Term Monitoring

1
SOURCE CONTROL SUMMARY DOCUMENTFOR DUWAMISH/DIAGONAL SEDIMENT CLEANUP PROJECT
1. INTRODUCTION
After the EBDRP Panel considered several alternatives, including a much broader area,the draft Duwamish/Diagonal Cleanup Study Report (December 2001) proposed acleanup area of about 5-acres in size (actual size is 4.8 acres) immediately in front of theDuwamish CSO and Diagonal CSO/SD outfalls. The site was limited by available funds.However, during the public review process in February 2002, comments were receivedthat recommended the site be expanded to remove an upstream area of high sedimentchemistry called a chemical hot spot. The primary concern was that the 5-acre cleanuparea would be recontaminated with PCBs exceeding the SQS when the chemical hot spotwas dredged in the future. The Elliott Bay Duwamish Restoration Program (EBDRP)Panel had previously discussed the potential recontamination problem created by theupstream hot, but it appeared that the cost to address the upstream hot spot was beyondthe available sediment remediation budget. In response to the concerns expressed aboutPCB recontamination and the lower cost estimates for the original project, the EBDRPPanel requested that an evaluation be conducted to determine if the upstream hot spotcould be cleaned up using the remaining EBDRP sediment remediation funds. Anexpanded project was designed that removes the upstream hot spot and the cost of thisexpanded project was within the remaining EBDRP sediment remediation funds. Basedon this new information, the EBDRP Panel is considering this expandedDuwamish/Diagonal cleanup project.
The Duwamish/Diagonal project schedule is very tight in an effort to begin constructionof the cleanup action by November 2003 when the dredging window opens. Numerouspermits are required before the project goes to construction and project staff cannotofficially start the permitting process before the project is approved by Ecology. TheDuwamish/Diagonal cleanup project was started in 1994 under the State SedimentManagement Standards (SMS) process. Under this process, Ecology prepares a CleanupAction Decision (CAD) document that issues Ecology's official determination of projectapproval.
Project staff met with Ecology and EPA staff to discussed the expanded project proposaland determine what information the regulatory agencies would need in order to considerthe expanded project, and also allow the preparation of the CAD to proceed according toschedule. At the meeting it was determined that the regulatory agencies needed moreinformation on the following three issues: 1) specific details about the expanded project;2) documentation that source control had been addressed for the site; and 3) that thereview comments for the Cleanup Study Report had been addressed appropriately. It wasagreed that King County would produce three separate (stand-alone) products to provideinformation as soon as possible. These three products are the following:

2
1. The first document, titled Expanded Area For the Duwamish/Diagonal CleanupProject, will provide details about the expanded project including reasons forexpanding the project, the new project boundaries, justification for setting theboundaries, revised cost estimates, and methods for implementing the expandedproject. The original 4.8-acre site was designated as cleanup Area A. To remove theupstream chemical hot spot, the project was expanded 2.1 acres and this part of theproject was designated cleanup Area B. The dredge plan for the project is shown inFigure EX-1. Figure 2-4—Shoreline Features and Bathymetry shows the location ofdischarge pipes. Figure 5-9—Composite SQS/CSL Exceedance Areas shows samplestations with boundaries for Area A and Area B.
2. The second document, titled Source Control Summary, will provide a completesummary of the source control activities related to discharge pipes and other potentialsources near the cleanup area. The following write up is the stand-alone documentthat provides the Source Control Summary
3. The third document, titled Responses to Reviewer Comments, will address all thecomments received during the public review of the Cleanup Study Report in February2002.
At some point in the future, all three of these documents will be attached to the finalizedCleanup Study Report as an expanded responsiveness summary. To expedited review ofthe expanded project, it was agreed that all three of these documents would be providedto Ecology and EPA prior to release of the finalized Cleanup Study Report. The scheduleis for King County to provide these documents to Ecology and EPA the first part of April2002, so work can proceed on finishing the CAD for public review in early March 2002.
2. OVERVIEW OF SOURCE CONTROL ACTIVITIES AND CONCLUSIONS
The general conclusion of the source control summary document was that many sourcecontrol activities have occurred to reduce chemical inputs, which has eliminated concernabout recontamination for most chemicals. There are a several discharge pipes that borderthe cleanup area, but only one is currently considered to be a significant source forrecontamination. The Diagonal CSO/SD discharges about 1,230 MGY (million gallonsper year) of separated storm water and less than 65 MGY of CSO (combined seweroverflow is mixed storm water and sewer water). The only two chemicals that areidentified as a potential concern for recontamination are bis(2-ethylhexyl)phthalate andbutyl benzyl phthalate, which are present in both separated storm water and CSOdischarges. A brief overview of the main source control activities and conclusions ispresented in this section and greater detail is provided in subsequent sections.
The Diagonal CSO/SD is one of two discharge pipes that are located along the inshoreboarder of cleanup Area A and these discharges are located near the center of the border.The Diagonal CSO/SD discharge consists of a large concrete structure located in theintertidal area and attached to a buried 12-foot diameter pipe. A large amount of CSOcontrol has occurred at Diagonal CSO/SD with the City of Seattle reducing CSOdischarges to less than one event per year. King County has achieved about 80 percent

3
reduction in CSO volume at Diagonal CSO/SD with about 65 MGY remaining. Thelargest volume of discharge occurs from separated storm water from the Diagonal andHanford basins and is estimated at 1,230 MGY. Sediment has settled in a long flatsection of the pipe that is regularly filled with river water during high tide. The City ofSeattle will conduct a pipe-cleaning project to remove the sediment and any associatedcontaminants before the Duwamish/Diagonal cleanup project is implemented. This willremove any historical contamination that may be left in the pipe and keep it from beingflushed out onto the clean site. It will also allow new sediment accumulations to beassessed for ongoing source control activities.
The second outfall that boarders cleanup Area A is called the Duwamish CSO and this isa submerged outfall located about 100 feet upstream from the Diagonal CSO/SD. TheDuwamish CSO is the emergency overflow for the Siphon and for the Duwamish Pumpstation, but this CSO is not expected to overflow unless there is an emergency situationthat shuts down the pump station (i.e. power loss due to an earthquake). The DuwamishCSO has not overflowed since 1989 and is not considered a significant recontaminationsource.
There is also another outfall downstream of cleanup Area A. This SD outfall is offNevada Street and drains a portion of the Port of Seattle T106 property that is used forwarehousing and for a shipping container repair facility. It is several hundred yardsdownstream of Area A. There is an additional small, abandoned SD outfall on thisproperty.
Cleanup Area B does not extend to the shoreline, but two discharge pipes are shown to belocated inshore of the inshore cleanup boundary. The largest pipe is the historic outfallpipe from the old Diagonal Ave. treatment plant that operated from 1940 to 1969. Thisdischarge pipe is exposed at low tide and is broken about 20 feet back from the outfallstructure that appears to have settled. There has been no treatment plant discharge outthis outfall for over 30 years, but a chemical hot spot is well defined in the sedimentlocated offshore. In 1977, a dredging project was conducted by Chiyoda Corporation tocreate a mooring area and this dredging likely removed contaminated river sedimentlocated down stream of the outfall. This project also dredged away the old shoreline,creating a new shoreline about 100 feet inshore of the old shoreline. Cleanup Area Bextends upstream and down stream of the old treatment plant outfall and removes theentire chemical hot spot.
At the upstream end of cleanup Area B there is a small (12-inch) storm drainpipe locatedin the upper intertidal area. This small pipe is Diagonal Ave. South storm drain with adrainage basin of about 12 acres. Three sediment samples were collected offshore fromthis small SD pipe; however, the only chemicals that showed increased values near thestorm drain were the two phthalates (butyl benzyl phthalate and bis (2-ethylhexyl)phthalate) that are present throughout Areas A and B. The lack of any elevatedchemicals, besides phthalates, in these three sediment samples collected in front of thesmall SD outfall suggests there are no problem discharges to this small pipe that could be

4
a potential recontamination source to Area B. Also, the City and the regional hazardouswaste program carry out periodic business inspections in this basin.
While the two outfall pipes that boarder cleanup Area B (historic treatment plant outfalland small Diagonal Ave. S. SD) are not considered to be a potential source ofrecontamination to the cleanup area, there exists other potential types of inputs from theneighboring property. Through the years, there were numerous activities at the oldDiagonal Avenue sewage treatment plant property that could have introduced chemicalsinto the sediments. These activities include the use of sewage sludge drying ponds(1930-1969), dredge settling ponds for PCBs (1976) and filling with contaminatedsediment dredged from near the old treatment plant outfall (1977). Consequently,regulatory agencies asked whether surface drainage, groundwater discharge, or bankerosion from the old treatment property could pose a potential source of recontaminationto the Duwamish/Diagonal cleanup project.
After reviewing available information, project staff concluded that it appears unlikely thatsurface water, ground water, or bank erosion from the old treatment plant property wouldbe a significant source recontamination to the Duwamish/Diagonal cleanup project. Mostof the shoreline of the old treatment plant property is covered with rip rap rock tostabilize the bank. The one area that has exposed intertidal sediment was sampled andchemical analysis results showed low chemical concentrations. The row of sedimentsamples collected closest to shore near the old treatment plant property were low in mostchemicals including PCBs. A large part of the old treatment plant property has beenpaved over (former Lafarge Cement site and T108 container storage), which will limitsurface water contact with underlying sediment and prevent input from surface water.The Port of Seattle sampled groundwater at 14 wells drilled on the old treatment plantproperty in 1991/1992 (also called the Chiyoda/Chevron property) and the data do notindicate any problem chemicals in ground water.
There are three different programs that are applied to the entire Seattle area and reducechemical inputs to CSO and SD discharges:1. The City of Seattle runs a storm water protection program that involves business
inspections and catch basin maintenance.2. King County runs an industrial pretreatment program that is designed to limit
chemical discharges to the sewer system in order to protect the sewage treatmentplants from chemical upsets and to limit the amount of chemicals in biosolids.
3. A multi-agency hazardous waste program also inspects businesses to reduce the useof and promote the proper disposal of chemicals, which also significantly helpsreduce chemical input into the drainage system.
In 1996 and 1997, the City conducted a focused business inspection in the Diagonalstorm water drainage basin (Diagonal plus Hanford) as a source control action for thesediment cleanup project. Starting in late 2000 and continuing through 2001, the City ofSeattle conducted additional business inspections in the storm water drainage basin.More inspections in this area are planned in the future through all three of the programslisted above.
5
All of the CSO control and BMP activities performed to date as well as ongoing activitiesreduce the chemical loading that will discharge out the Diagonal CSO/SD. Thisreduction can be seen in the core data in Section 5 of the Cleanup Study Report, wherethe older, deeper sediments have higher concentrations. The reduction of concentrationstowards the surface demonstrates the reduction in loading being discharged. Thisreduction of loading is a direct measure of the success of source control activities to date.
Past experience monitoring sediments off CSO and SD discharges indicate that the onlychemicals that produce sediment concentration above the SMS standards are thephthalates. The phthalates have wide spread usage in products and do not appear to becoming from localized point sources that could be controlled by industrial source controlactions. Resource agencies seem to be in agreement that it is difficult to removephthalates from large storm water discharges and that it is important to proceed withcleanup projects that remove high priority chemicals like PCBs even if there is potentialfor some level of phthalate recontamination. However, if ongoing source inspectionsidentify significant sources, these will be investigated.
As part of the lower Duwamish River Superfund activities, Ecology has taken the lead todevelop a comprehensive source control program that will protect sediments in theDuwamish River, including all sediment remediation sites. This comprehensive sourcecontrol program will be developed during the next year and will apply to the DiagonalCSO/SD. Ongoing source control activities in the contributing basins will be consistentwith and guided by this plan.
3. DISCHARGE PIPES AND ASSOCIATED SOURCE CONTROL ACTIONS
Prior to formation of the Municipality of Metropolitan Seattle (METO) in 1958 the Cityand other surrounding communities had small treatment plants that discharged to LakeWashington, Duwamish River, and Puget Sound. Pollution of Lake Washington resultedin the formation of METRO and the construction two new treatment plants at West Point(1964) and Renton (1962) to improve local water quality. To carry sewage flow to theWest Point treatment plant, a large pipe called the Elliott Bay Interceptor (EBI) pipe wasbuilt along the east side of the Duwamish River and Elliott Bay. Three pump stations(PS) were required to move the flow in the EBI to the West Point treatment plant. TheEast Marginal PS is located furthest upriver, while the Duwamish PS is located near theDuwamish/Diagonal project. The Interbay PS was positioned at the downstream end ofthe EBI and is located on the north side of Elliott Bay. Sewage flow from West Seattlewas required to travel east under the Duwamish River in a Siphon to reach the DuwamishPS where the sewage is then pumped north in the EBI. Two parallel siphon pipes (21-inch and 42-inch) are buried in the bottom of the Duwamish River and they pass undercleanup Area A.
The collection system designed for the West Point treatment plant contained relief pointscalled combined sewer overflows (CSOs) to control the amount of combined sewage and
6
storm water that could enter the system and especially the EBI. This design was neededbecause a large part of the service area had a combined sewer system that carried bothsewage and storm water in the same pipes, which resulted in very large flow volumesduring rainstorms. Because it would be very difficult to collect and treat all the stormwater with the sewage, the West Point treatment plant was built large enough to handleall of the sewage flow and up to twice this volume of storm water. During large stormevents, the combined volume of sewage and storm water exceeded the capacity of thesystem and was addressed by having a series of relief points along the pipe. The CSOrelief points only overflowed periodically during high flow periods. Regulator stationswere built where the local sewage collection systems entered the EBI. During base flowall of the sewage flow from the local collection system was directed into the interceptorline, but when the volume increased greatly due to storm water, the excess flow from thelocal system was diverted to the receiving water as a CSO discharge.
Eventually it was recognized that the CSO discharges were pollutant sources that neededto be controlled. METRO instituted a formal CSO control program in 1979 under theimpetus of the Federal Water Pollution Control Act Amendments of 1972. In 1987,Chapter 173-245 Washington Administrative Code (WAC) went into effect under theadministration of Ecology, requiring reductions in CSO volumes to an average of oneuntreated discharge per year at each outfall. Chapter 173-245 WAC also requires CSOplans specifying the means of complying with the regulations.
METRO (now King County Department of Natural Resources and Parks -KCDNRP)developed an interim goal of achieving an overall reduction of 75 percent in CSO volumethroughout the KCDNRP jurisdiction by the end of the year 2005. The first CSO controlplan was prepare by METRO in 1988 and subsequently King County prepared 5-yearupdate plans in 1995 and 2000. The current priority set for CSO control is to first addressthe outfalls that discharge in areas where there is the highest potential for human contactdue to swimming or beach use. Because there is greater beach usage by humans nearPuget Sound CSO sites, these areas were given higher priority to implement than theCSO sites in the Duwamish River. Consequently, the present schedule for completingCSO control projects in the Duwamish River are generally specified for years in the2020's. This schedule applies to the remaining 65 MGY CSO coming out the DiagonalCSO/SD from King County.
The City also has CSO locations in the local collection system and these pipes dischargeto the Duwamish River and Elliott Bay. The City has implemented a program to controlCSO discharges and has almost achieved the required level of control in the Duwamishwatershed (no more then one overflow event per year). It is important to point out thatKing County CSO volumes started out much larger than the City's CSO volumes,because the County assumed ownership of the large regulator stations that direct flowsfrom the local collections systems into the large interceptor pipes like the EBI.
There are five discharge pipes that are relevant to the expanded sediment cleanup projectand each will be discussed individually. The first two pipes boarder cleanup Area A andthe second two pipes are inshore of cleanup Area B. The final pipe is downstream from

7
Area A. Only the Diagonal CSO/SD is considered to be a significant source to thecleanup area.
3.1. Diagonal CSO/SD Discharge
In 1966/1967 the City installed the large Diagonal storm drain line along the northboundary of the Diagonal Avenue treatment plant, which was in operation until 1969.The 12-foot diameter buried pipe ended at a large rectangular concrete outfall structure.The bottom of the outfall was set at an elevation of minus 3 feet (MLLW). There is notide gate in the outfall so the long flat pipe regularly fills with Duwamish River water athigh tide and at low tide empties accordingly. The Diagonal CSO/SD construction waspart of a joint contract that METRO issued to build the Siphon across the DuwamishRiver and connect the Siphon to the Duwamish PS that was being built inshore to theeast.
The Diagonal CSO/SD outfall receives primarily storm water and minor CSO flows fromboth the Diagonal and Hanford drainage basins. The volume of separated storm waterdischarged annually was estimated to be about 1,230 MGY when the drainage basin forDiagonal was assigned a value of 1,012 acres and the drainage basin for Hanford wasassigned a value of 1,573 acres in the King County overflow model. The DiagonalCSO/SD is the City's largest storm water outfall handling runoff from a combineddrainage area of about 2,585 acres (1,012 acres Diagonal plus 1,573 acres Hanford—seememo to Pat Romberg from Zhong Ji and drainage basin map) of residential,commercial, and about seven miles of I-5 freeway runoff. The 2001 draft Cleanup StudyReport listed the combined drainage basin as 1,583 acres (Executive Summary, page ES-1 and section 3.2.1, on page 3-2); however, the combined drainage basin is actually 2,585acres and this corrected value will be included when the Cleanup Study Report isfinalized.
In addition to the separated storm water discharge, there is still a limited amount of CSOflow that is tributary to the Diagonal CSO/SD. There are a few local CSO points that candischarge into the storm water system. The City has completed over 90 percent CSOcontrol in the Diagonal CSO/SD drainage basin and KCDNRP has achieved about 80percent CSO control in the basin. The City collection system has 6 CSO locations thatdischarge into the Diagonal CSO/SD system from a drainage basin of about 620 acres.Five of the six City CSO locations were controlled by separation and storage to less thanone overflow event per year. The one remaining CSO has a drainage basin of about 40acres with a remaining CSO volume of about 0.5 MGY, but his site is scheduled for aCSO reduction project to be completed before 2004.
The KCDNRP collection system has 3 CSO locations that discharge into the DiagonalCSO/SD system and historically the CSO volume was estimated to be about 300 MGY.The CSO volumes from the KCDNRP discharges were reduced by about 80 percent by apast project, which leaves about 65 MGY remaining. The one CSO that is only partiallycontrolled is the Hanford # 1 CSO, which is thought to have historically discharged asmuch as 300 MGY out the Diagonal CSO/SD. The flow is estimated based on old

8
reports that indicate the combined CSO volume for Hanford # 1 and # 2 together was ashigh as 600 MGY. It was also suggested that the flows were about equal, so the value of300 MGY was used as the historic volume of Hanford # 1. The Hanford # 2 CSOdischarges at a different location called the Hanford CSO, which is located further downriver along the east side of the East Waterway.
The flow from Hanford # 1 was originally thought to result from only one combinedsewer connection that was controlled in 1992. Later, 3 upstream connections werediscovered: Bayview North; Bayview South; and Hanford at Rainer. There are nowreported as Hanford # 1 and have control project scheduled to be completed in 2026.The method in which Hanford # 1 CSO overflows made it difficult for the model toaccurately predict the overflow volume at that site. The model predicted a volume of 32MGY, but due to the uncertainty in this prediction, the volume was doubled to 65 MGY,which is the volume reported in the draft 2001 Cleanup Study Report (Swarner, personalcommunication 1999). Further work is needed to accurately model the flow from theHanford # 1 CSO.
In addition to the individual CSO control projects under taken by KCDNRP to reduceCSO flow, there was also a large system wide project implemented to reduce CSOoverflows at all points in the collection system. This system was originally called theCATAD (Computer Augmented Treatment and Discharge) that uses pipe storage toreduce the volume of CSO flow that is discharged. A control system allows regulatorgates to be kept closed a longer time, which stores CSO flow in the pipes until they arefilled. This storage delays the time when the CSO starts and ultimately reduces thevolume of CSO discharged. This system is being improved with more computertechnology, which optimized the storage capacity over the entire system by using rainsensors to predict where in the KCDNRP system the CSO flows are likely to occur.
3.2. Duwamish CSO/Emergency Bypass
The Duwamish CSO outfall is a buried pipe located on the east side of the river. Thisoutfall is the emergency relief point for the Siphon and the Duwamish PS. TheDuwamish CSO does not overflow regularly like most true CSO discharge points. Thelast time this CSO overflowed was more then 11 years ago in 1989.
When the EBI was built in the mid 1960's, a series of emergency overflow pipes had tobe installed at appropriate locations to protect the conveyance system from damage.Pipes need an emergency overflow because if the large volume of sewage flowing in thepipes were stopped immediately, the momentum of the flow would damage the pipestructures. The Siphon pipes that cross the river at Duwamish/Diagonal have anemergency overflow pipe at each end where the Siphon reaches the riverbank. At theeast bank, the emergency overflow pipe is called the Duwamish CSO.
Pump stations need an emergency overflow to prevent flooding and damage to pumps. Ifthere were an emergency shut down of the Duwamish PS, flow in the EBI must bediverted to protect the pump station facility and the interceptor line. In an emergency by-
9
pass situation, the flow upstream of the Duwamish PS would be diverted away from thepump station facility and out the Duwamish CSO pipe. The Duwamish PS is equippedwith 3 very large sewage pumps plus an auxiliary power supply (engine generator unit)so there should be no need to by-pass out the Duwamish CSO except in an emergencybeyond present back-up systems. The Duwamish Pump Station has a peak flow of 63mgd and a maximum pumping capacity of 100 mgd (three pumping units). Also, undernormal dry weather conditions (23 mgd), the station has two hours of storage time fromshutdown to overflow. In addition, the Duwamish Pump Station is equipped with sensorsfor key operational conditions. Alarm signals are connected to telemetry sending alarmsignals to West Division Main Control for continuous monitoring. Therefore, duringnormal conditions, it is unlikely that the pump station wet well will exceed a maximumset point because the station has been designed with enough reliability that overflow intothe Duwamish River will not occur.
If an emergency by-pass were required out the Duwamish CSO, the chemicalconcentrations in the sewage or mixed sewage/storm water would hopefully be similar tothe concentrations that are found regularly in either sewage or CSO samples that areroutinely taken from the sewer collection system and treatment plants. Regular samplingof the influent of the Duwamish PS has been performed by KCDNRP's Industrial WasteSection, but not during storm periods. King County's Industrial Waste program is one oftwo local programs that are specifically designed to reduce the chemical levels in both theCSO and storm water discharges. These programs are discussed later in the next sectionof this document. These programs can also reduce the possibility that an earthquake willcause uncontrolled spills or discharge of pollutants to the receiving water.
The drainage basins that would contribute to an emergency by-pass out the DuwamishCSO have been identified and local programs that promote Best Management Practices(BMPs) for chemicals already serve these drainage basins. An emergency by-pass fromthe Siphon would involve combined sewage and storm water from the Delridge TrunkSewer and the Chelan Avenue Regulator Station (both in West Seattle) that has acombined drainage basin of 1,169 acres. An emergency by-pass of the EBI (Elliott BayInterceptor) flow to protect the Duwamish PS would involve all the flow coming downthe EBI toward the Duwamish PS. The drainage basin for this by-pass would be alldrainage basins upstream of the Duwamish PS. This EBI flow originates from two areas;1) the East Marginal PS located upstream (drainage basin of 907 acres), plus 2) the flowfrom the local drainage located between the East Marginal PS and the Duwamish PS(local basin of 128 acres). Information regarding industrial and business inspectionprograms in these drainage basins is presented in a separate section of the Source ControlSummary document (see Section 4).
3.3. Historic Diagonal Avenue Sewage Treatment Plant
The former Diagonal Avenue treatment plant was located near the river about 150 m tothe south (upstream) of the Diagonal SD/CSO outfall. The treatment plant was built bythe City and began operation in 1940. Plant capacity was 7 to 8 million gallons per day(MGD) of primary treatment with only a two-hour wastewater retention time (EBDRP

10
1994b). METRO was formed in 1958 to improve sewage treatment in the Seattle area,and took over operation of the plant in 1962. This plant was operational until 1969 whenthe final stage of the Elliott Bay Interceptor pipeline was completed and flows werediverted to the West Point treatment plant. The Diagonal Avenue treatment plant treatedwastewater from Seattle's primary industrial core and was considered to be one of themost overloaded plants in the Seattle system (EBDRP 1 994b). Flow to the plant waslimited by an upstream regulator that provided a bypass directly to the Duwamish Riversouth of Slip 1 (Brown and Caldwell 1958). Due to the combined storm and sewersystem, the plant frequently diverted untreated sewage into the Duwamish River duringrain events (EBDRP 1994b). Treatment plant structures were removed in the mid-1970s,except for two below-ground clarifiers that were filled (AGI 1992). The sludge in thedrying beds was covered with fill (AGI 1992) probably excavated from the near shorearea when a berthing area was dredged in 1977.
A large portion of the contaminated sediment that may have been associated with the oldtreatment plant outfall appears to have been removed in 1977 when Chiyoda Corporationdredged a nearshore berthing area on the north side (downstream) of the old outfall.Chiyoda Corporation acquired the former treatment plant site in the mid-1970s. Little isknown about Chiyoda Corporation's operations, except that it was a chemical companythat wanted to develop a shore-based loading dock. They dredged the inshore area, butwere unsuccessful at obtaining permits for the shore-based dock. Later, a mooring dockof piling clusters was built offshore.
In 1976, PCB-contaminated dredge spoils from a 1974 transformer fluid spill in Slip 1(containing Aroclor 1242) were disposed on the Chiyoda property by the USACE. Twolagoons were excavated along the northern edge of the property in the former treatmentplant for sludge beds to treat approximately 10 million gallons of PCB-contaminatedsediment dredged from near Slip 1 (see aerial photo C-3, Appendix C of draft 2001Cleanup Study Report). PCB-contaminated sediment was deposited primarily in the firstreceiving lagoon located closet to the river. Water pumped from the disposal lagoons wastreated by particulate, sand, and charcoal filters prior to discharge to the DuwamishWaterway (AGI 1992). The PCB disposal pits were eventually back-filled with materialfrom the excavation and additional sediment that Chiyoda dredged from the shoreline toimprove berthing (AGI 1992).
The Port of Seattle acquired the Chiyoda property in 1980. The Port later sold part of theproperty to Chevron, retaining the portion along the river. Soil contaminated withpetroleum hydrocarbons was stockpiled in the vicinity of the former disposal lagoons(AGI 1992). This soil was treated to meet the State of Washington TPH cleanup level of200 mg/kg. The Port leased the southern part of the site to Lafarge Cement Company,which occupied the site from 1989-1998 and loaded cement barges at the mooring piledock. This site is currently the Port of Seattle's Terminal 108 expansion area and is usedfor container storage.
3.4. Diagonal Avenue South Storm Drain

11
The Diagonal Avenue South SD is a small (12-inch) storm drainpipe located at theupstream end of cleanup Area B, but this pipe is located inshore in the upper intertidalarea. This SD serves a relatively small drainage basin of about 12-acres that runs a shortdistance back from the river along Diagonal Avenue and is mostly paved. No effort wasmade to determine the volume of storm water that discharges out the Diagonal Ave. SD,because the volume would be small compared to the 1,200 MGY of storm waterdischarged out the Diagonal CSO/SD (located about 1,000 feet down stream). The 12-acre drainage basin for Diagonal Ave. South SD is about one-half of one percent (0.5percent) of the 2,585-acre Diagonal CSO/SD drainage basin.
The only chemistry data reported for Diagonal Ave. South SD was a sediment samplecollected from the pipe in 1985 for the Elliott Bay Action Program (Tetra Tech 1988).The data for the 1985 sediment sample was reported in the 1994 Duwamish/DiagonalCleanup Study Plan and compared to state SMS values after normalizing appropriatechemicals for total organic carbon. This same data was reported in Appendix B of the2001 draft Cleanup Study Report as Table 3-1. Three of the detected chemicals exceededthe SQS (zinc, indeno(1,2,3-c,d)pyrene, and di-n-octyl phthalate) and one exceeded theCSL value (chromium). This table also shows that 7 of the undetected chemicals wereabove the SMS values. Four of these seven chemicals exceeded the CSL values (1, 2-dichlorobenzene, 1,4-dichlorobenzene, hexachlorobenzene, and benzyl alxohol) and threeexceeded the SQS values (1,2, 4-trichlorobenzene, butyl benzyl phthalate, and totalPCBs). For these seven undetected chemicals, it is not possible to know whether thechemical concentrations were really above or below the SMS.
The sampling for the Duwamish/Diagonal cleanup study did not collect any sediment orwater samples from the Diagonal Ave. South SD discharge pipe because sediment offshore from this pipe did not show any unusual chemical elevations. As part of theDuwamish/Diagonal site investigation, three sediment samples were collected offshorefrom the small SD pipe. The only chemicals that showed increased values near the stormdrain were the two phthalates (butyl benzyl phthalate and bis(2-ethylhexyl)phthalate) thatare present in Areas A and B. The lack of any elevated chemicals, besides phthalates, inthese three sediment samples collected in front of the small SD outfall suggests there areno problem discharges to this small pipe that could be a potential recontamination sourceto Area B. Also, this small drainage basin would be subject to periodic businessinspections carried out for other programs as discussed in the next section.
4. INDUSTRY AND BUSINESS INSPECTIONS FOR SOURCE CONTROL
Information regarding the types of industries and businesses in the drainage basinstributary to the CSO and SD discharges at the Duwamish/Diagonal sediment cleanupproject was provided in Chapter 3 (Source Control Evaluation) of the 2001 draft CleanupStudy Report. However, it was pointed out this information was old because the sourcewas a 1994 EBDRP report called the Cleanup Study Work Plan. A source controlevaluation was conducted in 1994, when the Duwamish/Diagonal project started, becausethis was required as part of the SMS process. The project was sidelined for a few years

12
by EBDRP, meaning the initial source control work occurred a number of years beforethe expected cleanup. But it was understood that additional source control work wouldbe conducted in the basin. Since that time, the City Stormwater Inspection Program, theIndustrial Pretreatment Program and the Regional Hazardous Waste program have allcarried out regular inspections in the drainage basin. All of these programs are describedin more detail later in this section. These programs are designed to protect the landfills,the waste water treatment plants (including biosolids) and the local marine receivingwaters of the Duwamish River and Elliott Bay. Because these programs are long term,they help fulfill the need for ongoing source control in the Diagonal CSO/SD drainagebasins. Ecology is also preparing a comprehensive Source Control Plan for the lowerDuwamish River Superfund area, which means that those source control objectives,requirements and implementation plans will apply to the Duwamish/Diagonal sedimentcleanup site and drainage area.
4.1. City Storm Water Inspection Program
In 1996/1997 the City's Drainage and Waste Water Utility (DWU) undertook specialsource control investigations in the Diagonal CSO/SD basin in preparation for theDuwamish/Diagonal sediment cleanup project. The City began this work in 1995 andused standard industrial classification codes (SIC) to identify about 1,000 businesses,focusing on outdoor activities to minimize the presence of onsite pollutants that couldcome in contact with stormwater runoff. The majority of these businesses involvedmanufacturing, scrap yards, transportation, or automotive repair. Of these businesses, itwas determined that more than 700 do not conduct outdoor activities that couldpotentially harm the environment (City of Seattle 1996). The remaining businesses weretargeted for source control inspections. The names of these businesses are included inAppendix D of the Cleanup Study Report. The 264 business listed were to eitherreceived a drive-by inspection or an actual site visit inspection during 1996/1997. Also, aseries of information bulletins were mailed to businesses. The objective was to controlcontamination input from upland basins by promoting best management practices,including disposal/storage activities and housekeeping practices, and to increase localawareness of the importance of protecting water quality.
The City has been conducting a second set of source inspections in the basin that willcontinue into 2003. In 2001, 200 businesses were inspected in the western portion of theDiagonal basin (109 drive-by inspections and 91 complete onsite inspections). A list ofbusinesses inspected is provided in Table 1 and a map of the business locations isprovided in Figure 1 attached to this Source Control Summary document. A total of 81of the businesses inspected were not in compliance with City stormwater source controlrequirements. As shown in Figure 2 attached to this Source Control Document, most ofthe problems were related to inadequate maintenance of onsite storm drainage systems(33 percent) and inadequate spill response programs (47 percent). SPU inspectorsworked with the business owners to improve their stormwater pollution preventionpractices. As of March 2002, over 90 percent of the businesses inspected are now incompliance with City stormwater requirements.

13
Beginning in late 2000 and running through 2001, the City also conducted an intensebusiness inspection program in the Diagonal CSO/SD basin trying to locate the source ofa sticky white material that fouled fish nets on September 25, 2000. Samples of stickymaterial revealed it was a water-soluble acrylic resin that has a verity of uses includingcoatings for paper, textiles, and wood products, in adhesives, and in ion exchange resins.A number of businesses in the vicinity of the outfall were investigated, but no specificsource of the resin material has yet been identified. The City prepared a brief summaryof these activities in a memo attached to this Source Control Summary document.
The City inspections were initially conducted to identify possible sources of oil and resinmaterials, but also to evaluate storm water pollution prevention practices and to ensurethat businesses were in compliance with the source control requirements of the Citystorm water, grading, and drainage control code (SMC 22,800). As of July 5, 2000, allbusinesses and residential properties are required to implement certain operationalcontrols to reduce storm water pollution runoff (i.e., maintain onsite storm drain facilities,identify and eliminate illicit connections to the drainage systems, and maintaindriveways, parking lots and sidewalks). In addition, businesses that engage in thefollowing high-risk pollution generating activities are required to implement additionaloperational controls and must implement structural controls when applying for buildingpermits after January 1, 2001: 1) Fueling operations; 2) Vehicle, equipment, and buildingwashing and cleaning operations; 3) Truck or rail loading and unloading of liquid or solidmaterials; 4) Liquid storage in stationary above ground tanks; 5) Outside portablecontainer storage of liquids, food wastes, or dangerous wastes; 6) Outside storage of non-containerized materials, by-products, or finished products; 7) Outside manufacturingactivity; and 8) Landscape construction and maintenance. Business inspections focus onoutdoor activities to minimize the presence of onsite pollutants that could come in contactwith storm water runoff. Specific requirements for operational and structural controls aredescribed in the City's 2000 Source Control Technical Requirements Manual.
During 2002 and 2003, the City surface water quality team will continue conductingsource control activities in the Diagonal basin to support the early action cleanupproposed for the Duwamish/Diagonal CSO/SD as part of the lower Duwamish Superfundinvestigation. An additional inspector will be hired in 2002, who will be assignedprimarily to the City Duwamish source control effort. Pollutant source inspections will beexpanded to cover the eastern portion of the drainage basin that was not covered in 2001.In addition, focused inspections will be conducted at select businesses in the basin todetermine whether these facilities are sources of the contaminants of concern (COC)found in the sediment offshore of the Diagonal outfall.
Another City program that reduces pollutant inputs from storm water is the program toclean street catch basins on a regular basis. Street dirt contains a great deal of chemicalpollutants and a large percentage of the pollutants are attached to the dirt particles. Catchbasins are designed to keep the street dirt from traveling into the storm drain pipe wherethe dirt will either accumulate and plug the pipe or be washed out to the receiving water.The main objective of the catch basin maintenance is to trap the street dirt before it entersthe storm drain or sewer pipe. The catch basins tributary to the Duwamish/Diagonal

14
cleanup area will be cleaned regularly and this will reduce the input of contaminatedstreet dirt in storm water discharges.
4.2. KC Industrial Waste Program
King County implements an Industrial Waste (IW) Program that started in 1969 and isconsistent with the requirements of the Clean Water Act. The IW program requiresnondomestic users of the metropolitan sewer system to pretreat wastewater beforedischarging it into the sewer system. Standards and limits are established to protectsewerage facilities and treatment processes, public health and safety, and the receivingwaters. King County’s IW rules and regulations require all industrial users to comply, ata minimum, with the applicable pretreatment standards and requirements of the CleanWater Act. In addition, the regulations require King County to establish dischargestandards and limitations to the extent necessary to enable King County to comply withthe NPDES. The IW program is funded by a combination of user charges and King Countysewer fees and the 2000 budget was $1.48 million.
The IW program requires businesses to comply with federal, state, and local limits onpollutants. Regulated pollutants include heavy metals, flammable materials, sulfides,cyanide, organic compounds and laboratory chemicals. King County implements thepretreatment program through waste discharge permits and authorizations to industrialusers. The program has resulted in a major decline of undesirable chemicals inwastewater received by King County treatment plants since the program began in 1969.
The IW program issues wastewater discharge permits and discharge authorizations tocompanies that have industrial processes with the potential to adversely affect King Countytreatment facilities. Permits are more comprehensive than discharge authorizations andgenerally require self-monitoring of the company’s discharge. In addition to self-monitoring,King County staff inspects facilities with discharge permits and authorizations. Permits areissued to “Significant Industrial Users”. Facilities below the threshold that require permits,can be issued discharge authorizations in the minor category (fewer requirements and no self-monitoring) or the major category (requires a limited amount of self-monitoring). At the endof 1999, King County had 145 Significant Industrial Users and 279 discharge authorizations.
In the past year, the IW program completed 210 inspections of Signficant Industrial Users and77 inspections of facilities with discharge authorizations. Staff collected 2,628 compliancesamples, primarily from Significant Industrial Users. In addition, companies reported thatthey had undertaken self-monitoring by performing 23,185 analyses of samples. Whenviolations were identified, the IW program did follow-up inspections and sampling to verifythat conditions causing the violations were corrected and eliminated. None of the violationsidentified by King County or by self-monitoring caused NPDES exceptions at King Countytreatment facilities (King County, 2000c).

15
In addition to monitoring discharges by businesses with discharge permits andauthorizations, the Industrial Waste Program monitors pollutant levels at other locationsthroughout the wastewater collection system. Samples of wastewater influent arecollected daily at the South Plant and the West Plant. Samples of wastewater arecollected two weeks each year at several pump stations, siphons, interceptors, and keymanholes (central points through which all wastewater from each sector of land flows).Each sampling station is monitored continuously for one week during the wet-weatherseason (November through April) and for one week during the dry-weather season (Maythrough October). Heavy metal and other pollutant levels are measured and analyzed.The ongoing data collection allows staff to determine the range of pollutantconcentrations over time. When heavy metals or other pollutants are detected atunusually high concentrations, staff often can determine the approximate direction fromwhich a pollutant is coming, track the discharge to its source, and take corrective action.
All of these actions significantly lower the concentrations of pollutants in sewage andtherefore in any CSO discharges that occur at the Diagonal CSO/SD. The King CountyIW program has some of the most stringent pretreatment requirements in the nation –significantly below EPA requirements. The ongoing tracking program will continue toidentify violations or new sources or dumping. In the future the IW program will providesome additional support to source control investigations in the Diagonal CSO/SDdrainage basin. One IW staff person will be assigned to work primarily in the DiagonalCSO/SD drainage basin during the last half of 2002 and in 2003.
4.3. Regional Hazardous Waste Program
The Regional Hazardous Waste Management Program complements King County'sIndustrial Waste Program by educating local residents and small businesses on ways toreduce hazardous waste and prevent water pollution. The program is a cooperative effortamong King County DNRP (Solid Waste and Water & Land Resources Divisions),Public Health-Seattle and King County, City of Seattle Public Utilities, and 38 cities inKing County and Snohomish County. This program implements the Local HazardousWaste Management Plan adopted in 1990 by King County and all the local cities. Theprogram is funded through fees added into commercial and residential garbage and sewerrates. The 2001 budget was $12.6 million. The program provides facilities for householdand hazardous waste management and mobile collection and disposal operation.
The regional Hazardous Waste Management program targets industry groups andgeographic areas to provide technical assistance. The staff make site visits to smallbusinesses throughout King County and all of its incorporated cities and observeoperating practices. When problem materials, such as lead, mercury, and solvent-basedpaints, are being disposed of in the sanitary sewer, staff counsel the company on correctpractices. When necessary, staff can refer the matter to the Industrial Waste Program forregulatory action. In 2000, program staff inspected more than 3,000 businesses. Follow-up inspections indicate that 75 to 80 percent of businesses make at least one positivechange in hazardous waste management or environmental practices as a result of theinitial visit, and some businesses make numerous changes (Galvin, 2001). TheDuwamish has been included in the geographic area coverage, meaning that every

16
business has been visited, in addition to targeted efforts for all auto body and repairshops, machine shops, photo labs and dry cleaners in the basin.
In addition to site visits, the program provides vouchers to qualified businesses to helpdefray the cost of hazardous waste management and equipment upgrading. Staff conducthousehold hazardous waste education through a telephone hotline, publications andpublic outreach. Also, staff respond to complaints about pollution incidents related tohazardous materials. Recent presentations were given to EPA and Ecology staff toinform them about the regional Hazardous Waste program and additional information canbe provide upon request.
King County is currently sorting all the business inspections made by the regionalhazardous waste program to determine how many were in the Diagonal CSO/SD drainagebasin. This information will be assembled to provide documentation of businesses andactivities. Also, this information will be coordinated with the inspection data from boththe City business inspection work and the King County industrial waste inspection work.In 2002 and 2003, efforts will be made to focus revisits and to visit new businesseswithin the Diagonal CSO/SD drainage basin.
4.4. EPA Enforcement Action
The federal government has authorized EPA to regulate and enforce dangerous andhazardous waste through the Toxic Substances Control Act. The Elliott Bay ActionProgram that was conducted in the mid 1980's was a larger program funded by EPA tofind and eliminate chemical discharges to Elliott Bay and the Duwamish River. Severalvolumes of reports were produced documenting chemical levels in bottom sediments andpotential sources.
One example of where EPA took an enforcement action on a business in the DiagonalCSO/SD drainage basin was in 1984 when Janco-United received criminal charges andfines for discharging chemicals to the soil and storm sewer. Janco-United was a janitorialchemical supply company that formulated and repackaged a variety of commercial gradecleaners from concentrate. To avoid METRO's Industrial Pretreatment permittingprocess, the company installed an illegal drain-pipe in the summer of 1992 that lead tothe Diagonal CSO/SD. For approximately every working day for 27 months, chemicalsranging from dilute rinsate to discontinued product were discharged by companyemployees down a storm sewer that was illegally connected to the Diagonal CSO/SDsystem. EPA found high concentrations of phthalates, chlorinated benzenes, and volatileorganic compounds in soils and drains at the facility located at 4412 Fourth Avenue.Phthalates are two of the four chemicals that exceed SMS values at theDuwamish/Diagonal cleanup area as reported in the draft 2001 Cleanup Study Report.
4.5. CERCLA and MTCA Programs
The Comprehensive Environmental Response, Compensation and Liability Act of 1980(CERCL), also known as Superfund, provide the national policy and procedures to

17
identify and cleanup contaminated sites on the National Priority List (NPL). The LowerDuwamish Waterway was placed on the NPL on September 13, 2001 and is now aSuperfund site. The Lower Duwamish Waterway Group consisting of the Port of Seattle,the City of Seattle, Boeing, and King County are conducting a RemedialInvestigation/Feasibility Study of the site. One aspect of the process is to identify earlyaction projects where remediation can be undertaken in the near term while the rest of thesediment cleanup needs are established under the Superfund process. Source controlrequirements will apply to all early action projects.
The state of Washington has authority to regulate and enforce dangerous and hazardouswaste through the Model Toxic Control Act (MTCA). Ecology is the lead for sourcecontrol aspects at the lower Duwamish Superfund site. Ecology will develop acomprehensive Source Control Plan to protect sediment quality and sediment cleanupprojects within the site that includes the Duwamish/Diagonal CSO/SD Cleanup projectsite. Provisions of this comprehensive plan will apply to the discharge pipes near theDuwamish/Diagonal sediment cleanup project, which includes the large DiagonalCSO/SD.
5. INVESTIGATION OF OIL SHEEN FROM DIAGONAL CSO/SD
5.1. Investigation
The City received reports of oil coming from the Diagonal CSO/SD and has investigated,but has not conclusively located the source of this oil discharge. The first oil sheenreported to the City and the U.S. Coast Guard and was on August 2, 1996. The Cityinvestigated by looking in manholes along the pipe to see if the input source could belocated. The tide moved the oil sheen up and down the pipe so it was not possible tolocate the source. None of the side branches checked along the lower 1.3 miles of themain storm drain showed any evidence of oil. A one page summary of this oil sheeninvestigation is dated February 7, 1997 and was included in Appendix B of the draft 2001Cleanup Study Report.
The second documented oil sheen reported to the City and the U.S. Coast Guard was onNovember 8, 1999, when a large oil sheen extended from the outfall to the mouth of theriver at Elliott Bay. On February 14, 2000, the City installed a temporary containmentboom and absorbent boom offshore of the outfall. City staff checked the outfall daily,observing oil on a regular basis but at reduced levels. Inspections were dropped toweekly in 2001. The internal absorbent boom continues to be replaced as needed (aboutevery2-3 months) and was last replaced on February 21, 2002.
While the source of the November 1999 spill has not been clearly identified, there weretwo possible sources of petroleum hydrocarbons found in the basin. In September 2000,Seattle Public Utilities crews removed about 6,500 gallons of oil-contaminated materialfrom a storm drain at 7th Avenue S and S. Charlestown Street. Sediment blocked the lineeast of 7th Ave. S and during large storm events, this area could overflow to the DiagonalCSO/SD. Also, in July 2000, an oil sheen was observed in ground water and traced back

18
to a Union Pacific recovery operation that removed and estimated 38,000 gallons ofdiesel product. When active product recovery operations were initiated, the oil sheen atthe Diagonal CSO/SD noticeably declined. However it was not possible to directly linkthe oil observed at the outfall with the diesel-contaminated groundwater.
5.2. Tie to 4-Methyl Phenol in River Sediments
Petroleum products contain 4-methyl phenol, which means that the presence of thiscompound in sediment could indicate the presence of oil products in sediments. Theoccurrence of 4-methyl phenol was seen to change over time in river sediments collectedfrom Duwamish/Diagonal study area and could indicate a corresponding change in theinput of sediments containing oil material. Site assessment sampling in 1994 and 1995did not find any 4-methyl phenol in any sample, but the compound appeared in samplescollected for the project in 1996. A few sediment samples have been taken from the areaby other studies in 1997 and 1998 and 4-methyl phenol was present during both thoseyears. The observation of 4-methyl phenol in samples from 1996 through 1998corresponds to the August 1996 date that the oil sheen was observed from the DiagonalCSO/SD.
Surface sediment samples were collected for the Duwamish/Diagonal project in 1992,1994, 1995, and 1996. Only the first and last years of sampling had 4-methyl phenolbeen present in measurable concentrations. In 1992, six preliminary samples werecollected, but only two of these had detectable levels at 130 ug/kg dry weight (DW). In1994, surface samples were collected from 35 stations and in 1995 surface samples werecollected from 10 surface sample; however, 4-methyl phenol was not detected in any ofthese samples. In 1996, samples were collected at 10 surface stations and all but 3samples were above the detection limit. The 7 samples above the detection limit hadfairly high values. The 5 samples in front of the outfall (DUD200, DUD201 - DUD204)had values that ranged from 484 -769 ug/kg DW, with two of these (DUD200 andDUD204) were above the SQS/CSL value of 670 ug/kg DW. However, the highestsamples were further upstream with a value of 1,350 ug/kg DW at Station DUD205 and avalue of 4,630 ug/kg DW at Station DUD207. This station is located at about the middleof the loading pier, but offshore at the east channel line. In 1997, King County collectedsamples near the Duwamish/Diagonal study area for the Duwamish Water QualityAnalysis and found 4-methyl phenol values that ranged from 168-427 ug/kg DW. In1998, a Puget Sound Ambient Monitoring (PSAM) station (# 204) collected from theDuwamish/Diagonal study area was reported to exceed the SQS/CSL value of 670 ug/kgDW.
King County has found the presence of 4-methy phenol in sediment varies over time atthe Pier 53-55 sediment cap along the Seattle waterfront, but speculated the source mightbe wood waste rather than oil. The 4.5 acre cap was placed in March 1992 and baselinesamples showed low chemical values. The one year post-cap sampling (1993) revealed

19
that the entire cap surface had been recontaminated with high levels of PAHs due to apiling removal action at Coleman Ferry Dock, which boarders the cap. Despite highlevels of PAHs, no 4-methyl phenol was detected. When the cap was sampled again in1996, the PAHs levels were greatly reduced, but substantial levels of 4-methyl phenolwere found at all 7 surface grab stations. The values ranged from 106 to 2,160 ug/kg DWand the highest value (VG5) exceeded the SQS/CSL. Four stations had values rangingfrom 423 - 574 ug/kg DW. These results prompted a special sampling event in 1998,which showed that 4-methyl phenol values were reduced to undetectable levels. Thesource of 4-methyl phenol was not located but there was some speculation that it could berelated to wood waste. Also, it appeared that the presence of this compound might beseasonal, but this was not investigated.
The degredation rate of 4-methyl phenol is predicted to be rapid in aerobic conditions,but slower under anerobic conditions. In a freshwater lake, total degradation was shownto occur in only 6 days, while the half-life in marine waters was less than 4 days. In astudy of anaerobic lake sediment, degradation did not begin during the 29 weeks of thestudy (Howard 1991). Studies show 4-methylphenol has a very low adsorb tosoil/sediment (less than 1% in one study). Howard (1991) also mentioned that thehighest levels and the most frequent detections of 4-methylphenol were in the effluentdischarges from the timber products industry. One speculation was that 4-methylphenolon the Pier 53-55 cap might be associated with wood debris that could originate fromthree sources: 1) wood products that have been cast off from the piers throughoutSeattle's history; 2) from the drift wood that accumulates along the waterfront; 3) fromwood or wood products used in the construction and repair of the piers along thewaterfront. Oil was not listed as suspected source of 4-methyl phenol along thewaterfront.
Because the presence of 4-methy phenol in sediments at Duwamish/Diagonal cleanuparea could indicate the presence of oil in the sediment to be dredged, Ecology wanted toknow about contingency plans to address any oil released from the sediment duringdredging activities. The design engineers for the project (Anchor Environmental) willaddress this issue as part of a complete quality assurance (QA) plan for the project thatwill be developed during design. One method to address potential oil releases fromsediment during dredging that will be included in the QA plan is the use of an oilabsorption boom. If the oil absorption boom were needed, the boom would likely beused to encircle the area being dredged. The oil absorption boom would be replaced asneeded to minimize any oil plume on the river surface. If significant oil is observed inthe water that accumulates on the haul-barge, then one method to remove this oil wouldbe to place oil absorbent material overtop the filter fabric material used to filter waterbefore the accumulated water leaves the haul-barge back into the river.
6. DIAGONAL CSO/SD PIPE CLEANING PLAN
Considerable sediment has settled in the long flat section of the Diagonal CSO/SD pipe.The City previously sampled this pipe in the 1980's, but in 1992 the City conducted a
20
pipe inspection and sampled accumulated sediments as part of the EBDRP project. Itwas agreed early in the project that the sediment would need to be cleaned from the pipebefore the Duwamish/Diagonal sediment cleanup project was completed to avoid thepotential of any contamination in those sediments recontaminating the cleanup project.The EBDRP project established a source control budget for various activities, and theDiagonal CSO/SD pipe cleaning was assigned a projected cost of $ 500,000.00. The Citytook the lead to design and implement a project. The City first determined how muchsediment was present in the pipe and then identified methods for conducting the pipecleaning. Part of this activity involved collection of new pipe sediment chemistrysamples and this data will be discussed below along with the earlier data from 1992.
6.1. Pipe Cleaning
Investigations discovered that sediment was present in main discharge line and also intwo tributary lines. The maximum depth of accumulated sediment was about 12 inchesin the main and about 8 inches in one tributary line. The volume of sediment in the mainline was estimated at about 434 cubic yards. The volume of sediment in one tributaryline to be cleaned was estimated at about 64 cubic yards each. The total projectedvolume of sediment was about 498 cubic yards. It is assumed that this sediment will betaken to a landfill for disposal or to a soil-recycling contractor for treatment and re-use.One of three pipe cleaning methods found to be feasible will be used to clean the pipe,tentatively scheduled for the late summer dry season (August) of 2003.
6.2. Chemical Samples Of Diagonal Pipe Sediments
In 1994, as part of the Duwamish/Diagonal project, the City collected 4 pipe sedimentsamples from the Diagonal CSO/SD. This data was reported in Appendix G of the 2001draft Cleanup Study Report along with a map showing the sampling locations (see 1994Pipe Sediment Sampling Locations Map and Figure 5 for Diagonal Storm Drain PipeSediment Samples). This pipe sediment data was originally used to decide that theDiagonal CSO/SD pipe should be cleaned prior to performing the Duwamish/Diagonalsediment cleanup action. Information about the samples that the City collected from thispipe in the 1980's was not included in the draft 2001 Cleanup Study Report because the1994 data was more recent. For source tracing activities, it is most useful to use the mostcurrent data, which means the samples collected in 2002 will provide more informationthan the 1994 pipe samples.
In January and February 2002, ll pipe sediment samples were collected and submitted forchemical analysis. The initial sampling plan was to collect sediment samples only fromthe mainline, but it was discovered that two tributary side lines had sedimentaccumulation. In late January 2002, pipe sediment samples were collected at 7 of the 8planned locations in the mainline. In late February 2002, pipe sediment samples werecollected at 4 of the 5 planned locations in the tributary lines. There was not enoughsediment present to collect a sample at all planned location.

21
The chemical results will provide information to evaluate whether the pipe sediment canbe disposed of at a landfill and compare pipe sediment concentration with those ofsurface sediments in the river in front of the outfall. The data is also useful for sourcetracing of high chemistry values that would indicate a problem discharge that should becontrolled. The Data Report (dated March 28, 2002) was just received by project staff;consequently, there has not been time to perform any of the data analysis listed above.To insure Ecology and EPA have the data as soon as possible, a copy of the chemicaldata is attached and is labeled Table C-1 and C-3. Also attached is Table 2 that is aSummary of Constituents Exceeding Criteria by Sample Location. A few of the resultswritten in the report are included in this Source Control Summary document and theentire pipe sampling report will soon be available.
Table C-1 shows that all samples collected from the main line had concentrations of totalpetroleum hydrocarbons that were less then the MTCA Method A soil cleanup levels forunrestricted use. However, 4 of the 5 samples from the two tributary lines exceeded theMTCA Method A cleanup level for total petroleum hydrocarbons (TPH) as motor oil.One tributary sediment sample (T-3a; Duwamish Ave South) exceeded the TPH criteriaas diesel fuel. All metals except cadmium at the Duwamish Avenue South tributary linewere less than the MTCA Method A soil cleanup level. Even though the inline sedimentis above the MTCA criteria, the results show that sediment cleaned from the pipe issuitable for disposal as a solid waste or for recycling and re-use following treatment.When metals values are compared to the SMS criteria, only zinc exceeded the SQS valueand this was in 3 of the 5 tributary samples.
Table C-3 reports organic chemistry data compared to SMS standards and Table 2summarizes the constituents that exceed the SMS and the MTCA Soil Cleanup Levels forUnrestricted Uses. This table shows that concentrations of two or more PAH compoundsin the three most down gradient main line sampling locations were greater than the SQScriteria. All sampling locations except one side tributary sample (T2) had concentrationsof bis(2-ethyl hexyl)phthalate that were greater than the SQS chemical criteria. Three ofthe 5 tributary lines exceeded the SQS value for butyl benzyl phthalate, but no main linesamples exceed SQS for this chemical. Two of the mainline and all of the tributarysamples have concentrationsx of benzo(a)pyrene that were greater than MTCA Method Asoil cleanup levels. (Tetra Tech Technical Memo dated March 27, 2002).
7.0 SAMPLES OF PIPE SEDIMENT AND PIPE WATER
This section provides a summary of the samples that have been collected to characterizepipe sediment and pipe water in the basin tributary to the Duwamish/Diagonal sedimentcleanup project. Also, provided is information about a 1996/1997 King County study thatconducted an extensive sampling program for CSOs that discharge to the DuwamishRiver.
7.1. Pipe Sediment Data
22
The previous section reported that 11 new pipe sediment samples were collected from theDiagonal CSO/SD during the first two months of 2002. As discussed above, the data forthe 7 samples from the mainline and the 4 samples from the tributary lines are providedto EPA and Ecology as part of this Source Control Summary document (see Tables C-1and C-3).
No sediment sampling is possible for the Duwamish CSO discharge. This CSO isactually the emergency by-pass for the Siphon and the Duwamish pump station, whichhas not overflowed for 11 years (since 1989). There is no location to collect a sedimentsample from the Siphon and the continuous flow probably limits any accumulation ofsediment in the Siphons. The only accumulated sediment in the Duwamish CSO pipewould probably be located near the end of the outfall pipe where river sediment can settlein the end of the discharge pipe.
The only other pipe discharging to the Duwamish/Diagonal cleanup area is the small (12-inch) Diagonal Ave. S. storm drain that is located near the upstream corner, but inshoreof Cleanup Area B. The drainage basin is 12 acres and runs a short distance back fromthe river. In 1988, the Elliott Bay Action Program sampled pipe sediment, but the pipehas not been sampled since because the offshore sediments in front of the pipe did notshow any unusual chemicals.
In 1994, King County collected three sediment samples from directly in front of the smalloutfall pipe (DUD013, DUD014, and DUD015) as part of the Duwamish/Diagonal siteassessment. Sediment at these three stations looked like clean tan colored sand and thechemical values were low for all chemicals except the 2 phthalates butyl benzyl phthalateand bis(2-ethyl hexyl phthalate. Both of these phthalates have higher concentrationdownstream at the large Diagonal CSO/SD. These sediment sample data are evaluated inSection 7.3.
7.2. Pipe Effluent Samples
The CSO discharges to the Diagonal CSO/SD have not been sampled. However, KingCounty has a lot of CSO data that can be used to characterize the estimated 65 MGY ofCSO discharged to this basin. King County characterized CSOs under a requirement ofthe NPDES (National Pollution Discharge Elimination System) permit for West PointTreatment Plant. In addition, King County conducts special studies of CSO discharges atvarious times. The most recent study of CSO discharges to the Duwamish River was in1996/1997 and resulted in a report titled King County Combined Sewer Overflow WaterQuality Assessment for the Duwamish River and Elliott Bay (1988).A major CSO sampling activity was conducted in 1996/1997 and involved the collectionof over 100 samples that were analyzed for organic and metal pollutants.
The King County sampling activity in 1996/997 focussed on 4 CSO sites (Brandon StCSO, Chelan Avenue CSO, King St CSO, and Hanford St CSO also know as Hanford # 2CSO). Appendix L of the CSO Study Report provided information on the dates thatdifferent CSOs were sampled, and a copy is attached to this Source Control Summary

23
document (see BIBLIOGRAPHY OF DATA REPORTS AND QUALITY ASSURANCEREVIEWS). The chemistry data for the 1996/1997 CSO sampling is contained in theKing County database. The primary use of the 1996/1997 data was input to amathematical model that predicted chemical concentration in the Duwamish River withand without CSO discharges. Spreadsheets were prepared in 2002 to inventory the CSOdata available as potential input for new effluent modeling work and these inventorysheets are attached.
About 1,230 MGY of separated storm water is discharged out the Diagonal CSO/SD andKing County conducted sampling in 1995 to characterize this storm water. It took twoyears to get 10 storm water samples because it is difficult to sample the lower part of thisdrainage basin. It is not possible to sample within the Diagonal CSO/SD or the lowerpart of the tributary lines because these areas flood with river water during high tide.During the first year the two planned sampling locations (Diagonal at Colorado andDiagonal at Airport Way S.) had to be abandoned due to backup water during high tide.The two pipes that King County was finally able to sample were located farther up thesystem (South Hinds at 8th Avenue and South Horton at 13th Street South).
The metal and phthalate data for these 10 samples were included in Appendix H(METRO Recontamination Modeling Report) of the draft 2001 Cleanup Study. A copyof this data table is attached to this Source Control Summary document (see table labeledStormwater vs Model). In this table it shows the 3 samples from Hinds were pooled withthe 7 samples from Horton to produce average values that are listed on the right side ofthe table. For comparison, the first column on this table provides the average CSO valuethat was derived for the 1996 model calculations. The CSO values are mostly higher thanthe average storm water value calculated from the 10 samples collected in 1995. It wasrecognized that the storm water data was limited with only 10 samples, so the model wasrun using the higher CSO average values instead of storm water data to insureconservative results.
The small (12-inch) Diagonal Avenue South storm drain has not been sampled for stormwater. As stated above, the storm water from the Diagonal Avenue South SD was notconsidered to be a significant potential recontamination source to theDuwamish/Diagonal sediment cleanup project for three reasons: 1) The sedimentoffshore from the pipe did not show any high chemical levels, 2) The flow is expected tobe low because the 12-acre drainage basin is only about one-half of one percent (0.5percent) of the size of the 2,585-acre Diagonal CSO/SD drainage basin, 3) The smalldischarge pipe is located far inshore from the inshore boundary of Cleanup Area B. TheseCSO and stormwater sample data are evaluated in Section 7.3.
7.3. Comparison To SMS Or Water Quality Criteria
The 2002 pipe samples have been compared to the SMS values as shown in Tables C-1and C-3. There were not many metals that exceeded standards. Zinc exceeded SQS inthree of the 11 samples and chromium exceeded SQS in one sample. The two most downgradient samples from the main line had 4 -8 PAH compounds that exceeded the SQS

24
values. The next sample upstream had only two PAH compounds above the SQS. Allsample locations except one (T2 from tributary) had bis(2-ethylhexyl)phthalate above theSQS and the highest value was in the main line sample second from the end (location ofmost PAHs). Three tributary lines exceeded the SQS for butyl benzyl phthalate(Duwamish Avenue South, Denver Avenue South, and 1st Avenue South). PCBs weredetected in two tributary lines and one of these was 35.6 mg/kg OC, which is above theSQS.
The pipe data reflects accumulation over a long time so it may have limited value fortracking current sources. There is no way of knowing if the concentrations seen are fromcurrent from historical contamination. The pipe sediment will be removed, which takesaway the potential that the existing pipe sediment could recontaminate the cleanupproject. After the pipe is cleaned, the new sediment that accumulates would be morereflective of current sources. Those sediments will be sampled to look for ongoingsources. However, it may take some time before a significant amount of new sedimentcollects in the pipe. In the meantime, the surface of the cap will be routinely sampled tolook for recontamination as part of the long-term monitoring plan.
King County does not typically compare the CSO water sample data directly to the WaterQuality Criteria because the discharge dilutes when it enters the receiving water.Usually, the receiving water data is compared to the Water Quality Criteria. King Countyhas measured receiving water quality and also has used models to predict the receivingwater concentrations. As mentioned above, one part of the Duwamish Water QualityStudy was to take all the CSO data and use it as input to the hydraulic river model thatwas able to calculated the chemical concentrations in the river water both with andwithout the CSO discharges. King County also collected at least 118 receiving watersample (see data Inventory Sheets attached) that were analyzed for metals and organicchemicals. Both the measured values and the calculated values of river water meet theWater Quality Standards.
Storm water will dilute when it enters the receiving water so again the comparison toWater Quality Criteria must be done with caution. The 10 storm water samples collectedin 1995 from Diagonal CSO/SD were compared to calculated Water Quality values formetals. Two sets of Water Quality Criteria values were calculated because freshwatermust be adjusted for hardness (see table attached to the storm water data—Water QualityCriteria (ug/L)1). Some metals, such as copper, lead, nickel, and zinc, exceed the WaterQuality Criteria, but these values would meet the criteria values with a dilution factor of10-20, which is a relatively small dilution. From the limited storm water data, it suggeststhat some metals are higher at Hinds because two of these three samples had the highestvalue for copper and zinc (samples from July 9, and November 8, 1995).
8. PHTHALATE RECONTAMINATION POTENTIAL
The two chemical groups of greatest interest for potential recontamination atDuwamish/Diagonal are phthalates and PCBs. These two chemicals have different
25
sources, which required two different focuses to modeling. The primary source ofphthalates is from the storm water discharged out the Diagonal CSO/SD; consequently,phthalate recontamination modeling was tied to the discharge pipe. The source of PCBrecontamination is not the present discharge pipes because based on even conservativeassumptions of PCB levels in the discharge, the concentrations are too low to be aproblem. The most likely PCB source would be future dredging of contaminatedsediment. This issue requires a different model that will be discussed in a followingsection.
8.1. Recontamination Modeling
Sediment recontamination modeling of the Diagonal CSO/SD was conducted on threeseparate occasions, using two different methods, in attempts to characterize the likelihoodof recontamination of the sediment in the Study Area following cleanup. The firstmodeling effort was undertaken in 1996 by KCDNR, using a modification of theSEDCAM model named METSED. This modeling had to be modified in 1997, whennew information from the City significantly increased the assumed stormwater dischargefor the Diagonal SD from an estimated annual flow of 685 MGY to 1230 MGY. Thethird modeling effort was conducted by WEST Consultants in 1999, using direct fieldobservations, supplemented by analytical and numerical results, to perform a massbalance between the chemicals observed in the "footprint" and the various sources,including background.
In 1996/1997, KCDNR conducted sediment recontamination modeling to evaluate thelikelihood of recontamination of the sediment at the site after sediment cleanup projectwas completed. The full modeling report, including the update information, waspresented in Appendix H of the draft 2001 Cleanup Study Report and a summary wasprovided in Section 3.4.1 of that report. The conclusion of this modeling effort byKCDNR was that cleaned sediment in the vicinity of the Duwamish/Diagonal outfallswould likely be recontaminated above the SQS by bis (2-ethylhexyl) phthalate and butylbenzyl phthalate. This modeling approach was not totally consistent because it alsopredicted that two metals would pose a greater recontamination potential than the twophthalates. However, the measured surface sediment concentrations at the site showedthat these two metals did not exceed the SMS values as was predicted by the model. Thisconclusion led to further modeling, using another approach, in an effort to confirm orrefute these findings.
After a lot of discussion about modeling options, it was decided in 1999 to use a simplemass balance model. The full modeling report from West Consultants was presented inAppendix I and summarized in Section 3.4.2 of the draft 2001 Cleanup Study Report. Abasic mass balance modeling approach was selected because it relies on the simplestassumptions and is based primarily on field observations, supplemented by numericalmodeling results, to define the relationship between discharges from the storm drains andcombined sewer overflows and the nearby sediment. This approach was used todetermine the discharge load reduction necessary for each constituent to maintainsediment quality compliance in the Duwamish/Diagonal footprint following cleanup.

26
The results of this modeling effort indicate that chrysene, fluoranthene, pyrene, and 1,4-dichlorobenzene will not exceed the SQS after cleanup (i.e., recontamination is unlikelyto occur). For butyl benzyl phthalate however, recontamination is indicated, even ifdischarge from the storm drain is completely eliminated. Virtually the same is true for bis(2-ethylhexyl) phthalate. Depending on the background concentration assumed for bis (2-ethylhexyl) phthalate, upwards of 87 percent of the source would have to be eliminated tomaintain sediment concentrations below the SQS after cleanup. This result suggestedthat background levels of phthalates in the river are high enough that it would not takemuch additional input from a particular discharge to exceed the SQS at that location.
The report also identifies important limitations to this method imposed by the availabledata. Improved knowledge of settling rates near the discharges, chemistry of thedischarges, and chemistry of the background sediment would greatly reduce theuncertainties present in the current analysis. However, simulation of the complexphysical and chemical processes that create the "footprint" from the various dischargeswill remain difficult.
There presently is no model that can predict the recontamination that will result from theCSO and storm water discharges because these outfalls have complicated dischargeconditions. Because of the need to have a mathematical model that can accuratelysediment recontamination, King County started developing a new model in late 2001 thatshould better predict recontamination for such complicated discharge scenarios. Thismodel will first be developed for CSO discharge, but will be applicable to storm waterdischarges. That model, when ready, will be applied to the Duwamish/Diagonal outfallsusing the latest source data to improve the understanding of recontamination potential atthe site and help target the direction of any source control activities.
8.2. Phthalate Toxicity
The toxicity of phthalates does not appear to be as great as suggested by the SMS criteriavalues because biological effects are not observed when the numeric SQS and CSLvalues are exceeded. Under the SMS rule, the potential for sediment to cause adversebiological effects is defined by chemical criteria. Biological testing is routinely used toconfirm chemical designation of sediments (Ecology 1996). Three of the biological testsspecified by the SMS rule were used in this study: The amphipod (ten-day) andechinoderm (21-day) bioassays were selected to identify acute effects based on mortalityand effective mortality (combined mortality and abnormality) endpoints, respectively.The juvenile polychaete bioassay was selected to evaluate chronic effects based on agrowth rate endpoint. The bioassay results are presented in Chapter 4 of the draft 2001Cleanup Study Report, and the summary Table 4.8—Bioassay results and SMSInterpretations is attached.
Two of the stations tested that exceeded the SQS value of 47 mg/kg OC for bis (2-ethylhexyl) phthalate (DUD200, DUD201; 65- and 48 mg/kg OC, respectively) showedno toxicity in any of the three bioassay tests. Two other stations exceeded the CSL value
27
of 78 mg/kg OC (DUD202, DUD205; 110- and 84 mg/kg OC, respectively) and alsoshowed no toxicity in any the three bioassay tests. The highest concentration at StationDUD202 was 1.4 times the CSL value, but showed no toxicity effects. Similar resultswere found in a sediment dilution study conducted on sediments from the Thea FossWaterway in Commencement Bay, Washington. The highest concentration of bis (2-ethylhexyl) phthalate that showed no toxicity was 1.7 times the CSL value (45 percentThea Foss sediment plus 55 percent dilution sediment). This data shows that the toxicityof phthalate is not as high as indicated by the SQS and CSL values.
8.3. Factors Supporting Remediation
Even though modeling results show phthalates will recontaminate the area near theDuwamish/Diagonal outfalls, there are factors that could justify proceeding with asediment remediation action to remove PCBs. Some of these factors deal with thefollowing issues: 1) the relative difficulty of achieving adequate phthalate source controlto prevent recontamination, 2) the relative toxicity of the PCBs and phthalates to humanhealth and biota, and 3) the relative size of potential phthalate recontamination comparedto the total size of the PCB cleanup area.
Phthalates are a common chemical found in stormwater and CSO discharges. Althoughthe concentrations are fairly low, the large stormwater volume of 1230 MGY results insubstantial loading. It will not be possible to eliminate the phthalates in the short term,but it is possible to focus efforts on reducing sources where possible. Source controlactivities were discussed above that will focus on the Diagonal CSO/SD drainage basin inan effort to reduce the loading of phthalates.
The removal of PCB "hot spots" is a priority for regulatory agencies, the tribes, andproject sponsors. The EBDRP panel has expressed a concern that PCBs pose a greaterrisk to human health and the environment than do phthalates. Because of this concernabout PCBs it is considered important to move ahead with a sediment remediation actionto remove PCBs even if there is a potential for part of the cleanup site to recontaminatewith continuing phthalate discharges. The current sediment is contaminated with severalhighly toxic compounds. The remediation would replace this contamination with a cleansite that has the potential to recontaminate over time with less toxic phthalates.
9. INPUT OF CHEMICALS FROM ADJACENT PROPERTY
The land on the inshore side of the Duwamish/Diagonal cleanup project is owned by thePort of Seattle and designated as terminals T106 and T108. In 1970, the Port made amajor change in the east riverbank north (downstream) of the current Diagonal CSO/SD.A new river bank was established by installing a long rock bulkhead in the river and thenback-filling the site to create about 900 linear feet of new river front property that is nowT106. This construction activity is visible in the 1970 aerial photo C-2 in Appendix C ofthe draft 2001 Cleanup Study report. The property south the Diagonal CSO/SD outfallwas the Diagonal Avenue South sewage treatment plant that closed in 1969 (also visible

28
on aerial photo C-2). After the treatment plant was removed, the property had twosettling pond constructed on the north half to receive PCBs dredged from Slip 1 (visibleon aerial photo C-3). In 1977, the Chiyoda Corporation moved the shoreline on part ofthe site about 100 feet inshore (visible on aerial photo C-4) and leveled the entire site.The LaFarge Corporation used the upstream half of the site for bulk dry cementreceiving, storage, and trans-shipment during 1989 to 1998. The old LaFarge site is openfor lease from the Port and the Port is using the rest of the property for container storage.
When the Port was contacted about obtaining property reports on T106 and T108, thePort informed us that they were assembling the same information to send to EPA as partof the Superfund potentially responsible party search and will be providing that data toEPA soon. Consequently, the following three categories may need to be updated whenmore details about T106 and T108 become available.
9.1 Surface Runoff
Aerial photos show that most of T106 and T108 are paved except near shore, which willprevent erosion by surface flow over contaminated soil. The quality of the material usedto backfill the T106 property is not know at this time. At T108, there are severalactivities that resulted in contaminated sediment being deposited on site. One smallstorm drain on the south end of T106 once discharged to the small cove on thedownstream side of the Diagonal CSO/SD. However, this pipe has been connecteddirectly to the Diagonal CSO/SD pipe. Current activities that allow pollutants on theground flow to the existing storm drains. At present, any of the runoff collected fromthese two properties are routed through the local drainage system to discharge at one ofthree locations: Nevada St. SD north of Area A, the Diagonal CSO/SD mid Area A, orthe Diagonal Ave. S. SD south of Area B.
9.2 Ground Water
The Port collected ground water samples from the T108 property (old treatment plant)and should include this in the data they provide to EPA and Ecology. Groundwatersamples were collected from 14 wells during October 1991 (dry season) and January1992 (wet season). A discussion of this data was included in the draft 2001 CleanupStudy Report in section 3.2.7 and will be briefly discussed. Depth of ground waterranged from 2m to 4m, but discharge rates were not determined.
No PCBs were detected in 14 groundwater samples (detection limit 0.1 ug/l), but oneduplicate sample had a value of 0.3 ug/l (Aroclor 1248). Because PCBs are not verymobile in groundwater and PCBs were generally undetected in groundwater samples,PCBs in groundwater are not expected to pose a risk to aquatic receptors in the waterway.Diesel fuel and gasoline were measured in nine of the 14 well at concentrations rangingfrom 30 to 490 ug/l. The PAH levels were compared to the Lowest Observed EffectsLevel of 300 ug/l, which resulted in the conclusion that it is unlikely that PAHs pose arisk to aquatic receptors in the waterway. The maximum concentrations of cadmium (38ug/l), copper (200 ug/l), lead (260 ug/l), mercury (0.3 ug/l), nickel 380 ug/l) and zinc

29
(6,200ug/l) measured in groundwater samples exceeded ten times the marine chronicWater Quality Criteria and would need to be diluted 45-fold to meet the criteria. In thecleanup area, mercury is the only metal that exceed the sediment standard, and this tendsto be in deeper water farther from the property or in one area inshore at T108 north of theDiagonal SCO/SD.
Ecology has pointed out that they consider the 1992 well sampling data from T-108 to beolder then they prefer because the data is 10 years old. Ecology would prefer to seenewer well data to verify that conditions still indicate there is no concern for groundwater to be a potential recontamination source to the cleanup site. King County willinvestigate whether the Port of Seattle has collected newer well samples from T-108. Ifnewer well sampling data is available then King County will insure Ecology and EPA geta copy as soon as possible. If only the 1992 well sampling data is available, then KingCounty will work with Ecology, EPA and the Port of Seattle to obtain the datasatisfactory to the regulatory agencies.
9.3. Bank Erosion
Down stream of the Diagonal CSO/SD the river bank is a large rock wall that extendsabout 900 feet down river. This rock wall was installed in the river and then filled behindto create the upland property. A small cove was created immediately downstream of theoutfall and has some sediment, but this does not appear to be erosion from the nearbybanks but possibly sediment from the outfall.
Upstream of the Diagonal CSO/SD most of the bank on the old treatment plant propertyhas been stabilized with large rip rap. An area behind the pier has some exposedintertidal sediment. This sediment was sampled and chemical analysis results showedlow chemical concentrations. The row of sediment samples collected closest to shorenear the old treatment plant property showed low chemical concentrations. There is noindication of contaminated sediment located in the intertidal area, which could producethe kind of recontamination situation that was observed at the Norfolk sediment cleanupproject. It also suggests that bank erosion along this stretch, if occurring, is not providingany significant source of contamination.
10. DREDGING ACTIVITIES AS PCB RECONTAMINATION SOURCE
The greatest threat of PCB recontamination in this section of the river is from potentialdredging activities that disturb and mobilize contaminated sediments. To minimize therisk that the future Duwamish/Diagonal sediment remediation project could berecontaminated from nearby dredging activities, it is important to identify the location ofsediment contamination and the potential dredging projects that could disturb thesesediments
The PCBs present in sediments were introduced by historic sources and subsurfacesediments typically have higher PCB values then surface Current discharge pipes are not

30
a concern for PCB recontamination, because the PCB levels are so low in the discharges.If PCB-contaminated sediments are disturbed, they could be mobilized and thenredeposited on a nearby clean sediment remediation site. The degree of recontaminationwould vary depending on the amount of sediment that is redeposited on the remediationsite and the PCB concentrations in the redeposited sediment. Any dredging activities thatcannot be completed in one dredging season will cause additional sediment disturbance ina following year, thus increasing the time during which potential recontamination couldoccur. Coordination of dredging projects could reduce potential recontamination.
10.1. PCB Recontamination
A chemical hot spot containing high PCB values is located immediately upstream of the4.8-acre cleanup area originally proposed for the Diagonal/Duwamish site. This hot spotwas recognized as a potential source of PCB recontamination to the near-by sedimentcleanup project. A complete description of the PCB recontamination modeling wasincluded in Appendix P of the draft 2001 Cleanup Study Report and a short discussionwas included in Chapter 7 of the report. Also, a two page summary of the modelingresult was written and included in the new Expanded Area document that was preparedfor the responsiveness summary.
The model predicted the highest rate of recontamination will occur if the upstream hotspot is dredged during some future cleanup action. Even without a cleanup project beingconducted at the hot spot, it is predicted that propeller wash and river currents willresuspend some of the high PCB sediment, some of which will settle onto a near-bycleanup project. The Duwamish/Diagonal cleanup project has been expanded to includethe upstream PCB hot spot. The expanded cleanup site eliminates both of these primarysources of potential recontamination and insures that the dredging at the hot spot will notrecontaminate the cleanup in the future.
In 1984, the USACE conducted an emergency dredging action at the chemical hot spotlocation directly off the old treatment plant outfall to remove a shoal that had reduced thenavigation channel depth down to -25 feet instead of the required -30 feet depth. TheUSACE removed one barge load of contaminated sediment to restore the channel depth.Detailed bathymetry from 1994 (Figure 2-4) shows "U" shaped contour lines located nearthe east channel line offshore from the old /Diagonal Ave. S. treatment plant outfall onsurveys from 1992 and 1994 indicating that the USACE dredging extended slightly eastof the east channel line. The source of this rapidly appearing shoal was not investigated atthe time, but the volume of contaminated sediment is too large to be from an accidentalbarge dump. Close inspection of the detailed contour lines (Figure 2-4) shows that the1977 dredging project created a small ridge of sediment on the upstream side of the oldtreatment plant outfall. If part of this narrow ridge of contaminated sediment was unstableand slid off into the channel in 1983, it could have produced the type of shoal that theUSACE had to remove in 1984.
10.2. Future Maintenance Dredging Projects

31
The lower 9.6-km of the Duwamish River is maintained as a navigable waterway by theU.S. Army Corps of Engineers (USACE). In the Study Area the navigation channel isdelineated by straight, parallel lines, generally aligned with the shore. The eastern side ofthe navigation channel is approximately 250 feet from the east bank of the River in thevicinity of the outfalls. The navigation channel is approximately 60 m (200 feet) wideand about 9 m (30 feet) deep (below MLLW; Weston 1993). According to USACEbathymetry, depths in the navigation channel range from 26 to 35 feet (all depthsMLLW). Most of the channel was dredged prior to 1960, but a portion immediatelyupstream of the site was dredged in 1968 (Tetra Tech 1988).
The navigation channel is intended to be maintained at a depth of 30 feet. However, a1997 USACE bottom survey showed that a shoal (about 50 feet wide and more than1,200 feet long) has developed along the east side of the waterway across from KelloggIsland (see Figure 2-4). The northernmost portion of the shoal extends approximately tothe Duwamish/Diagonal outfalls. Eventually, dredging of this area will be required tomaintain the channel.
Cleanup Area B of the expanded Duwamish/Diagonal cleanup project extends into thenavigation channel for 50 feet and will remove this shoal. The length of Cleanup Area Bis about 500 feet so the project will remove 500 feet of the shoal, which is the entiredown stream end of the shoal. The proposed remediation method for portions of thecleanup area located in the channel area or immediately adjacent to the channel is toover-dredge the area so that when the cap is installed, the top of the cap will be 2 feetbelow the navigation depth of minus 32 feet (MLLW). The contractor will dredge thearea in the channel to a depth of minus 35 feet (MLLW) and then cap the area with a 3foot thick layer of clean sand, which will result in the bottom elevation of minus 32 feet(MLLW). The 2 foot over-dredge will insure that any future maintenance dredging in thechannel that is performed by the USACE will not affect the integrity of the containmentcap nor expose contaminated sediments.
11. Slip #1 PCB SPILL AND CLEANUP ACTIONS
In 1974, a major PCB spill occurred at Slip # 1, which is located about 3,300 feet(1,000 meters) upstream of the Duwamish/Diagonal outfalls. About 255 gallons of near-pure PCB (Aroclor 1242) was spilled on September 13, 1974, when an electrictransformer being loaded onto a barge was dropped and broken on the north pier of Slip1. The majority of the PCBs were recovered during two separate dredging actions. In1974, an initial clean-up was attempted using several hand dredges, which recoveredapproximately 80 gallons of PCB. Subsequent sampling determined that the remainingfluid had spread throughout the slip and into the river channel, requiring a seconddredging. Prior to that second project, a “20-year flood” occurred during the winter of1975/1976 and may have contributed to further spreading of contaminated sediments inthe river channel.

32
In 1976, the U.S. Army Corps of Engineers (USACE) conducted a second dredging ofPCBs at the northwest corner of Slip 1 using hydraulic dredging piping the slurryoverland to settling ponds on the Chiyoda Corporation property (former DiagonalAvenue Sewage Treatment Plant property). Two lagoons were excavated along thenorthern edge of the property in the former sewage treatment plant sludge bed areas fortreatment of about 10 million gallons of PCB-contaminated sediment. Most of thecontaminated PCB sediment was deposited in the first receiving lagoon located closest tothe river. The second lagoon received the overflow water from the first lagoon. Waterpumped from the disposal lagoons was filtered through a sand, and charcoal filter toremove suspended particles and PCBs prior to discharge to the Duwamish Waterway.
A report prepared by the USACE in 1978 estimated that the dredging removed another170 gallons of the 255-gallon spill of Aroclor 1242 resulting in a total recovery of about98 percent. Post-spill sediment concentrations of Aroclor 1242 ranged from 0.06 to 2400ppm in the vicinity of the spill. The highest concentrations were at the immediate locationof the spill. Post-dredge (5/4/76) sediment concentrations ranged from 0.03 to 140 ppmAroclor 1242, with the highest concentration at the remediated spill site. PCBconcentrations were also monitored during the cleanup operation and meanconcentrations were within the normal observed ranges. The report concluded that basedon these monitoring results, the spill did not contribute a significant PCB loading to theDuwamish River. However, sediment samples taken by EPA in 1998 showed measurablelevels of PCBs remain in the sediment in the dredged channel both upstream and downstream of Slip 1 (Weston 1999). The sediments that were dredged in 1974 and 1976contained other PCB Aroclors in addition to Aroclor 1242, which brings up thepossibility that both these dredging projects to remove the Aroclor 1242 could havespread sediments with other Aroclors into the navigation channel.
12. INSTITUTIONAL CONTROLS NEEDED TO PROTECT CAP
Institutional controls are restrictions that are applied to the property to limit the type ofactivity that can be conducted on the property. Specific institutional controls will neededto be established to protect the integrity of the Duwamish/Diagonal sediment cap and willserve as a restrictive covenant for the property. The Port of Seattle owns and managesthe river bottom where the cleanup project will be conducted. Consequently, the Port ofSeattle will be the authority that must agree to institutional controls and also enforce theinstitutional controls.
Institutional controls are established to prevent various activities that could cause damageto the cap, which could then result in the release of the underlying contaminatedsediment. Examples of activities that could cause damage to the cap are dredging,anchoring, installing pilings and other construction activities. Some activities may beprohibited completely, and other activities may be allowed with proper precautions andrestrictions. For example, anchoring of large vessels with large anchors would beprohibited to prevent large anchors from digging holes in the cap. However, use of smallanchors for Tribal fishing nets would be allowed. The instillation of permanent anchor

33
points is one method that has been used to minimize the impact of anchoring on reefs.Any proposals for major activities like piling installation, in-water construction, anddredging would be evaluated with the understanding that the sediment cap must not becompromised.
When a capping remedy is used for a Superfund sediment cleanup project, EPA requiresthe landowner to sign a legal agreement with EPA. The agreement provides legalassurance from the landowner that the cap would not be disturbed, or if futuredevelopment plans did call for disturbance of the cleanup area, the landowner wouldcoordinate with EPA to ensure that the contaminated materials would be addressed in aprotective manner. This agreement generally takes the form of a Consent Decree withEPA.
The Duwamish/Diagonal cleanup project is not a Superfund project, but is proceedingunder the SMS process with Ecology as the lead agency. Consequently, during the Portapproval process, King County will request that the Port provide written agreement toEPA and Ecology that the Port will adhere to all institutional controls established for theDuwamish/Diagonal site. King County will request that the Port execute a restrictivecovenant that is enforceable by both EPA and Ecology.
13. MONITORING OF CAPPING PROJECT
Appendix Q of the draft 2001 Cleanup Study Report contains a preliminary draft of aConstruction and Post-Construction Monitoring Plan for cleanup Area A. This draftmonitoring plan extends over a period of 10 years and will be expanded to includedcleanup Area B. It is envisioned that the monitoring plan will be updated and revisedfollowing final design and permitting. The hydraulic permit issued by the WashingtonState Department of Fish and Wildlife typically requires a formal monitoring plan toapprove sediment cleanup projects (required for 1999 EBDRP Norfolk CSO/SD cleanupproject).
Environmental monitoring for the Duwamish/Diagonal cleanup project involves bothshort-term and long-term activities. Various short-term monitoring activities are neededto facilitate dredging activities and the placement of capping material according to planspecifications. There are two long-term monitoring activities, which focus ondocumenting stability of the sediment cap and also determining the amount of chemicalrecontamination that occurs on the surface of the cap. The strategy for long-termmonitoring is to conduct sampling more frequently during the early years after cappingand then to reduce the frequency of sampling over time. The long-term activities arepatterned after the 10 year monitoring plan being carried out at another EBDRP sedimentcapping project called the Pier 53-55 capping project, which was constructed in ElliottBay during 1992.
There are seven main objectives associated with the monitoring plan and these objectivesapply to both cleanup Areas A and B. Each objective is listed below along with a
34
summary of the main activities included in the monitoring program to achieve theseobjectives (see Appendix Q for additional information). The first four objectives pertainto short-term monitoring activities, while the last 3 objectives pertain to long-termmonitoring.
13.1. Short-Term Construction Monitoring
Monitoring Objective # 1 is to ensure that water quality guidelines are met duringdredging, and transport of contaminated sediment from the dredging barge to therail/truck loading area. Most of the chemical pollutants in the sediments to be dredgedstay attached to the sediment particles and do not become soluble in river water. Prior tofield dredging operation, the existing chemistry data from the site assessment atDuwamish/Diagonal will be used to calculate a TCLP (Toxic Characteristic LeachingProcedure) prescreening to see if chemical levels in sediments are predicted to be apotential problem for leaching. If chemicals exceed the TCLP prescreening, thenadditional sediment sampling will be performed during the design phase to directlymeasure the potential for contaminants to leach from the sediment during dewatering onthe barge and whether this would pose any adverse impact to the receiving waters.
Turbidity is another water quality parameter that has established standards, but thisparameter is not always measured. Turbidity monitoring of the water column is notcurrently proposed during dredging operations, but could be included if required bypermitting agencies. There are three main reasons for not recommending turbiditymonitoring: 1) Dredging will occur during the winter flood season when there is typicallyhigh river flow and high turbidity; 2) The winter dredging window has been establishedfor regulatory purposes because during this time of year there is minimal use of the riverby important salmonid species; 3) Dredging at the Duwamish/Diagonal site represents arelatively small volume of material compared to maintenance dredging projects. As inpast sediment cleanup projects, the contractor will be required to conduct the dredgingoperations at the Duwamish/Diagonal site with care to minimize the amount of turbidityproduced. If water column sampling were required during dredging operations, KingCounty Environmental Laboratory (KCEL) staff would collect the turbidity data usingPSEP recommended guidelines (PSEP 1996).
Monitoring Objective # 2 is to insure that the dredging and capping constructions areperformed according to plan specification. The dredging depths and capping elevationswill be monitored to document that the construction of the cap adheres to thespecifications in the dredge and cap plan. Accurate measurements of the dredging depthsand capping depths are required because the payment schedule for the constructioncontractor is based on the calculated volume of material dredged and the calculatedvolume of capping material placed on the site. Detailed bottom depth surveys will beconducted prior to dredging, after dredging is completed, and after the capping materialhas been placed. If surveys detect deviations from either the dredging or capping plan, thecontractor will be required to make corrections, which will be verified by conductingadditional bottom depth surveys.
35
Monitoring Objective # 3 is to verify that the dredged material is below the PCBdangerous waste level (50 ppm) and will be acceptable for landfill disposal. For thoseareas of the cleanup Area A and B that are anticipated to contain the highest PCB values,a few composite samples of the dredged material will be collected from the haul bargeand analyzed over night to determine the PCB concentration. Previous sampling at theDuwamish/Diagonal site has shown that in cleanup Area A all samples were well belowthe PCB dangerous waste value of 50 ppm, which means that all dredged sediment isanticipated to be acceptable for disposal at an approved landfill. In cleanup Area B oneof the 3 surface samples from the hot spot had a value of 85 ppm (station DUD 027),which is over the dangerous waste value of 50 ppm. A core sample collected from thissame station contained a value of 9 ppm in the 0-3 foot section with the highest value of23 ppm in the 3-6 foot section. This data showed that even though the surface grabexceeded the dangerous waste value of 50 ppm, the core samples were substantiallybelow the standard. The composite sample will be collected from the barge of dredgedsediment and analyzed over night. If the composite sample of dredged sediment showsPCBs at a value of 45 ppm or greater, then the disposal contractor will be notified and theassociated batch of dredge material will be directed to a landfill approved to takehazardous waste.
Monitoring Objective # 4 is to make sure that the capping backfill material is clean priorto placement. The chemical quality of the capping backfill material will be determinedbase on collecting and analyzing one composite sample of the capping backfill materialprior to placement of the capping material. If this capping material is obtained frommaintenance dredging at the head of navigation channel in the Duwamish River, thesediment chemistry quality data routinely produced by the U.S. Army Corps of Engineersfor open water disposal will be compared to the SMS as a preliminary screening.Confirmatory testing of maintenance dredge material will be performed on the first loadof dredge material while it is on the barge. Staff from King County environmentallaboratory will collect and analyze the composite sample to represent sediment quality ofthe entire barge load. If capping material is purchased from a supplier, one compositesample will be collected and analyzed prior to acceptance and placement of the material.
13.2. Long-Term Monitoring
Monitoring Objective #5 is to document cap stability for isolating contaminants overtime. Checking for sediment erosion using one of two methods will monitor stability ofthe cap material. The preferred method for measuring erosion is to use a grid of fixedmeasuring stakes that extent through the cap and also extend above the cap to allowmeasurement. However, concern has been raised that the fixed stakes would become anobstruction for Tribal gill net fishing activities conducted in this area of the river. Effortswill be made to design a flexible stake (similar to a bicycle flagpole) that would not snaggill nets and would be approved by the tribe. A grid of 13 stakes was proposed for AreaA, but a grid pattern has not yet been proposed for Area B.
The alternate approach that could be used to measure cap erosion is to conduct detailedbottom depth surveys each monitoring year similar to the detailed bottom survey that was

36
conducted at the end of cap construction to verify the cap surface elevations. Survey datafrom each year would be used as input to a computer program designed to calculate thebottom elevations of the cap surface. If bottom depth increased then erosion would beindicated and would be evaluated by taking sediment cores. If cores confirmed erosion,then meetings would be held with regulatory agencies to determine the cause andrequired solution.
Monitoring Objective # 6 is to document future recontamination of the cleanup Area Afrom continuing point source discharges from the Diagonal CSO/SD outfall (primarilythe 1,230 MGY of separated storm water). Accumulation of surface sedimentcontamination on the Duwamish/Diagonal sediment cap will be evaluated by collectingand analyzing grab samples from five stations. These stations are in a "V" pattern withthe point towards the outfall.
Monitoring Objective # 7 is to document whether PCB contamination located on adjacentproperty migrates onto the cap. Now that the cleanup project has been expanded toremove the PCB hot spot there should be minimal PCB recontamination fromsurrounding areas. Two or three surface grab stations would be placed on cleanup AreaB to document any potential PCB recontamination to the cleanup area.
Staff from King County environmental laboratory will collect all surface samples using asmall vessel outfitted with a crane and Van Veen grab sampler. All samples will becollected, handled, and processed in accordance with previous Duwamish/DiagonalSampling and Analysis Plans/Addenda (EBDRP 1994, 1995). At each station aminimum of three grab samples will be composited and homogenized for laboratoryanalysis. A stainless steel spoon will be used to collect the top 10 centimeters ofsediment from three replicate grab samples per station. Each 0-10 cm composite samplewill be analyzed for SMS chemicals and associated parameters such as total organiccarbon, total solids, and particle size distribution.
The cap will be sampled within 3 months after cap placement to document baselinesurface sediment conditions. Surface sediment stations will be sampled each year for thefirst 5 years following cap placement. However, the frequency of sampling events to becarried out during the second 5 years of the 10-year monitoring will be determined basedon the rate of recontamination during the first 5 years. If recontamination appears to bestabilized, then sampling may be reduced to alternating years or longer between samplingevents. A project monitoring review meeting will be held after 5 years to decide futuremonitoring frequency. Chemistry data for each station will be reported in dry weightvalues to show trends in chemical levels each year and will also be normalized to organiccarbon where appropriate for comparison to SMS criteria values.
Modifications may be required to the monitoring plan before it is finalized. During thepermitting process and public review for the project, regulatory agencies or affectedparties may request additional monitoring. Even after the annual monitoring program isunderway, revisions may be needed to the monitoring plan to respond to the resultsobtained. For example, if chemical levels in surface sediments eventually reach the CSL

37
value for phthalates, then the monitoring program will be expanded to include bioassaytesting methods outlined in the sediment management standards, which will showwhether biological toxicity occurs at the numeric CSL value.


PORT O
F SEATTLE
PORT O
F SEATTLE
TERMINAL 108
BIRMING
HAM STEEL
CITY OF SEATTLE Diagonal Ave. South
SD Outfall
Diagonal Way SD/CSO Outfall
Duwamish CSO Outfall
Former Diagonal Ave.Treatment Plant Outfall
Flow DirectionNavagation Channel
ProposedCleanup Area
(210,040.8 sq ft)
DUD008
DUD009
DUD019
DUD024
DUD007
DUD022
DUD026
DUD035
DUD002
DUD003DUD028
DUD004
DUD013DUD015
DUD017
DUD030
DUD032
DUD034
DUD032
DUD012
DUD016
DUD018
DUD029
DUD023
DUD025
DUD031
DUD033
DUD001
DUD010
DUD011
DUD014
DUD006
DUD043
DUD044
DUD045
DUD032DUD032
DUD038
DUD039
DUD040
DUD027
DUD036DUD041
DUD254
DUD261
DUD206DUD207
DUD208DUD209
DUD200
DUD201
DUD202
DUD203
DUD204
DUD205
DUD206
DR039
DR041
DR044
DR069
DR070
DR006
DR007
DR037
DR059
DR068
DR080
DR058
DR081
DR082
DR038
DR010
DR044
DR068
DUD005
DUD042
DR005
DR009
DUD020
Siphon
SQS
CSL
CSL
SQS
CSL
CSL
SQS
DUD008
5/9/
02D
WD
-000
0860
1-19
.dw
gcv
d
Duwamish/Diagonal Sediment Remediation Project
Composite SQS/CSL Exceedance AreasFigure 5-9EcoChem Team
0 200
Scale in Feet
Composite SQS/CSL Exceedances
< SQS>SQS/<CSL>CSL
Legend
Pier
Sample StationsBioassay Stations
Extent of Contour LimitsRemediation Area Boundary

MemoTo: Pat Romberg
From: Zhong Ji
cc: Bob Swamer
Date: 10/01/97
Re: Stormwater Discharge From Duwamish Diagonal Storm Drain
The attached map shows the catchment basins for both Hanford and Diagonal Avenue Storm drains.The stormwater from the yellow colored basins is through Hanford tunnel. The total basin area for theyellow colored area is 1573 acres. The green area is the natural drainage basin to the DiagonalAvenue storm drain. The total area for the green colored basins is 1012 acres.
The annual stormwater volume from Hanford and Diagonal Avenue drainage areas is 1230 milliongallons based on the 1978 to 1986, 1994 to 1996 water-year runoff model simulation.
D:\Projects\Ouwamish\summary\Memo1.doc

/
•••••••••••II.IIIIIII111\
IIIII
King CountyCombined Sewer Overflow
Water Quality Assessment for theDuwamish River and Elliott Bay
Appendices
Prepared by the
Duwamish River and Elliott BayWater Quality Assessment Team
Dr;aft July 21, 1998

,4.,),£014
Table C-l. Sediment Sample Petroleum Hydrocarbon and Metals Analytical Results
ZOdZ. PlP£Diagonal Storm Drain Cleaning Preparation
~($1)1 MGJJ'r Seattle Public UtilitiesJanuarylFebruary 2002
Sediment MTCA Method A Sample Designation )';)l1.pi ,'ut toQuality Soil Cleanup Levels
Standards for Unrestricted DS-Mout-SS DS-Ml-SS DS-M2a-SS DS-M2-SS DS-M3-SS DS-M4·SS DS-M5-SS DS-T2-SS DS·T2b-SS DS-T3a-DS 1b-SS DS-T6b-SS DS-T8b-SS
Constituent (ml!/kl!) Uses (lOg/kg) Concentration (lOg/kg)
Gasoline _.. 100 NA ND (25) ND (24) ND (25) ND (24) ND (24) ND (22) ND (24) ND (320) ND (470) ND (290) ND (270)Diesel Fuel --- 2,000 NA 77 69 63 82 37 ND (28) ND (30)
680 ~5 ••ND (180) ND,(_.
Heavy Oil 2,000 NA 420 430 560 420 360 470 150{i'.:"~~ --- _' ". ~':l ----.:
~[(arQ[O.--- ;~~~\lZU~i~ ,Q .. ~_D.
Arsenic 57 20 ND (14) ND (12) ND (12) ND (13) ND (12) ND(12) ND (11) ND (12) ND (16) ND (23) ND (14) ND (13)Barium --- --- 30 19 21 72 24 16 32 99 82 99 110 66Cadmium 5.1 2 0.91 0.86 0.89 0.85 0.92 ND (0.59) ND (0.56) ND (0.60) 1.1 ?l;if]!tt!~Illa~~)t~" 1.3 1.3Chromium 260 2,000 (Cr III) 21 29 23 39 23 13 28 25 51 60 37 22Copper 390 --- 38 39 33 43 34 24 160 30 81 280 94 56Lead 450 250 130 37 33 140 18 47 23 16 130 200 100 120Mercury 0.41 2 ND (0.34) ND (0.31) ND (0.30) ND (0.31) ND (0.30) ND (0.29) ND (0.28) ND (0.30) ND (0.40) ND (0.58) ND (0.36) ND (0.33)Selenium - --- ND (14) ND (12) ND(12) ND (13) ND (12) ND (12) ND(Il) ND (12) ND (16) ND (23) ND (14) ND (13)Silver 6.1 --- 0.80 ND (0.62) ND(0.61) . ND (0.63) ND (0.60) ND (0.59) ND (0.56) ND (0.60) ND (0.79) 0.79 ND (0.72) ND (0.67)zmc 41U --- 220 250 200 240 170 280 130 85 230 '~l~~~~l!iJj 851lH r~~(iD.\\:"·'- :._..... .r; - ,'" ~: ~," ?!~v:d.
Notes: ND =Not Detected at the Practical Quantitation Limit; the PQL is shown in parentheses.
NA =Not Analyzed.Marine Sediment Quality Standards - Chemical Criteria (WAC 173-204-320).MTCA Method A Soil Cleanup Levels for Unrestricted Uses (WAC 173-340-740). \
Shaded values indicate concentration greater than standards or cleanup level.

.. .. ...- - - !"..•... ,. - - - •
laDle \--~. ,)emment ,)ample ,)emlvolaUie vrgamc \-ompouna ana rOlycmonnau:a l:llpnenyls Analytical KesullS ~rage .. o:~)
Zt!){) 2- P,Pe S6P/MfZNTDiagonal Storm Drain Cleaning Preparation
Seattle Public UtilitiesJanuarv/Februarv2002
Sample Designation
Marine DS-I2-SS DS-T2b-SS DS-T3a-DSlb-SS DS-I6b-SS DS-I8b-SSSedimentQuality Result Result Result Result Result Result Result Result Result Result
Compound Standard Units (ug/kg) Q (mg/kgOC) (ug/kg) Q (mg/kg OC) (ug/kg) Q (mg/kgOC) (ug/kg) Q (mg/kg OC) (ug/kg) Q (mg/kgOC)
PAH 370 mlk OC 54 10 470 18 910 12 790 14 490 25aphthalene 99 m k OC 20 U 4 110 U 4 290 U 4 230 U 4 98 U 5cenaphthylene 66 m k OC 20 U 4 110 U 4 290 U 4 230 U 4 98 U 5cenaphthene 16 m k OC 20 U 4 110 U 4 290 U 4 230 U 4 98 U 5luorene 23 m k OC 20 U 4 110 U 4 290 U 4 230 U 4 98 U 5henanthrene 100 m /k OC 54 10 470 18 910 12 790 14 490 25nthracene 220 m Ik OC 20 U 4 110 U 4 290 U 4 230 U 4 98 U 5
-Methylnaphthalene 38 m k OC 20 U 4 110 U 4 290 U 4 230 U 4 98 U 5IPAH 960 m k OC 408 76 4810 182 7530 103 5870 103 4840 244luoranthene 160 m~ kgOC 74 14 1300 49 1400 19 1600 28 1200 61
'vrene 1000 m~ kgOC 71 13 810 31 1400 19 980 17 680 34Benzo(a)anthracene 110 m~IkgOC 31 6 300 11 530 M 7 490 9 400 20
hrvsene 110 m~ kgOC 54 10 590 22 880 12 810 14 590 30Benzo(b)fluoranthene 230 me,IkgOC 41 8 630 M 24 1000 14 780 M 14 570 M 29Benzo(k)fluoranthene 230 mg, kgOC 56 10 410 16 840 11 660 M 12 630 32Benzo(a)ovrene 99 m~ kgOC 37 7 410 16 670 9 550 10 470 24[ndeno [ 2 3 cod lovrene 34 m kgOC 23 4 170 6 370 5 230 U 4 150 8Dibenzo(a h)anthracene 12 m k OC 20 U 4 [10 U 4 290 U 4 230 U 4 98 U 5Benzol l!.h iloervlene 31 m k OC 21 4 190 M 7 440 6 230 U 4 150 M 8Total Benzofluoranthenes 230 m k OC 97 18 1040 39 1840, 25 1440 25 1200 61I 2-Dichlorobenzene 23 m OC 20 U 3.7 1[0 U 4,2 290 U 4.0 230 U 4,0 98 U 4,91 4-Dichlorobenzene 3,1 m k OC 20 U 3.7 110 U 4.2 290 U 4.0 230 U 4.0 98 U 4,9[ 2 4-Trichlorobenzene 0.81 mg,IkgOC 20 U 3,7 110 U 4.17 290 U 4,0 230 U 4.0 98 U 4,9Hexachlorobenzene 038 mg, kl!OC 20 U 3,7 110 U 4.17 290 U 4.0 230 U 4.0 98 U 4,9Dimethyl Phthalate 53 m k OC 140 26 110 U 4 290 U 4 230 U 4 98 U 5Diethyl Phthalate 61 m k OC 20 U 4 110 U 4 290 U 4 230 U 4 98 U 5Di-n-butvl Phthalate 220 m k OC 20 U 4 110 U 4 290 U 4 230 U 4 98 U 5Butvl Benzyl Phthalate 4.9 m /k OC 23 4.3 110 U 4,2 600 M ;{':1~~'ai8121i?~ jt~~ 900 M_'1'5i~ 100 )~~~5i\llW...f;.1l
Bis(2-ethylhexyl)phthalate 47 m Ik. OC 230 43 3800 bMftt*1~4~'IY1~; 8900 f!~'.?;£1~T'~~:\;4t$ 5300 r~3~~ 5500 ;~'tit;jlZ:Z8il::.
Di-n-octvl Phthalate 58 m k OC 20 U 4 230 9 690 9 780 14 700 35Dibenzofuran 15 m k OC 20 U 4 110 U 4 290 U 4 230 U 4 98 U 5Hexachlorobutadiene 3,9 m/k OC 39 U 7.3 230 U 8.7 290 U 4,0 470 U 8.2 200 U 10.1
-nitrosodiphenylamine 11 m k OC 20 U 4 110 U 4 290 U 4 230 U 4 98 U 5roelor 1016 12 m k OC 60 U 11 79 U 3 120 U 2 72 U I 67 U 3roelor 1221 12 m k OC 60 U II 79 U 3 120 U 2 72 U I 67 U 3roelor 1232 12 m k OC 60 U 11 79 U 3 120 U 2 72 U 1 67 U 3roelor 1242 12 m k OC 60 U 11 79 U 3 120 U 2 72 U 1 67 U 3roelor 1248 12 m~ kgOC 60 U 11 79 U 3 120 U 2 370 6.5 67 U 3roelor 1254 12 m~ kgOC 60 U 11 620 ~'23i5,sJfJll 220 3.0 72 U 1 67 U 3roelor 1260 12 me, kgOC 60 U II 320 iiN~l'2\'lIi'lBJ 160 2.2 110 1.9 67 U 3otal PCBs 12 mg, kl!OC 60 U 11 940 :1!~~5:6lJ"'!f,!j! 380 5.2 480 8.4 67 U 3
Phenol 420 UE:kg 39 U --- 230 U --- 570 U --- 470 U --- 200 U ----Methyjphenol 63 UI1. k 20 U --- 230 U --- 290 U --- 230 U --- 98 U ----MethyJphenol 670 ul1.k 20 U --- 230 U --- 290 U --- 230 U --- 98 U ---4-Dimethy1phenol 29 ugk 59 U --- 340 U --- 860 U --- 700 U --- 290 U ---entachloroohenol 360 ugk 98 U --- 570 U --- 1400 U --- 1200 U --- 490 U ---enzy1 Alcohol 57 U~g 98 U --- 570 U --- 1400 U --- 1200 U --- 490 U ---
Benzoic Acid 650 U~g 200 U --- 1100 U --- 2900 U --- 2300 U --- 980 U ---otal Organic Carbon -- mg/kg 5350 --- 26400 --- 73300 --- 57000 --- 19800 ---

.................. t._ • •#
•• ~ ... ~.II ~II.• " •laDle L-j. :;eOlment :;ampJe :;emlvolatlle urgamc Lompouna ana YOJycmonnatea tllpnenyls An8JytlcaJ l<.esUlts ~Yage I 01 j)
Z.OO Z f,PE s e 0 M Diagonal Stonn Drain Cleaning PreparationI .e I-IT Seattle Public Utilities
JanuarvlFebruarv 2002
Sample DesignationMarine DS-M1-SS DS·M2a-SS DS-M2-SS DS-M3-SS DS-M4-SS DS-M5-SS
SedimentQuality Result Result Result Result Result Result Result Result Result Result Result Result
Compound Standard Units (ug/kg) Q (mg/kg OC) (ug/kg) Q (mg/kg OC) (ug/kg) Q (mg/kgOC) (ug/kg) Q (mg/kgOC) (ug/kg) Q (mg/kgOC) (ug/kg) Q (mg/kg OC)
LPAH 370 m~kgOC 993 262 449 78 843 157 79 U 15 78 U 20 77 U 12aphthalene 99 m~ kgOC 78 U 21 78 U 13 79 U 15 79 U 15 78 U 20 77 U 12cenaphthv1ene 66 m~ kgOC 78 U 21 78 U 13 79 U 15 79 U 15 78 U 20 77 U 12cenaohthene 16 mg, kgOC 91 24 78 U 13 79 U 15 79 U 15 78 U 20 77 U 12luorene 23 mg hOC 92 24 78 U 13 79 U 15 79 U 15 78 U 20 77 U 12
Phenanthrene 100 mg kgOC 660 fl1i1~fmji~ 360 62 760 ~1'42tW~ 79 U 15 78 U 20 77 U 12nthracene 220 mg kgOC 150 40 89 15 83 15 79 U 15 78 U 20 77 U 12
·Methvlnaohthalene 38 mg kgOC 78 U 21 78 U 13 79 U 15 79 U 15 78 U 20 77 U 12IPAH 960 mg kgOC 3460 913 10190 l1i't~(i~& 3680 685 578 107 78 U 20 549 87luoranthene 160 mg k OC 820 _W'll~ 900 156 920 ~~lg4~'i(i 150 28 78 U 20 130 21
>yrene 1000 mg OC 630 166 810
•750 140 160 30 78 U 20 130 21
enzo{aJanthracene 110 m OC 340 90 770 270 50 79 U 15 78 U 20 77 U 12hrysene 110 m OC 380 100 1100 :l9.0 410 76 100 19 78 U 20 94 15
Benzo blfluoranthene 230 m k OC 300 79 1500 ' ii6 . 350 65 82 15 78 U 20 110 18Benzo kJfluoranthene 230 m 'k, OC 360 95 1300 225 370 69 86 16 78 U 20 85 14Benzo alovrene 99 m kgOC 330 87 1700 1~ii!2!m~1 320 60 79 U 15 78 U 20 77 U 12ndeno 1 2 3 c-dlovrene 34 mg kgOC 160 1000
j••~160 30 79 U 15 78 U 20 77 U 12
Dibenzo(a hlanthracene 12 mg kgOC 78 U 21 210 79 U 15 79 U 15 78 U 20 77 U 12Benzo(g.h iloerv1ene 31 mg kgOC 140 ~ : 900 ',. 1 . 130 24 79 U 15 78 U 20 77 U 12
otal Beilzofluoranthenes 230 me: kgOC 660 174 2800~8lf_
720 134 168 31 78 U 20 195 311 2-Dichlorobenzene 2.3 me: hOC 78 U 20.6 78 U 13.5 79 U 14.7 79 U 14.7 78 U 20.4 77 U 12.31 4-Dichlorobenzene 3.1 me: kgOC 78 U 20.6 78 U 13.5 79 U 14.7 79 U 14.7 78 U 20.4 77 U 12.3I 2 4-Trichlorobenzene 0.81 me: kgOC 78 U 20.6 78 U 13.5 79 U 14.7 79 U 14.7 78 U 20.4 77 U 12.3Hexachlorobenzene 0.38 me: kgOC 78 U 20.6 78 U 13.5 79 U 14.7 79 U 14.7 78 U 20.4 77 U 12.3Dimethvl Phthalate 53 me: 'kg OC 78 U 21 78 U 13 79 U 15 79 U 15 78 U 20 77 U 12Diethvl Phthalate 61 me: hOC 78 U 21 78 U 13 79 U 15 79 U 15 78 U 20 77 U 12Di-n·butvl Phthalate 220 me: kgOC 78 U 21 78 U 13 79 U 15 79 U 15 78 U 20 77 U 12ButvI BenzvI Phthalate 4.9 mg kgOC 78 U 20.6 78 U 13.5 79 U 14.7 79 U 14.7 78 U 20.4 77 U 12.3Bis(2-ethvlhexvlJphthalate 47 mg kgOC 1000 1~(i:4l!tM1 5100 ~882&~ 860 ~l'6QIit),tj~ 670 1~12~ 330 ,:l$r~8~~'i£;( 710 ~;y,tla~~
Di-n-octvl Phthalate 58 mg kgOC 78 U 21 120 21 79 U 15 130 24 78 U 20 77 U 12Dibenzofuran 15 mg kgOC 78 U 21 78 U 13 79 U 15 79 U 15 78 U 20 n U 12Hexachlorobutadiene 3.9 mg kgOC 160 U 42.2 160 U 27.7 160 U 29.8 160 U 29.7 160 U 4\.8 150 U 23.9
-nitrosodiphenylamine 11 m 'k OC 78 U 21 78 U 13 79 U 15 79 U 15 78 U 20 77 U 12rodor 1016 12 m 'k OC 62 U 16 61 U 11 63 U 12 60 U 11 59 U 15 56 U 9rodor 1221 12 m k OC 62 U 16 61 U II 63 U 12 60 U 11 59 U 15 56 U 9rodor 1232 12 m Ik OC 62 U 16 61 U II 63 U 12 60 U II 59 U 15 56 U 9rodor 1242 12 m k OC 62 U 16 61 U 11 63 U 12 60 U 11 59 U 15 56 U 9rodor 1248 12 m Ik OC 62 U 16 61 U 11 63 U 12 60 U 11 59 U 15 56 U 9rodor 1254 12 m k OC 62 U 16 61 U 11 63 U 12 60 U 11 59 U 15 56 U 9roclor 1260 12 m k OC 62 U 16 61 U 11 63 U 12 60 U II 59 U 15 56 U 9otal PCBs 12 mg,'k OC 62 U 16 61 U 11 63 U 12 60 U 11 59 U 15 56 U 9henol 420 Ul!J kg 160 U -- 160 U --- 160 U --- 160 U -- 160 U --- 150 U ----Methylphenol 63 ue:.kg 78 U --- 78 U --- 79 U --- 79 U --- 78 U ._- 77 U ----Methylphenol 670 ue:. kg 78 U --- 78 U --- 180 --- 79 U --- 78 U --- 77 U ._-4-Dimethylphenol 29 ug,'kg 230 U --- 230 U --- 240 U --- 240 U ._- 230 U --- 240 U ---
Pentachlorophenol 360 ug,'kg 390 U --- 390 U -_. 400 U --- 390 U --- 390 U _.- 390 U ---Benzyl Alcohol 57 uglkg 390 U --- 390 U -_. 400 U --- 390 U --- 390 U -_. 390 U ---Benzoic Acid 650 uglkg 780 U --- 780 U --- 790 U --- 790 U --- 780 U --- 770 U ---
otal OrganIc Carbon -- mg/kg 3790 --- 5780 --- 5370 --- 5380 --- 3830 ._- 6280 ---

TABLE 2. SVOC ANALYSIS SUMMARY OF CONSTITUENTSEXCEEDING CRITERIA BY SAMPLE LOCATION
DIAGONAL STORM DRAIN CLEANING PREPARATION
MTCA Method A Soil Cleanup bl;:f\l;: rh"n'lil',,1 rritpri"..... _·--r-- - --- -- - Levels tor unresmctea uses
DS-M1-SS cPAHsc- 1.87 mg/kg, Phenanthrene - 174 mg/kg OC,
Benzo(a)pyrene 0.330 mg/kg Fluoranthene - 216 mg/kg OC,Indeno( 1,2,3-cd)pyrene - 42 mg/kg OC,Benzo(g,h,i)perylene - 37 mg/kg,bis(2-ethylhexyl)phthalate - 264 mg/kg OC
DS-M2-SS cPAHs - 1.88 mg/kg Phenanthrene - 142 mg/kg OC,Benzo(a)pyrene - 0.320 mg/kg Fluoranthene -171 mg/kg OC,
bis(2-ethylhexyl)phthalate - 160 mg/kg OCDS-M2a-SS cPAHs -7.58 mg/kg HPAH - 1763 mg/kg OC,
Benzo(a)pyrene - 1.7 mg/kg Benzo(a)anthracene - 133 mg/kg OCChrysene - 190 mg/kg OCBenzo(b)fluoranthene - 260 mg/kg OCTotal benzofluoranthenes - 484 mg/kg OCBenzo(a)pyrene - 294 mg/kg OC,lndeno( I,2,3-cd)pyrene - 173 mg/kg OC,Dibenzo(a,h)anthracene - 36 mg/kg OCBenzo(g,h,i)perylene - 156 mg/kg,bis(2-ethylhexyl)phthalate - 882 mg/kg OC
DS-M3-SS cPAHs - 0.268 mg/kg bis(2-ethylhexyl)phthalate - 125 mg/kg OCDS-M4-SS None bis(2-ethylhexyl)phthalate - 86 mglkg OCDS-M5-SS cPAHs - 0.289 mg/kg bis(2-ethylhexyl)phthalate - 113 mg/k.g OCDS-T2-SS cPAHs - 0.242 mg/kg ---DS-T2b-SS cPAHs - 2.51 mg/kg bis(2-ethylhexyl)phthalate - 144 mg/kg OC
Benzo(a)pyrene - 0.410 mg/kg +I) -1-6-.( pc B s -:- :3 s. , .... 4\ lleo. 0<:,.DS-T3a-OS Ib- cPAHs - 4.29 mg/kg Butylbenzylphthalate - 8.2 mg/kg OCSS Benzo(a)pyrene - 0.670 mg/kg bis(2-ethylhexyl)phthalate - 121 mg/kg OCDS-T6b-SS cPAHs - 3.29 mg/kg Butylbenzylphthalate - 15.8 mg/kg OC
~, ,
-- -- - 1\ ~~f\ _.-n.. .- l.;r(") ~th"lh..v"l\nhth,,1<.tp _ Q~ mo-Iko- or:DS-T8b-SS IcPAHs - 2.81 mg/kg IButylbenzylphthalate - ~.l mgrKg vc
Benzo(a)pyrene - 0.470 mg/kg bis(2-ethvlhexvl)phthalate - 278 mg/kg OC
Notes: mg/kg = milligram per kilogram; mg/kg OC = milligrams per kilogram normalized to organiccarbon.
a Model Toxics Control Act Method A Cleanup Levels for Unrestricted Uses (WAC 173-360-740).
b Sediment Management Standards Marine Sediment Quality Standards - Chemical Criteria (WAC-173204-320)
C PAHs = carcinogenic polycyclic aromatic hydrocarbons

Approximate Basin Boundary
N
t\o
Pipe Diameter (inches)
Diagonal Drain Mainline
Diagonal Drain Tributary
Manhole
Tetra Tech, Inc.6100 - 219th Street SouthwestSuite 550Mountlake Terrace, Washington 98043
•
& Sample Location
144
Legend
Seattle Public Utilities
Diagonal Drain
Figure A-1Storm Drain SedimentSampling Locations
S
S IlIWlfORI)
i:i:\-L.!lLA'----~=;;;i=;;j•i I';
OJ> -f S IlIWlfORI)"L_
" "
SClBEGONBT
S QiARI fSTCWJN:SJ
..>
iS~-- -ii..SOAKOTAST __---'---__
T·1D-ALT
SHORIOIIS1
S HINDS S1
OJ
J
tJ'~&""T=_U=S=1===,
-.SNEYADAST _
I
J
I
I
I
I
I
I
I
J
J
I
I
I
ApPENDIX L
BIBLIOGRAPHY OF DATA REPORTS ANDQUALITY ASSURANCE REVIEWS
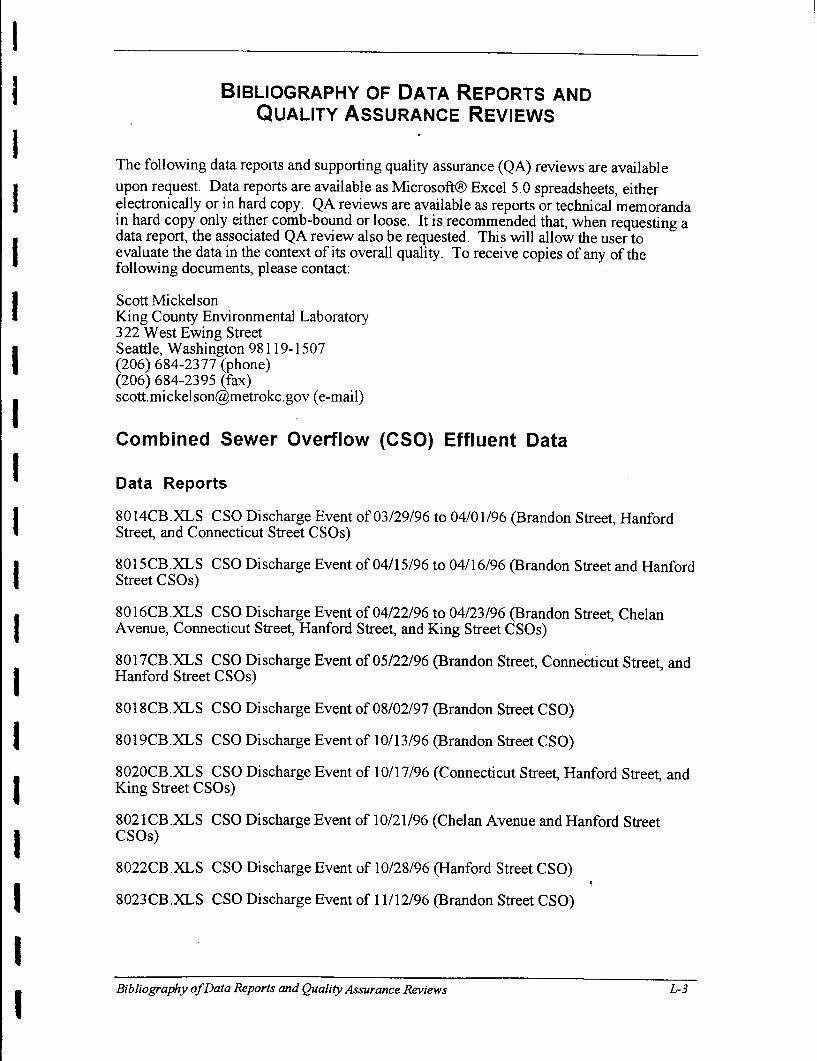
Combined Sewer Overflow (CSO) Effluent Data
BIBLIOGRAPHY OF DATA REPORTS ANDQUALITY ASSURANCE REVIEWS
Scott MickelsonKing County Environmental Laboratory322 West Ewing StreetSeattle, Washington 98119-1507(206) 684-2377 (phone)(206) 684-2395 (fax)[email protected] (e-mail)
The following data reports and supporting quality assurance (QA) reviews are available
upon request. Data reports are available as Microsoft® Excel 5.0 spreadsheets, eitherelectronically or in hard copy. QA reviews are available as reports or technical memorandain hard copy only either comb-bound or loose. It is recommended that, when requesting adata report, the associated QA review also be requested. This will allow the user toevaluate the data in the context of its overall quality. To receive copies of any of thefollowing documents, please contact:
L-3Bibliography ofData Reports and Quality Assurance Reviews
Data Reports
8014CB.XLS CSO Discharge Event of 03/29/96 to 04/01196 (Brandon Street, HanfordStreet:, and Connecticut Street CSOs)
8015CB.XLS CSO Discharge Event of 04/15/96 to 04/16/96 (Brandon Street and HanfordStreet CSOs)
8016CB.XLS CSO Discharge Event of 04/22/96 to 04/23/96 (Brandon Street, ChelanAvenue, Connecticut Street:, Hanford Street:, and King Street CSOs)
8017CB.XLS CSO Discharge Event of OS/22/96 (Brandon Street, Connecticut Street, andHanford Street CSOs)
8018CB.XLS CSO Discharge Event of 08/02/97 (Brandon Street CSO)
8019CB.XLS CSO Discharge Event of 10/13/96 (Brandon Street CSO)
8020CB.XLS CSO Discharge Event of 10/17/96 (Connecticut Street:, Hanford Street:, andKing Street CSOs)
8021CB.XLS CSO Discharge Event of 10/21/96 (Chelan Avenue and Hanford StreetCSOs)
8022CB.XLS CSO Discharge Event of 10/28/96 (Hanford Street CSO)
8023CB.XLS CSO Discharge Event of 11112/96 (Brandon Street CSO)
IIIIIIIIIIIIIIIIIII

I
II
I
•I
--I
•I
••••••
8038CB.XLS Receiving Water Analytical Data - Stann Event of 12/04/96 - Day One(12/05/96) - Week Six
8039CB.XLS Receiving Water Analytical Data - Stann Event of 12/04/96 - Day Two(12/06/96) - Week Six
8040CB.XLS Receiving Water Analytical Data - Stann Event of 12/04/96 - Day Three(12/07/96) - Week Six
8041CB.XLS Receiving Water Analytical Data - Week Seven (12/11/96)
8042CB.XLS Receiving Water Analytical Data - Week Eight (12/18/96)
8043CB.XLS Receiving Water Analytical Data - Week Nine (01/29/97)
8044CB.XLS Receiving Water Analytical Data - Week Ten (02/05/97)
8045CB .XLS Receiving Water Analytical Data - Week Eleven (02/19/97)
8046CB.XLS Receiving Water Analytical Data - Week Twelve (02/26/97)
8047CB.XLS Receiving Water Analytical Data - Week Thirteen (03/05/97)
8048CB.XLS Receiving Water Analytical Data - Week Fourteen (03/12/97)
8049CB.XLS Receiving Water Analytical Data - Stann Event of 03/15/97 - Day One(03/16/97) - Week Fifteen
8050CB .XLS Receiving Water Analytical Data - Stann Event of 03/15/97 - Day Two(03/17/97) - Week Fifteen
8051CBXLS Receiving Water Analytical Data - Stann Event of 03/15/97 - Day Three(03/18/97) - Week Fifteen
8052CB.XLS Receiving Water Analytical Data - Week Sixteen (03/26/97)
8053CB.XLS Receiving Water Analytical Data - Week Seventeen (04/02/97)
8054CBXLS Receiving Water Analytical Data - Week Eighteen (04/09/97)
8055CB.XLS Receiving Water Analytical Data - Week Nineteen (04/15/97)
8056CB.XLS Receiving Water Analytical Data - Stann Event of 04/19/97 - Day Two(04/21/97) - Week Twenty
8057CBXLS Receiving Water Analytical Data - Stann Event of 04/19/97 - Day Three(04/22/97) - Week Twenty
8058CBXLS Receiving Water Analytical Data - Week Twenty One (04/30/97)
8059CB.XLS Receiving Water Analytical Data - Week Twenty Two (05/07/97)
8060CB.XLS Receiving Water Analytical Data - Week Twenty Three (05/15/97)
Bibliography ofData Reports and Quality Assurance Reviews Ir5

Sediment Data
8061CB.:xLS Receiving Water Analytical Data - Week Twenty Four (05/20/97)
8062CB.:xLS Receiving Water Analytical Data --Week Twenty Five (05/28/97)
8063CB.XLS Receiving Water Analytical Data - Storm Event of 05/31/97 - Day One(06/01/97) - Week Twenty Six
8064CB.XLS Receiving Water Analytical Data - Storm Event of 05/31/97 - Day Two(06/02/97) - Week Twenty Six
8065CB.:xLS Receiving Water Analytical Data - Storm Event of 05/31/97 - Day Three(06/03/97) - Week Twenty Six
Data Reports
8008CB.XLS Brandon Street CSO Sediment Chemistry Data
8009CB.XLS Eighth Avenue CSO Sediment Chemistry Data
8010CB.:xLS Hamm Creek Delta Sediment Chemistry
8011CB.XLS Kellogg Island Sediment Chemistry Data
8012CB.XLS South Park (16th Avenue South Bridge) Sediment Chemistry Data
8013CB.XLS Benthic Invertebrate Study Sediment Chemistry Data (DuwamishlDiagonalCSO and Kellogg Island)
Bibliography ofData Reports and Quality Assurance ReviewsL-6
Quality Assurance Reviews
Final Data Package for Semipermeable Membrane Device Analytical Data (TechnicalMemorandum), July 28, 1997 (this package includes the quality assurance review and theanalytical data report)
Quality Assurance Review of Conventional Analytical Data for Water Samples (TechnicalMemorandum), June 27, 1997
Quality Assurance Review of Low Level Mercury Data for Water Samples (TechnicalMemorandum), July 28, 1997 (this review includes the analytical data report)
Quality Assurance Review of Metals Analytical Data for Water Samples - First ThirteenWeeks (Technical Memorandum), August 29, 1997
Quality Assurance Review of Metals Analytical Data for Water Samples - Second ThirteenWeeks (Technical Memorandum), November 7, 1997
Quality Assurance Review of Organic Analytical Data for Water Samples (TechnicalMemorandum), June 18, 1997

Tissue Data
Quality Assurance Reviews
Quality Assurance Review for Duwamish/Estuary Benthic Invertebrate Study SedimentChemistry - Archived Samples (Report), ... to be completed
8006CB.XLS Transplanted Mussel Study (Phase I) Chemistry Data
8007CB.XLS Transplanted Mussel Study (Phase II) Chemistry Data
L-7Bibliography ofData Reports and Qualify Assurance Reviews
Quality Assurance Review for Duwamish EstuarylElliott Bay Invertebrate Tissue Study(Report), October 20, 1997
Quality Assurance Review for Duwamish EstuarylElliott Bay Large Fish Tissue Study(Report), October 18, 1997
Quality Assurance Review for Duwamish EstuarylElliott Bay Small Fish Tissue Study(Report), October 17, 1997
Quality Assurance Review for Duwamish EstuarylElliott Bay Squid Tissue Study (Report),February 5, 1998
Quality Assurance Reviews
Quality Assurance Review for Duwamish EstuarylElliott Bay Crab Tissue Study (Report),October 22, 1997
Data Reports
8000CB ,XLS Crab Tissue Chemistry Data
8001CB,XLS Invertebrate Tissue Chemistry Data
8002CB.XLS Large Fish Tissue Chemistry Data
8003CB.XLS Small Fish Tissue Chemistry Data
8004CB.XLS Squid Tissue Chemistry Data
8005CB.XLS Miscellaneous (Crab, Mussels, Prawns) Tissue Chemistry Data
Quality Assurance Review for Duwamish Estuary Water Quality Assessment SedimentProject Weeks One Through Six (Report), May 29, 1997
Quality Assurance Review for Duwamish Estuary Water Quality Assessment SedimentProject Weeks Seven Through Seventeen (Report), July 31, 1997
Quality Assurance Review for Duwamish/Estuary Benthic Invertebrate Study SedimentChemistry (Report), December 23, 1997
f
j
I
IIIIIIIIIIIIIII

8024CB.XLS CSO Discharge Event of 12/04/96 (Brandon Street, Chelan Avenue,Connecticut Street, Hanford Street, and King Street CSOs)
8025CB.XLS CSO Discharge Event of 01/27/97 (Brandon Street, Hanford Street, andKing Street CSOs)
8026CBXLS CSO Discharge Event of 01/30/97 (Brandon Street, Hanford Street, andKing Street CSOs)
8027CBXLS CSO Discharge Event of 03/01/97 (Brandon Street, Hanford Street, andKing Street CSOs)
8028CB.XLS CSO Discharge Event of 03/06/97 (Hanford Street and King Street CSOs)
8029CB.XLS CSO Discharge Event of 03/15/97 (Brandon Street, Chelan Avenue,Hanford Street, and King Street CSOs)
8030CB.XLS CSO Discharge Event of 04/19/97 (Brandon Street, Chelan Avenue,Connecticut Street, Hanford Street, and King Street CSOs)
8031 CB.XLS CSO Discharge Event of 04/26/97 (Brandon Street CSO)
8032CB.XLS CSO Discharge Event of 05/31/97 (Brandon Street, Chelan Avenue,Connecticut Street, Hanford Street, and King Street CSOs)
Quality Assurance Reviews
Quality Assurance Review of Conventional Analytical Data for Water Samples (TechnicalMemorandum), June 27, 1997
Quality Assurance Review of Metals Data for CSO Storm Water Samples (TechrucalMemorandum), August 26, 1997
Quality Assurance Review of Organic Analytical Data for Water Samples (TechnicalMemorandum), June 18, 1997
Receiving Water Data
Data Reports
8033CB.XLS Receiving Water Analytical Data - Week One (10/30/96)
8034CB.XLS Receiving Water Analytical Data - Week Two (11/06/96)
8035CB.XLS Receiving Water Analytical Data - Week Three (11/13/96)
8036CB.XLS Receiving Water Analytical Data - Week Four (11/20/96)
8037CB.XLS Receiving Water Analytical Data - Week Five (11/25/96)
I
I
I
I
I
I
I
I
I
I
I
I
I
£-4 Bibliography ofData Reports and Quality Assurance Reviews

Quality Assurance Review for Duwamish EstuarylElliott Bay Miscellaneous (Crab,Mussels; and Prawns) Tissue Study (Report), December 30, 1997
Quality Assurance Review for Duwamish Estuary Transplanted Mussel Study (Report),February 12, 1997
Quality Assurance Review for Duwamish Estuary Transplanted Mussel Study II (Report),October 27, 1997
Review of Quality Control Data for Potential Method Detection Limit Adjustments forTissue, (Technical Memorandum), November 10, 1997
I
I
I
I
I
I
I
I
I
I
J
I,I
L-8 Bibliography ofData Reports and Quality Assurance Reviews
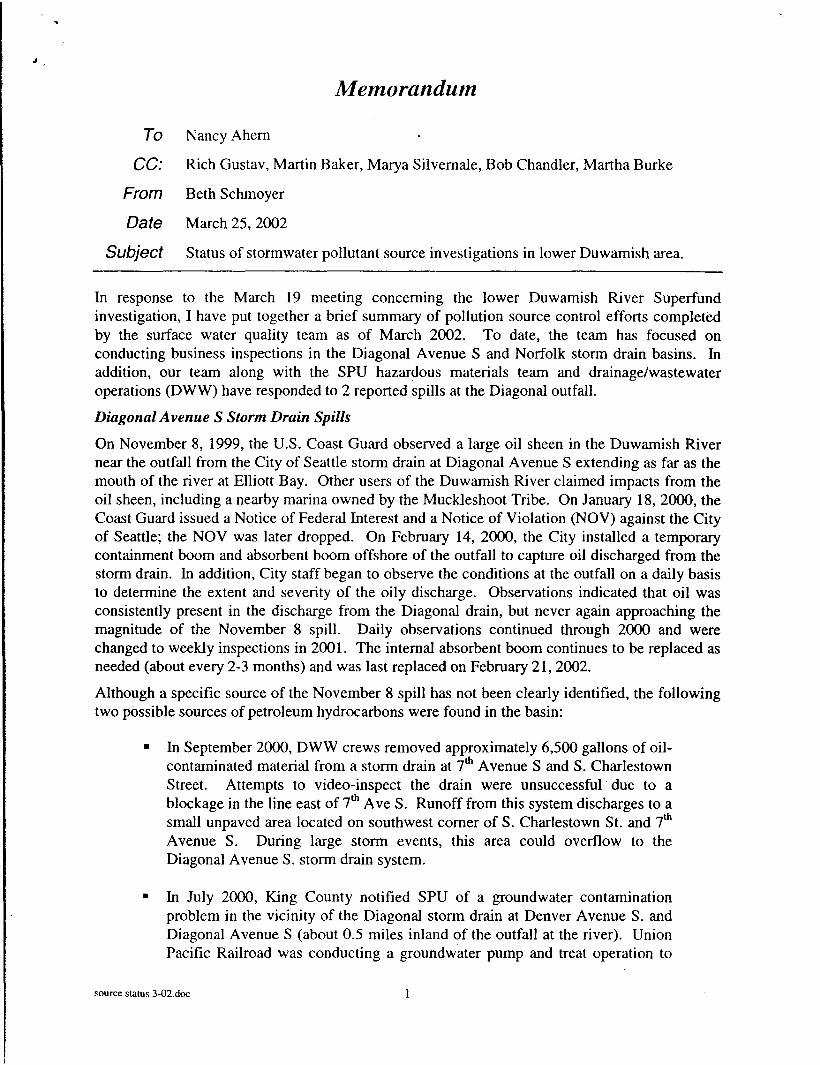
Memorandum
To Nancy Ahem
CC: Rich Gustav, Martin Baker, Marya Silvernale, Bob Chandler, Martha Burke
From Beth Schmoyer
Date March 25, 2002
Subject Status of stormwater pollutant source investigations in lower Duwamish area.
In response to the March 19 meeting concerning the lower Duwamish River Superfundinvestigation, I have put together a brief summary of pollution source control efforts completedby the surface water quality team as of March 2002. To date, the team has focused onconducting business inspections in the Diagonal Avenue S and Norfolk storm drain basins. Inaddition, our team along with the SPU hazardous materials team and drainage/wastewateroperations (DWW) have responded to 2 reported spills at the Diagonal outfall.
Diagonal A venue S Storm Drain Spills
On November 8, 1999, the U.S. Coast Guard observed a large oil sheen in the Duwamish Rivernear the outfall from the City of Seattle storm drain at Diagonal Avenue S extending as far as themouth of the river at Elliott Bay. Other users of the Duwamish River claimed impacts from theoil sheen, including a nearby marina owned by the Muckleshoot Tribe. On January 18,2000, theCoast Guard issued a Notice of Federal Interest and a Notice of Violation (NOV) against the Cityof Seattle; the NOV was later dropped. On February 14, 2000, the City installed a temporarycontainment boom and absorbent boom offshore of the outfall to capture oil discharged from thestorm drain. In addition, City staff began to observe the conditions at the outfall on a daily basisto determine the extent and severity of the oily discharge. Observations indicated that oil wasconsistently present in the discharge from the Diagonal drain, but never again approaching themagnitude of the November 8 spill. Daily observations continued through 2000 and werechanged to weekly inspections in 2001. The internal absorbent boom continues to be replaced asneeded (about every 2-3 months) and was last replaced on February 21, 2002.
Although a specific source of the November 8 spill has not been clearly identified, the followingtwo possible sources of petroleum hydrocarbons were found in the basin:
• In September 2000, DWW crews removed approximately 6,500 gallons of oilcontaminated material from a storm drain at 7mAvenue Sand S. CharlestownStreet. Attempts to video-inspect the drain were unsuccessful· due to ablockage in the line east of 7mAve S. Runoff from this system discharges to asmall unpaved area located on southwest comer of S. Charlestown St. and 7m
Avenue S. During large storm events, this area could overflow to theDiagonal Avenue S. storm drain system.
• In July 2000, King County notified SPU of a groundwater contaminationproblem in the vicinity of the Diagonal storm drain at Denver Avenue S. andDiagonal Avenue S (about 0.5 miles inland of the outfall at the river). UnionPacific Railroad was conducting a groundwater pump and treat operation to
source status 3-02.doc

Business inspections focus on outdoor activities to minimize the presence of onsite pollutantsthat could come in contact with stormwater runoff. Specific requirements for operational andstructural controls are described in the City's 2000 Source Control Technical RequirementsManual.
In 2001, 200 businesses were inspected in the western portion of the Diagonal basin (109 driveby inspections and 91 complete onsite inspections). A list of businesses inspected is provided inTable 1 and a map of the business locations is provided in Figure 1. A total of 81 of thebusinesses inspected were not in compliance with City stormwater source control requirements.As shown in Figure 2, most of the problems were related to inadequate maintenance of onsitestorm drainage systems (33 percent) and inadequate spill response programs (47 percent). SPUinspectors worked with the business owners to improve their stormwater pollution preventionpractices. As of March 2002, over 90 percent of the businesses inspected are now in compliancewith City stormwater requirements.
Norfolk Basin Business Inspections
In 2001, 68 businesses operating in the Norfolk basin were inspected (24 drive-by and 44 onsiteinspections). See Table 2 and Figure 3 for a list of the businesses inspected and map of businesslocations. A total of 68 of the businesses were not in compliance with City stormwater sourcecontrol requirements. As of March 2002, over 95 percent of the businesses inspected are now incompliance with City stormwater requirements.
Future Plans
In 2002-2003, the SPU surface water quality team will continue conducting source controlactivities in the Diagonal basin to support the early action cleanup proposed for theDuwamish/Diagonal CSO/SD as part of the lower Duwamish Superfund investigation. An .additional inspector will be hired in 2002, who will be assigned primarily to the SPU Duwamishsource control effort. Pollutant source inspections will be expanded to cover the eastern portionof the drainage basin that was not covered in 2001. In addition, focused inspections will beconducted at select businesses in the basin to determine whether these facilities are sources of thecontaminants of concern (COC) found in the sediment offshore of the Diagonal outfall. Theseadditional inspections will likely include sampling of onsite catch basins to confirm the presenceof waterway COCs and may include installation of in-line sediment traps to aid in source tracingefforts in the basin. Additional investigation and sampling may be required to support modelingefforts and recontamination evaluations that will likely be conducted as part of the cleanup study.
Inspections and source identification/control efforts will also likely be initiated in the South Parkdrainage basin to coincide with a hydrologic/hydraulic basin plan that is currently beingconducted in that basin. The South Park basin discharges to the Duwamish River on the westbank at approximately 7th Avenue S.
source status 3-02.doc 3

DWU Laterals
Ditches & Culverts
DWU Mainlines
-.. -
-'-,
--
Onsna
Rasldential
Arlarials
Stata Highway
Interstata Freeway
Streams
Abandoned
Drainage Lateral
Side Sewer
Drainage Lateral (not Inspected)
Side Sewer (not Inspected)
Culverts
Ditches
Surface Drainage
diagonal basin
Original buslnass list
•
Diagonal business inspects as of 3/02
• Drivaby
o Nona
Streets
-- Drainage Mainline
-- Sanitary Mainline
-- Combined Malnllnas
- - Metro Mainline
Abandoned Mainline_._-CSO
o
Diagonal Basin (west) Inspections as of 3/02.

500 0
----------500 1000 1500 Feet
Norfolk Basin Inspections as of 3/02.
Original business list
Norfolk business inspects as of 3/02
• Driveby
0 None
• Onsite
0 Norfolk basin
Streets
Residential
Arterials
State Highway
Interstate Freeway
DWU Mainlines
Drainage Mainline
Sanitary Mainline
Combined Mainlines
Metro Mainline
Abandoned Mainline
cso
Ditches & Culverts
Culverts
Ditches
Surface Drainage
Iniet, Laterai
Unknown
Separated-partially separated area
Streams
Figure 3: Norfolk Basin Inspections.

--- - -----------
:,:0 ____
,'U' fi 1'1.'" Y'"_ I • ~o.,:r,
, ~ ':!I~ ......";'S SPOKANE ST WEn S~,nu FRWY - --....,. , ~-----
r //~/
p1"M
Legend
·1995, THE OTY OF SEAT1U, all ri....~.
No ,.."..,1ies 0/ lIlY ..... including ICCIlIXY.1hness or merdwltabtUty, JetCtftpany this product.
DiagonalOutfall :>ed~Ment
"5amp\esApril 06, 1995
Produced by theSeattle Engineering Oeparnnenl,
Geogr.aphlc Systems
-- Dr2inage Mainlines
-- Culverts
-- Sewe1' Mainlines
-- Streams
• [)tS4-I'2(i $ed\Mffit~tn?\es{RIl~*,a1vdnJ
Scale 1"· 500' i
CITYOFSEATTLE
SIS
t~t1lf (7, p~ cS~J.(~ctt'~
S~f/l ~i lo£o-.fuHA S
Figure 4. City of Seattle Stormdrain Sample Locations. _--L'--- ---LiiL..l._---IlL-~~ __L_!L~~_Ll_~~ ~~--'=-''-------'Lll..J.L--'----
_._.....- Jif 'I 'i= t_f f4!. .sc2.At~'!Y\-t .conlo~~~levauon' .c~or~l~g ~~Of1ll American Vomcal D.rum· NAVD88
!.<,. -,

0% 3% 3%
Figure 2: Problems Found During 2001 Business Inspections.
1%
• Storm drains full of sediment
• Missing trap on CB
o Illicit connections
o Automotive fluid in storm drains
• Vehicle washing
.Washing down parking lot
• Liquid storage containersuncovered
B Liquid storage stored in unsafelocation
• Outside vehicle maintenance
• Unkempt dumpster
o Unkempt restaurant greasebarrels
• No spill plan
• No spill kit/materials

CSL
I q q 4- p,p.e..- Se..d I ""'" ~ V\. s~~-p ~~
IDiagonal Storm Drain Pipe Sediment Samples . 1
I ~S
Station 0056-136 0057-088 10056-126 10057-177Sample No. 95301 953021 953031 95304% Solids 84 241 751 85TOC, dry %C 0.24 8.8 1.5 0.37Pesticides & PCBs, dry wgt. uglkg I4,4'-000 <ROL3.4 19 4 <ROL 3.44,4'-00E <ROL3.4 11 <ROL3.4 <RDL3.44,4"-00T 3.9 18 4.7 <RDL3.4PCB-1248 <ROL 34 190 46 <ROL 34
-Semi-Volatile OrgafJics, dry wgt, mglkg
Benz[a]anthracene - - - '<ROL 0.30 <ROL 1.0 <ROL 0.501<ROL 0.30Benzo[b]fluoranthene 0.36 <ROL 1.0 0.57 <ROL 0.30Benzo[a]pyrene <ROL 0.30 <ROL 1.0 <ROL 0.50 <ROL 0.30Bis(2-ethylhexyl)phthalate 1.7 11 4.7 <ROL 1.5 J. '3 IButyl benzyl phthalate <ROL 0.30 <ROL 1.0 0.62 <ROL 0.30Chrysene 0.38 <ROL 1.0 0.65 <ROL 0.301A-Dichlorobenzene <ROL 0.30 <ROL 1.0 <RDL 0.50 0.33Fluoranthene 0.72 <ROL 1.0 1.1 0.524-Methylphenol <RDL 0.30 9.9 <ROL 0.50 <ROL 0.30Phenanthrene 0.46 1.1 0.55 <RDL 0.30Pyrene 0.6 <ROL 1.0 1.1 0.45oi-n-octyl phthalate <ROL 0.30 1.3 <ROL 0.501 <ROL 0.30 .4-Methylphenol <ROL 0.30 9.9 <ROL 0.50 <ROL 0.30Metals, dry wgt, mglkg "'.1/~ bwArsenic 4.3 9 7.3 3.2 '13Cadmium 0.7 1.1 0.76 0.57 fo,7Chromium 24 30 14 21 Z70Copper 36 90 51 28 3~O
Lead 100 100 120 32 1530
Mercury 0.018 0.12 <ROL 0.01 0.033 O.S')
Silver . 0.56 <ROL 0.71 0.67 0.49 ~.I
Zinc 150 320 170 170 'l~O
Figure S. City of Seattle Stormdrain Sample Results. (1994)

Iable2: Norfolk Business Inspections (2001).
FileDrain Date Inspect Problems Closed
Company Address SIC SIC Description Type Basin Inspected Type Found (T/F)R S PACIFIC INC 9840 M L KING JR WY S 1752 Floor Laying and Other Floor Work, NEC storm norfolk 06/21/2001 Driveby FALSE ClosedNorthwest Wrecking 10230 E Marginal Wy S 1795 Wrecking and Demolition Work storm Outside Cil 01/31/2002 Driveby FALSE ClosedR & M Trucking 9244 m I king jr wy s 4213 Trucking, Except Local storm norfolk 06/21/2001 Driveby FALSE Closed
Airports, Flying Fields, and Airport TerminalMilitary Flight Center 10002 E Marginal Wy S 4581 Services storm Outside Cil 01/31/2002 Driveby FALSE Closed
Airports, Flying Fields, and Airport TerminalNo name on building 6671 perimeter rd s 4581 Services storm norfolk 09/05/2001 Driveby FALSE Closed
Airports, Flying Fields, and Airport TerminalNo name on bUilding 6691 perimeter rd s 4581 Services storm norfolk 09/05/2001 Driveby FALSE Closed
Airports, Flying Fields, and Airport TerminalNo name on building 6711 perimeter rd s 4581 Services storm norfolk 09/05/2001 Driveby FALSE Closed
Airports, Flying Fields, and Airport TerminalNo name on bUilding 6771 perimeter rd s 4581 Services storm norfolk 09/05/5001 Driveby FALSE Closed
Airports, Flying Fields, and Airport TerminalNo name on building 6771 perimeter rd s 4581 Services storm norfolk 09/05/5001 Driveby FALSE Closed
Airports, Flying Fields, and Airport TerminalNo name on building 6801 perimeter rd s 4581 Services storm norfolk 09/05/5001 Driveby FALSE Closed
Airports, Flying Fields, and Airport TerminalNo name on building 6801 perimeter rd s 4581 Services storm norfolk 09/05/5001 Driveby FALSE Closed
Transportation Equipment and Supplies,NATIONAL AVIATION INC 7170 PERIMETER RD S 5088 Except Motor Vehicles storm norfolk 09/24/2001 Driveby FALSE Closed
Transportation Equipment and Supplies,INTERCOASTAL INC 8187 PERIMETER RD S 5088 Except Motor Vehicles storm norfolk 10/12/2001 Driveby FALSE ClosedRILU INC (Randy's Restaur~ 10016 E MARGINAL WY S 5812 Eating and Drinking Places storm/surf" norfolk 01/31/2002 Driveby FALSE ClosedCREDIT UNION OF THE PJ! 10200 E MARGINAL WY S 6061 Credit Unions, Federally Chartered storm norfolk 01/31/2002 Driveby FALSE Closed
Building Cleaning and Maintenance Services,BILL PITTMAN JANITORIAL 9242 M L KING JR WY S 7349 NEC storm norfolk 06/21/2001 Driveby FALSE ClosedJoe's Auto Service 10300 E Marginal Wy S 7538 General Automotive Repair Shops storm Outside Cil 01/31/2002 Driveby FALSE Closed
Air and Water Resource and Solid WasteKing County Emergency Mal 7300 perimeter rd s 9511 Management storm norfolk 09/24/2001 Driveby FALSE ClosedNo name on building 7201 perimeter rd s #N/A storm norfolk 09/24/2001 Driveby FALSE ClosedNo name on bUilding 7201 perimeter rd s #N/A storm norfolk 09/24/2001 Driveby FALSE ClosedNo name on building 8300 military rd s #N/A storm norfolk 06/22/2001 Driveby FALSE ClosedNo name on building 8300 military rd s #N/A storm norfolk 06/22/2001 Driveby FALSE ClosedNo name on building 8300 military rd s #N/A storm norfolk 06/22/2001 Driveby FALSE ClosedNo name on building· vacar 9228 m I king jr wy s #N/A storm norfolk 06/21/2001 Driveby FALSE ClosedFrank Coluccio Construction 9850 m I king jr wy s 1610 Heavy construction contractors storm norfolk 07/11/2001 Onsite TRUE ClosedD A GRAPHICS INC. 9688 M L KING JR WY S 2759 Commercial Printing, NEC storm norfolk 06/20/2001 Onsite TRUE OpenKAIBAB METALS INC 4357 S 104TH PL 3443 Fabricated Plate Work (Boiler Shops) storm norfolk 08/17/2001 Onsite TRUE ClosedEncompas 9833 40th av s 3444 Sheet Metal Work storm norfolk 6/22/01 & 1( Onsite TRUE ClosedEncompass 3701 S Norfolk ST 3444 Sheet Metal Work storm norfolk 6/22/2001 & Onsite TRUE ClosedHyster Sales Co. 9892 40th av s 3531 Construction Machinery and Equipment storm norfolk 07/16/2001 Onsite TRUE ClosedFAIRN & SWANSON INC. 9875 40TH AV S 4212 Local Trucking Without Storage storm norfolk 06/22/2001 Onsite TRUE ClosedUNITED PARCEL SERVICE 7575 perimeter rd s 4212 Local Trucking Without Storage storm norfolk 09/26/2001 Onsite TRUE Closed
diag bus all 3-04-02 new.xis norfolk 1 of 5 03/25/2002

,lable 2: Norfolk Business Inspections (2001).
FileDrain Date Inspect Problems Closed
Company Address SIC SIC Description Type Basin Inspected Type Found (T/F)VALLEY LANDSCAPE & DE 9800 40TH AV S 782 Lawn and Garden Services storm norfolk None FALSE Ope"KUBOTA TOM 4345 S 104TH PL 782 Lawn and Garden Services storm norfolk None FALSE OpenELECCION TEDDY R 4610 S GAZELLE ST 782 Lawn and Garden Services sanitary norfolk None FALSE OpenVALLEY LANDSCAPE & DE 9338 39TH AV S 782 Lawn and Garden Services sanitary norfolk None FALSE OpenKUBOTA TOM 3932 SPERRY ST 782 Lawn and Garden Services sanitary norfolk None FALSE OpenJUAREZ CONSTRUCTION 8013 PERIMETER RD S 1521 General Contractors-Single-Family Houses storm norfolk None FALSE OpenJUAREZ CONSTRUCTION 9132 M L KING JR WY S 1521 General Contractors-Single-Family Houses combined norfolk None FALSE Open
Water, Sewer, Pipeline, and CommunicationsR L ALIA COMPANY 9215 M L KING JR WY S 1623 and Power Line Construction sanitary norfolk None FALSE OpenBACK FORTY INC 7277 PERIMETER RD S 1629 Heavy Construction, NEC storm norfolk None FALSE OpenMAO'S PARTNERSHIP 9241 45TH av S 1751 Carpentry Work storm norfolk None FALSE OpenOSSES CONTRACTORS 11\ 10739 47TH av S 1751 Carpentry Work Outside City Limits None FALSE OpenSORKINOLEG 8353 BEACON av S 1751 Carpentry Work combined norfolk None FALSE OpenLU-BOND CONSTRUCTIOf- 2828 S OTHELLO ST 1761 Roofing, Siding,.and Sheet Metal Work combined norfolk None FALSE Open
Narrow Fabric and Other Smallware Mills:SWAN NET USA LLC 8300 MILITARY RD S 2241 Colton, Wool, Silk, and Manmade Fiber sanitary norfolk None FALSE OpenTHAW CORP 8300 MILITARY RD S 2385 Waterproof Outerwear storm norfolk None FALSE OpenJEFFERSON SMURFIT CO 10020 M L KING JR WY S 2631 Paperboard Mills storm norfolk None FALSE OpenJEFFERSON SMURFIT CO 9747 M L KING JR WY S 2631 Paperboard Mills combined norfolk None FALSE OpenSEATILE PACKAGING CO 3701 S NORFOLK ST 2653 Corrugated and Solid Fiber Boxes storm norfolk None FALSE OpenPACIFIC COATINGS INC 9620 ML KING JR WY S 2951 Asphalt Paving Mixtures and Blocks storm norfolk None FALSE OpenPACIFIC COATINGS INC 9243 M L King Jr Wy S 2951 Asphalt Paving Mixtures and Blocks combined norfolk None FALSE OpenBOEING COMPANY THE 4340 S 104TH PL 3721 Aircraft storm norfolk None FALSE OpenBOEING COMPANY THE 9725 E MARGINAL WY S 3721 Aircraft storm None FALSE Open
AVIATION PARTNERS INC 8403 PERIMETER RD S 3728 Aircraft Parts and Auxiliary Equipment, NEC storm norfolk None FALSE Open
WESTERN METAL PRODU 7696 PERIMETER RD S 3728 Aircraft Parts and Auxiliary Equipment, NEC storm norfolk None FALSE OpenWOOLDRIDGE BOATS INC 9844 40TH AV S 3732 Boat Building and Repairing storm norfolk None FALSE OpenWOOLDRIDGE BOATS INC 9224 M L KING JR WY S 3732 Boat Building and Repairing sanitary norfolk None FALSE OpenTNT UNITED TRUCK L1NE~ 9833 40TH av S 4213 Trucking, Except Local storm norfolk None FALSE OpenTNT UNITED TRUCK L1NE~ 9833 40TH av S 4213 Trucking, Except Local storm norfolk None FALSE OpenNELSON TRUCKING CO IN 9777 M L KING JR WY S 4214 Local Trucking with Storage combined norfolk None FALSE OpenUNITED PARCEL SERVICE 7575 PERIMETER RD S 4215 Courier Services Except by Air storm norfolk None FALSE OpenPSCCINC 10404 EMPIRE WY S 4225 General Warehousing and Storage Outside City Limits None FALSE OpenKing County National Airport 7277 Perimeter Rd S 4512 Air Transportation, Scheduled storm norfolk None FALSE OpenREED AVIATION INC 8490 PERIMETER RD S 4522 Air Transportation, Nonscheduled storm norfolk None FALSE OpenSEATILE JET SERVICES 118535 PERIMETER RD S 4522 Air Transportation, Nonscheduled storm norfolk None FALSE OpenERIN AIR INCORPORATED 7149 PERIMETER RD S 4522 Air Transportation, Nonscheduled storm norfolk None FALSE OpenAERO COPTERS INC 8535 PERIMETER RD S 4522 Air Transportation, Nonscheduled storm norfolk None FALSE OpenGalvin Flying 7023 perimeter rd s 4522 Air Transportation, Nonscheduled storm norfolk None FALSE Open
Airports, Flying Fields, and Airport TerminalSTRAUSS PETER 7575 PERIMETER RD S 4581 Services storm norfolk None FALSE Open
diag bus all 3-04-02 new.xls norfolk 3015 03/25/2002
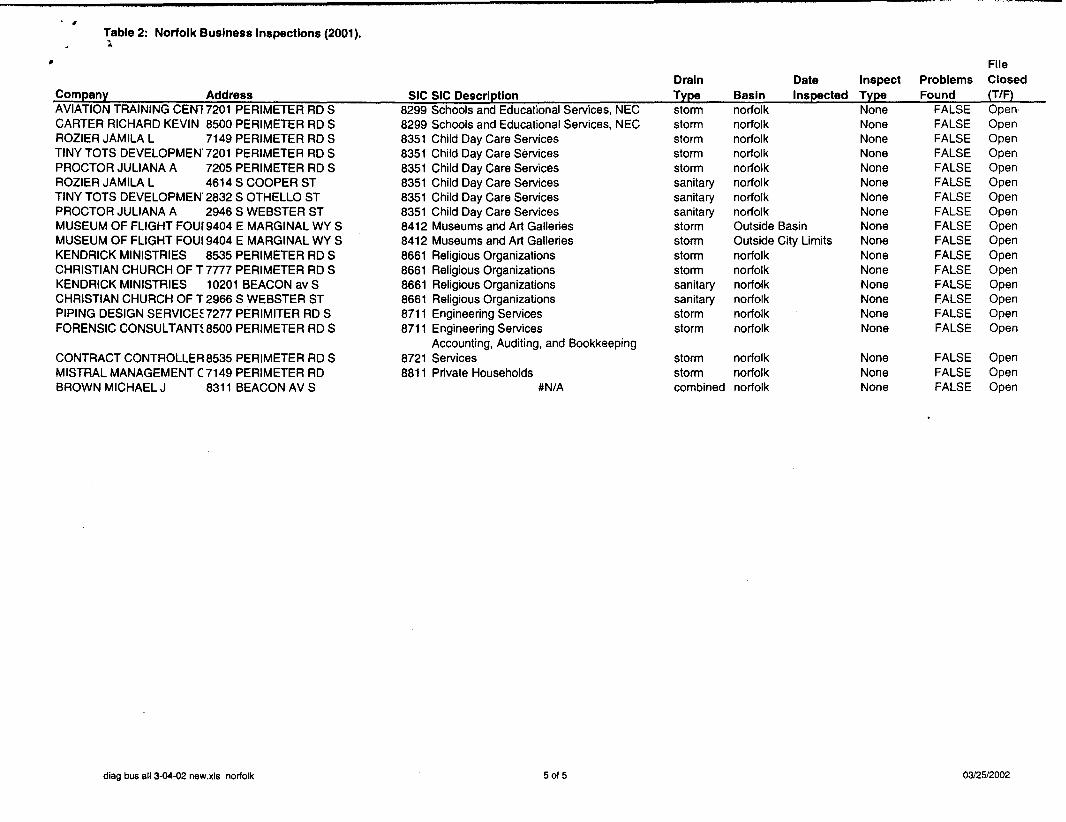
· ,Table 2: Norfolk Business Inspections (2001).l
, FileDrain Date Inspect Problems Closed
Company Address SIC SIC Description Type Basin Inspected Type Found (TfF)AVIATION TRAINING CEN17201 PERIMETER RD S 8299 Schools and Educational Services, NEC storm norfolk None FALSE OpenCARTER RICHARD KEVIN 8500 PERIMETER RD S 8299 Schools and Educational Services, NEC storm norfolk None FALSE OpenROZIER JAMILA L 7149 PERIMETER RD S 8351 Child Day Care Services storm norfolk None FALSE OpenTINY TOTS DEVELOPMEN' 7201 PERIMETER RD S 8351 Child Day Care Services storm norfolk None FALSE OpenPROCTOR JULIANA A 7205 PERIMETER RD S 8351 Child Day Care Services storm norfolk None FALSE OpenROZIER JAMILA L 4614 S COOPER ST 8351 Child Day Care Services sanitary norfolk None FALSE OpenTINY TOTS DEVELOPMEN' 2832 S OTHELLO ST 8351 Child Day Care Services sanitary norfolk None FALSE OpenPROCTOR JULIANA A 2946 S WEBSTER ST 8351 Child Day Care Services sanitary norfolk None FALSE OpenMUSEUM OF FLIGHT FOUl 9404 E MARGINAL WY S 8412 Museums and Art Galleries storm Outside Basin None FALSE OpenMUSEUM OF FLIGHT FOUl 9404 E MARGINAL WY S 8412 Museums and Art Galleries storm Outside City Limits None FALSE OpenKENDRICK MINISTRIES 8535 PERIMETER RD S 8661 Religious Organizations storm norfolk None FALSE OpenCHRISTIAN CHURCH OF T 7777 PERIMETER RD S 8661 Religious Organizations storm norfolk None FALSE OpenKENDRICK MINISTRIES 10201 BEACON av S 8661 Religious Organizations sanitary norfolk None FALSE OpenCHRISTIAN CHURCH OF T 2966 S WEBSTER ST 8661 Religious Organizations sanitary norfolk None FALSE OpenPIPING DESIGN SERVICH 7277 PERIMITER RD S 8711 Engineering Services storm norfolk None FALSE OpenFORENSIC CONSULTANn8500 PERIMETER RD S 8711 Engineering Services storm norfolk None FALSE Open
Accounting, AUditing, and BookkeepingCONTRACT CONTROLLER 8535 PERIMETER RD S 8721 Services storm norfolk None FALSE OpenMISTRAL MANAGEMENT (7149 PERIMETER RD 8811 Private Households storm norfolk None FALSE OpenBROWN MICHAEL J 8311 BEACON AV S #N/A combined norfolk None FALSE Open
diag bus all 3-04-02 new.xls norfolk 5015 03125/2002

Table 1: Diagonal Basin Business Inspections (as of 3102).
SiteStatusClosed
Closed
Closed
Closed
Closed
Closed
Closed
Closed
Closed
Closed
Closed
Closed
Closed
Closed
Closed
Closed
Closed
Closed
Closed
Closed
Closed
Closed
Closed
Closed
Closed
Closed
Closed
Closed
Closed
Closed
Closed
Closed
Closed
Closed
Closed
Closed
Closed
Closed
Closed
Closed
FALSE
FALSE
FALSE
FALSE
FALSE
FALSE
FALSE
FALSE
FALSE
FALSE
FALSE
FALSE
FALSE
FALSE
FALSE
FALSE
FALSE
FALSE
FALSE
FALSE
FALSE
FALSE
FALSE
FALSE
FALSE
FALSE
FALSE
FALSE
FALSE
FALSE
FALSE
FALSE
FALSE
FALSE
FALSE
FALSE
FALSE
FALSE
FALSE
FALSE
ProblemsFound(T/F)
Inspection InspectionBasin Date TypeMaybe Rai 01/2512001 Driveby
diag 02108/2001 Driveby
diag 02/15/2001 Driveby
diag 01/25/2001 Driveby
diag 01/10/2001 Driveby
diag 0212212001 Driveby
diag 0210812001 Driveby
diag 0211512001 Driveby
diag 01/05/2001 Driveby
diag 01/05/2001 Driveby
diag 01/2212001 Driveby
diag 01/25/2001 Driveby
diag 01/28/2001 Driveby
diag 06/08/2001 Driveby
diag 02108/2001 Driveby
diag 0211512001 Driveby
diag 01/2212001 Driveby
diag 06/09/2001 Driveby
diag 06/0812001 Driveby
diag 06/0812001 Driveby
diag 06/01/2001 Driveby
diag 01/10/2001 Driveby
diag 02/0812001 Driveby
diag 02/2212001 Driveby
diag 09117/2001 Driveby
diag 06/0612001 Driveby
diag 06/0612001 Driveby
diag 06/09/2001 Driveby
diag 01/25/2001 Driveby
diag 01/25/2001 Driveby
diag 01/2212001 Driveby
diag 02/01/2001 Driveby
diag 05/01/2001 Driveby
diag 03/2312001 Driveby
diag 01/25/2001 Driveby
diag 06/09/2001 Driveby
diag 06/09/2001 Driveby
diag 06/09/2001 Driveby
diag 01/28/2001 Driveby
diag 01/2212001 Driveby
DrainTypeStorm
Storm
Storm
Storm
Storm
Storm
Storm
Storm
storm
storm
storm
SIC SIC Descriptiono #N/A
o #N/A
o #N/A
o #N/A
782 Lawn and Garden Services
782 Lawn and Garden Services
1521 General Contractors-Single-Family
1521 General Contractors-Single-Family Storm
1521 General Contractors-Single-Family
1522 General Contractors-Residential
1542 General Contractors-Nonresidential Storm
1629 Heavy Construction, NEC Storm
1721 Painting and Paper Hanging Storm
1721 Painting and Paper Hanging storm
1751 Carpentry Work Storm
1751 Carpentry Work Storm
1751 Carpentry Work
1752 Floor Laying and Other Floor Work, comb
1761 Roofing, Siding, and Sheet Metal storm
1795 Wrecking and Demolition Work storm
2092 Prepared Fresh or Frozen Fish and storm
2517 Wood Television, Radio, Phonograph Storm
3089 Plastics Products, NEC Storm
3369 Nonferrous Foundries, Except Storm
3412 Metal Shipping Barrels, Drums,
3444 Sheet Metal Work
3549 Metalworking Machinery, NEC combined
3714 Motor Vehicle Parts and Accessories comb
3751 Motorcycles, Bicycles, and Parts
4111 Local and Suburban Transit
4212 Local Trucking Without Storage
4213 Trucking, Except Local
4225 General Warehousing and Storage
4225 General Warehousing and Storage
4724 Travel Agencies
5012 Automobiles and Other Motor storm
5012 Automobiles and Other Motor storm
5039 Construction Materials, NEC storm
5039 Construction Materials. NEC Storm
5045 Computers and Computer Peripheral Storm
Company Name AddressHUIINTERTRADING 2503 BEACON AV S
ANDREW MIDDLEBROOKS FORGI4512 14TH AV S
ANDREW MIDDLEBROOKS FORGI451214TH AV S
NS INC 4341 15TH AV S
SCENIC LANDSCAPE COMPANY 2720 14TH AV S
DOUG DAY GARDENING & LAND 452214TH AV S
G W CONSTRUCTORS 251915TH AV S
JAY ROBERTS CONST 2805 BEACON AV S
Aspen Development Corporation 4126 Airport Wy S
Aspen Homes Inc. 4126 Airport Wy S
CHAI TAl INVESTMENTS INC 436215TH AV S
PUGET SUND DREDGING CO 1308 S ANGELINE ST
GOLDEN N INC 235112TH AV S
NEW FINISHES 4786 1ST AV S
VERTIGO HIGH ACCESS SERVI 202113TH AV S
HONG DE REMODELING CO. 413214TH AV S
CNA CUSTOM HOME DESIGN IN 3919 14TH AV S
WILLOTT SEATTLE ENTERPRIS 47981ST AV S
JOHNSON ROOFING & GUTTERS 4100 1ST AV S
DEMOLITION MAN INC 4101 4TH AV S
C & C MEATS 3922 6TH AV S
BOOJUM WOODWORKS 426810TH AV S
ADVANTAGE LIMB SYSTEMS IN 450115TH AV S
OUTCAST & COMPANY 3915 14TH AV S
Seattle Barrel Company 4716 Airport Wy S
bloch steellncorp. 4580 colorado av s
alaskan copper & brass 4700 colorado av s
FLEETPRIDE 5400 2ND AV S
SEATTLE CYCLE CENTER INC 3320 BEACON AV S
EVERGREEN TOWNCAR SERVICE 4337 12TH AV S
TRE TRUCKING INC. 154113TH AV S
owl transfer co. 3623 6th av s
I & w food corp 923 s bayview st
seattle public utilities paint shop 3641 2nd av s
LAKE CITY TRAVEL 2800 16TH AV S
HUSKY INTERNATIONAL TRUCK 4786 1ST AV S
HUSKY INTERNATIONAL TRUCK 47861ST AV S
SKW MASTER BUILDERS INC 4501 E MARGINAL WY S
FLICKER FORGE 4512 14TH AV S
ISLAND CORPORATION INC 2704 BEACON AV S
diag bus all 3-04-02 new.xls dlag 1 of 8 03/25/2002
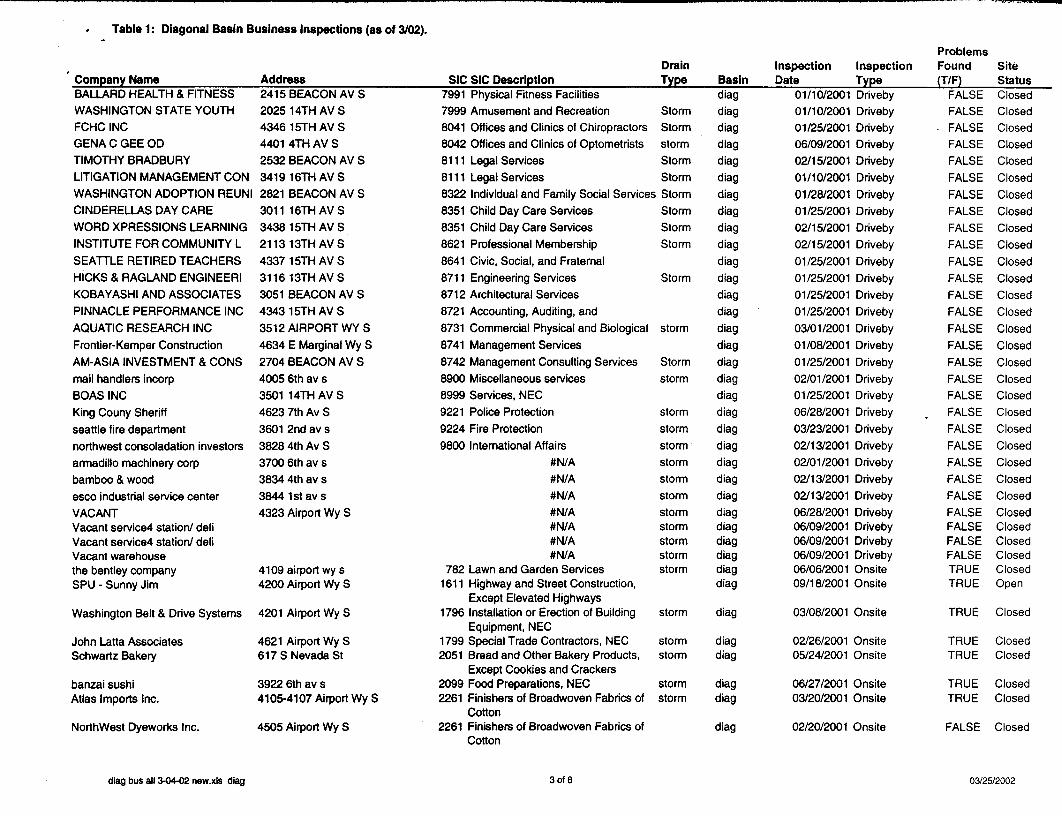
.,,_h.,·$.,.)~_ M.E
Table 1: Diagonal Basin Business Inspections (as of 3102).
ProblemsDrain Inspection Inspection Found Site
Company Name Address SIC SIC Description Type Basin Date Type (T/F) StatusBALLARD HEALTH & FITNESS 2415 BEACON AV S 7991 Physical Fitness Facilities diag 01/10/2001 Driveby FALSE Closed
WASHINGTON STATE YOUTH 2025 14TH AV S 7999 Amusement and Recreation Storm diag 01/10/2001 Driveby FALSE Closed
FCHC INC 4346 15TH AV S 8041 Offices and Clinics of Chiropractors Storm diag 01/25/2001 Driveby FALSE Closed
GENACGEEOD 4401 4THAV S 8042 Offices and Clinics of Optometrists storm dlag 06/09/2001 Driveby FALSE Closed
TIMOTHY BRADBURY 2532 BEACON AV S 8111 Legal Services Storm diag 02/15/2001 Driveby FALSE Closed
LITIGATION MANAGEMENT CON 3419 16TH AV S 8111 Legal Services Storm diag 01/10/2001 Driveby FALSE Closed
WASHINGTON ADOPTION REUNI 2821 BEACON AV S 8322 Individual and Family Social Services Storm diag 01/2812001 Driveby FALSE Closed
CINDERELLAS DAY CARE 3011 16TH AV S 8351 Child Day Care Services Storm diag 01/25/2001 Driveby FALSE Closed
WORD XPRESSIONS LEARNING 3438 15TH AV S 8351 Child Day Care Services Storm diag 02/15/2001 Driveby FALSE Closed
INSTITUTE FOR COMMUNITY L 2113 13TH AV S 8621 Professional Membership Storm diag 02/15/2001 Driveby FALSE Closed
SEATILE RETIRED TEACHERS 4337 15TH AV S 8641 Civic, Social, and Fraternal diag 01/25/2001 Driveby FALSE Closed
HICKS & RAGLAND ENGINEERI 311613TH AV S 8711 Engineering Services Storm diag 01/25/2001 Driveby FALSE Closed
KOBAYASHI AND ASSOCIATES 3051 BEACON AV S 8712 Architectural Services diag 01/25/2001 Driveby FALSE Closed
PINNACLE PERFORMANCE INC 4343 15TH AV S 8721 Accounting, Auditing, and diag 01/25/2001 Driveby FALSE Closed
AQUATIC RESEARCH INC 3512 AIRPORT WY S 8731 Commercial Physical and Biological storm diag 03/01/2001 Driveby FALSE Closed
Frontier-Kemper Construction 4634 E Marginal Wy S 8741 Management Services diag 01/0812001 Driveby FALSE Closed
AM-ASIA INVESTMENT & CONS 2704 BEACON AV S 8742 Management Consulting Services Storm diag 01/25/2001 Driveby FALSE Closed
mail handlers incorp 4005 6th av s 8900 Miscellaneous services storm diag 02/01/2001 Driveby FALSE Closed
BOAS INC 3501 14TH AV S 8999 Services. NEC diag 01/25/2001 Driveby FALSE Closed
King Couny Sheriff 4623 7th Av S 9221 Police Protection storm diag 06/28/2001 Driveby FALSE Closed
seattle fire department 3601 2nd av s 9224 Fire Protection storm diag 03/2312001 Driveby FALSE Closed
northwest consoladation investors 3828 4th Av S 9800 International Affairs storm diag 02/13/2001 Driveby FALSE Closed
armadillo machinery corp 3700 6th av s #N/A storm diag 02101/2001 Driveby FALSE Closed
bamboo & wood 3834 4th av s #N/A storm diag 02/13/2001 Driveby FALSE Closed
esco industrial service center 3844 1st av s #N/A storm diag 02/1312001 Driveby FALSE Closed
VACANT 4323 Airport Wy S #N/A storm diag 06/28/2001 Driveby FALSE ClosedVacant service4 station! deli #N1A storm diag 06/09/2001 Driveby FALSE ClosedVacant service4 station! deli #N/A storm diag 06/09/2001 Driveby FALSE ClosedVacant warehouse #N/A storm diag 06/09/2001 Driveby FALSE Closedthe bentley company 4109 airport wy s 782 Lawn and Garden Services storm diag 06/0612001 Onsite TRUE Closed
SPU - Sunny Jim 4200 Airport Wy S 1611 Highway and Street Construction, diag 09/18/2001 Onsite TRUE OpenExcept Elevated Highways
Washington Belt & Drive Systems 4201 Airport Wy S 1796 Installation or Erection of Building storm diag 03/08/2001 Onsite TRUE ClosedEquipment. NEC
John Latta Associates 4621 Airport Wy S 1799 Special Trade Contractors, NEC storm diag 02/26/2001 Onsite TRUE ClosedSchwartz Bakery 617 S Nevada St 2051 Bread and Other Bakery Products, storm diag 05/24/2001 Onsite TRUE Closed
Except Cookies and Crackersbanzai sushi 3922 6th av s 2099 Food Preparations. NEC storm diag 06/27/2001 Onsite TRUE ClosedAtlas Imports Inc. 4105-4107 Airport Wy S 2261 Finishers of Broadwoven Fabrics of storm diag 03/20/2001 Onsite TRUE Closed
CottonNorthWest Dyeworks Inc. 4505 Airport Wy S 2261 Finishers of Broadwoven Fabrics of diag 02/20/2001 Onsile FALSE Closed
Cotton
dlag bus 8113-04-02 new.xls dlag 3018 03125/2002

Table 1: Diagonal Basin Business Inspections (as of 3/02).
ProblemsDrain Inspection Inspection Found Site
Company Name Address SIC SIC Description Type Basin Date Type (T/F) StatusK& K Inc. 22 S Idaho St 5021 Furniture storm diag 02/2212001 Onsite FALSE ClosedGeorge S Schuster Co Inc 12 S Idaho St 5030 Home Furnishings storm diag 02/14/2001 Onsite FALSE ClosedPrecision Welder & Engine Repair 4429 Airport Wy S 5084 Industrial Machinery and Equipment storm diag 03/08/2001 Onsite TRUE Closedsea-dru-nar 3844 1st av s 5093 Scrap and Waste Materials storm diag 02/1312001 Onsite TRUE ClosedMallory and Church 676 S Industrial Wy 5136 Men's and Boys' Clothing and storm diag 05/21/2001 Onsite TRUE Closed
FurnishingsMallory and Church 633 S Snoqualmie St 5136 Men's and Boys' Clothing and storm diag 06/04/2001 Onsite TRUE Closed
FurnishingsKustom Foods - Seasia 651 S Industrial Wy 5141 Groceries, General Line storm diag 05/2212001 Onsite TRUE ClosedSeasia 4601 6th Av S 5142 Packaged Frozen Foods storm diag 05/17/2001 Onsite TRUE ClosedPlymouth Poultry Company 4500 7thAv S 5144 Poultry and Poultry Products storm diag 02/27/2001 Onsite TRUE Closedpacific food inports 2323 airport wy s 5149 Groceries and Related Products, storm diag 06/29/2001 Onsite TRUE Closed
NECWestern Washinton Beverage 4201 6th Av S 5181 Beer and Ale storm diag 05/31/2001 Onsite TRUE ClosedGeneral Tool & Supply Company 601 S Alaska St 5251 Hardware Stores storm diag 06/07/2001 Onsite TRUE ClosedChemical Distributors, Inc (CDI) 20 S Idaho St 5300 General merchandise stores storm diag 02/14/2001 Onsite FALSE Closedthe anywear shoe industry 14 S Idaho St 5300 General merchandise stores storm diag 02/14/2001 Onsite FALSE Closedcascade designs 4000 1st av s 5300 General merchandise stores storm diag 02/13/2001 Onsite TRUE ClosedCOSTCO WHOLESALE 4401 4TH AV S 5331 Variety Stores storm diag 06/20/2001 Onsite TRUE ClosedCOSTCO WHOLESALE 44014TH AV S 5399 Miscellaneous General Merchandise storm diag 06/20/2001 Onsite TRUE Closed
StoresHILLTOP RED APPLE MARKET 2301 S JACKSON ST 5411 Grocery Stores Storm diag 03/09/2001 Onsite TRUE ClosedOversea Casing 601 S Nevada St 5422 Meat and Fish (Seafood) Markets, storm diag 06/13/2001 Onsite TRUE Closed
Including Freezer ProvisionersBorracchini's Fine Foods 619 S Nevada St 5499 Miscellaneous Food Stores storm diag 06/13/2001 Onsite TRUE ClosedExxon Self Service Station & Mini ME 3002 Beacon Ave S 5541 Gasoline Service Stations Storm diag 06/21/2001 Onsite TRUE ClosedShell Self Serve & Mini Mart 2415 Beacon Ave S 5541 Gasoline Service Stations Storm Lander 03/19/2001 Onsile TRUE ClosedTexaco selfservice gas Carwash & IT 2424 Beacon Ave S 5541 Gasoline Service Stations Storm Lander 03/19/2001 Onsite TRUE ClosedISGOOD WOODWORKS 4660 E MARGINAL WY S 5712 Furniture Stores storm diag 06/15/2001 Onsite TRUE ClosedPALACE OF CHINA RESTAURAN 2704 BEACON AV S 5812 Eating and Drinking Places Alley diag 07/15/2001 Onsite TRUE Closed
L.N. Curtis & Sons 629 S Industrial Wy 5999 Miscellaneous Retail Stores, NEC storm diag 06/1312001 Onsite TRUE Closed
Key Bank 4323 Airport Wy S 6021 National Commercial Banks storm diag 11/06/2001 Onsite TRUE Open
Flowserve 615 S Alaska St 7219 Laundry and Garment Services, NEC storm diag 05/16/2001 Onsite TRUE Closed
ak media/northwest 3601 6th Av S 7336 Commercial Art and Graphic Design storm diag 10/1212000 Onsile TRUE Closed
Evergreen Tractor Inc. 720 s forest st 7353 Heavy Construction Equipment storm diag 05/01/2001 Onsite TRUE OpenRental and Leasing
Totem Equipment Company 5000 E MARGINAL WY S 7353 Heavy Construction Equipment storm diag 06/14/2001 Onsile TRUE ClosedRental and Leasing
Auto-Chlor 4315 7th Av S 7359 Equipment Rental and Leasing, NEC storm diag 04/05/2001 Onsite TRUE Closed
Global Fulfillment 4-6 S Idaho St 7372 Prepackaged Software storm diag 03/29/2001 Onsite FALSE Closedheiser truck bodie,repair & paint 725 s Hanford st 7532 Top, Body, and Upholstery Repair combined diag 02/21/2001 Onsite TRUE Closed
Shops and Paint Shopssafelite auto glass 665 s dakota st 7536 Automotive Glass Replacement storm diag 06/0612001 Onsite TRUE Closed
Shops
diag bus all 3-04-02 new.xls diag 501 B 03/25/2002

Table 1: Diagonal Basin Business Inspections (as of 3102).
Problems
• Drain Inspection Inspection Found SiteCompany Name Address SIC SIC Description Type Basin Date Type (T/F) StatusPARAGON DISTRIBUTING INC 3232 8TH AV S 5084 Industrial Machinery and Equipment storm diag FALSE OpenDOUBLE E FOODS LLC 3922 6TH AV S 5141 Groceries. General Line storm diag FALSE OpenWINNERWAY AMERICAN CORPOF815 SWELLER ST 5149 Groceries and Related Products, combined diag FALSE Open
NECTSUE CHONG CO 3623 6TH AV S 5149 Groceries and Related Products, storm diag FALSE Open
NECSKAGIT PETROLEUM 802 S DEARBORN ST 5172 Petroleum and Petroleum Products combined diag FALSE Open
Wholesalers, Except Bulk Stationsand Terminals
EVERGREEN WHOLESALE FLORI 3217 AIRPORT WY S 5193 Flowers, Nursery Stock, and Florists' combined diag FALSE OpenSupplies
ACTION FASHIONS 410 8THAV S 5699 Miscellaneous Apparel and combined diag FALSE OpenAccessory Stores
FARWEST PAPER FLOW INC 3706 AIRPORT WY S 5734 Computer and Computer Software combined diag FALSE OpenStores
SILVER STREAK SANDWICH EX 38384TH AV S 5812 Eating and Drinking Places storm diag FALSE OpenRISTORANTE MACHIAVELLI 660 S ANDOVER ST 5812 Eating and Drinking Places combined diag FALSE OpenUGLY MUG CAFE 3707 AIRPORT WY S 5812 Eating and Drinking Places storm diag FALSE OpenCITY CENTER CARDS & SUNDR 815 SWELLER ST 5947 Gift, Novelty, and Souvenir Shops combined diag FALSE OpenW H SMITH HOTEL SERVICES 34544TH AV S 5947 Gift, Novelty, and Souvenir Shops combined diag FALSE OpenNORSE IMPORTS 3801 AIRPORT WY S 5947 Gift, Novelty, and Souvenir Shops combined diag FALSE OpenUNIQUE ART FRAMING 3429 AIRPORT WY S 5999 Miscellaneous Retail Stores, NEC combined diag FALSE OpenE JAY BOND & ASSOCIATES 3407 AIRPORT WY S 6411 Insurance Agents, Brokers, and storm diag FALSE Open
ServiceNORTHGATE CLEANERS 414 8TH AV S 7211 Power Laundries, Family and combined diag FALSE Open
CommercialAMERICANA PORTRAITS INC 4005 6TH AV S 7221 Photographic Studios, Portrait storm diag FALSE Open
REPROGRAPHICS NORTHWEST 6168THAVS 7334 Photocopying and Duplicating combined diag FALSE OpenServices
CRANE SYSTEMS INC 3614 6TH AV S 7353 Heavy Construction Equipment storm diag FALSE OpenRental and Leasing
BEXEL CORPORATION 33144TH AV S 7359 Equipment Rental and Leasing, NEC combined diag FALSE Open
ONSITE TECHNICAL SERVICES 1400 AIRPORT WY S 7378 Computer Maintenance and Repair combined diag FALSE Open
ROSENTHAL GROUP THE INC 3223 6TH AV S 7389 Business Services, NEC storm diag FALSE Open
JEREVAINC 3619 7TH AV S 7514 Passenger Car Rental storm diag FALSE Open
SEATILE PUPPETORY THEATRE 3700 6TH AV S 7929 Bands, Orchestras, Actors, and storm diag FALSE OpenOther Entertainers and EntertainmentGroups
GREATER SEATILE SCCER LE 36134TH AV S 7941 Professional Sports Clubs and storm diag FALSE OpenPromoters
RICHARD BENSINGER MD 4000 1ST AV S 8011 Offices and Clinics of Doctors of storm diag FALSE OpenMedicine
PACIFIC MEDICAL CENTER 620 S JACKSON ST 8011 Offices and Clinics of Doctors of combined diag FALSE OpenMedicine
PACIFIC MEDICAL CENTER 620 S JACKSON ST 8011 Offices and Clinics of Doctors of combined diag FALSE OpenMedicine
dlag bus all 3-04·02 new.xls dlag 7018 03/25/2002
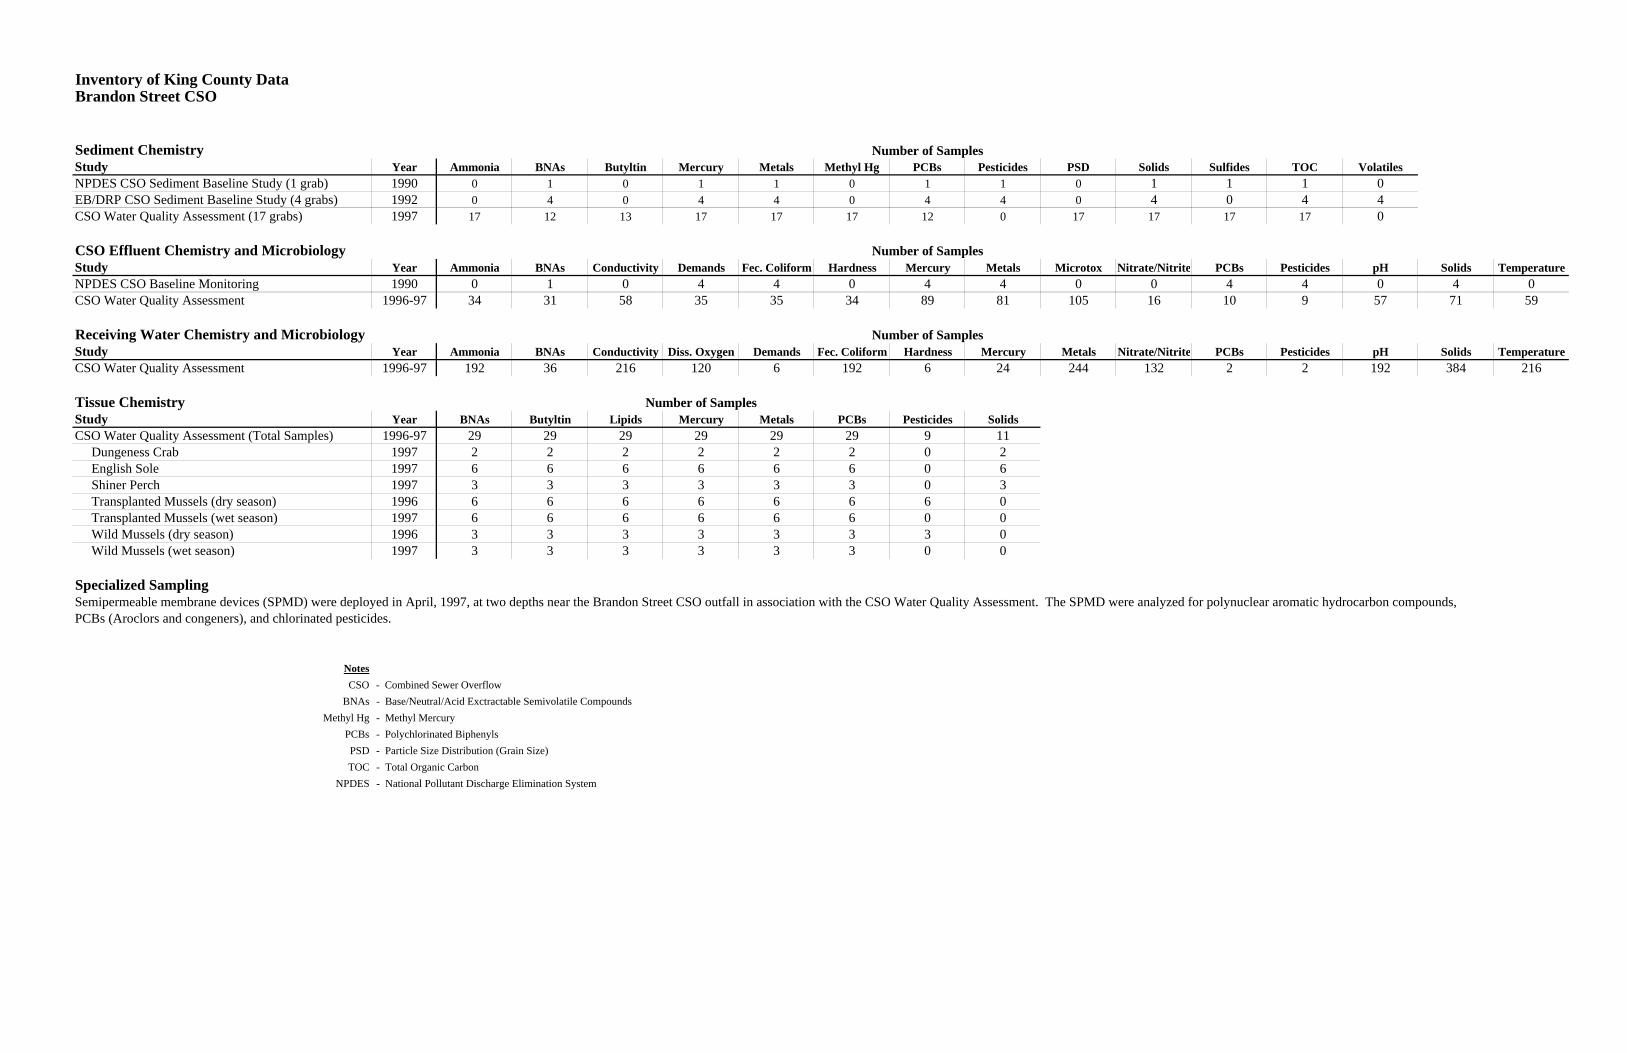
Inventory of King County DataBrandon Street CSO
Sediment ChemistryStudy Year Ammonia BNAs Butyltin Mercury Metals Methyl Hg PCBs Pesticides PSD Solids Sulfides TOC VolatilesNPDES CSO Sediment Baseline Study (1 grab) 1990 0 1 0 1 1 0 1 1 0 1 1 1 0EB/DRP CSO Sediment Baseline Study (4 grabs) 1992 0 4 0 4 4 0 4 4 0 4 0 4 4CSO Water Quality Assessment (17 grabs) 1997 17 12 13 17 17 17 12 0 17 17 17 17 0
CSO Effluent Chemistry and Microbiology Number of SamplesStudy Year Ammonia BNAs Conductivity Demands Fec. Coliform Hardness Mercury Metals Microtox Nitrate/Nitrite PCBs Pesticides pH Solids TemperatureNPDES CSO Baseline Monitoring 1990 0 1 0 4 4 0 4 4 0 0 4 4 0 4 0CSO Water Quality Assessment 1996-97 34 31 58 35 35 34 89 81 105 16 10 9 57 71 59
Receiving Water Chemistry and Microbiology Number of SamplesStudy Year Ammonia BNAs Conductivity Diss. Oxygen Demands Fec. Coliform Hardness Mercury Metals Nitrate/Nitrite PCBs Pesticides pH Solids TemperatureCSO Water Quality Assessment 1996-97 192 36 216 120 6 192 6 24 244 132 2 2 192 384 216
Tissue Chemistry Number of SamplesStudy Year BNAs Butyltin Lipids Mercury Metals PCBs Pesticides SolidsCSO Water Quality Assessment (Total Samples) 1996-97 29 29 29 29 29 29 9 11 Dungeness Crab 1997 2 2 2 2 2 2 0 2 English Sole 1997 6 6 6 6 6 6 0 6 Shiner Perch 1997 3 3 3 3 3 3 0 3 Transplanted Mussels (dry season) 1996 6 6 6 6 6 6 6 0 Transplanted Mussels (wet season) 1997 6 6 6 6 6 6 0 0 Wild Mussels (dry season) 1996 3 3 3 3 3 3 3 0 Wild Mussels (wet season) 1997 3 3 3 3 3 3 0 0
Specialized SamplingSemipermeable membrane devices (SPMD) were deployed in April, 1997, at two depths near the Brandon Street CSO outfall in association with the CSO Water Quality Assessment. The SPMD were analyzed for polynuclear aromatic hydrocarbon compounds,PCBs (Aroclors and congeners), and chlorinated pesticides.
NotesCSO - Combined Sewer Overflow
BNAs - Base/Neutral/Acid Exctractable Semivolatile CompoundsMethyl Hg - Methyl Mercury
PCBs - Polychlorinated BiphenylsPSD - Particle Size Distribution (Grain Size)TOC - Total Organic Carbon
NPDES - National Pollutant Discharge Elimination System
Number of Samples

Inventory of King County DataChelan Avenue CSO
Sediment ChemistryStudy Year Ammonia AVS/SEM BNAs Butyltin Mercury Metals PCBs Pesticides PSD Solids Sulfides TOCNPDES CSO Baseline Sediment Study (6 grabs) 1995 6 1 6 0 6 6 6 6 6 6 6 6EB/DRP Chelan Storm Drain Sediment Study (3 grabs) 1995 0 0 3 3 3 3 3 3 3 3 0 3NPDES CSO Baseline Sediment Study (2 grabs) 1996 0 0 2 0 2 2 2 0 2 2 0 2
Sediment Bioassays Number of SamplesStudy Year Amphipod Echinoderm PolychaeteNPDES CSO Baseline Sediment Study (5 grabs) 1996 5 5 5
CSO Effluent Chemistry and Microbiology Number of SamplesStudy Year Ammonia BNAs Conductivity Demands Fec. Coliform Hardness Mercury Metals Microtox Nitrate/Nitrite PCBs Pesticides pH SolidsNPDES CSO Baseline Monitoring 1994-95 0 1 0 3 3 0 3 3 0 0 1 1 0 3CSO Water Quality Assessment 1996-97 22 22 23 22 22 23 23 23 22 12 1 1 23 38
Receiving Water Chemistry and MicrobiologyStudy Year Ammonia BNAs Conductivity Diss. Oxygen Fec. Coliform Mercury Metals Nitrate/Nitrite pH Solids TemperatureStream Monitoring Station 0305 1988-2001 204 0 204 274 202 0 0 203 204 204 202CSO Water Quality Assessment 1996-97 192 42 234 120 192 121 234 22 192 192 240
Current MetersAn accoustic doppler velocity profiler (ADVP) current meter was deployed in the vicinity of the Chelan Avenue CSO for a period of 12 months from August, 1996 to August, 1997, in association with the CSO Water Quality Assessment.
Hydrolab® DatasondesThree Hydrolab® Datasondes were deployed in the vicinity of the Chelan Avenue CSO to collect salinity, temperature, turbidity, and depth data for a period of 12 months from August, 1996 to August, 1997, in association with the CSO Water Quality Assessment.
NotesCSO - Combined Sewer Overflow
AVS/SEM - Acid Volatile Sulfides/Simultaneously Extractable MetalsBNAs - Base/Neutral/Acid Exctractable Semivolatile CompoundsPCBs - Polychlorinated BiphenylsPSD - Particle Size Distribution (Grain Size)TOC - Total Organic Carbon
NPDES - National Pollutant Discharge Elimination System
Number of Samples
Number of Samples

Inventory of King County DataHanford Street CSO
Sediment ChemistryStudy Year Ammonia AVS/SEM BNAs Mercury Metals PCBs Pesticides PSD Solids Sulfides TOCNPDES CSO Baseline Sediment Study (7 grabs) 1995 7 1 7 7 7 7 7 7 7 7 7NPDES CSO Baseline Sediment Study (3 grabs) 1996 0 0 3 3 3 3 0 3 3 0 3
Sediment Bioassays Number of SamplesStudy Year Amphipod Echinoderm PolychaeteNPDES CSO Baseline Sediment Study (6 grabs) 1996 6 6 6
CSO Effluent Chemistry and Microbiology Number of SamplesStudy Year Ammonia BNAs Conductivity Demands Fec. Coliform Hardness Mercury Metals Microtox Nitrate/Nitrite PCBs Pesticides pH Solids TemperatureCSO Water Quality Assessment 1996-97 24 24 35 29 20 24 57 63 99 13 6 6 35 62 39
Receiving Water Chemistry and MicrobiologyStudy Year Ammonia BNAs Conductivity Diss. Oxygen Fec. Coliform Mercury Metals Nitrate/Nitrite pH Solids TemperatureCSO Water Quality Assessment 1996-97 192 42 192 120 192 24 234 132 192 384 192
Tissue ChemistryStudy Year BNAs Butyltin Lipids Mercury Metals PCBs PesticidesCSO Water Quality Assessment (Total Samples) 1996-97 6 6 6 6 6 6 3 Wild Mussels (dry season) 1996 3 3 3 3 3 3 3 Wild Mussels (wet season) 1997 3 3 3 3 3 3 0
NotesCSO - Combined Sewer Overflow
AVS/SEM - Acid Volatile Sulfides/Simultaneously Extractable MetalsBNAs - Base/Neutral/Acid Exctractable Semivolatile CompoundsPCBs - Polychlorinated BiphenylsPSD - Particle Size Distribution (Grain Size)TOC - Total Organic Carbon
NPDES - National Pollutant Discharge Elimination System
Number of Samples
Number of Samples
Number of Samples

Inventory of King County DataKing Street CSO
Sediment ChemistryStudy Year BNAs Mercury Metals PCBs SolidsNPDES CSO Sediment Baseline Study (6 grabs) 1988 5 6 6 5 6
CSO Effluent Chemistry and Microbiology Number of SamplesStudy Year Ammonia BNAs Conductivity Demands Fec. Coliform Hardness Mercury Metals Microtox Nitrate/Nitrite PCBs Pesticides pH Solids TemperatureCSO Water Quality Assessment 1996-97 22 22 23 22 18 23 46 46 78 14 7 4 23 47 29
Receiving Water Chemistry and MicrobiologyStudy Year Ammonia Fec. Coliform Nitrate/Nitrite Phosphorus Salinity Silica TemperatureBeach Monitoring Station LTEH02 1988-98 37 163 37 37 32 37 159
Tissue ChemistryStudy Year BNAs Butyltin Lipids Mercury Metals PCBs SolidsCSO Water Quality Assessment 1997 1 1 1 1 1 1 1
NotesCSO - Combined Sewer Overflow
BNAs - Base/Neutral/Acid Exctractable Semivolatile CompoundsPCBs - Polychlorinated Biphenyls
Number of Samples
Number of Samples
Number of Samples

Stormwater vs model
STORMWATER SAMPLESL6478-1 L6744-1 L6714-1 L6744-2 L7049-1 L7074-1 L7133-1 L7204-1 L7300-1 L7300-2 B&C· B&C·
Comm/lndmodel IHghwyInput 9-Jul 16-Aug 11-Aug 16-Aug 27-Sep 2-0ct 10-0ct 20-0ct 8-Nov 8-Nov Sample Avgugll hinds hinds horton horton horton horton horton horton hinds horton avg 1974-81
All usesavg1986-88
117
--:,A.;.;:rs..;..en;.;.;i~c_+-...;,.9.;.;:.5,..;,:.2 3.05 3.11 1.6 3.4 3.71 3.37 1.9 2.24 2.83 2.26 2.75_C_ad_m_i_um_~_1_.4=6 ., ,<dJQ~1i 0.46 0.49 0.61 0.8 0.78 0.33 0.4 0.9 0.61 0.55 2.3 0.8Chromium 13.47 22 3.3 5.9 4.49 5.75 6.01 2.13 2.2 17 3.5 7.23 6.2Copper 43.6 119 41.1 33.8 34.3 54.2 31.8 20.7 20.7 75.4 39 47.00 99 31Lead 65.87 63.4 21.7 8.51 44.1 68.1 61.3 18.3 30.2 42.5 34.8 39.29 377 57f-:-M~e-rc-u-Jry--+-~0.~3-:-1 ~l~m~1""'~;~~i<>t>::~::idl.lljiJMil;m;1IiJ1; 0.32 ~~illlillll~Pk1ili:1llit.!~*\milll~lgili~Nmlli~m:llIJIQI~~1~pJ,,\-,~ __0_._12-+- 1--__-1
Nickel 12.34 34 6.28 12.7 6.89 7.82 6.5 2.96 . 4.37 26.1 4.15 11.18Silver 2.74 0 0 0 0 0.00Zinc 178.8 308 79.2 215 104 135 130 49.8 94.5 255 81.4 145.19 259
B~~ 22 0.79~~111 0.92 0.84~1.~~~?~~~-0~.9+. _--:'0~.5~9~--~---~Bls(2-ethyl} 9.45 6.07 10.1 7 7.09 6.75 5.17 14.7~~@tdl/£~ 3.48 8.11 7.15
I_Shaded cell reported as <MOL, assigned O.5xMOL for average calculations.!~Analysls of Stormwater Monitoring Data, 1989, Steve Merrill

86
3.78.5
0.0258.3
--
5.82212.1752.2
------------- ------
95___________________ --1 _23
Water Quality Criteria (lJgfL)1Fresh2 Marine
Acute i Chro_nJc Acute- Chronic360 190 69 36
--- .----------
0.54 0.28 42 9.4------ -- -- -----------------
129 423.2 2.59.0 0.352.1 0.012
---- . --------.---
316 350.1626 "-- _
- ---
Arsenic- -- - - ----". ------- ---
Cadmium---------
Chromium~opp~,"
Lead~~t"f_ury
Nickel- --
SilverZinc
lCriteria based on total metals.2Fresh water criteria based on hardness of 17 mg CaC03fL.

Draft Cleanup Study Report Page 4-24 Duwamish/Diagonal CSO/SDDecember 26, 2001 Q:\Data\common\Hackney\Cleanup Study Report1\Chapter 4.DOC
• Fails CSL (WAC 173-204-520). The test sediment has a significantly higher (P<0.05)mean mortality than the reference sediment, and the test sediment mean mortality is 30percent greater than the reference sediment.
Amphipod bioassay results are summarized in Table 4.8. Station DUD204 was the only station toexceed SMS biological criteria.
4 . 6 . 24 . 6 . 2 E c h i n o d e r m L a r v a l B i o a s s a yE c h i n o d e r m L a r v a l B i o a s s a y
The sediment larval test using the echinoderm Dendraster excentricus was conducted for seven testsediments, two reference sediments, two control sediments, and one seawater control. The seawatercontrol met the applicable SMS performance criteria for the echinoderm test. SMS interpretive resultswere determined using the following SMS biological effects criteria:
• Fails SQS (WAC 173-204-320). The test sediment has a combined abnormality andmortality that is more than 15 percent greater than the reference sediment, and thedifference is statistically significant (P<0.10).
• Fails CSL (WAC 173-204-520). The test sediment has a combined abnormality andmortality that is more than 30 percent greater than the reference sediment, and thedifference is statistically significant (P<0.10).
Echinoderm bioassay results are summarized in Table 4.8. Station DUD206 was the only station toexceed SMS biological criteria.
Table 4.8 BIOASSAY RESULTS AND SMS INTERPRETATIONAmphipod Bioassay 20-Day Juvenile
PolychaeteEchinoderm Larval
Station ID ReferenceMatch
%Mortality(Mean)
SMSStatus
Growth Rate(Mean)
SMSStatus
%Mort./Abn(Mean)
SMSStatus
Test Sediment P9446-2(Ref)DUD200 P9446-2(Ref) 13 Pass 0.60 Pass 32.46 PassDUD201 P9446-2(Ref) 21 Pass 0.55 Pass 34.55 PassDUD202 P9446-2(Ref) 18 Pass 0.62 Pass 34.97 PassDUD203 P9446-2(Ref) 22 Pass 0.59 Pass 32.83 PassDUD204 P9446-2(Ref) 26* >SQS 0.51 Pass 16.63 PassDUD205 P9446-2(Ref) 19 Pass 0.54 Pass 15.88 PassDUD206 Control B 4 Pass 0.52* >SQS 34.17* >SQS
Controls:P9446-1(Ref) 6b 0.48d 27.06f
P9446-2(Ref) 8b 0.60d 29.04Control A 3a 0.82c 30.96Control B 1a 0.77c 15.24Seawater 11.82e
Footnotes:a Control sample passes performance criteria of <10% mortality