ellen h. chan - university of toronto t-space · 2013-10-31 · abstract development and...
TRANSCRIPT

Development and Characterization of Thermally ConductivePolymeric Composites for Electronic Packaging Applications
by
Ellen H. Chan
A thesis submitted in conformity with the requirementsfor the degree of Master of Applied Science and Engineering
Graduate Department of Mechanical & Industrial EngineeringUniversity of Toronto
Copyright© 2011 by Ellen H. Chan

Abstract
Development and Characterization of Thermally Conductive Polymeric Composites
for Electronic Packaging Applications
Ellen H. Chan
Master of Applied Science and Engineering
Graduate Department of Mechanical & Industrial Engineering
University of Toronto
2011
Advancements in the semiconductor industry have lead to the miniaturization of
components and increased power densities, resulting in thermal management issues.
Due to this shift, finding multifunctional materials with excellent thermal conductivity
and electrical resistivity are becoming increasingly important. For this research thesis,
thermally conductive polymer composites were developed and characterized. In
the first study, a LLDPE matrix was combined with hBN and SiC to determine the
effects of both filler type and filler content. Novel porous composite materials were
also fabricated to align thermally conductive fillers, improving ke f f while significantly
reducing the overall weight. In the second study, PPS was used as a high performance
matrix material and combined with different types of hBN to investigate the effects of
size, shape, and aspect ratio on the composite, as well as the effect of hybrid fillers.
The composites were characterized with respect to their physical, thermal, electrical,
and mechanical properties.
ii

Acknowledgements
I would like to first and foremost thank my co-supervisors Dr. Hani E. Naguib and
Dr. Francis Dawson for the opportunity to conduct my masters as a part of their
laboratories. Their guidance and mentorship throughout the duration of the project
was greatly appreciated.
I would also like to thank my fellow SAPLings (and DUMPLings) for all of the
support and assistance they provided me with over the two years. Thank you for
offering an immense amount of help when I would claim to have ”broken science”. I
would like to especially thank Sunny Leung for coordinating our project and ensuring
we were always on track. My other colleuges: Aaron Price, Linus Leung, Christine
Chan, Reza Rizvi, Eunji In, Choonghee Jo, Dina Badawy, Shahrzad Ghaffari, and Omer
Khan.
To my family and friends. Thank you very much for keeping me sane, always
encouraging and constantly reassuring me that the seemingly endless amount of work
would all get done. My friends, thank you for keeping my mind stimulated, my belly
full, and my body pumped full of caffeine. Most importantly, I would thank my family:
Mom, Dad, Laura, Teresa, Herman, and Vivi, for always lending an ear, providing me
with sound reasoning and a level headed opinion, and always having confidence in
my abilities. Without all of you I would not have succeeded.
iii

Contents
1 Introduction 1
1.1 Electronic Packaging Materials . . . . . . . . . . . . . . . . . . . . . . . . 2
1.2 Thesis Objectives . . . . . . . . . . . . . . . . . . . . . . . . . . . . . . . . 3
1.3 Thesis Organization . . . . . . . . . . . . . . . . . . . . . . . . . . . . . . . 4
2 Background and Literature Survey 6
2.1 Electronic Packaging . . . . . . . . . . . . . . . . . . . . . . . . . . . . . . 6
2.2 Thermally Conductive Materials . . . . . . . . . . . . . . . . . . . . . . . 8
2.3 Electrically Insulating Materials . . . . . . . . . . . . . . . . . . . . . . . . 11
2.4 Polymer/Ceramic Composites . . . . . . . . . . . . . . . . . . . . . . . . . 12
2.4.1 Fabrication Methods . . . . . . . . . . . . . . . . . . . . . . . . . . 13
2.4.2 Common Issues . . . . . . . . . . . . . . . . . . . . . . . . . . . . . 13
2.4.3 Lessons Learned . . . . . . . . . . . . . . . . . . . . . . . . . . . . 14
2.5 Foamed Composite Materials . . . . . . . . . . . . . . . . . . . . . . . . . 15
2.6 Micromechanical Modelling . . . . . . . . . . . . . . . . . . . . . . . . . . 17
2.6.1 Basic Models: Series, Parallel and Geometric Mean Models . . . . 18
2.6.2 Maxwell Theoretical Model . . . . . . . . . . . . . . . . . . . . . . 19
2.6.3 Bruggeman Theoretical Model . . . . . . . . . . . . . . . . . . . . 19
2.6.4 Lewis and Nielsen Theoretical Model . . . . . . . . . . . . . . . . 19
2.7 Summary . . . . . . . . . . . . . . . . . . . . . . . . . . . . . . . . . . . . . 20
iv

3 Fabrication and Characterization 22
3.1 Material Selection . . . . . . . . . . . . . . . . . . . . . . . . . . . . . . . . 22
3.1.1 Matrix Materials . . . . . . . . . . . . . . . . . . . . . . . . . . . . 22
3.1.2 Filler Materials . . . . . . . . . . . . . . . . . . . . . . . . . . . . . 23
3.2 Fabrication Techniques . . . . . . . . . . . . . . . . . . . . . . . . . . . . . 25
3.2.1 Melt-Blend Process . . . . . . . . . . . . . . . . . . . . . . . . . . . 25
3.2.2 Dry-Blend Process . . . . . . . . . . . . . . . . . . . . . . . . . . . 27
3.3 Characterization Techniques . . . . . . . . . . . . . . . . . . . . . . . . . . 27
3.3.1 Thermal Properties . . . . . . . . . . . . . . . . . . . . . . . . . . . 27
3.3.2 Electrical Properties . . . . . . . . . . . . . . . . . . . . . . . . . . 29
3.3.3 Mechanical Properties . . . . . . . . . . . . . . . . . . . . . . . . . 30
3.3.4 Morphology . . . . . . . . . . . . . . . . . . . . . . . . . . . . . . . 30
4 LLDPE Based Composites 34
4.1 The Effect of Different Types of Filler . . . . . . . . . . . . . . . . . . . . . 34
4.1.1 Thermal Properties . . . . . . . . . . . . . . . . . . . . . . . . . . . 35
4.1.2 Electrical Properties . . . . . . . . . . . . . . . . . . . . . . . . . . 38
4.1.3 Mechanical Properties . . . . . . . . . . . . . . . . . . . . . . . . . 39
4.1.4 Morphology . . . . . . . . . . . . . . . . . . . . . . . . . . . . . . . 42
4.1.5 Micromechanical Modelling . . . . . . . . . . . . . . . . . . . . . . 45
4.1.6 Summary . . . . . . . . . . . . . . . . . . . . . . . . . . . . . . . . 49
4.2 The Effect of Content . . . . . . . . . . . . . . . . . . . . . . . . . . . . . . 49
4.2.1 Thermal Properties . . . . . . . . . . . . . . . . . . . . . . . . . . . 50
4.2.2 Electrical Properties . . . . . . . . . . . . . . . . . . . . . . . . . . 51
4.2.3 Mechanical Properties . . . . . . . . . . . . . . . . . . . . . . . . . 53
4.2.4 Morphology . . . . . . . . . . . . . . . . . . . . . . . . . . . . . . . 55
4.2.5 Micromechanical Modelling . . . . . . . . . . . . . . . . . . . . . . 55
4.2.6 Summary . . . . . . . . . . . . . . . . . . . . . . . . . . . . . . . . 59
v

4.3 Comparison of Mixing Techniques . . . . . . . . . . . . . . . . . . . . . . 60
4.4 The Effect of Porosity . . . . . . . . . . . . . . . . . . . . . . . . . . . . . . 61
4.4.1 Morphology . . . . . . . . . . . . . . . . . . . . . . . . . . . . . . . 63
4.4.2 Thermal Conductivity . . . . . . . . . . . . . . . . . . . . . . . . . 70
4.4.3 Summary . . . . . . . . . . . . . . . . . . . . . . . . . . . . . . . . 73
5 PPS Based Composites 77
5.1 The Effect of Filler Size and Shape . . . . . . . . . . . . . . . . . . . . . . 77
5.1.1 Thermal Properties . . . . . . . . . . . . . . . . . . . . . . . . . . . 78
5.1.2 Electrical Properties . . . . . . . . . . . . . . . . . . . . . . . . . . 80
5.1.3 Mechanical Properties . . . . . . . . . . . . . . . . . . . . . . . . . 80
5.1.4 Morphology . . . . . . . . . . . . . . . . . . . . . . . . . . . . . . . 84
5.1.5 Micromechanical Modelling . . . . . . . . . . . . . . . . . . . . . . 84
5.1.6 Summary . . . . . . . . . . . . . . . . . . . . . . . . . . . . . . . . 88
5.2 The Effect of Hybrid Fillers . . . . . . . . . . . . . . . . . . . . . . . . . . 88
5.2.1 Thermal Properties . . . . . . . . . . . . . . . . . . . . . . . . . . . 89
5.2.2 Electrical Properties . . . . . . . . . . . . . . . . . . . . . . . . . . 91
5.2.3 Mechanical Properties . . . . . . . . . . . . . . . . . . . . . . . . . 91
5.2.4 Morphology . . . . . . . . . . . . . . . . . . . . . . . . . . . . . . . 96
5.2.5 Summary . . . . . . . . . . . . . . . . . . . . . . . . . . . . . . . . 96
5.3 Comparison of Matrix Materials . . . . . . . . . . . . . . . . . . . . . . . 98
5.3.1 Micromechanical Modelling . . . . . . . . . . . . . . . . . . . . . . 100
5.4 Other Studies . . . . . . . . . . . . . . . . . . . . . . . . . . . . . . . . . . 101
5.4.1 The Effect of a Coupling Agent . . . . . . . . . . . . . . . . . . . . 101
6 Conclusions and Recommendations 106
6.1 Conclusions . . . . . . . . . . . . . . . . . . . . . . . . . . . . . . . . . . . 106
6.2 Recommendations . . . . . . . . . . . . . . . . . . . . . . . . . . . . . . . 109
vi

Bibliography 111
vii

List of Tables
2.1 Thermal conductivity (k)-values of common materials at room temper-
ature. . . . . . . . . . . . . . . . . . . . . . . . . . . . . . . . . . . . . . . . 10
3.1 Physical Properties of the Matrix Materials . . . . . . . . . . . . . . . . . 26
3.2 Physical Properties of the Filler Materials. . . . . . . . . . . . . . . . . . . 26
4.1 LLDPE-hBN-SiC Compositions . . . . . . . . . . . . . . . . . . . . . . . . 36
4.2 Porous LLDPE-hBN Compositions . . . . . . . . . . . . . . . . . . . . . . 64
5.1 PPS-hBN Hybrid Compositions . . . . . . . . . . . . . . . . . . . . . . . . 89
5.2 Comparison between PPS and LLDPE Matrix Materials on k . . . . . . . 99
5.3 TGA analysis of hBN weight loss upon heating to 900 °C . . . . . . . . . 105
viii

List of Figures
1.1 Schematic of modified heat sink to include electrically resistive composite. 3
2.1 Examples of types of electronic packaging, (a) integrated circuits (b)
electronic chips (c) liquid epoxy encapsulation [1]. . . . . . . . . . . . . . 8
2.2 Electrical conductivity (S/cm). . . . . . . . . . . . . . . . . . . . . . . . . . 12
3.1 Variations of Boron Nitride. (a) PTX25, (b) PTX60, (c) PT371, and (d)
PT110. . . . . . . . . . . . . . . . . . . . . . . . . . . . . . . . . . . . . . . 26
3.2 Flow Chart of Composite Processing. . . . . . . . . . . . . . . . . . . . . . 28
3.3 Thermal Conductivity Analyzer Setup. . . . . . . . . . . . . . . . . . . . 33
4.1 Thermal conductivity (k) of LLDPE-hBN-SiC composites. . . . . . . . . . 36
4.2 Coefficient of thermal expansion (CTE) of LLDPE-hBN-SiC composites. 38
4.3 Electrical properties of LLDPE-hBN-SiC composites. . . . . . . . . . . . . 40
4.4 Compressive elastic modulus (E) of LLDPE-hBN-SiC composites. . . . . 43
4.5 Compressive strength (σy) of LLDPE-hBN-SiC composites. . . . . . . . . 43
4.6 SEM Images of LLDPE-based composites containing (a) 2.46VF SiC
(b) 5.34VF SiC, (c) 9.36VF SiC (d) 33.3VF SiC . . . . . . . . . . . . . . . . 44
4.7 LLDPE-33VF SiC at 350×magnification. . . . . . . . . . . . . . . . . . . . 44
4.8 SEM images of LLDPE-based composites containing (a) 2.46VF hBN
(b) 5.34VF hBN, (c) 9.36VF hBN (d) 33.3VF hBN. . . . . . . . . . . . . . . 46
4.9 LLDPE-33VF hBN at 1,500×magnification. . . . . . . . . . . . . . . . . . 46
ix

4.10 SEM images of LLDPE-based composites containing 33VF hBN and
(a) 2.46VF SiC (b) 5.34VF SiC, (c) 9.36VF SiC at 100×magnification, and
(d) 9.36VF SiC at 350×magnification. . . . . . . . . . . . . . . . . . . . . . 47
4.11 Theoretical predictions compared to experimental data for the effect of
different fillers (a) hBN, and (b) SiC. . . . . . . . . . . . . . . . . . . . . . 48
4.12 Thermal conductivity (k) of LLDPE-hBN composites with varying filler
content. . . . . . . . . . . . . . . . . . . . . . . . . . . . . . . . . . . . . . . 52
4.13 Coefficient of thermal expansion (CTE) of LLDPE-hBN composites with
varying filler content. . . . . . . . . . . . . . . . . . . . . . . . . . . . . . . 52
4.14 Electrical properties of LLDPE-hBN composites with varying filler con-
tent. (a) electrical impedance, and (b) electrical conductivity. . . . . . . . 54
4.15 Elastic compressive modulus (E) of LLDPE-hBN composites with vary-
ing filler content. . . . . . . . . . . . . . . . . . . . . . . . . . . . . . . . . 56
4.16 Compressive strength (σy) of LLDPE-hBN composites with varying filler
content. . . . . . . . . . . . . . . . . . . . . . . . . . . . . . . . . . . . . . . 56
4.17 SEM Images of LLDPE-hBN composites with different filler content at
varying magnifications. . . . . . . . . . . . . . . . . . . . . . . . . . . . . 57
4.18 Theoretical predictions compared to experimental data for the effect of
content study. . . . . . . . . . . . . . . . . . . . . . . . . . . . . . . . . . . 59
4.19 Thermal Conductivity (k) of LLDPE-hBN composites fabricated using
various processing techniques. . . . . . . . . . . . . . . . . . . . . . . . . 62
4.20 SEM Images of LLDPE Foamed Composites with varying amounts of
microspheres, containing 33 vol.% with 20 and 40 void percent. . . . . . 66
4.21 SEM Images of LLDPE Foamed Composites with varying amounts of
microspheres, containing 50 vol.% with 20 and 40 void percent. . . . . . 67
4.22 SEM Images of LLDPE Foamed Composites with varying residence
time, containing 33 vol.% with 20 and 40 void percent. . . . . . . . . . . . 68
x

4.23 SEM Images of LLDPE Foamed Composites with varying residence
time, containing 50 vol.% with 20 and 40 void percent. . . . . . . . . . . . 69
4.24 SEM Images of LLDPE Foamed Composites with 1.5× the calculated
amount of Expancel necessary to fill 20 void% at (a) 250×, and (b) 1,000×
magnification. . . . . . . . . . . . . . . . . . . . . . . . . . . . . . . . . . . 70
4.25 Effect of cell morphology on ke f f of LLDPE-hBN composite foams. (a)
Effect of cell size on ke f f (b) Effect of cell population on ke f f . . . . . . . . . 72
4.26 Effect of foam volume expansion on ke f f of LLDPE-hBN composite foams. 74
4.27 Comparison of ke f f of LLDPE-hBN composite foams to that of LLDPE-
hBN solid composites. . . . . . . . . . . . . . . . . . . . . . . . . . . . . . 74
4.28 Effect of residence time on the foam volume expansion. . . . . . . . . . . 76
5.1 Thermal conductivity (k) of PPS-hBN composites with different size/shape
fillers. . . . . . . . . . . . . . . . . . . . . . . . . . . . . . . . . . . . . . . . 81
5.2 Coefficient of thermal expansion (CTE) for different sizes and shapes of
hBN, above and below the Tg. . . . . . . . . . . . . . . . . . . . . . . . . . 81
5.3 Electrical properties of PPS-hBN composites with different sizes and
shapes of hBN. (a) electrical impedance, and (b) electrical conductivity. . 82
5.4 Compressive elastic modulus (E) of PPS-hBN composites with different
size/shape fillers. . . . . . . . . . . . . . . . . . . . . . . . . . . . . . . . . 85
5.5 Compressive strength (σy) of PPS-hBN composites with different size/shape
fillers. . . . . . . . . . . . . . . . . . . . . . . . . . . . . . . . . . . . . . . . 85
5.6 SEM Images of PPS-hBN composites with different size/shape filler, at
varying magnifications. . . . . . . . . . . . . . . . . . . . . . . . . . . . . 86
5.7 Theoretical predictions compared to experimental data for different
sizes and shapes of hBN. . . . . . . . . . . . . . . . . . . . . . . . . . . . . 87
5.8 Thermal conductivity (k) of PPS-hBN composites with hybrid fillers. . . 92
xi

5.9 Coefficient of thermal expansion (CTE) of PPS-hBN composites with
hybrid fillers. . . . . . . . . . . . . . . . . . . . . . . . . . . . . . . . . . . 92
5.10 Electrical properties of PPS-hBN composites with hybrid fillers: (a) elec-
trical impedance, and (b) electrical conductivity. . . . . . . . . . . . . . . 93
5.11 Compressive Elastic Modulus (E) of PPS-hBN composites with hybrid
fillers. . . . . . . . . . . . . . . . . . . . . . . . . . . . . . . . . . . . . . . . 95
5.12 Compressive strength (E) of PPS-hBN composites with hybrid fillers. . . 95
5.13 SEM Images of PPS-hBN hybrid composites at varying magnifications. . 97
5.14 Thermal conductivity (k) of PPS-hBN composites with varying filler
content. . . . . . . . . . . . . . . . . . . . . . . . . . . . . . . . . . . . . . . 100
5.15 Theoretical predictions compared to experimental data for increasing
content of hBN in PPS. . . . . . . . . . . . . . . . . . . . . . . . . . . . . . 102
5.16 Effect of using a silane-based coupling agent on PPS-hBN composites. . 104
xii

Chapter 1
Introduction
As demand for smaller, faster microelectronics increases, the development of multi-
functional materials with higher power densities becomes more significant. A ma-
terial’s ability to dissipate heat is directly related to the reliability, performance, and
potential miniaturization of electronics [2, 3]. Excess heat generated by high power
densities can lead to elevated device operation temperatures, performance reduction,
and hardware failure [4].
For the purposes of electronic packaging, a material with high thermal conductivity
and electrical resistivity is necessary. Thermal conductivity’s relationship to heat
dissipation bears importance for this application as the thermally conductive nature
of the material is the main mechanism for cooling a device. High electrical resistivity
is required in order to prevent leakage current, which introduces loss and can yield
a nonfunctional circuit [5]. Other requirements for electronic packaging materials
include, but are not limited to, low thermal mismatch, low-weight, small size, low cost,
and ease of manufacturing [5]. Thermal mismatch between different materials, or a
material and its environment, must be low in order to prevent debonding, bending, and
delamination [6]. In regards to fulfilling the last suggested requirement, materials that
are capable of being injection molded into parts with any possible three-dimensional
1

Chapter 1. Introduction 2
geometry, such as polymeric composites, are beneficial.
As the electronics industry moves towards smaller, more portable devices, a
lightweight material that has the ability to act as an enclosure or encapsulation sur-
rounding the equipment, or as an independent heat management component, becomes
more desirable.
1.1 Electronic Packaging Materials
The search for novel multifunctional materials with the aforementioned properties is
a continuous pursuit for manufacturers in the semiconductor industry. The primary
objective is to replace or enhance the existing materials used to make the components’
encapsulations, including electronic device enclosures, and embedded heat sinks.
Traditionally, thermal dissipation in encapsulated devices has been resolved through
the use of embedded heat sinks [3, 7]. As component parts shrink in size, their power
density increases requiring a more effective means of extracting heat from the device.
If an appropriate solution is not found the device’s core temperature will increase
beyond a safe limit. Further, embedded heat sinks are costly, susceptible to thermal
cracking, and have limited use in thin packages [3]. In addition to embedded heat
sinks thermal dissipation is commonly achieved through the use of epoxy molding
compounds combined with silica. Silica is added to epoxy with the intention of not
only improving the thermal properties of the composite, but also reducing the thermal
expansion coefficient [8]. Silica has a relatively low thermal conductivity of 1.5 W/m-
K, therefore providing only slight improvements in heat dissipation. Once again,
advancements in technology resulted in higher power densities for component parts
and caused increased heat dissipation, rendering epoxy-silica compounds insufficient.
Many solutions have been proposed in the search for alternatives to the current
standards mentioned above. There are a number of materials that could satisfy the

Chapter 1. Introduction 3
Figure 1.1: Schematic of modified heat sink to include electrically resistive composite.
aforementioned requirements for electronic packaging, including metal-matrix com-
posites (MMC), and polymer-matrix composites (PMC).
A more achievable goal in the short term relates to complimenting the existing
heat sinks, instead of completely replacing them. As seen in Figure 1.1, an electrically
resistive material can be combined with a standard aluminum heat sink to reduce
the overall conductivity of the material. Currently, thermal insulating pads made of
Kapton or mica are used for electrical insulation, mounting electronic parts to a heat
sink. Although these materials may be electrically resistive, they have low thermal
conductivities of approximately 0.37 W/m-K and 0.71 W/m-K, respectively [9]. By
using a composite material with a much higher thermal conductivity, instead of mica
or Kapton, heat dissipation through the heat sink can be greatly improved.
1.2 Thesis Objectives
One of the most common methods of improving thermal conductivity for a polymer
composite is through the formation of a continuous conductive network of particles
throughout the matrix material. By creating a stable path of particles that are thermally
conductive, improvements can be made to a composite’s ability to dissipate heat.
Significant enhancements to the thermal conductivity can be seen once a percolation

Chapter 1. Introduction 4
threshold has been reached. This threshold refers to the point at which the filler
particulates come in contact with one another, creating interconnectivity throughout
the composite.
For this research thesis, a number of different hypotheses were evaluated with the
intention of improving the continuous conductive network of filler particles, in turn
increasing the effective thermal conductivity. Initial studies were conducted in order
to find the percolation threshold using specific matrix and filler combinations, and
then subsequent analyses were performed in attempt to maximize both the thermal
conductivity and electrical resistivity.
The two main objectives for this research thesis are as follows:
1. To fabricate thermally conductive, electrically resistive polymer-matrix compos-
ites with an enhanced continuous conductive network of filler particles, and
evaluate the resulting structures in terms of their morphology, thermal, electri-
cal, and mechanical properties.
2. To fabricate novel porous composites to investigate the effect of extensional
biaxial flow fields on the alignment of thermally conductive filler materials.
1.3 Thesis Organization
The body of this thesis is separated into four chapters. A background and literature re-
view is presented in Chapter 2 on the following topics: electronic packaging, thermally
conductive materials, electrically insulating materials, polymer and ceramic compos-
ites, and foamed composite materials. In Chapter 3, the fabrication and characteriza-
tion techniques of the composite materials are described. Chapters 4 and 5 present the
fabricated composite materials, detailing various parametric studies conducted in this
research. The thermal conductivity, electrical properties, mechanical properties, and
the morphology are presented for these composites. Specifically, Chapter 4 describes

Chapter 1. Introduction 5
a series of linear low-density polyethylene (LLDPE)-based composites used to deter-
mine the impact of incorporating different filler materials at various concentrations.
This chapter also includes a method for fabricating porous LLDPE composites, via
foaming agents, and an analysis of the properties of the resulting material. In Chapter
5, the effect of filler size and shape, and hybrid fillers were studied with PPS-based
composites. This chapter also contains mathematical modeling of the composite ma-
terials pertaining to the effect of filler content. Finally, the thesis concludes with an
overview of this research and future recommendations.

Chapter 2
Background and Literature Survey
2.1 Electronic Packaging
The functionality of electronic packaging can be divided into four specific tasks: signal
distribution, heat dissipation, package protection, and power distribution [10]. This
broad range of applications means any material used for electronic packaging must
have superior chemical, mechanical, thermal and environmental properties.
Multifunctional materials have great potential for this application due to their
enhanced performance with respect to aforementioned tasks. This approach offers
one material that serves multiple functions working synergistically, exceeding the
sum of the individual component’s capabilities [11]. Reductions in size, weight, cost,
and complexity are all possible while improvements in efficiency, and versatility can
be achieved [11]. Electronic packaging requires multifunctional materials to provide
structural support, mechanical and chemical protection, and thermal management.
There are many factors which can contribute to the degradation of electronics such
as, moisture, contaminants, mobile ions, radiation (including alpha particles, gamma
photons and x-rays), and hostile environmental conditions including salt corrosion
and oxidation [10]. Electronic packaging must protect devices from any adverse
6

Chapter 2. Background and Literature Survey 7
environment and ensure long-term reliability. Often there are competing properties
within multifunctional materials, therefore optimization of the desired characteristics
must be investigated to obtain ideal attributes.
As a result of continued increases in power densities, manufacturers of semicon-
ductor electronics are continuously searching for novel multifunctional materials to
replace or enhance the existing standards mentioned in Section 1.1. Many alternatives
have been proposed to replace the current heat sink materials, including metal-matrix
composites (MMC) and polymer-matrix composites (PMC). MMCs are widely used
in the aerospace and automotive industries [12]. These particle-reinforced isotropic
composites have many attractive properties in relation to electronic packaging, in-
cluding, high mechanical strength, low linear expansion ratio, and very high thermal
conductivity [12]. Some of the MMCs that have been evaluated include Al-SiC [13, 14],
Al-Si [15, 16], Cu-diamond [17–19], Al-diamond [20, 21], Cu-W [22], and Cu-Mo [23].
Although MMCs having many suitable properties, the high electrical conductivity of
the composites limits application as an electronic packaging material [12, 24]. Other
limitations of MMCs include their high density, susceptibility to corrosion, potential
high cost, as well as thermal mismatch between filler and matrix metals [18, 25, 26].
Polymers are already standard in many electronic packaging components. These
materials can be found acting as interlayer dielectrics on an integrated circuit (IC),
die attachment adhesives, encapsulants, conformal coatings, passivation layers, and
as the body of the package [10, 27, 28]. Recently, there has been a growing interest in
the development of polymer-based composites for electronic packaging applications.
Further discussion regarding the use of PMCs as a substitute for the current standard
materials is presented in Section 2.4.

Chapter 2. Background and Literature Survey 8
(a) (b) (c)
Figure 2.1: Examples of types of electronic packaging, (a) integrated circuits (b) elec-tronic chips (c) liquid epoxy encapsulation [1].
2.2 Thermally Conductive Materials
Thermal conduction is the phenomenon in which heat is transferred from high to low-
temperature regions of a material [29]. Therefore, thermal conductivity is the property
describing a material’s ability to transfer heat.
In a solid material, there are two main mechanisms of heat conduction: through
lattice vibration waves, which are called phonons, and through free electrons. The
movement of phonons is associated with a certain thermal energy, while free or con-
ducting electrons participate in electronic thermal conduction [29]. Transport of heat
within a non-metallic material occurs predominantly by phonon or lattice vibrations
[28]. Phonon scattering leads to thermal resistance and occurs as a result of phonon-
phonon scattering, boundary scattering, and defect or impurity scattering. Boundary
scattering accounts for the majority of scattering occurrences due to the presence of
an interfacial thermal barrier, which is associated with acoustic mismatch and flaws
between the matrix-filler interface. By suppressing scattering events, phonon move-
ment increases, in turn maximizing thermal conductivity [30]. Depending on the type
of material, heat transfer will occur in variable manners.
In metals, the free electron mechanism is much more efficient at transporting heat
compared to phonon movement since electrons are more resistant to scattering and
move at higher velocities. The large number of electrons present within metals assists

Chapter 2. Background and Literature Survey 9
in the thermal conduction process. In addition to promoting heat conduction, this
mechanism increases the electrical conductivity in accordance to the Wiedemann-
Franz law.
Ceramics are electrical insulators and inherently lack large amounts of free elec-
trons. Due to the shortage of electrons, the heat transfer is predominantly through
phonons. Even though free electrons are much more efficient at conducting heat, some
ceramics have relatively high thermal conductivities. The thermally conductive nature
of ceramics has been linked to the crystal structure. Adamantine materials, having a
diamond-like structure, have high k-values comparable to those of face-centre cubic
(FCC) metals. Ceramics with high k-values have been associated with the follow-
ing characteristics: low atomic mass, strong interatomic bonding, and simple crystal
structures to reduce the amount of phonon scattering [31–33].
Unlike ceramic materials, polymers typically have very low thermal conductivities,
approximately between 0.2 to 0.3 W/m-K [29]. Polymers with a higher degree of
crystallinity have been associated with greater thermal conductivities, in comparison
to those with an amorphous structure. Coordinated vibrations of molecular chains
that occur within a crystalline state prove to be an effective method of conducting heat
[29]. A collection of thermal conductivity values for common metals, ceramics, and
polymers can be found in Table 2.1.
In polymeric composites, thermal conductivity has been known to improve through
the application of three different techniques. The first is by forming continuous net-
works using thermally conductive filler materials within the matrix [25, 28, 30, 34–36].
The next method is to decrease the number of thermally resistant junctions between
adjacent filler particles by using particulates with increased size [3, 7, 36]. Lastly,
the selection of a filler with fewer interfacial flaws can reduce the thermal contact
resistance between fillers that are in contact with one another [28]. In addition to the
above considerations, it is recommended to select fillers with multimodal particle size

Chapter 2. Background and Literature Survey 10
Material Thermal Conductivity (W/m-K)
Metals
Aluminum (Al) 234Copper (Cu) 400Stainless Steel 15
Ceramics
Silica (SiO2) 1.5Aluminum Nitride (AlN) 80 – 200Silicon Carbide (SiC) 70 – 490Alumina (Al2O3) 18 – 36Boron Nitride (BN) 300+Diamond 1000
Polymers
Linear Low Density Polyethylene (LLDPE) 0.31Polyether Ether Ketone (PEEK) 0.29Polyphenylene Sulfide (PPS) 0.22Liquid Crystal Polymer (LCP) 0.20
Table 2.1: Thermal conductivity (k)-values of common materials at room temperature.

Chapter 2. Background and Literature Survey 11
distributions, and use a polymer with a low melt viscosity to increase wetting and im-
prove filler-matrix adhesion [30]. All of these suggestions are based on the assumption
that good adhesion between the polymer and filler exists, otherwise air gaps could
be introduced, reducing the effective k-value. Therefore, compatibility between the
polymer and filler materials is also recommended to decrease the possibility of void
formation.
One of the most common methods of improving thermal conductivity for a polymer
composite is through the formation of a continuous conductive network of particles
throughout the matrix material. By creating a stable path of particles that are thermally
conductive, improvements can be made to a composite’s ability to dissipate heat.
Significant enhancements to the thermal conductivity can be seen once a percolation
threshold has been reached. This threshold refers to the point at which the filler
particulates come in contact with one another, creating interconnectivity throughout
the composite.
2.3 Electrically Insulating Materials
Electrical resistivity (ρ) refers to a material’s ability to oppose conduction of electri-
cal current, and is the inverse of conductivity. Materials are generally grouped into
three categories: conductors, semiconductors, and insulators. Conductive materials
typically have an electrical conductivity of 103 (S/cm) or greater. To be considered an
insulator, the electrical conductivity must not exceed 10−8 (S/cm) [29]; semiconductors
encompass everything between conductive materials and insulators. Electronic con-
duction of current results from the motion of free charge carriers within the material.
Polymers characteristically have high electrical resistivities and are often used for
applications where insulators are necessary [37]. For instance, polymers are used in
flexible coatings on electrical wires and cables [38]. These materials can also be found
Chapter 2. Background and Literature Survey 12
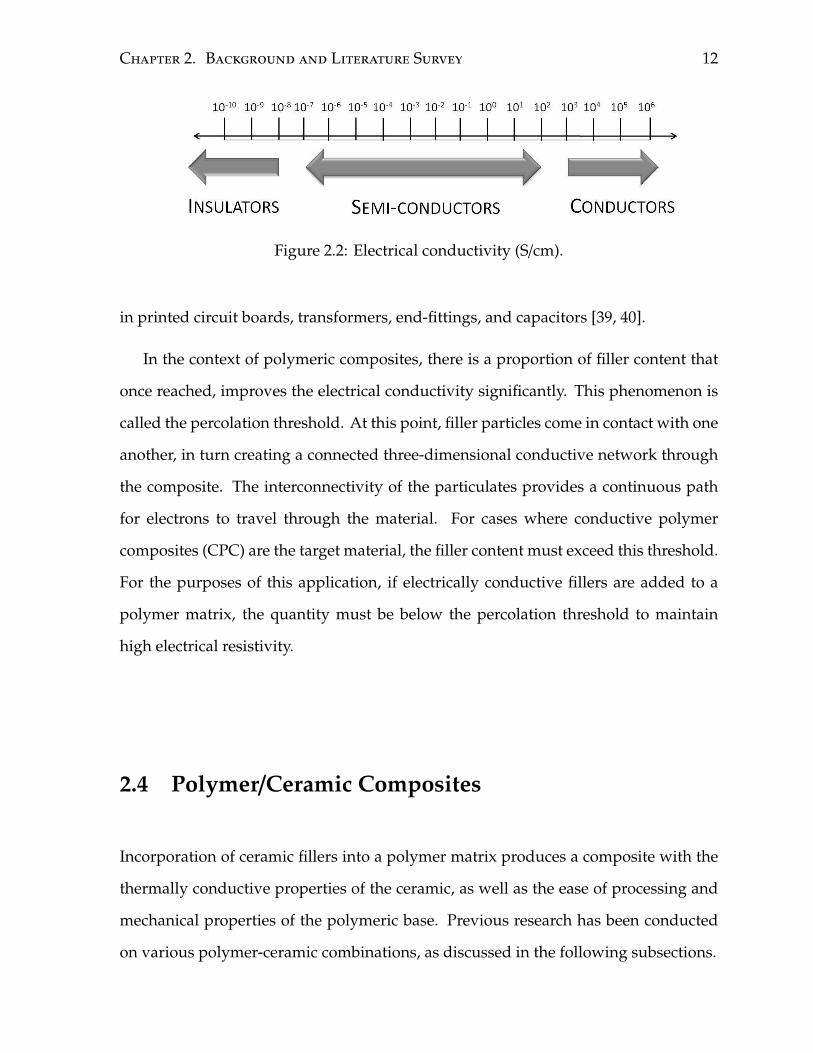
Figure 2.2: Electrical conductivity (S/cm).
in printed circuit boards, transformers, end-fittings, and capacitors [39, 40].
In the context of polymeric composites, there is a proportion of filler content that
once reached, improves the electrical conductivity significantly. This phenomenon is
called the percolation threshold. At this point, filler particles come in contact with one
another, in turn creating a connected three-dimensional conductive network through
the composite. The interconnectivity of the particulates provides a continuous path
for electrons to travel through the material. For cases where conductive polymer
composites (CPC) are the target material, the filler content must exceed this threshold.
For the purposes of this application, if electrically conductive fillers are added to a
polymer matrix, the quantity must be below the percolation threshold to maintain
high electrical resistivity.
2.4 Polymer/Ceramic Composites
Incorporation of ceramic fillers into a polymer matrix produces a composite with the
thermally conductive properties of the ceramic, as well as the ease of processing and
mechanical properties of the polymeric base. Previous research has been conducted
on various polymer-ceramic combinations, as discussed in the following subsections.

Chapter 2. Background and Literature Survey 13
2.4.1 Fabrication Methods
Studies have been conducted on the best method of combining a polymer with the filler
particles in order to produce desirable properties. Agari et al. tested four methods of
fabricating test specimen: powder, solution, roll-milled, and melt mixed [41]. Powder
mixed referred to a dry-blend method where the materials are combined at room tem-
perature and then melted into the appropriate shape. For solution mixing, the filler
and matrix materials were dispersed within toluene until the solute was removed, and
then was melted. Roll-milled samples had the filler mechanically kneaded into the
melted polymer and melt mixing used a twin-screw compounder to combine the filler
and matrix while the polymer was in a molten state. The thermal conductivity of the
prepared specimen increased in the following order: melt mixture < roll milled = so-
lution mixture < powder mixing [41]. These results suggest a non-uniform composite
morphology encourages the formation of conductive networks through the material,
increasing ke f f .
2.4.2 Common Issues
When fabricating polymer-ceramic composites, other researched have reported a series
of common complications. These issues are outlined below.
Achieving a homogeneous dispersion of filler particles within polymer composites
has proven to be challenging. The ceramics have a tendency to form agglomerates
resulting in a heterogeneous morphology. A non-uniform distribution of fillers will
decrease the mechanical properties of the composite. Large agglomerates of filler
particles have been shown to negatively affect the flexural and impact properties of a
composite [42]. Reducing the average size of agglomerates within the composite aids
in increasing the mechanical properties of the material [42].
Improvements in thermal conductivity have been exhibited at high loadings of

Chapter 2. Background and Literature Survey 14
ceramic fillers. Even though higher ke f f -values result, the ability to process the com-
posites is compromised. The viscosity of the composite increases along with filler
content, making the material more difficult to mix. This limit depends on the the size,
shape, aspect ratio, and ultimately the packing factor of the filler material [42]. Studies
have suggested a maximum of 40 vol.% filler in order to maintain ease of processing
[36, 43].
Achieving good interfacial adhesion between the polymer and filler has proven
to be a difficult task. When compared to micromechanical models, the thermal per-
formance of most of the polymer-ceramic composites is underwhelming. One of the
major contributing factors is the interfacial barrier resistance. Lack of adhesion be-
tween the polymer and filler results in a high amount of phonon scattering, reducing
the effective thermal conductivity of the material. In order to overcome this issue,
phonon scattering events must be minimized.
2.4.3 Lessons Learned
Additional experimental work has been conducted in order to improve on the chal-
lenges mentioned in the previous section. The findings of these experiments are
described below.
Through the use of coupling agents, improvements to both dispersion and inter-
facial adhesion between filler and polymer matrices have been achieved. The main
purpose of a coupling agent is to functionalize the components within the composite,
making it more reactive and willing to bind to both inorganic and organic fillers. Silane-
[3, 28, 34], toluene- [44] and titanate-based [7, 8] coupling agents have been studied
for use in polymer-ceramic composites. Enhanced mechanical properties have been
noted as a result of improved adhesion. A lack of air gaps between the matrix and
filler also increases the ke f f [44].
The selection of filler materials is of great importance when producing polymer-

Chapter 2. Background and Literature Survey 15
ceramic composites with high thermal conductivities. Materials with large particle
sizes are recommended to reduce the thermal junctions within the material, and im-
prove the effective thermal conductivity [3, 36]. Large particles create higher stability
for conductive paths, but also increases the viscosity of the material. Therefore, a
balance between improvements to ke f f with respect to particle size and viscosity must
be obtained.
Composites containing more than one type of filler, which are referred to as hybrids,
are also under evaluation for this particular application [25, 28, 45]. Ideally, the com-
posite will retain the advantageous properties of each type of filler and minimize the
disagreeable qualities, producing a material with the desired design criteria. Through
the addition of multiple types of fillers, a synergistic effect can result. Modifications to
the properties can be made easily by varying quantities of each type of material. Other
studies have found that a combination of different sized fillers has improved the effec-
tive thermal conductivity [7, 25, 28]. The intention is to have a blend of small particles
that occupy space between the larger particles, increasing the number of conductive
paths through the composite.
2.5 Foamed Composite Materials
Due to the versatile nature of polymeric-based foams, they have been of interest
within many different areas of research. These cellular materials are lightweight, have
superior thermal insulating capabilities, and a high strength-to-weight ratio [46, 47].
Foamed composites have been utilized for various applications including packaging
materials, sound insulation, thermal insulation, shock absorption, cushioning, and
bioscaffolds for tissue engineering [48, 49].
There are multiple methods of fabricating porous polymer composites. Most foams
are formed based on the nucleation and growth of gas bubbles within a polymeric

Chapter 2. Background and Literature Survey 16
matrix. The other well known method is the production of syntactic foams, which are
formed when micro-beads of encapsulated gas are mixed into the matrix. Syntactic
foams do not behave in a similar manner to those formed based on the principles of
nucleation and growth.
The thermal conductivity of foamed materials is governed by four factors: conduc-
tion of heat through the solid polymer, conduction of heat through the gas, convection
of heat through the cells, and finally, radiation through the cell walls and across the
voids [50]. Convection generally only has a significant effect for foams containing cells
larger than 10 mm, and is often ignored. The major contributor is usual conduction
through the gas. Foam conductivity is generally quite low and is not much higher
than the k of air within the cell, which is ∼0.025 W/m-K.
Expancel®microspheres are hollow, polymeric microballoons, which expand when
heated within a specific temperature range. The microsized bubbles consist of a
polymer shell encapsulating a hydrocarbon gas. When heat is applied, simultaneously,
the pressure of the gas inside the sphere increases, and the thermoplastic outer shell
softens. The diameter increases from 18-24 µm to 120 µm, creating large pores within
the material.This method of foaming is relatively new and as such has been deemed
non-conventional.
Studies have been conducted using expandable polymeric microspheres to create
porous materials. Multiple evaluations regarding the effect of temperature on the
morphology of the foams have been conducted [51–53]. Density profiles showed an
optimal processing temperature to obtain the lowest density for composites formed
with Expancel® microspheres, which varied based on the grade of microsphere used.
Below this optimal temperature, the viscosity of the polymer is too high and restricts
bubble growth. Above this temperature, gas loss is inevitable, occurring at a high rate
of diffusivity [53]. These studies outlined the importance of processing temperature
in finding a balance between gas loss and expansion rate resistance for Expancel®

Chapter 2. Background and Literature Survey 17
microspheres. In a study by Kim et al., closed-cell ceramic foams were fabricated using
Expancel® [54]. Variations in microsphere content were used to change the porosity
of the material, showcasing the ability to tailor the bulk density of the material [54].
The concept of foaming a composite material to align filler materials, including
fibres and particles, has been previously explored. Some studies have focused on
using supercritical CO2 as a foaming agent to align particles in the cell wall at the
interface between the solid and gas phases [55, 56]. Improvements in the mechanical
and electrical properties for polymeric foams have been seen. Increased electrical
conductivity, along with reduced foam density, have been attributed to a homogeneous
distribution of conductive particulates, creating a conductive network throughout the
composite [55]. A novel concept was to use this same principle to create a three-
dimensional interconnected pathway of thermally conductive particles throughout
the polymer matrix, improving ke f f .
2.6 Micromechanical Modelling
Theoretical and empirical correlations are often used to predict the behaviour of com-
posite materials. These micromechanical models can be used as a preliminary method
for evaluating potential composites. Although the predictions may not be precise, they
can be used to determine if the properties will be favourable, reducing the likelihood
of failed, time consuming experimental work. Once a composite has been fabricated,
the model can be fit to this empirical data for verification and validation.
Thermal conductivity is one of the crucial elements when determining the feasibility
of a composite for use in electronic packaging. As such, there are a number of reference
models available to forecast changes in k with respect to any specified parameter,
including filler content, size, shape and orientation. The ability of each model to
predict the thermal conductivity is limited by the number of input parameters [57].

Chapter 2. Background and Literature Survey 18
Since no single model exists which accurately predicts the ke f f of every composite,
several theoretical correlations must be fit to the empirical data.
2.6.1 Basic Models: Series, Parallel and Geometric Mean Models
The series and parallel models determine the thermal conductivity of composites based
on the direction of heat flow in relation to the fillers. These two models are used to
represent the upper and lower bounds of the effective thermal conductivity [58]. The
series and parallel models are described using Equation 2.1 and Equation 2.2.
kc =kpk f
kp(φ) + k f (1 − φ)(2.1)
kc = φk f + (1 − φ)kp (2.2)
where, k f , kp, and kc represent the thermal conductivities of the filler, polymer matrix,
and composite, respectively, and φ is the volume fraction of filler. The series model
considers a case where the fillers are fully interconnected forming an internal network
structure, generally overestimating the ke f f -value. For the parallel model, each particle
is assumed to be an isolated entity, therefore minimizing the effect of the dispersed
phase and underestimating ke f f .
The geometric mean model is a combination of the parallel and series models,
assuming an equal proportion of each arrangement. This model is dependent on the
weighted average of the filler and matrix materials, and has no physical basis.
kc = kφ
fk
(1−φ)p (2.3)

Chapter 2. Background and Literature Survey 19
2.6.2 Maxwell Theoretical Model
Using the potential theory, Maxwell developed a relationship for conductivity of a
two-phase mixture. This theory describing electrical conductivity was then adapted
by Eucken for thermal conductivity [59]. This model is used for two-phase com-
posites with randomly dispersed spherical particles. The spheres are assumed to be
both homogeneous and non-interacting, within a homogeneous, continuous medium
[60]. Predictions obtained using this model are generally more accurate for low filler
concentrations, for scenarios where the particles do not network [8, 61].
kc = kp
[
k f + 2kp + 2φ(k f − kp)
k f + 2kp − φ(k f − kp)
]
(2.4)
2.6.3 Bruggeman Theoretical Model
Bruggeman adapted Maxwell’s theory to apply for cases of concentrated particulate
composites [59, 61]. This model is also used for two-phase composites with randomly
dispersed, isolated, spherical particles. Predictions obtained using this model are
generally more accurate at higher filler concentrations [62].
1 − φ =
[
k f − kc
k f − kp
] (
kp
kc
)1/3
(2.5)
2.6.4 Lewis and Nielsen Theoretical Model
Many studies have found the Lewis and Nielsen semi-theoretical model to be the
best fit for solid-solid compositions [60, 63]. A modified version of the Halpin-Tsai
equation, this is one of the few models that accounts for the shape, orientation, and
packing of fillers within a two-phase system [64].
kc = km
[
(1 + ABφ)
(1 − Bφψ)
]
(2.6)

Chapter 2. Background and Literature Survey 20
where,
B =
k f
kp− 1
k f
kp+ A
(2.7)
ψ = 1 +
(
1 − φm
φ2m
)
φ (2.8)
Equation 2.6 uses the A factor to take geometry into account, while φm represents the
packing factor. A is a function of the shape, aspect ratio, and direction of heat flow with
respect to the dispersed phase, and is calculated in relation to the Einstein coefficient
kE. This coefficient is generalized and depends primarily on particle geometry [65].
2.7 Summary
There are many approaches associated with electronic packaging and the materials
used for its components. Each of these elements were discussed within this chapter
including: a general overview of electronic packaging, thermally conductive materials,
electrically insulating materials, polymer-ceramic composites, and foamed composite
materials. Documentation on basic principles as well as a comprehensive review of
previous research has been included as a guide for the selection of the best materials,
fabrication techniques, and processing parameters for this research thesis. Polymer-
matrix composites were selected for the basis of this work. Ceramic materials, paired
with a coupling agent, were decidedly the best filler material due to their high thermal
conductivity and electrical resistivity. Use of hybrid materials is also suggested to
introduce a positive synergistic effect. With regards to fabrication, dry-blending was
suggested as the best means of increasing thermal conductivity within PMCs. Finally,
a technique used to increase the electrical conductivity of PMCs was modified for use

Chapter 2. Background and Literature Survey 21
in novel porous thermally conductive materials, through the use of extensional flow
fields as a result of microsphere expansion.

Chapter 3
Fabrication and Characterization
3.1 Material Selection
Polymer-based composites have been gaining attention within the electronic packaging
industry as a substitute for the current standard materials. Polymers are of particular
interest due to their electrical resistivity, lightweight, ease of manufacturing, and low
cost [66]. Conventional polymers typically are thermal insulators, therefore requiring
additional thermally conductive fillers within the matrix to improve their thermal
conductivities [2, 3, 34, 67].
3.1.1 Matrix Materials
Linear Low Density Polyethylene
Commercially available LLDPE from Exxonmobil (8555 series) was used as the pri-
mary matrix material. Since electronic packaging applications require a cost effective
alternative to current component encapsulations and heat management parts, LLDPE
was chosen. The melting temperature of LLDPE is 126 °C, and has an in-service tem-
perature of approximately 50 °C. The density is low, 936 kg/m3, which aids in the
reduction of the overall weight for packaging materials [68]. The properties of LLDPE
22

Chapter 3. Fabrication and Characterization 23
are outlined in Table 3.1.
Polyphenylene Sulfide
High performance matrices were also used in an attempt to improve the material
properties of the composites, as well as expand the potential market for the material.
After compiling an extensive list of potential polymeric candidates, PPS Fortron 0203,
obtained from Ticona, was selected for this study. This thermoplastic polymer is semi-
crystalline and exhibits a high in-service temperature, ranging from 200-220 °C. Both
the density and cost of PPS are slightly higher than that of LLDPE, but this material is
stable at much higher temperatures. The properties of this matrix material are outlined
in Table 3.1.
3.1.2 Filler Materials
Ceramic fillers were added to the two different matrices. These filler materials were
SiC, obtained from Sigma-Aldrich, and hexagonal BN from Momentive Performance
Materials. Both of the filler materials were chosen because they possess high thermal
conductivities, while maintaining electrical resistivity. The physical properties of the
fillers are outlined in Table 3.2.
Silicon Carbide
Silicon carbide (SiC) has been used for a wide variety of applications, including
semiconductor electronics. SiC devices and circuits have been developed for high-
temperature and high-power applications to replace semiconductors that do not func-
tion under these extreme conditions. The high thermal conductivity, high electric field
breakdown strength and wide bandgap of this material makes it ideal for devices and
circuits subjected to high-temperature, high-power, high frequency and high-radiation
environments [70, 71].

Chapter 3. Fabrication and Characterization 24
The silicon carbide used for this study was placed in the composites as-received.
The particles have an irregular shape and vary in size from 32 to 74 µm. This filler
has a thermal conductivity within the range of 70-490 W/m-K, which is much higher
than that of a pure polymer. There are many different crystal structures of SiC, called
polymorphs, each having their own electrical properties [71]. The material used has a
hexagonal crystal structure, completely in the α-phase.
Hexagonal Boron Nitride
Boron nitride (BN), another wide band gap semiconductor, was also used as a filler
material. BN is known to have a high thermal conductivity and performs well at
high temperatures. This material is also lightweight and cost effective, which are both
important qualities for electronic packaging materials [62].
Hexagonal boron nitride is comprised of planar sheets of covalently bonded boron
and nitrogen atoms, which make up the in-plane structure of the crystal [72]. The
different layers are held together in the through-plane direction through Van der
Waals forces. Since the crystal structure is anisotropic, the thermal conductivity varies
based on the direction. The in-plane thermal conductivity (k) has been estimated to
be greater than 300 W/m-K, while the through-plane k is much lower, around 3 W/m-
K [72]. Hexagonal boron nitride’s graphite-like structure also provides a lubricative
effect which is desirable for processing. Minimal tangential resistance, seen with this
type of structure, is attributed to shearing of the weak bonding between planes, in turn
creating a low coefficient of friction and a high carrying load capacity [73].
Four different types of hexagonal BN were evaluated, varying in both size and
shape, as seen in Figure 3.1. All four were used to determine the effect of the filler
material’s size and shape on the properties of the composites. PTX25 and PTX60
have a spherical agglomerate shape with average diameters around 25 µm and 60 µm,
respectively. PT110 has a platelet shape and an average diameter of 45µm, while PT371

Chapter 3. Fabrication and Characterization 25
is a medium-density agglomerate varying in size from approximately 250-300 µm. The
various sizes and shapes of the particles are directly related to the aspect ratio.
3.2 Fabrication Techniques
The composite materials were fabricated using one of two methods: melt-blend or
dry-blend. Each method is outlined below and illustrated in Figure 3.2, with the
melt-blend process represented in red and the dry-blend process in blue. All of the
composites were created using the following methods unless otherwise mentioned.
3.2.1 Melt-Blend Process
The first method employed was melt-blend processing. In fabricating the solid sam-
ples, the polymeric matrix was combined with the filler material in the appropriate
quantities. Then the mixture was placed into a DSM Xplore 15 twin-screw compounder
and combined just above the melting temperature of the polymer. The material was
mixed for a short time of 10 minutes in order to achieve homogeneous mixing and
minimize thermal degradation. Once the material was purged from the compounder,
it was pelletized and ground to fine powders using a freeze mill. The latter process
was accomplished by quenching the material at –196 °C in liquid nitrogen and milling
the pellets using a 6850 Freezer/Mill from SPEX CertiPrep Group.
Samples of varying sizes were prepared by compression-molding for an array of
characterization analyses, including thermal conductivity (k), electrical impedance,
and mechanical properties. For the aforementioned tests, discs 20 mm in diameter
were created. Samples fabricated for k and mechanical properties measurements were
10 mm thick, while those prepared for dielectric analyses were 2 mm thick. During the
compression molding process, the powders were first compacted in a mold at room
temperature for approximately one minute, under a constant pressure of 6.7 MPa

Chapter 3. Fabrication and Characterization 26
Physical Properties LLDPE[68] PPS[69]
Density (ρ) 936 kg/m3 1350 kg/m3
Melting Temperature (Tm) 126°C 280°CService Tmax 50 °C 200 °CThermal Conductivity (k) 0.31 W/mK 0.22 W/mKDielectric Strength 25 kV/mm 385 kV/mKCoefficient of Thermal Expansion (CTE) ≈ 400 x 10−6 (°C)−1 520 x 10−6 (°C)−1
Resin Price 0.28 $/lb 0.45-0.52 $/lb
Table 3.1: Physical Properties of the Matrix Materials
Figure 3.1: Variations of Boron Nitride. (a) PTX25, (b) PTX60, (c) PT371, and (d) PT110.
Physical Properties SiC hBN[74]
Density (ρ) 3210 kg/m3 2280 kg/m3
Thermal Conductivity (k) 70-490 W/mK 300+W/mKCoefficient of Thermal Expansion (CTE) 2.77 x 10⁻⁶ (°C)−1 0.6 x 10⁻⁶ (°C)−1
Size 32-74 µm 25-300 µm
Table 3.2: Physical Properties of the Filler Materials.

Chapter 3. Fabrication and Characterization 27
(1000 psi). This compacting stage aimed to minimize the possibility of void formation
within the sample. Subsequently, the samples were reheated just above the melting
temperature of the polymeric matrix and held at this temperature for 15 minutes at
13.8 MPa (2000 psi). Lastly, all of the samples were cooled using an ice bath.
3.2.2 Dry-Blend Process
The second method used to mix the matrix and filler materials was dry-blending. For
this processing technique, the matrix and filler materials were combined together in
the appropriate quantities and mixed thoroughly at room temperature. The composite
was then formed into the required sample size by undergoing the same compression-
molding technique as mentioned in the melt-blend section. Although the preferred
method of preparation was initially melt-blend processing, the simplicity of the dry-
blending process proved to be effective.
3.3 Characterization Techniques
The thermal, electrical, mechanical and morphological characteristics of the composites
were analyzed.
3.3.1 Thermal Properties
Thermal Conductivity
The thermal conductivity of the samples was measured using an in-house built thermal
conductivity analyzer [75], in accordance to ASTM E1225. This standard test method
measures the thermal conductivity of samples through the comparative-longitudinal
heat flow technique. The test is conducted at steady state and is effective within the
range of 0.2-200 W/m-K [76]. The setup can be seen in Figure 3.3.

Chapter 3. Fabrication and Characterization 28
Figure 3.2: Flow Chart of Composite Processing.

Chapter 3. Fabrication and Characterization 29
In this method, a specimen with unknown thermal conductivity (ks) is placed be-
tween two reference bars with a known thermal conductivity (kr). A thermal gradient
is established through the reference bars and sample. Once the setup reaches equi-
librium conditions, the following equation is used to derive the thermal conductivity,
given the temperature gradient:
Q
A= ks∆Ts
∆Zs= kr
∆T1
∆Z1+∆T2
∆Z2
2(3.1)
where Q is the heat flow through the cross-sectional area A, and∆T and∆Z correspond
to the difference in temperature and the change in distance, respectively, between the
top and bottom of the reference bar or sample. The LLDPE-based composites were
evaluated for k at 67.5 °C, while the PPS-based composites were tested at 150 °C.
Coefficient of Thermal Expansion
The coefficient of thermal expansion (CTE) was measured for the solid composites.
The dimensional stability as a result of change in temperature was measured using
a Q400-series thermomechanical analyzer (TMA) from TA Instruments. The LLDPE-
based composites were heated to 110 °C and the PPS-based composites were heated
to 260 °C at a rate of 5 °C/minute. The CTE was determined from the slope of the plot,
depicting change in dimension and temperature, from 30 to 100 °C for the materials
with a LLDPE-matrix and 30 to 260 °C for the PPS-based materials. These bounds were
selected to encompass the potential in-service temperatures for each set of materials.
3.3.2 Electrical Properties
The electrical properties of the composites were obtained using a dielectric/impedance
analyzer from Alpha-N-Novocontrol Technologies. This analyzer is used to measure
the complex impedance between two electrodes, in order to determine a material’s

Chapter 3. Fabrication and Characterization 30
dependence on frequency. The electrical conductivity and impedance of each sample
were measured using a frequency sweep between 10−2 and 106 Hz with an applied AC
voltage of 1 V.
3.3.3 Mechanical Properties
The mechanical properties of the composites are important to the success of the pack-
aging material. As an encapsulation to an electronic device, this material must be able
to withstand high compressive forces. The samples were analyzed in terms of their
compressive elastic modulus, measured from the linear elastic region of the stress-
strain curves, as well as their compressive strength, determined by the 0.2% offset.
Compression tests were performed using a Shimadzu Universal Tester Autograph
AG-IS with a load cell of 50 kN at a strain rate of 1 mm/minute under ambient condi-
tions. The samples were crushed between two metal plates, while the displacement of
the crosshead and the compressive force were recorded. From the data collected, the
stress was calculated using the applied force and the cross-sectional area of the sample,
and the strain was calculated by taking the total displacement of the crosshead and
dividing that by the non-deformed height of the sample. For each composition, three
samples were tested and averaged.
3.3.4 Morphology
Polymer-filler morphology was obtained by a JEOL JSM-6060 scanning electron mi-
croscope. SEM micrographs allow images of the samples to be taken at higher magni-
fications than possible with a standard light microscope. Micrographs of the samples’
cross-sectional areas were captured to evaluate the dispersion of fillers within the
matrix. These images also aided in the confirmation of the sizes and shapes of the
particulates.

Chapter 3. Fabrication and Characterization 31
Preparation of the samples was necessary prior to placing the specimen in the SEM.
In order to obtain an accurate representation of the material’s morphology, both thin
and thick samples were fractured using liquid nitrogen (LN2). Freezing the composite
pre-fracture produces a brittle sample, preventing distortion of the sample surface.
Multiple samples previously used for dielectric analysis and thermal conductivity
tests were both examined to confirm the repeatability of the morphology. The thin-
ner dielectric samples were fractured in half, while the thicker thermal conductivity
samples were sliced into several pieces using a bandsaw, and each of those individual
pieces were subsequently broken into smaller pieces after being cooled in LN2.
Once the samples were fractured, they were mounted on metal studs and sputter
coated with a thin layer of platinum (Pt) to create a conductive surface for imaging. An
insufficient metallic coating will result in a charging effect within the SEM chamber.
When a surface charges, the high intensity beam of electrons reacts with the surface of
the material, in turn changing the morphology. Conversely, over coating the specimen
with Pt will cover the features of the surface, and will have a smooth appearance under
the SEM. The surface topography was evaluated using secondary electron imaging
(SEI) at 50, 100, 250, 500 and 1,000×magnifications.
Cell Morphology
For the porous composite materials, the relative density, cell size, and cell density
were measured. The pore size and density are a result of the processing parameters of
the material, including the residence time and amount of filler placed in the material.
These properties were measured to determine the optimal processing conditions.
Relative density,ρr, is the ratio of theoretical density,ρ∗, and the measured density,ρm,
of each sample, as defined in Equation 3.2. The density was found by measuring the
mass, thickness and diameter of each sample. That value was then compared to the
theoretical, calculated density of a sample the same size. Three measurements were

Chapter 3. Fabrication and Characterization 32
taken for the thickness and diameter of each sample, and a minimum of three samples
were used to obtain the average ρm. Using the calculated relative density, the actual
filler content was also found.
ρr =ρ∗
ρm(3.2)
The average cell size and cell density with respect to unfoamed volume were eval-
uated using SEM micrographs and ImageJ, an image processing software developed
at National Institutes of Health of USA. Cell density, N, was calculated using Equation
3.3, where n is the number of pores in the image within a measured area, A. Multiple
images were used to confirm the pore density of each composition.
N =(
n
A
)32
ρr−1 (3.3)

Chapter 3. Fabrication and Characterization 33
Figure 3.3: Thermal Conductivity Analyzer Setup.

Chapter 4
LLDPE Based Composites
This chapter investigates the fabrication of linear low-density polyethylene composites
filled with ceramics and the characterization of their thermal, electrical, mechanical,
and physical properties. The subsequent text is divided into two main topics: solid
and porous composites. Each section contains the two parametric studies related to the
different types of materials. Solid samples were used to determine the effect of different
fillers, as well as the effect of content, on the aforementioned properties. Novel porous
LLDPE composites were fabricated to evaluate the possibility of weight reduction
while maintaining the thermally conductive properties of the polymer composite.
4.1 The Effect of Different Types of Filler
Linear low-density polythene-based composite materials were filled with SiC and hBN
particulates. Parametric studies were conducted to investigate the overall effects of the
aforementioned fillers within composite materials. Data was collected and analyzed
with respect to their physical, thermal, electrical, and mechanical properties.
Table 4.1 outlines all of the compositions created with SiC, hBN and a combination
of the both. The intention of these parametric studies was to determine whether a
34

Chapter 4. LLDPE Based Composites 35
percolation threshold exists for ceramic fillers within a polymeric matrix, along with
variations in material properties due to different filler materials. A minor study on the
effects of hybrid fillers was also conducted.
All of the samples in this study were fabricated using the melt-blend process, with
the exception of LLDPE-33.3 vol.% SiC. Due to the abrasive nature of SiC particles,
along with the high loading of filler within this composite, this composition was
dry-blended.
4.1.1 Thermal Properties
4.1.1.1 Thermal Conductivity
Figure 4.1 displays the effective thermal conductivity (ke f f ) measurements of the
LLDPE-SiC, LLDPE-hBN, and LLDPE-hBN-SiC composites with various filler load-
ings. The general trend for all composites suggests that k increases with higher
filler content. These results were expected and are in accordance with other stud-
ies [2, 3, 34, 67].
Comparing the measured values of ke f f for LLDPE-SiC and LLDPE-hBN compos-
ites, it can be observed that hBN was slightly more effective than SiC in enhancing the
composite’s k. The slight difference could be attributed to the perfect lattice or crystal
structure of hBN, which would lead to a decrease in the number of phonon scattering
events and an increased thermal conductivity [3, 30]. Another advantage to using hBN
is the soft nature of the filler when compared to the abrasive SiC. Processing of hBN is
slightly easier and less destructive, compared to SiC. Among the three types of LLDPE
composites, LLDPE-hBN-SiC exhibited the highest ke f f . This phenomenon demon-
strates positive synergy between the hybrid fillers to promote heat transfer through
the composite. It is believed that the increase in ke f f from the hybrid fillers was not
only caused by the higher total filler loading, but also by the better interconnectiv-

Chapter 4. LLDPE Based Composites 36
Name Vol.% of LLDPE Vol.% of SiC Vol.% of hBN
LLDPE-2.46VF SiC 97.54 2.46 0LLDPE-5.34VF SiC 94.66 5.34 0LLDPE-9.36VF SiC 90.64 9.36 0LLDPE-33.3VF SiC 66.67 33.3 0
LLDPE-2.46VF hBN 97.54 0 2.46LLDPE-5.34VF hBN 94.66 0 5.34LLDPE-9.36VF hBN 90.64 0 9.36LLDPE-33.3VF hBN 66.67 0 33.3
LLDPE-33VF hBN-2.46VF SiC 64.24 2.46 33.3LLDPE-33VF hBN-5.34VF SiC 61.36 5.34 33.3LLDPE-33VF hBN-9.36VF SiC 57.34 9.36 33.3
Table 4.1: LLDPE-hBN-SiC Compositions
0.0
0.5
1.0
1.5
2.0
2.5
3.0
3.5
4.0
9.36 5.34 33.32.46
Ther
mal
Con
duct
ivity
(W/m
-K)
Composition (vol.% of filler)
LLDPE-SiC LLDPE-hBN LLDPE-33.3VFhBN-SiC
Figure 4.1: Thermal conductivity (k) of LLDPE-hBN-SiC composites.

Chapter 4. LLDPE Based Composites 37
ity among the thermally conductive fillers of various sizes and shapes. Both factors
would lead to a more dense packing of particulates. As a result, the secondary fillers
would be able to bridge gaps among the primary fillers and create a more extensive
three-dimensional thermally conductive network throughout the LLDPE matrix [62].
4.1.1.2 Coefficient of Thermal Expansion
For composites, the mismatch of thermal expansion within the material induces resid-
ual stress, which can result in debonding, bending, and delamination [6]. Through the
reduction of thermal expansion of the composite, these stresses can be minimized. As
such, the coefficients of thermal expansion for all of the composites were measured.
There is a general trend seen with regards to the thermal expansion of composites
containing SiC. As seen in Figure 4.2, the coefficient of thermal expansion decreases for
the materials containing SiC and hybrid fillers with increased amounts of inclusions.
This trend is in accordance to the rule of mixtures (ROM), since the CTE of the filler
material is much less than the polymer. The ROM is a simple, first-order method used
to determine the overall effects of filler on the composite’s CTE, and is outlined in
Equation 4.1.
αc = αm(1 − φ) + α fφ (4.1)
where αc, αm, α f represent the CTE of the composite, matrix and filler, respectively,
and φ is the volume fraction of filler. This approach is used to predict an approximate
value, but takes neither the dispersion of fillers nor the interfacial interaction into
account [6, 77]. The addition of filler particles also physically confines the polymer
chains, reducing the overall expansion of the composite. By adding larger quantities
of filler, increased constriction of polymer chains occurs. Factors affecting the degree
of confinement include aspect ratio, orientation, bulk modulus, and dispersion of filler
particles within the matrix [77, 78]. The aggregation of particles can have significant

Chapter 4. LLDPE Based Composites 38
050100150200250300350400450500550600
hBN SiC
2.54VF Filler 5.34VF Filler 9.36VF Filler 33.3VF Filler
Hybrid
Coe
ffici
ent o
f The
rmal
Exp
ansi
on
m/m
/°C
Figure 4.2: Coefficient of thermal expansion (CTE) of LLDPE-hBN-SiC composites.
effects on the properties of a composite, causing a reduction in the effective CTE [79],
as seen with samples containing 33 vol.% SiC which were dry-blended.
For the composites containing hBN there was no significant change seen in the
CTE values when varying the filler content. Even though this was the case, the overall
CTE is much lower than the CTE of neat LLDPE, which is represented by the dotted
line in Figure 4.2. The ROM predicts higher CTEs for the LLDPE-hBN composites
when compared to the experimental results. This disconnect could be due to the poor
interfacial strength between the filler and matrix materials, rendering the inclusions
inefficient at constricting the free expansion of the matrix in a predictable manner [80].
The LLDPE-hBN composites exhibit thermal stability, regardless of the amount of filler
added.
4.1.2 Electrical Properties
The electrical resistivity of the fabricated samples was evaluated through impedance
(Z) curves obtained from the dielectric/impedance analyzer. At lower frequencies,

Chapter 4. LLDPE Based Composites 39
the impedance curves show linear, horizontal behaviour. Within this region, the
impedance was frequency independent. This type of behaviour is a characteristic of
resistive materials. At this particular point, the impedance value should be equivalent
to the resistance of the material.
As seen in Figure 4.3, the impedance of the composites decreased as the filler content
increased. When larger amounts of fillers were dispersed in the LLDPE matrix, the
composite’s ability to resist AC current was reduced, slightly decreasing its resistivity.
Although increasing filler contents led to a general downward shift in impedance, the
values remained relatively close to one another, ranging from 1011 and 1016. In other
words, both SiC and hBN would not compromise the electrical insulating properties
of LLDPE.
In order to confirm the results seen in the impedance curves, the electrical conduc-
tivity of the composites was also analyzed. This data exhibited the same trends as
the Z curves. As the amount of filler increased there was a decrease in the electrical
resistivity. The three-dimensional continuous conductive paths throughout the ma-
terial that improve thermal conductivity likely encourage slight improvements in the
electrical conductivity as well since the filler material has a higher conductivity than
the polymer.
4.1.3 Mechanical Properties
4.1.3.1 Compressive Elastic Modulus
The mechanical properties of LLDPE-SiC, LLDPE-hBN, and LLDPE-hBN-SiC were
compared in terms of their compressive elastic moduli (E) and their compressive yield
strength (σy). Figure 4.4 shows that, for both LLDPE-SiC and LLDPE-hBN composites,
E increased with filler content. At higher loading levels, particle-particle interactions
would begin to influence the fracture mechanics. In composites, the elastic deformation

Chapter 4. LLDPE Based Composites 40
Electrical PropertyImpedance Conductivity
LL
DP
E-S
iC
10-2 10-1 100 101 102 103 104107
108
109
1010
1011
1012
1013
1014
1015
1016
1017
LLDPE-2.46VF SiC LLDPE-5.34VF SiC LLDPE-9.36VF SiC LLDPE-33.3VF SiC
Impe
danc
e (
)
Frequency (Hz)
0.1 1 10 100 1000 1000010-17
10-15
10-13
10-11
10-9
10-7
10-5
LLDPE-2.46VF SiC LLDPE-5.34VF SiC LLDPE-9.36VF SiC LLDPE-33.3VF SiC
Elec
tric
al C
ondu
ctiv
ity (S
/cm
)
Frequency (Hz)
(a) (b)
LL
DP
E-h
BN
10-2 10-1 100 101 102 103 1041E8
1E9
1E10
1E11
1E12
1E13
1E14
1E15
1E16
1E17
LLDPE-2.46VF BN LLDPE-5.34VF BN LLDPE-9.36VF BN LLDPE-33.3VF BN
Impe
danc
e (O
hms)
Frequency (Hz)10-2 10-1 100 101 102 103 104
10-17
10-16
10-15
10-14
10-13
10-12
10-11
10-10
10-9
LLDPE-2.46VF BN LLDPE-5.34VF BN LLDPE-9.36VF BN LLDPE-33.3VF BN
Elec
tric
al C
ondu
ctiv
ity (S
/cm
)
Frequency (Hz)
(c) (d)
LL
DP
E-h
BN
-SiC
0.01 0.1 1 10 100 1000 10000108
109
1010
1011
1012
1013
1014
1015
1016
1017
LLDPE-33VFBN-2.46VF SiC LLDPE-33VFBN-5.34VF SiC LLDPE-33VFBN-9.36VF SiC
Impe
danc
e (
)
Frequency (Hz)10-1 100 101 102 103 104
10-17
10-16
10-15
10-14
10-13
10-12
10-11
10-10
10-9
10-8
LLDPE-33VFBN-2.46VF SiC LLDPE-33VFBN-5.34VF SiC LLDPE-33VFBN-9.36VF SiC
Elec
tric
al C
ondu
ctiv
ity (S
/cm
)
Frequency (Hz)
(e) (f)
Figure 4.3: Electrical properties of LLDPE-hBN-SiC composites.

Chapter 4. LLDPE Based Composites 41
of the polymer component is controlled by the filler. As the volume percent of filler
increased, less deformation of the polymer was seen and E increased [81].
Comparing LLDPE-SiC and LLDPE-hBN composites, hBN has a stronger positive
effect on the compressive modulus of the composite. One possible explanation for
this is the dependence of elastic modulus on filler size. Vollenberg and Heikens found
that there is a strong tendency for elastic modulus to increase with decreasing particle
size of untreated fillers because the local solidification of the matrix activated at a free
filler particle surface [82]. SEM micrographs in Section 4.1.4 revealed that the hBN
agglomerates were broken into individual platelets during melt-compounding. These
platelets were smaller than the SiC particles. Therefore, LLDPE composites filled with
hBN platelets had a larger surface area for the potential activation of local solidification
of the LLDPE, leading to more significant increases in their moduli.
4.1.3.2 Compressive Strength
Figure 4.5 shows the compressive strength of the various composite materials. In gen-
eral, the strength of the material does not exhibit a drastic change with the addition of
more filler. Large differences between the composites are not expected, since the vari-
ation in filler quantity does not vary significantly, except for the composites containing
33.3 vol.%. When comparing the strength of composites with different filler types,
SiC and hBN perform quite similarly in most cases, with an exception for composites
at high filler loadings. The composite containing 33.3 vol.% of SiC performed poorly
compared to the 33.3 vol.% hBN composite. This is likely due to the formation of SiC
agglomerates within the material as a result of the mixing method, reducing the overall
strength of the material. The presence of inorganic particle agglomeration within the
polymer matrix decreases the contact area and creates defects within the composite,
in turn reducing the overall effectiveness of the interfacial interaction and the strength
of the material [83].

Chapter 4. LLDPE Based Composites 42
The combination of SiC and hBN, to form a hybrid composite, has the best com-
pressive strength. The addition of fillers with different sizes and shapes assists in
improving σy. When the particles occupy the space between the larger particulates,
a more efficient packing of fillers can help to improve the compressive yield strength
of the composite. Increases in compressive strength can also be attributed to the
improved transfer of stress between the polymer matrix and ceramic fillers [84, 85].
4.1.4 Morphology
Figures 4.6 (a) through (d) show the SEM micrographs for LLDPE-SiC composites of
different SiC loadings. As evident in these figures, uniform dispersions of SiC particles
within the LLDPE matrices were achieved. These results suggest that the processing
conditions used for compounding the composites were appropriate.
From the SEM micrographs, it is apparent that some SiC particles had debonded
from the LLDPE matrix, leaving irregularly shaped voids in different regions of the
composites. This demonstrates that the interfacial adhesion between the SiC particles
and the LLDPE matrix was weak, which may be due to the inability of the LLDPE melt
to wet the crevices on the irregular surfaces of SiC particles. At higher magnifications,
the SEM micrographs for the LLDPE matrices with 33.3 vol.% of SiC indicated a
poor dispersion of the filler particles, as seen in Figure 4.7. The non-uniform filler
distribution was a result of dry-blending the material instead of melt-compounding to
prepare this LLDPE-SiC composite.
Upon evaluating the SEM images for the LLDPE-hBN composites, as seen in Figure
4.8, the hBN fillers are not as noticeable as the SiC particulates at 100×magnification.
hBNPTX60 particles were used in this particular composition, which are a spherical
agglomerate shape. Even though the surface appears to look uniform at lower magni-
fications, upon increasing the magnification to 350×, the hBN particles are evident. The
SEM images at higher magnifications, shown in Figure 4.9, reveal that the spherical

Chapter 4. LLDPE Based Composites 43
0
100
200
300
400
500
600
700
800 SiC hBN 33 vol.% hBN + SiC
33.39.365.342.46
Com
pres
sive
Mod
ulus
(MPa
)
Composition (vol.% of filler)
Figure 4.4: Compressive elastic modulus (E) of LLDPE-hBN-SiC composites.
0
5
10
15
20
25
30 SiC hBN 33 vol.% hBN + SiC
33.39.365.342.46
Com
pres
sive
Str
engt
h (M
Pa)
Composition (vol.% of filler)
Figure 4.5: Compressive strength (σy) of LLDPE-hBN-SiC composites.
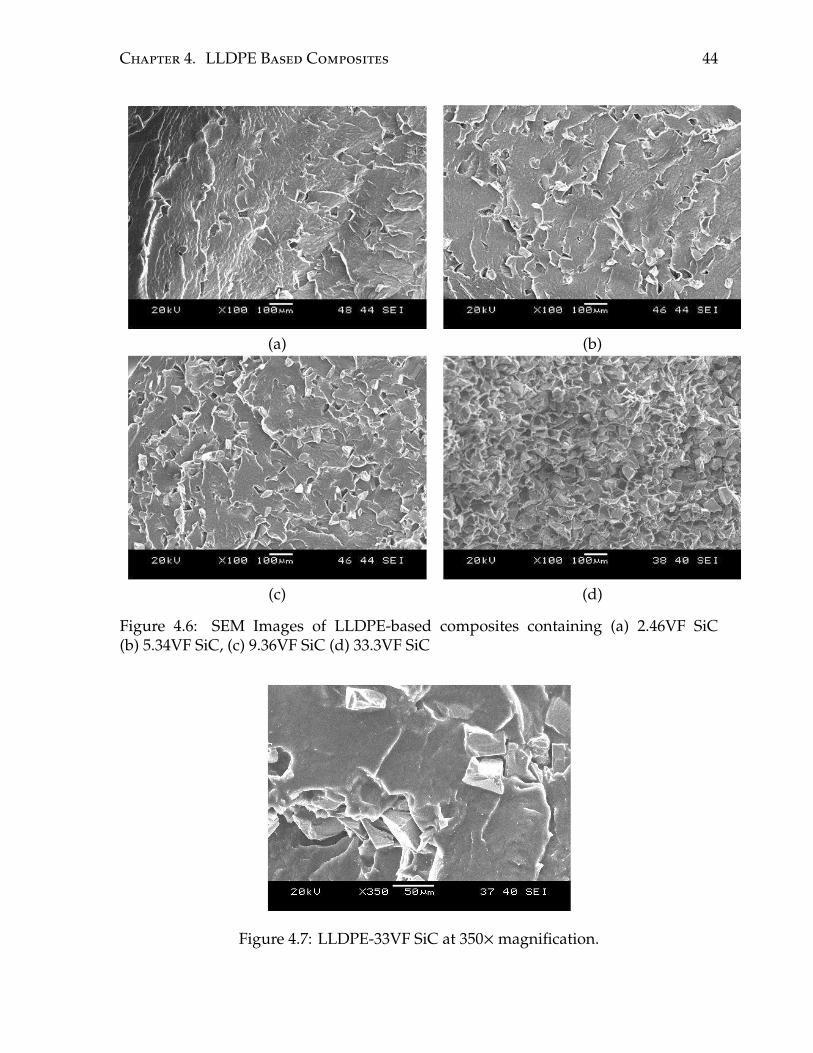
Chapter 4. LLDPE Based Composites 44
(a) (b)
(c) (d)
Figure 4.6: SEM Images of LLDPE-based composites containing (a) 2.46VF SiC(b) 5.34VF SiC, (c) 9.36VF SiC (d) 33.3VF SiC
Figure 4.7: LLDPE-33VF SiC at 350×magnification.

Chapter 4. LLDPE Based Composites 45
agglomerates have been broken down into platelets. The agglomerates are comprised
of boron nitride crystals formed into a spherical shape, but have separated into those
smaller particulates during the melt-blend step. These results suggest that the pro-
cessing conditions within the twin-screw compounder are too aggressive for mixing
LLDPE and hBN spherical agglomerates.
Similar to the LLDPE-SiC composites, SEM micrographs of the LLDPE-hBN com-
posites also revealed that some hBN platelets had been detached from the LLDPE
matrix. This again demonstrates the poor adhesion force between the LLDPE and the
ceramic fillers. With limited adhesion, it is expected that phonon scattering would be
significant at these interfacial regions. To take advantage of the full potential for these
thermal conductive fillers, in turn enhancing the composite’s k, an effective strategy
to improve the compatibility between the polymer matrix and the ceramic filler is
needed.
Finally, the polymer-filler morphology of hybrid composites filled with both SiC
and hBN particulates were also evaluated, and the SEM micrographs are shown in
Figure 4.10. These images depict good dispersion of both SiC and hBN particles in
the LLDPE matrix. In Figure 4.10 (d) it can also be observed that the inclusion of SiC
particles among the smaller hBN platelets helped to bridge the individual platelets. The
formation of a more interconnected thermally conductive network led to an increase
in the composite’s ke f f when hybrid fillers were used. Once again, the hBN spherical
agglomerates appear to have split into smaller crystals and did not retain their original
shape.
4.1.5 Micromechanical Modelling
Micromechanical models, as described in Section 2.6, were compared to experimental
data for both the LLDPE-SiC and LLDPE-hBN composites. The series and parallel
models represent the maximum and minimum theoretical k-values, while the remain-

Chapter 4. LLDPE Based Composites 46
(a) (b)
(c) (d)
Figure 4.8: SEM images of LLDPE-based composites containing (a) 2.46VF hBN(b) 5.34VF hBN, (c) 9.36VF hBN (d) 33.3VF hBN.
Figure 4.9: LLDPE-33VF hBN at 1,500×magnification.

Chapter 4. LLDPE Based Composites 47
(a) (b)
(c) (d)
Figure 4.10: SEM images of LLDPE-based composites containing 33VF hBN and(a) 2.46VF SiC (b) 5.34VF SiC, (c) 9.36VF SiC at 100×magnification, and (d) 9.36VF SiCat 350×magnification.

Chapter 4. LLDPE Based Composites 48
0.0 0.1 0.2 0.30
1
2
3
4
5
6
Ther
mal
Con
duct
ivity
(W/m
-K)
Volume % of hBN
Series Model Parallel Model Geometric-Mean Model Maxwell's Model Bruggeman's Model Nielsen Model Experimental
0.0 0.1 0.2 0.30
1
2
3
4
5
6
Ther
mal
Con
duct
ivity
(W/m
-K)
Volume % of SiC
Series Model Parallel Model Geometric-Mean Model Maxwell's Model Bruggeman's Model Nielsen Model Experimental
(a) (b)
Figure 4.11: Theoretical predictions compared to experimental data for the effect ofdifferent fillers (a) hBN, and (b) SiC.
ing curves are contained within these limits. Due to the similar thermal conductivities
of SiC and hBN, the models for each material do not vary significantly.
Most of the models underestimate the thermal conductivity of the composites when
compared to the experimental data. These models assume that the spherical particles
are independent of one another. Even though the distribution of particles within the
matrix is considered to be relatively uniform, small clusters of SiC and hBN still exist,
assisting in the formation of continuous paths and increasing thermal conductivity.
For the hBN samples, as confirmed by the SEM micrographs, the spherical agglom-
erates have broken down into small crystals. This change in structure would affect the
thermal conductivity and cause deviation from the theoretical models.
Between 10-15 vol.% of filler, the geometric mean model predicts higher ke f f -values
for these composites. At this point, the thermal interfacial resistance must be large
enough to lower the effective thermal conductivity. Phonon scattering, which occurs
at the surface between the matrix and filler, is amplified along with filler content due
to increased surface area to volume ratio.

Chapter 4. LLDPE Based Composites 49
4.1.6 Summary
On the basis of the parametric studies conducted in this work, the effects of a single
ceramic filler and hybrid fillers on thermal conductivity, electrical resistivity, and com-
pressive elastic modulus were investigated. Mechanical testing showed an increase in
compressive modulus corresponding to an increased filler content. Dielectric analysis
revealed that the ceramic fillers used in this work, regardless of the loadings, did not
compromise the electrical resistivity of the polymer, making them good candidates as
thermally conductive fillers. Experimentally measured thermal conductivities of the
fabricated composites suggested that hBN seemed to be a more effective than SiC in
promoting the composite’s ke f f . In addition, the use of hBN together with SiC, which
have different shapes and sizes, demonstrated a synergistic effect, thus increasing the
composite’s ke f f . Therefore, optimization of ke f f in composite materials may result
from the use of hybrids fillers with different geometries.
However, it can be observed from the polymer-filler morphologies that the in-
terfacial adhesions for both composites were weak. This means significant phonon
scattering would occur at the interfaces, producing a much lower k-value when com-
pared to a calculated, theoretical thermal conductivity.
Micromechanical modelling of the composites yields results that underestimate the
actual k-values of the materials. This is likely due to the general assumptions made
by the models, which do not encompass all of the variables of the various filler types,
including size, shape and agglomeration.
4.2 The Effect of Content
A study was conducted in order to determine the effect of filler content on the properties
of a composite. Solid samples containing 5, 10, 20, 30, 40 and 50 vol.% of hBNPT110
in a LLDPE-matrix were fabricated with the intention of determining whether the

Chapter 4. LLDPE Based Composites 50
percolation threshold for this material system exists within these bounds. All of
the samples fabricated in this study were dry-blended and compared to the values
obtained in Section 4.1.
4.2.1 Thermal Properties
4.2.1.1 Thermal Conductivity
The thermal conductivity values are displayed in Figure 4.12. In general, the k increases
along with filler content, confirming that the addition of hBN within the composite
positively influences the thermal conductivity. A significant increase in ke f f is found
when compared to neat LLDPE which has thermal conductivity of 0.31 W/m-K. The
highest ke f f achieved in this study was 4.34 W/m-K for the LLDPE-50 vol.% hBN
composite.
At lower filler loadings, the hBN particles are surrounded by thermally-insulating
LLDPE and do not come in contact with one another, preventing the formation of
a conductive path. Composites with reduced filler content have much lower ke f f -
values. As the amount of filler increases, the ke f f improves, but is still smaller than
the bulk properties of hBN. The interfacial resistance between the matrix and fillers
in the composite is believed to be high, preventing even larger improvements in
ke f f . Once the particles started to come in contact with one another, the ke f f -values
increased since the amount of LLDPE between each platelet decreased. Once the filler
particles form a continuous thermally-conductive path through the materials, the
percolation threshold has been reached. Since the relationship between filler content
and thermal conductivity is relatively linear, this threshold is difficult to determine for
these particular composites, suggesting that the interfacial resistance among individual
fillers is significantly high.
A dry-blend technique was employed for mixing these composites. As seen in

Chapter 4. LLDPE Based Composites 51
Section 4.2.4, the platelets have maintained their size and shape. This particular mixing
method is not as destructive when compared to melt-blending and the platelets are
able to maintain their aspect ratio. These large platelets have decreased surface area in
contact with the matrix material, reducing the thermal interfacial resistance. Also, with
larger particulates, less filler material is required to create interconnectivity, improving
k.
4.2.1.2 Coefficient of Thermal Expansion
Changes in the coefficient of thermal expansion with respect to filler content were
evaluated and the results can be seen in Figure 4.13. The general trend exhibited a
decrease in CTE along with filler content. Neat polymers typically have higher suscep-
tibility to dimensional instability due to increased chain mobility. When inclusions are
added to a plastic, they inhibit chain movement, decreasing CTE. This study confirms
the decrease in CTE with growing quantities of filler material, further constricting
polymer chains. Unlike the coefficient of thermal expansion data seen in Section 4.1,
there is a visibly decreasing trend for the CTE containing hBN. These differences are
believed to be a result of both the mixing method, as well as the particle size and shape.
Dry-blending has a tendency of forming agglomerates, which decreases the CTE, and
particles with larger aspect ratios are associated with an increased effect with respect to
dimensional change. Platelets also have a tendency of aligning, which exhibits much
greater changes in the measured CTE.
4.2.2 Electrical Properties
The electrical resistivity of the composites is evaluated using the impedance and con-
ductivity curves obtained from the dielectric analyzer. The electric properties of the
LLDPE-hBN composites with varying filler content can be found in Figure 4.14. Both
the electric impedance and conductivity curves show a decrease in the electrical re-

Chapter 4. LLDPE Based Composites 52
0 10 20 30 40 500.00.51.01.52.02.53.03.54.04.55.0
Ther
mal
Con
duct
ivity
(W/m
-K)
Composition (vol.% of hBN)
Figure 4.12: Thermal conductivity (k) of LLDPE-hBN composites with varying fillercontent.
0 10 20 30 40 50100
200
300
400
500
Coe
ffici
ent o
f The
rmal
Exp
ansi
on
m/m
/°C
Composition (vol.% of hBN)
Figure 4.13: Coefficient of thermal expansion (CTE) of LLDPE-hBN composites withvarying filler content.

Chapter 4. LLDPE Based Composites 53
sistivity with increasing quantities of hBN. This phenomenon is expected since the
electrical conductivity of hBN is greater than LLDPE. That being said, both com-
ponents are still electrical insulators, where LLDPE and hBNPTX60 have an electrical
resistivity of 1017 Ω-cm and 1014 Ω-cm, respectively [86]. The insulation properties
of each individual material suggests that the composite will not be conductive. The
impedance graph shows a slight fluctuation in electrical resistivity, varying by only
one order of magnitude from 1015 to 1014.
4.2.3 Mechanical Properties
4.2.3.1 Compressive Elastic Modulus
The volume fraction of the matrix to fillers influences the behaviour of a composite.
The general trend for the compressive elastic modulus shows an increase along with
filler content, displayed in Figure 4.15. In general, as more ceramics are added to the
composite, the stiffness of the material increases.
Polymers typically have a low compressive modulus, and are often combined with
fillers to improve the mechanical properties, creating a stronger material. Neat LLDPE
has a E of 107 MPa, which increases to 366 MPa when 50 vol.% hBN is added. As seen
in Section 4.2.4, the cross-sections of the dry-blended samples are not uniform. Due
to the inconsistent morphology, the mechanical properties vary slightly, even between
the same composition.
4.2.3.2 Compressive Strength
The compressive strength does not change significantly with change in filler content.
The results of this study can be seen in Figure 4.16. The strength of the composites
ranges from ∼ 10 to 14 MPa and shows little variability with respect to change in filler.
At higher hBN loadings, a slight decrease is seen in comparison to the initial values.

Chapter 4. LLDPE Based Composites 54
10-2 10-1 100 101 102 103 1041E8
1E9
1E10
1E11
1E12
1E13
1E14
1E15
1E16
1E17
LLDPE-5VF hBN LLDPE-10VF hBN LLDPE-20VF hBN LLDPE-30VF hBN LLDPE-40VF hBN LLDPE-50VF hBN
Impe
danc
e (
)
Frequency (Hz)
(a)
10-2 10-1 100 101 102 103 1041E-17
1E-16
1E-15
1E-14
1E-13
1E-12
1E-11
1E-10
1E-9
LLDPE-5VF hBN LLDPE-10VF hBN LLDPE-20VF hBN LLDPE-30VF hBN LLDPE-40VF hBN LLDPE-50VF hBN
Elec
tric
al C
ondu
ctiv
ity (S
/cm
)
Frequency (Hz)
(b)
Figure 4.14: Electrical properties of LLDPE-hBN composites with varying filler content.(a) electrical impedance, and (b) electrical conductivity.

Chapter 4. LLDPE Based Composites 55
Since dry-blending was used as the mixing method, variability between samples
is common. This mixing technique also increases the possibility of the formation
of agglomerates. Clusters of particles within a composite are known to reduce the
compressive strength. The presence of ceramic agglomerates within a polymer can
decrease the effective contact area, reducing the overall interfacial interaction between
the matrix and filler material, causing a reduction in strength.
4.2.4 Morphology
The cross-sections of the LLDPE-hBN composites are displayed in Figure 4.17. As
previously discussed, these samples were fabricated using a dry-blend technique,
which accounts for the irregular morphology displayed in the micrographs. The
hBN platelets seems to agglomerate and are not dispersed evenly within the LLDPE
matrix. This non-uniform structure is more visible in composites with lower filler
content. Once the composites contain 30 vol.% of hBN or more, the filler appears to
dominate, and minimal amounts of LLDPE are visible. Starting around 20 vol.% hBN,
a network of filler particles through the material is seen, aiding in the improvement of
ke f f . The micrographs show platelets randomly dispersed in all direction within the
three-dimensional matrix, which will also help form a thermally conductive network.
The hBNPT110 platelets are easily distinguishable in the SEM micrographs. Since the
composites were dry-blended there is a decreased chance of damage to the fillers as
a result of processing, which is an issue when the material undergoes the melt-blend
process.
4.2.5 Micromechanical Modelling
The theoretical models discussed in Section 2.6 were compared to the experimental
data found within the LLDPE-hBN effect of content study. As seen in Figure 4.18, the

Chapter 4. LLDPE Based Composites 56
0
50
100
150
200
250
300
350
400
450
50403020105 Neat LLDPE
Com
pres
sive
Mod
ulus
(MPa
)
Composition (vol.% of hBN)
Figure 4.15: Elastic compressive modulus (E) of LLDPE-hBN composites with varyingfiller content.
0
2
4
6
8
10
12
14
16
3020 5040105
Com
pres
sive
Str
engt
h (M
Pa)
Composition (vol.% of hBN)
Figure 4.16: Compressive strength (σy) of LLDPE-hBN composites with varying fillercontent.

Chapter 4. LLDPE Based Composites 57
Magnification250× 1000×
5v
ol.
%10
vo
l.%
20
vo
l.%
30
vo
l.%
40
vo
l.%
50
vo
l.%
Figure 4.17: SEM Images of LLDPE-hBN composites with different filler content atvarying magnifications.

Chapter 4. LLDPE Based Composites 58
similarities between these models and the experimental data are limited. As expected,
the series and parallel models depict the upper and lower bounds of the thermal
conductivity. Most of the models have ke f f -values lower than the experimental results
until 35 vol.% hBN, at which point the geometric-mean model and Nielsen model
prediction exceed the tested composites.
All of the models assume a homogeneous mixture with non-interacting particles.
From the SEM micrographs, we can discern this is not the case. The composites were
fabricated using a dry-blend process, resulting in the formation of agglomerates due to
the uneven dispersion of particles throughout the material. The mixing technique and
morphology of the composites account for the discrepancy seen in ke f f -values below
35 vol.% hBN. After this point, the Nielsen and geometric mean models show a steep
increase for thermal conductivity. These models assume there is little to no thermal
interfacial resistance, which is not the case. Assuming zero phonon scattering at the
barrier between the matrix and filler would result in much higher thermal conductivity
values than the actual experimental results.
These models, with the exception of the Nielsen model, all assume the discrete
phase are spherical, which is not the case in this study. PT110, which is a platelet shape
and has a much larger aspect ratio compared to a typical spherical filler, was added into
an LLDPE matrix. In the Nielsen model, a correction factor A accounted for the change
in shape and the related packing factor. These considerations shifted the ke f f -values
to reflect these modifications. The fit of each model to the empirical data was not
ideal, suggesting additional correction factors are necessary to provide more accurate
mathematical models. Other studies have found discrepancies in Nielsen’s model
with respect to platelet-shaped fillers [57]. In a study by Hill et al., the mathematical
modelling results were similar to those found in this section. For platelets, they had to
modify the A factor and theφ to 30 and 0.85, respectively, before the Nielsen predictions
mimicked the experimental results. The soft nature of hBN allows it to be compressed

Chapter 4. LLDPE Based Composites 59
0.0 0.1 0.2 0.3 0.4 0.50
2
4
6
8
10
Ther
mal
Con
duct
ivity
(W/m
-K)
Volume % of hBN
Series Model Parallel Model Geometric-Mean Model Maxwell's Model Bruggeman's Model Nielsen Model Experimental
Figure 4.18: Theoretical predictions compared to experimental data for the effect ofcontent study.
and deformed under pressure, which increases the packing factor.
4.2.6 Summary
A parametric study was performed to determine the effect of content on the ther-
mal, electrical, mechanical, and morphological properties of a polymeric composite
filled with hBN. The thermal conductivity was found to increase from 0.31 W/m-K
to 4.34 W/m-K through the addition of 50 vol.% hBN into an LLDPE matrix. The
relationship between filler content and thermal conductivity follows a linear trend,
increasing with higher filler content. The coefficient of thermal expansion exhibited a
decreasing trend along with filler content which is likely due to the addition of hBN
inclusions within the composite, inhibiting polymer chain movement. The electrical
resistivity decreases slightly with increasing amounts of hBN. Even though this is the
case, only a minor decrease in impedance results, and the electrical insulating proper-
ties of LLDPE were not compromised with the addition of hBN. Compression testing

Chapter 4. LLDPE Based Composites 60
showed an increase in the modulus of the composites with higher filler content. The E
increased from 107 MPa, for neat LLDPE, to 366 MPa, for LLDPE-50 vol.% hBN. SEM
micrographs displayed irregular morphology. These heterogeneous cross-sections
were expected due to the dry-blend method used for these composites. At compo-
sitions with filler content greater than 20 vol.%, hBN is more prominent within the
micrographs, resulting in the formation of continuous pathways through the material.
Micromechanical modelling was used to predict the behaviour of the composites.
The models that were used did not match the empirical data exactly, which could be
due to a number of reasons. Platelets were used in this particular study, which have
been known to need additional modifications to the Nielsen model for accurate results.
Interfacial resistance between the filler and matrix material also is not accounted for
within any model, which can increase the error between the model and experimental
results.
4.3 Comparison of Mixing Techniques
Thermal conductivity is one of the most important properties when it comes to elec-
tronic packaging. One goal within this project was to create a material with the highest
possible ke f f -value using polymeric composites. When dealing with this type of mate-
rial, thermal resistance at the interface between polymer and filler is a large issue. By
modifying the processing parameters, the properties of the composite vary. The fol-
lowing outlines variations in thermal conductivity due to mixing technique, especially
at high filler content.
Figure 4.19 shows the differences in ke f f for similar compositions, varying only
in the preparation method. The composites discussed in Section 4.1 underwent the
melt-blend process, while those in Section 4.2 were dry-blended. The effective ther-
mal conductivity values of the dry-blended composites are consistently higher than

Chapter 4. LLDPE Based Composites 61
those fabricated by melt-blending. The non-uniform morphology produced from dry-
blending causes agglomeration and grouping of filler particles, which appears to be
advantageous with respect to thermal conductivity. As the filler content increases,
the differences in ke f f between the two processing techniques is even greater. The
twin-screw compounder is effective at breaking up agglomerates, even at high filler
loadings, creating a homogeneous mixture. For dry-blending, regardless of the amount
of filler, uniform mixtures are difficult to fabricate, and ultimately large clusters of hBN
will form within the composite. This particular characteristic of dry-blended compos-
ites, which initially seems undesirable, aids in the formation of thermally conductive
networks throughout the material, increasing ke f f .
Even though hBNPTX60 was used in the melt-blend study and hBNPT110 was used
in the dry-blend study, the differences with respect to type of hBN are considered to
have a minimal effect on the overall effective thermal conductivity. The difference
between the ke f f -values of hBNPTX60 and hBNPT110, processed using the exact same
methodology, is less than 0.12 W/m-K. All of the values presented in Figure 4.19 are
greater than this value, with the exception of 5 vol.%. Therefore, the results still
suggest an improvement in ke f f for composites fabricated using the dry-blend process.
An in-depth discussion regarding the effect of the size and shape of a filler can be in
Section 5.1.
4.4 The Effect of Porosity
The following section outlines the fabrication of linear low-density polyethylene-based
composite foams filled with hBNPT110 platelets and Expancel® 950 DU120 micro-
spheres. Two parametric studies were conducted to investigate the effects of varying
residence time, as well as the concentration of microspheres within the composites.
Data regarding the physical, thermal, and morphological properties of each material

Chapter 4. LLDPE Based Composites 62
0 5 10 15 20 25 30 35 400.0
0.5
1.0
1.5
2.0
2.5
3.0
3.5
Dry-Blend Melt-Blend
Ther
mal
Con
duct
ivity
(W/m
-K)
Composition (vol.% hBN)
Figure 4.19: Thermal Conductivity (k) of LLDPE-hBN composites fabricated usingvarious processing techniques.
was collected. The primary objective of this work was to show that constrained poly-
meric foaming processes are a feasible method of aligning filler materials within the
polymer matrix to maintain high thermal conductivity, while reducing the overall mass
of the composite. The theory behind this method suggests that the extensional flow
fields associated with the expansion of the microspheres could assist in aligning the
thermally conductive filler particles, forming a three-dimensional conductive network
throughout the matrix and increasing the effective thermal conductivity.
The fabrication method employed in these studies varied from all of the other
composites to accommodate the addition of Expancel® microspheres. A dry-blend
technique was utilized in order to mix the composites. Due to the similarities in the melt
temperature of LLDPE and the activation temperature of the Expancel® microspheres,
melt-blend processing was not an option. The LLDPE, Expancel® and hBN were
measured out in the appropriate quantities and blended together at room temperature
to create a homogeneous mixture. A summary of the material compositions studied

Chapter 4. LLDPE Based Composites 63
in this work are shown in Table 4.2.
During the compression molding process, the dry-blended mixtures were com-
pacted at room temperature, and then heated to 130 °C. The samples remained at this
temperature for 15 minutes, at which point they were heated to 180 °C and compressed
at 13.8 MPa (2000 psi) for the desired length of time. All of the samples were fabricated
using constrained foaming molding, which means that they were unable to expand
beyond the dimensions of the mold cavity which has a 20 mm diameter and is 10 mm
in height.
Expancel® microspheres are comprised of a hydrocarbon particles surrounded by
a thermoplastic shell, which is activated when a predetermined elevated temperature
is reached. This particular grade of Expancel has an initial diameter of 18-24 µm and
can expand up to 120 µm. The manufacturer determined the activation temperature
to be between 138 to 210 °C, so for this study the composites were heated to 180 °C.
The residence time refers to the length of time the samples were heated at this elevated
temperature.
4.4.1 Morphology
SEM micrographs were used as visual evidence of the foamed structure, as well as
the enhanced alignment and interconnectivity of the hBN platelets within the LLDPE
matrix.
The microstructure of all of the composites can be found in Figures 4.20 to 4.23. In all
of the micrographs, a random distribution of voids is seen, which can be attributed to
the dry-blending procedure used to fabricate these samples. Although the dispersion
of hBN platelets and the voids were not uniform, studies have associated high ke f f
with dry-blending techniques, therefore deeming this method appropriate for this
particular application [41].
As seen in Figures 4.20 and 4.21, the addition of greater amounts of Expancel®

Chapter 4. LLDPE Based Composites 64
Composite LLDPE BN Expancel® Residence TimeName (Vol.%) (Vol.%) (mg) (min.)
LLDPE-33 (0.5×) 66.7 33.3 7.2 2LLDPE-33 (1.0×) 66.7 33.3 14.4 2LLDPE-33 (1.5×) 66.7 33.3 21.6 2LLDPE-33 (2.0×) 66.7 33.3 28.7 2
LLDPE-50 (0.5×) 50.0 50.0 7.2 2LLDPE-50 (1.0×) 50.0 50.0 14.4 2LLDPE-50 (1.5×) 50.0 50.0 21.6 2LLDPE-50 (2.0×) 50.0 50.0 28.7 2
LLDPE-33 (2 min.) 66.7 33.3 14.4 2LLDPE-33 (5 min.) 66.7 33.3 14.4 5LLDPE-33 (8 min.) 66.7 33.3 14.4 8
LLDPE-50 (2 min.) 50.0 50.0 14.4 2LLDPE-50 (5 min.) 50.0 50.0 14.4 5LLDPE-50 (8 min.) 50.0 50.0 14.4 8
Table 4.2: Porous LLDPE-hBN Compositions
visibly increases the number of pores within the composite. The composites containing
0.5× and 1.0× the theoretically-calculated amount of Expancel®, necessary to fill the
specified void (either 20 or 40 vol.%), appear to have not enough microspheres to
create interconnectivity between pores, while the composites containing 1.5× and 2.0×
the theoretically-calculated amount do. As expected, the samples containing 40 vol.%
voids have a higher number of pores in comparison to the 20 vol.% void samples.
Double the amount of Expancel® were added to the 40 vol.% void samples, therefore
increasing the porosity of the material. In general, the pores seen in the composites
containing high quantities of filler are smaller than those with lower amounts of hBN.
Figures 4.22 and 4.23 show the effect of varying residence time. As seen in other
studies [51, 53], there is an optimal residence time for maximum expansion of the
microspheres. Before this ideal time, the microspheres will not have ample time to
expand fully, and after this point the bubbles will begin to lose gas and contract. These
figures indicate that increasing the residence time to 5 minutes did not affect the pore

Chapter 4. LLDPE Based Composites 65
size, but increasing the time to 8 minutes was detrimental to the constrained foam
expansion. After 8 minutes at 180 °C, excessive gas loss from the expanded Expancel®
resulted due to high gas diffusivity through LLDPE.
From the micrographs, an average cell size and cell population density were cal-
culated. The cells were observed to be almost spherical and uniform in shape, with
cell sizes ranging from 50 to 130 µm. The uniform nature of the cell structure can
be attributed to the use of Expancel® microspheres as the foaming agent. If gas was
directly injected into the composite melt during a physical foaming process, the cells
would not be as readily dispersed in the system. Likewise, if chemical blowing agents
were used to create the porous composite, then severe cell coalescence would result,
since there is no physical constraint related to a maximum expansion of spheres like
Expancel®. Therefore, this method of creating a cellular structure is most desirable for
this particular application. As seen in the micrographs, these composites consist of
two solid phases, the LLDPE matrix and the hBN platelets, and a gaseous phase.
Figure 4.24 displays the cellular structure within the composite along with the
successful alignment of hBN around the expanded microsphere. At higher magnifi-
cations, the hBN platelets can easily be seen interconnected and aligned along the cell
walls amongst the adjacent cells. It is theorized that the extensional flow field, gener-
ated within the cell wall upon the expansion of the Expancel® microspheres, oriented
the hBN platelets and aligned them along the cell walls throughout the LLDPE-hBN
composite foams. The highly-interconnected and perfectly aligned hBN network led
to thermally conductive pathways throughout the cellular composite structure, over-
coming the thermal insulation property of typical plastic foams and promoting the
ke f f .

Chapter 4. LLDPE Based Composites 66
Void Percent20 % 40 %
0.5×
(a) (b)
1×
(c) (d)
1.5×
(e) (f)
2×
(g) (h)
Figure 4.20: SEM Images of LLDPE Foamed Composites with varying amounts ofmicrospheres, containing 33 vol.% with 20 and 40 void percent.

Chapter 4. LLDPE Based Composites 67
Void Percent20 % 40 %
0.5×
(a) (b)
1×
(c) (d)
1.5×
(e) (f)
2×
(g) (h)
Figure 4.21: SEM Images of LLDPE Foamed Composites with varying amounts ofmicrospheres, containing 50 vol.% with 20 and 40 void percent.

Chapter 4. LLDPE Based Composites 68
Void Percent20 % 40 %
2m
inu
tes
(a) (b)
5m
inu
tes
(c) (d)
8m
inu
tes
(e) (f)
Figure 4.22: SEM Images of LLDPE Foamed Composites with varying residence time,containing 33 vol.% with 20 and 40 void percent.

Chapter 4. LLDPE Based Composites 69
Void Percent20 % 40 %
2m
inu
tes
(a) (b)
5m
inu
tes
(c) (d)
8m
inu
tes
(e) (f)
Figure 4.23: SEM Images of LLDPE Foamed Composites with varying residence time,containing 50 vol.% with 20 and 40 void percent.

Chapter 4. LLDPE Based Composites 70
(a) (b)
Figure 4.24: SEM Images of LLDPE Foamed Composites with 1.5× the calculatedamount of Expancel necessary to fill 20 void% at (a) 250×, and (b) 1,000×magnification.
4.4.2 Thermal Conductivity
The thermal conductivities of the cellular composite materials were measured. The
effect of various properties on the ke f f was compared and contrasted, and can be seen
in the following figures.
In Figure 4.25 (a) and (b), the effects of cell size and cell population on ke f f are
illustrated. LLDPE-hBN composites fabricated containing both 20% and 40% volume
fraction of voids are included. All of these samples were kept in the mold for a 2 minute
residence time once the temperature reached 180 °C. The variation in cell size and cell
density were a direct result of the Expancel® content, ranging from 0.5× to 2.0× the
theoretically-calculated amount of microspheres to fill a 20 vol.% or 40 vol.% void in
the composite foams, once fully expanded. The amount of hBN content within the cell
walls varies between 33 vol.% and 50 vol.%. It can be observed that an optimal cell size
and cell density both exist, to promote the ke f f of the LLDPE-hBN composite foams,
except in the case containing 40 vol.% voids and 33 vol.% hBN in the cell wall. When
the fabricated cellular materials containing 20%-unfilled space and 40%-unfilled space
are compared, the optimal cell size decreases and the optimal cell density increases,
along with an increase in unfilled volume within the mold cavity. The existence of
both optimal cell size and cell density to promote ke f f implies that there are at least two
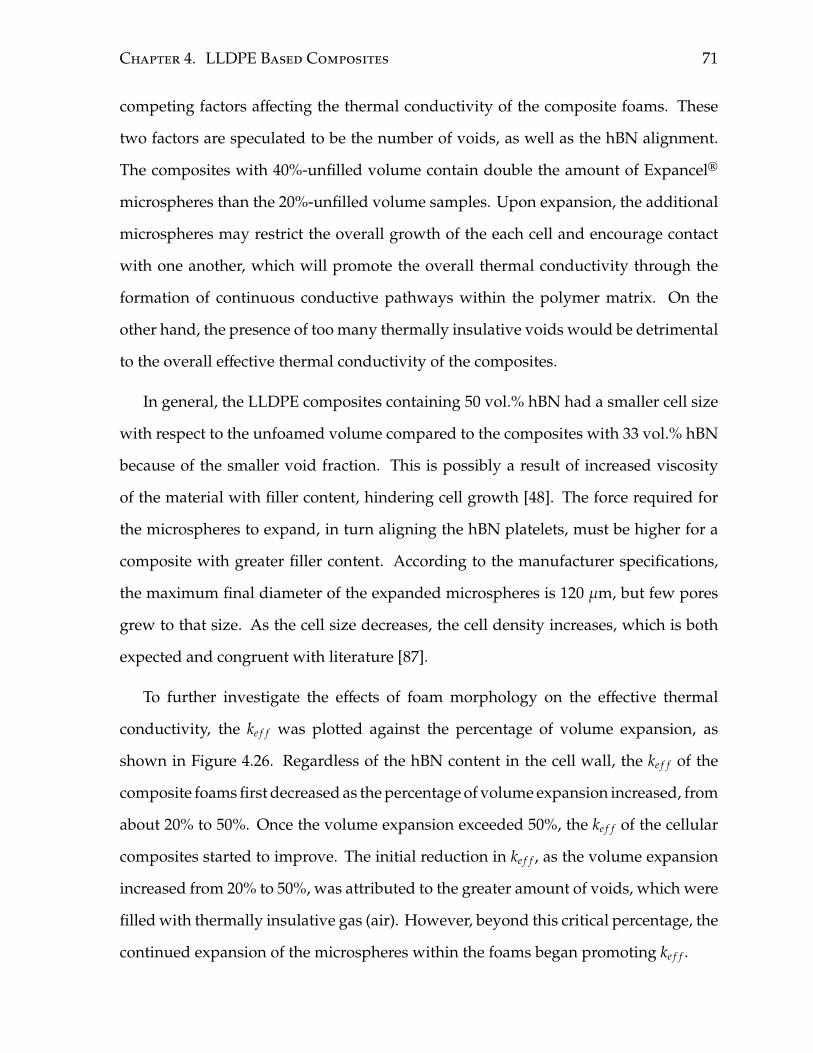
Chapter 4. LLDPE Based Composites 71
competing factors affecting the thermal conductivity of the composite foams. These
two factors are speculated to be the number of voids, as well as the hBN alignment.
The composites with 40%-unfilled volume contain double the amount of Expancel®
microspheres than the 20%-unfilled volume samples. Upon expansion, the additional
microspheres may restrict the overall growth of the each cell and encourage contact
with one another, which will promote the overall thermal conductivity through the
formation of continuous conductive pathways within the polymer matrix. On the
other hand, the presence of too many thermally insulative voids would be detrimental
to the overall effective thermal conductivity of the composites.
In general, the LLDPE composites containing 50 vol.% hBN had a smaller cell size
with respect to the unfoamed volume compared to the composites with 33 vol.% hBN
because of the smaller void fraction. This is possibly a result of increased viscosity
of the material with filler content, hindering cell growth [48]. The force required for
the microspheres to expand, in turn aligning the hBN platelets, must be higher for a
composite with greater filler content. According to the manufacturer specifications,
the maximum final diameter of the expanded microspheres is 120 µm, but few pores
grew to that size. As the cell size decreases, the cell density increases, which is both
expected and congruent with literature [87].
To further investigate the effects of foam morphology on the effective thermal
conductivity, the ke f f was plotted against the percentage of volume expansion, as
shown in Figure 4.26. Regardless of the hBN content in the cell wall, the ke f f of the
composite foams first decreased as the percentage of volume expansion increased, from
about 20% to 50%. Once the volume expansion exceeded 50%, the ke f f of the cellular
composites started to improve. The initial reduction in ke f f , as the volume expansion
increased from 20% to 50%, was attributed to the greater amount of voids, which were
filled with thermally insulative gas (air). However, beyond this critical percentage, the
continued expansion of the microspheres within the foams began promoting ke f f .

Chapter 4. LLDPE Based Composites 72
50 60 70 80 90 100 110
1.5
2.0
2.5
3.0
3.5
4.0
4.5
80%-filled mold & 50 vol.% hBN 80%-filled mold & 33 vol.% hBN 60%-filled mold & 50 vol.% hBN 60%-filled mold & 33 vol.% hBN
k eff (
W/m
-K)
Cell Size ( m)(a)
104 105 106
1.5
2.0
2.5
3.0
3.5
4.0
4.5
80%-filled mold & 50 vol.% hBN 80%-filled mold & 33 vol.% hBN 60%-filled mold & 50 vol.% hBN 60%-filled mold & 33 vol.% hBN
k eff (
W/m
-K)
Cell Population Density (cells/cm3)(b)
Figure 4.25: Effect of cell morphology on ke f f of LLDPE-hBN composite foams. (a)Effect of cell size on ke f f (b) Effect of cell population on ke f f .

Chapter 4. LLDPE Based Composites 73
The ke f f -values were also compared to the ke f f of solid samples, with the same
LLDPE matrix and hBN filler, as described in Section 4.2. The corrected hBN quantities
were used for this comparison. As an example, the LLDPE-hBN foams containing
33.3 vol.% hBN within the cell walls have a corrected hBN content of 27 vol.% and
a void fraction of 0.17. The corrected hBN content was determined through the use
of void fractions of the corresponding foams, determined through the use of mass
density as described in the previous chapter. Figure 4.27 indicates that the ke f f of the
foams with their corrected hBN content is quite close to the solid samples containing
a similar quanitity of filler. Deviation from the solid samples became more apparent
when the volume expansion increased and the ke f f of the foamed samples started to
decrease.
In addition to variations in the amount of Expancel® content and the unfilled vol-
ume of the mold cavity, residence time of the dry-blended mixture was also modified
to investigate the effects. Residence time was varied from 2, 5, and 8 minutes to de-
termine the change in expansion. As seen in Figure 4.28, an increase to 5 minutes did
not change the microstructure, although a residence time of 8 minutes did not yield
desirable results. After 8 minutes at an elevated temperature of 180 °C, excessive gas
loss from the expanded microspheres resulted due to high diffusivity through LLDPE.
This data suggests that an optimal residence time exists, and that compression molding
for a length of time greater than 5 minutes is not recommended.
4.4.3 Summary
In this study, a novel foam structure of PMC filled with thermally conductive and
electrically insulative ceramic platelets was successfully fabricated using a simple and
effective processing technology. Thermal conductivity measurements of the fabricated
LLDPE-hBN composite foams indicated the unique cellular structure led to a signifi-
cant increase in ke f f when compared to LLDPE. This work also demonstrated that the

Chapter 4. LLDPE Based Composites 74
20 30 40 50 60 70 80
1.5
2.0
2.5
3.0
3.5
4.0
4.5
50 vol.% hBN 33 vol.% hBN
k eff
(W/m
-K)
Percentage of Volume Expansion (%)
Figure 4.26: Effect of foam volume expansion on ke f f of LLDPE-hBN composite foams.
0 10 20 30 40 50 600
1
2
3
4
5
Solid Sample 33 vol.% hBN 50 vol.% hBN
k eff (
W/m
-K)
Corrected hBN Content (vol.%)
Figure 4.27: Comparison of ke f f of LLDPE-hBN composite foams to that of LLDPE-hBNsolid composites.

Chapter 4. LLDPE Based Composites 75
percentage of volume expansion is a critical factor in the promotion of ke f f . The align-
ment of hBN platelets within the composite is induced by the extensional flow fields
during the expansion process of the microspheres. This foaming process also aids in
the formation of a three-dimensional thermally conductive network throughout the
composite foam.
This initial study demonstrates that a thermally conductive foam structure can be
fabricated for lightweight electronic packaging applications. It is also proposed that
this processing strategy be extended for use in other polymer matrix and filler systems
in order to tailor the multifunctional properties of the PMC foams for additional
applications.

Chapter 4. LLDPE Based Composites 76
2 3 4 5 6 7 8
20
30
40
50
60
70
80
90
100
60%-filled mold & 50 vol.% hBN 60%-filled mold & 33 vol.% hBN 80%-filled mold & 50 vol.% hBN 80%-filled mold & 33 vol.% hBN
Perc
enta
ge o
f Vol
ume
Expa
nsio
n (%
)
Residence Time (min.)
Figure 4.28: Effect of residence time on the foam volume expansion.

Chapter 5
PPS Based Composites
This chapter examines polyphenylene sulfide-based composite materials filled with
different types of hBN particulates. Two different parametric studies were conducted
to investigate the effects of hBN within this high performance matrix material. The first
study pertained to the effect of filler size, shape, and aspect ratio on the composite’s
properties. The second study focused on hybrid fillers and the effect of combining
multiple ceramic fillers in one composite. The overall performance of the matrix
material was also compared to that of LLDPE. Data was collected and analyzed with
respect to their physical, thermal, electrical, and mechanical properties.
5.1 The Effect of Filler Size and Shape
Polyphenylene sulfide-based composite materials were filled with four different types
of hBN particulates. A study was conducted to investigate the effect of filler size, shape,
and aspect ratio on the properties of composite materials. Data was collected and
analyzed with respect to their physical, thermal, electrical, and mechanical properties.
The four types of hBN were discussed in Section 3.1 and are referred to in terms
of the name given by the manufacturer: PTX60, PTX25, PT110, and PT371. All of the
77

Chapter 5. PPS Based Composites 78
compositions had PPS as a matrix material and contained 33.3 vol.% of hBN in order
to provide a consistent base for comparative purposes.
5.1.1 Thermal Properties
5.1.1.1 Thermal Conductivity
The effective thermal conductivity of composites containing each of the four types of
hBN were evaluated. The thermal conductivity of the bulk material does not vary,
since the base filler material remains as hBN, but when added into a PPS matrix the
effects were unknown. From Figure 5.1, the ke f f -values do not appear to fluctuate
significantly, although slight differences can be seen. These changes are likely due to
the size, shape, and aspect ratio each type of hBN is manufactured into.
Out of the four composites, PPS-hBNPT371 has a marginally higher ke f f than the
other three. This grade of hBN is a medium-density agglomerate with the largest
particle size. PT371 is 275 µm, while the other grades range from 25 to 60 µm. Even
though these particles are initially larger, the SEM micrographs show that the hBN
have broken down into small particles. From the SEM micrographs, the composites
containing PT371 appear to have a mixture of large and small hBN platelets, which
may aid in the formation of continuous conductive paths, leading to higher ke f f -values.
When comparing the grades of hBN, those formed into spherical and medium-
density agglomerates are more fragile in comparison to the PT110 platelets. The
delicate nature of the agglomerates resulted in the breakdown of these clusters, as
seen in Section 5.1.4. For the three grades of hBN that have broken down into small
crystals, a decreasing trend is apparent with increasing particle size. The PPS-hBNPTX25
and PPS-hBNPTX60 broke down into similar sized particulates, resulting in a similar
ke f f .
For the composites containing PT110 platelets, the ke f f values are slightly higher

Chapter 5. PPS Based Composites 79
than the two composites containing spherical agglomerates. This difference could be
related to the size of the platelets, which are larger than the other hBN crystals. This
larger particle size is believed to account for the increase in ke f f , due to decreased
phonon scattering as a result lowered surface area between the particle and matrix, in
turn lowering interfacial resistance.
As previously discussed, in an anisotropic material the in-plane thermal conductiv-
ity is much higher than the through-plane. In the interest of reducing the anisotropic
nature of composites spherical agglomerate were selected for use in these materials.
These isotropic fillers could assist in promoting the effective thermal conductivity of
the composite since there is no directional dependence. Therefore, if the spherical
agglomerate was maintained the overall k would increase in all directions. Since the
PTX25 and PTX60 broke down into smaller platelets, this effect could not be seen.
5.1.1.2 Coefficient of Thermal Expansion
The coefficients of thermal expansion for the PPS-based composites with varying types
of hBN were obtained, as seen in Figure 5.2. Both the CTE before and after the glass
transition temperature (Tg) were found. The values for the CTE below to the Tg
were observed to be much lower than those above. All of the composites contained
equivalent amounts of hBN, but varied with respect to the size, shape, and aspect
ratio. There is no significant variation between the CTEs for the materials containing
different types of hBN. These results are expected and are in accordance with the rule of
mixtures. The ROM does not take size, shape, orientation or aspect ratio into account,
and as such only varies with respect to filler content. For a composite containing
33.3 vol.% of hBN in a PPS matrix, the ROM predicts a CTE of ∼ 350 × 10−6/°C.
Discrepancies between the ROM and the measured values are likely a result of not
taking the aforementioned filler characteristics into account, along with poor adhesion
between the matrix and inclusions.

Chapter 5. PPS Based Composites 80
Substantial differences are seen for the CTE found before and after the Tg. The Tg
represents the point at which the CTE undergoes a significant change, above which
expansion of the material begins to occur at more rapid rate. The rigidity of the com-
posite decreases, along with the adhesive strength, resistance to moisture, dielectric
strength and volume resistivity [88].
Since the PPS-based composites are being evaluated for high temperature applica-
tions, the CTE above the Tg is more relevant. To ensure the composite is well-suited for
electronic packaging applications, the CTE above the Tg must be studied. At higher
temperatures, the CTE is on average 125 × 10−6/°C.
5.1.2 Electrical Properties
The electrical impedance and conductivity of these composites were measured and are
displayed in Figures 5.3 (a) and (b). The impedance curves show slight variations in
the electrical resistivity of the composites. Since the bulk properties of each of the hBN
types is similar, the electrical properties should be congruent with one another. Once
again PTX25 and PTX60, both of the hBN particles that are spherical agglomerates,
behave in a very similar manner. All of the composites remained electrically resistive,
with values ranging from 1012 to 1015. Therefore, the addition of the thermally con-
ductive fillers improved the ke f f of the composite without compromising the electrical
resistivity.
5.1.3 Mechanical Properties
5.1.3.1 Compressive Elastic Modulus
The compressive elastic modulus values of the PPS-hBN composites with different
size and shaped fillers are seen in Figure 5.4. Out of the agglomerate-based particles,
PTX25 has the highest compressive modulus. This grade appears to have broken down

Chapter 5. PPS Based Composites 81
PTX600.0
0.5
1.0
1.5
2.0
2.5
PT371 PT110PTX25
Ther
mal
Con
duct
ivity
(W/m
-K)
Type of hBN
Figure 5.1: Thermal conductivity (k) of PPS-hBN composites with different size/shapefillers.
0
50
100
150
200
PT371 PT110PTX25PTX60
Before Tg
After Tg
Coe
ffici
ent o
f The
rmal
Exp
ansi
on
m/m
/°C
Type of hBN
Figure 5.2: Coefficient of thermal expansion (CTE) for different sizes and shapes ofhBN, above and below the Tg.

Chapter 5. PPS Based Composites 82
10-2 10-1 100 101 102 103 10410610710810910101011101210131014101510161017
Pure PPS PTX25 PTX60 PT110 PT371
Impe
danc
e (
)
Frequency (Hz)
(a)
10-1 100 101 102 103 10410-1810-1710-1610-1510-1410-1310-1210-1110-1010-910-810-7
Pure PPS PTX25 PTX60 PT110 PT371
Elec
tric
al C
ondu
ctiv
ity (S
/cm
)
Frequency (Hz)
(b)
Figure 5.3: Electrical properties of PPS-hBN composites with different sizes and shapesof hBN. (a) electrical impedance, and (b) electrical conductivity.

Chapter 5. PPS Based Composites 83
into the smallest size particles, which is likely the cause for the improvements in E. For
the composites containing PTX60, although there is a large deviation between values
obtained for different samples of the same composition, the general trend shows results
similar to those of PTX25. PTX25 and PTX60 performed quite similarly within all of the
tests, which suggests that the hBN agglomerates broke down into comparable sizes
during the composite processing and had analogous particle distributions. Similar
studies have also found large deviations in data collected from compression testing
[89]. Smaller particles are associated with higher compressive moduli due to their
enhanced dispersion with the polymer matrix. The presence of agglomerates reduces
the mechanical properties of a composite.
From the SEM micrographs, the composites with PT371 appear to have a range of
particle sizes containing both smaller and larger hBN crystals within the matrix. The
aggressive processing conditions for the composites caused the medium-density ag-
glomerates to break down. The combination of small hBN crystals dispersed between
larger particulates is believed to create a synergistic effect, improving E.
The composites containing PT110 have the lowest compressive elastic modulus. As
expected, the composites containing large particles have the least desirable mechanical
properties.
5.1.3.2 Compressive Strength
Figure 5.5 exhibits the compressive strength values for PPS-hBN composites contain-
ing various size and shaped fillers. The compressive strengths show slight variability,
similar to the compressive elastic moduli. Once again, PTX25 and PTX60 have similar
properties, likely due to the comparable size of hBN crystals, along with the homoge-
neous dispersion of these particulates within the composites. The highest σy values
were found for the composites containing PT371. The mixture of small and large hBN
crystals are believed to be the cause of positive synergy, increasing σy. Similar to the

Chapter 5. PPS Based Composites 84
compressive elastic modulus, the PPS-hBNPT110 composites have the lowest compres-
sive strength. The larger-sized platelets are believe to be the cause of the decrease in
mechanical properties.
5.1.4 Morphology
The morphologies of PPS-33.3 vol.% hBN with different grades of filler can be seen in
Figure 5.6. While PT110 has appeared to retain the shape, PTX25, PTX60, and PT371 all
have not. The original platelet shape of PT110 is still visible in the SEM micrographs,
but the other three grades have broken down into small hBN crystals. The latter three
grades are all comprised of small crystals formed into different shapes, but are quite
vulnerable to separation. The processing conditions used in the manufacuring process
were too severe, causing this breakdown. Even though short melt-blend times were
used, at low mixing speeds, the original shape of the hBN was not maintained. Many
of the hBN crystals are <10 µm in size, which is much smaller than the manufacturer’s
specifications for the various grades, ranging from 25-275 µm. Other studies have also
seen agglomerate disintegration associated with melt-blend and compression molding
processes [72].
In terms of relative sizing, the filler sizes appear to increase in the following order:
PTX60, PTX25, PT371, and PT110. These sizes have been related to the performance
of the composite materials and therefore bear immense importance within this study.
5.1.5 Micromechanical Modelling
Figure 5.7 depicts the results of Nielsen’s model compared to the experimental data.
Since this was the only model that took filler shape, orientation and packing factor into
account, it was selected for this analysis. There is no variability between the values
computed for PTX25 and PTX60 because both are spherical fillers. An increased

Chapter 5. PPS Based Composites 85
0
250
500
750
1000
1250
PT110PT371PTX25PTX60
Com
pres
sive
Mod
ulus
(MPa
)
Type of hBN
Figure 5.4: Compressive elastic modulus (E) of PPS-hBN composites with differentsize/shape fillers.
0
10
20
30
40
50
PT371 PT110PTX25PTX60
Com
pres
sive
Str
engt
h (M
Pa)
Type of hBN
Figure 5.5: Compressive strength (σy) of PPS-hBN composites with different size/shapefillers.

Chapter 5. PPS Based Composites 86
Magnification250× 1000×
PT
X60
PT
X25
PT
110
PT
371
Figure 5.6: SEM Images of PPS-hBN composites with different size/shape filler, atvarying magnifications.

Chapter 5. PPS Based Composites 87
0.0
0.5
1.0
1.5
2.0
2.5
PT371PTX60
Nielsen Model Experimental
PT110PTX25
Ther
mal
Con
duct
ivity
(W/m
-K)
Type of hBN
Figure 5.7: Theoretical predictions compared to experimental data for different sizesand shapes of hBN.
thermal conductivity is seen with Nielsen’s model with change in shape and packing
factor, as seen for PT110. The platelets have a much larger aspect ratio and as such
improve the composite’s ke f f . Since the Nielsen model accounts for filler differences,
the calculated values reflect the variability.
Discrepancies between the calculated values and the experimental data are likely a
result of the hBN particle breakdown, for PTX25, PTX60, and PT371. Since the original
shape of the particulates is not maintained, the measured ke f f will inevitably deviate
from the micromechanical model.

Chapter 5. PPS Based Composites 88
5.1.6 Summary
PPS-based composites with 33.3 vol.% of different size and shape hBN filler particles
were fabricated in this study. The intention was to determine the effects of filler size,
shape, and aspect ratio on the thermal, electrical, mechanical and physical properties
of the composites. Even though the bulk properties of the hBN particulates were all
similar, the results showed variablility. SEM micrographs showed that the processing
conditions used in this study were too aggressive for the delicate nature of hBN. The
spherical and medium-density agglomerates brokedown from their original shape into
small hBN crystals. PPS-hBNPT371 exhibited marginally higher thermal conductivity
values compared to the other three types of hBN. The range of different sized hBN
particles within this composite is believed to improve the interconnectivity of filler
materials in the polymer matrix, lowering the thermal interfacial resistance and result-
ing in increased ke f f . The electrical conductivity of the material also showed similar
results. All of the composites remained electrically resistive, which was expected,
since hBN is an insulator. In regards to the mechanical properties, the composites
with PT371 have the best E and σy likely due to the range in hBN particle sizes, creat-
ing a synergistic effect. PTX25 and PTX60 also exhibited high mechanical properties,
since the spherical agglomerates brokedown into small hBN and were dispersed in a
homogenously throughout the composites.
5.2 The Effect of Hybrid Fillers
The following compositions were fabricated to determine whether a positive syner-
gistic effect exists when multiple ceramic fillers are combined in a polymeric matrix.
As outlined in Table 5.1, predetermined ratios of hBNPTX60 and hBNPT110 were added
to PPS in a melt-blending process to form PPS-hBN1:0, PPS-hBN4:1, PPS-hBN3:1, PPS-
hBN2:1, and PPS-hBN0:1 composites. The primary goal was to determine whether

Chapter 5. PPS Based Composites 89
Composite Vol.% of PPS Vol.% of hBNPTX60 Vol.% of hBNPT110 Ratio of
Name hBNPTX60:hBNPT110
PPS-hBN1:0 66.7 33.3 0 1:0PPS-hBN4:1 66.7 26.6 6.7 4:1PPS-hBN3:1 66.7 25.0 8.3 3:1PPS-hBN2:1 66.7 22.2 11.1 2:1PPS-hBN0:1 66.7 0 33.3 0:1
Table 5.1: PPS-hBN Hybrid Compositions
smaller PTX60 spherical agglomerates would fit in between larger PT110 platelets
to create interconnectivity throughout the polymer matrix, and increase the effective
thermal conductivity of the composites.
5.2.1 Thermal Properties
5.2.1.1 Thermal Conductivity
Figure 5.8 shows the effect of hybrid fillers on the thermal conductivity of PPS-based
composites with 33.3 % hBN. Neat PPS has a low thermal conductivity of 0.22 W/m-
K, which was increased through the addition of hBN. As discussed in Section 5.1,
composites with a single type of hBN (ie. PTX60 and PT110) had similar thermal
conductivities. PPS-hBN composites filled with either hBNPTX60 or hBNPT110 increased
from 0.22 W/m-K to 1.75 W/m-K and 1.89 W/m-K, respectively. As seen in Figure 5.13,
the SEM images show the microstructure of PPS-hBNPTX60 samples. Although this
particular grade of hBN should be in a spherical agglomerate, the filler particles seem
to have broken down into smaller crystals, approximately 10 µm or less in size, during
the melt-blend and compression molding processes. Smaller particulates of hBNPTX60
led to higher thermal contact resistance between the PPS matrix and the hBN fillers,
resulting in a lower ke f f for PPS-hBNPTX60 composites compared to that of hBNPT110
[90].

Chapter 5. PPS Based Composites 90
The addition of multiple types of hBN had a positive synergistic effect on the com-
posites. Hybrids of hBNPTX60 and hBNPT110 in ratios of PPS-hBN4:1, and PPS-hBN3:1
resulted in an increased ke f f compared to single-filler composites. The initial goal was
to use hBNPT110 platelets to bridge the gaps between hBNPTX60 spherical agglomer-
ates, creating interconnectivity throughout the material. The smaller particles have
the ability to occupy space the larger hBNPT110 platelets cannot, resulting in a more
efficient packing of the fillers within the composite. Despite the hBNPTX60 agglomer-
ates breaking down into smaller crystals, a synergistic effect was seen, increasing the
thermal conductivity. The ke f f -values of 4:1 and 3:1 were 1.97 W/m-K and 2.04 W/m-K,
respectively. A slight decrease in the k was seen for PPS-hBN2:1.
An optimal volume ratio of small to large hBN particulates, with regards to thermal
conductivity, was found to be PPS-hBN3:1. When the filler ratio was increased to 2:1,
a reduction in ke f f was found. This decrease is due to an insufficient amount of fine,
or small particles dispersed within the PPS matrix, between the larger platelets. With
both the PPS-hBN3:1 and PPS-hBN4:1, the smaller crystal aided in the formation of a
three-dimensional continuous conductive pathway, thus increasing ke f f .
5.2.1.2 Coefficient of Thermal Expansion
Figure 5.9 shows the change in CTE for PPS-hBN composites with hybrid fillers. Once
again, large differences are not seen between composites. The overall amount of hBN
within the polymer matrix is consistent at 33.3 vol.%. Since the bulk CTE of hBN is
the same, regardless of grade, the effect of size and shape on the material’s CTE is not
assumed to be considerable.
A noticeable difference is seen between the CTEs above and below the Tg. At this
point the composite changes from a hard, glassy state below the Tg to a soft, rubbery
state above the Tg. For a polymer above the glass transition temperature, the motion of
polymer chains are adjusted through thermal vibration, therefore allowing free volume

Chapter 5. PPS Based Composites 91
to dominate [91]. When the polymer tries to expand or contract, the filler particles resist
the change and create stress within the material, reducing the dimensional change.
The CTE for the PPS-hBN composite containing PT110 was slightly lower than the
other composites above the Tg. Some studies have shown an increased effect through
the addition of fillers with high aspect ratios [92]. If the fibers or platelets are aligned,
reduction in CTE can be much greater. Even though the SEM micrographs show a
relatively random ordering of platelets for this composite, there is a slight orientation
within the material, which could account for the minor decrease in CTE.
5.2.2 Electrical Properties
Figures 5.10 (a) and (b) show the effects of filler composition on the electrical properties
of PPS-bases composites filled with 33.3 vol.% hBN. The electrical impedance curves
exhibit very similar behaviour for all of the composites. Regardless of the amount of
hBN added of either PTX60 or PT110, the impedance remained high. As confirmed by
the electrical conductivity curves, the electrical resistivity is not compromised through
the addition of these fillers.
5.2.3 Mechanical Properties
5.2.3.1 Compressive Elastic Modulus
The compressive elastic moduli of the PPS-hBN hybrid composites are displayed in
Figure 5.11. The E for PTX60 and PT110 are among the lowest, with PTX60 yielding the
lowest value. When comparing PTX60 to PT110, the platelets that make up PT110 have
a larger aspect ratio, which is associated with increased compressive elastic moduli
and strength [93].
The mechanical properties follow a similar trend to those found for thermal con-
ductivity. When evaluating the three hybrid composites, an optimal value exists and

Chapter 5. PPS Based Composites 92
0.0
0.5
1.0
1.5
2.0
2.5
PT1102:13:14:1PTX60Unfilled
Ther
mal
Con
duct
ivity
(W/m
-K)
Composition
Figure 5.8: Thermal conductivity (k) of PPS-hBN composites with hybrid fillers.
020406080100120140160180200
4:1
Before Tg
After Tg
Coe
ffici
ent o
f The
rmal
Exp
ansi
on
m/m
/°C
CompositionPTX60 3:1 2:1 PT110
Figure 5.9: Coefficient of thermal expansion (CTE) of PPS-hBN composites with hybridfillers.

Chapter 5. PPS Based Composites 93
10-2 10-1 100 101 102 103 104108
109
1010
1011
1012
1013
1014
1015
1016
PTX60 Only PT110 Only PTX60:PT110 = 4:1 PTX60:PT110 = 3:1 PTX60:PT110 = 2:1
Impe
danc
e (
)
Frequency (Hz)
(a)
10-1 100 101 102 103 10410-17
10-16
10-15
10-14
10-13
10-12
10-11
10-10
10-9
10-8
PTX60 Only PT110 Only PTX60:PT110 = 4:1 PTX60:PT110 = 3:1 PTX60:PT110 = 2:1
Elec
tric
al C
ondu
ctiv
ity (S
/cm
)
Frequency (Hz)
(b)
Figure 5.10: Electrical properties of PPS-hBN composites with hybrid fillers: (a) elec-trical impedance, and (b) electrical conductivity.

Chapter 5. PPS Based Composites 94
is seen for PPS-hBN3:1. When the smaller hBNPTX60 particles occupy the space between
the larger hBNPT110 platelets, a more efficient packing of filler can help to improve the
compressive elastic modulus of the composite. The E is the highest for PPS-hBN3:1 and
then declines when a 2:1 ratio of PTX60:PT110 is added. As the amount of hBNPT110
increases past the optimal quantity, the mechanical properties begin to deteriorate.
In general, finer particles are advised for improved mechanical properties [36, 81].
The primary rationale behind this logic is improved dispersion within composites with
smaller particles. The formation of agglomerates in composites prevents homogeneity
within a material, and reduces its mechanical properties. Smaller particles have a ten-
dency of forming agglomerates that have a lesser effect on the mechanical properties,
due to their reduced size. A trade-off between the effects of increased aspect ratio and
uniform dispersion of smaller particulates exists. Therefore, an ideal balance for the
two must exist, which is seen in the PPS-hBN3:1 hybrid composites.
5.2.3.2 Compressive Strength
The compressive strength of the composite materials shows a similar trend to the
compressive elastic modulus, and can be seen in Figure 5.12. An optimal ratio of
PTX60 to PT110 appears to exist. The composites containing 4:1 and 3:1 have the
highest compressive strength, while 2:1 has a significantly lower σy. Both PPS-hBN
composites containing a single type of filler have lower σy values, which suggests a
hybrid effect with respect to compressive strength. PT110 has a larger aspect ratio
when compared to PTX60. As the amount of PT110 increases, there is an increased
interfacial area. A higher contact area is associated with poor interfacial bonding,
therefore resulting in delamination and failure, ultimately leading to a lower E [94].

Chapter 5. PPS Based Composites 95
0
250
500
750
1000
1250
PT1102:13:14:1PTX60
Com
pres
sive
Mod
ulus
(MPa
)
Composition
Figure 5.11: Compressive Elastic Modulus (E) of PPS-hBN composites with hybridfillers.
0
10
20
30
40
50
CompositionPT1102:13:14:1PTX60
Com
pres
sive
Str
engt
h (M
Pa)
Figure 5.12: Compressive strength (E) of PPS-hBN composites with hybrid fillers.

Chapter 5. PPS Based Composites 96
5.2.4 Morphology
SEM micrographs of the cross-sections are seen in Figure 5.13 at both 250× and 1000×
magnifications. Upon inspection of the images, as the amount of hBNPT110 increases
from PPS-hBN4:1 to PPS-hBN2:1, there is a visible difference in the number of platelets.
Since hBNPT110 has a much larger aspect ratio in comparison to hBNPTX60, they are more
visible within the composites.
The morphology is uniform for all of the composites, which suggests that the
processing conditions are ideal for producing a homogeneous material. A uniform
microstructure was expected since the composite was melt-blended. Unlike dry-
blending, shear mixing within the twin-screw compounder generally creates excellent
dispersion. Even though this is the case, at higher magnifications there is a lack
of spherical agglomerates, which is unexpected due to the presence of hBNPTX60 in
the composites. hBNPTX60 is fabricated by forming an agglomerate out of small hBN
crystals, which have broken down during the processing of the composites either
during the melt-blend or compression molding stage. The SEM micrographs show
these smaller hBNPTX60 particles dispersed between the larger hBNPT110 particles. In
order to maintain the spherical agglomerate shape of hBNPTX60, alternative mixing
techniques must be employed.
5.2.5 Summary
Hybrids of hBN were added into a PPS matrix to determine the effects of adding multi-
ple types of filler into a composite. The filler content was kept consistent at 33.3 vol.%,
but three different combinations were tested. Filler was added in ratios of 4:1, 3:1, and
2:1 (hBNPTX60:hBNPT110), and compared to composites containing 33.3 vol.% of only
one type of hBN. The thermal conductivity of the composites increased from that of
neat PPS, 0.22 W/m-K, to 2.04 W/m-K for PPS-hBN3:1. An optimal ratio of PTX60 to

Chapter 5. PPS Based Composites 97
Magnification250× 1000×
4:1
(a) (b)
3:1
(c) (d)
2:1
(e) (f)
Figure 5.13: SEM Images of PPS-hBN hybrid composites at varying magnifications.

Chapter 5. PPS Based Composites 98
PT110 exists, creating synergy and promoting thermal conductivity. With increased
amounts of PT110, above this ideal mixture the ke f f decreases. The electrical prop-
erties of the single and hybrid filler composites do not vary significantly. Since the
bulk properties of all the fillers are consistent, these similar results are expected. The
compressive elastic moduli of the composites follow the same trend as the k properties.
The ideal combination of PTX60 to PT110 is also PPS-hBN3:1. Particles with a larger
aspect ratio have better interfacial adhesion between the matrix and filler materials,
but smaller hBN has a decreased tendency of forming agglomerates affecting the me-
chanical properties. SEM micrographs confirm the presence of PTX60 and PT110 in the
hybrid filler composites. Although PTX60 has broken down into small hBN crystals,
they still assist in bridging gaps between PT110 platelets. The amount of platelets
visibly increase when comparing the PPS-hBN2:1 to PPS-hBN4:1. A positive synergistic
effect was found to exist when multiple ceramic fillers are combined in a PPS matrix.
5.3 Comparison of Matrix Materials
Multiple base materials were utilized within this project in order to determine the
effect of a matrix on the properties of a composite. LLDPE was selected as a low
temperature, cost effective matrix material, while PPS was chosen since it is stable
at high temperatures. As previously mentioned, thermal conductivity is one of the
most important parameters for electronic packaging. Even though polymers typically
have very low thermal conductivities, their ease of processing and low cost makes
them attractive for this particular application. Slight variations exist between matrix
materials, and this section describes differences seen between LLDPE and PPS with
hBN filler particles.
An effect of content study was conducted on the thermal conductivity of PPS-hBN
composites, and the results are displayed in 5.14. PPS-based composites containing

Chapter 5. PPS Based Composites 99
Vol.% of hBN PPS-matrix LLDPE-matrix
0 0.22 0.3133.3 2.38 ± 0.4 1.90 ± 0.250 3.48 ± 1.5 4.34 ± 0.574 7.52 ± 1.2 –
Table 5.2: Comparison between PPS and LLDPE Matrix Materials on k
33.3, 50, and 74 vol.% of hBNPTX60 were fabricated. The upper limit selected for this
study was 74 vol.% hBN because of the filler shape. The theoretical maximum amount
of spherical agglomerates is related to the atomic packing factor of a hexagonal close-
packed (HCP) structure. Assuming the spheres all have the same diameter, the packing
factor is 0.74 where each particle is in contact with its nearest neighbours, leaving the
absolute minimum volume of voids.
As seen in Figure 5.14, the thermal conductivity increased along with filler content.
The results from this study show that there is significant increase in ke f f , 34× that of
neat PPS. The PPS-74 vol.% hBN composite yielded the highest ke f f -value out of all
of the materials fabricated. At lower filler loadings, the relationship between volume
percent of hBN and thermal conductivity in linear. Between 50 vol.% and 74 vol.%
this trend no longer exists, suggesting that the percolation threshold has been reached
within this range.
A comparison between PPS- and LLDPE-based composites can be seen in Table
5.2. Both of the values for the neat polymers were found in literature, while the
mixing methods were kept consistent for comparative purposes for 33.3 vol.% and
50 vol.% hBN. The data suggests that the differences due to matrix materials are not
significant. The results are similar for both LLDPE and PPS. The thermal conductivities
of the neat matrix materials vary by less than 0.1 W/m-K, therefore large changes in
the composite’s ke f f were not anticipated. Therefore, an appropriate matrix material
can be selected for each particular application with minimal effects on the thermal

Chapter 5. PPS Based Composites 100
0 20 40 60 80 1000
2
4
6
8
10
Ther
mal
Con
duct
ivity
(W/m
-K)
Composition (vol.% of hBN)
Figure 5.14: Thermal conductivity (k) of PPS-hBN composites with varying filler con-tent.
conductivity, for LLDPE- and PPS-based composites. LLDPE-based composites should
be selected for those applications in which this material is suitable, since it has a lower
cost than that of PPS. Although this is the case, the overall cost of the polymer-based
composites are significant less than alternatives, which is why they seem appropriate
for these mass-produced applications.
5.3.1 Micromechanical Modelling
Theoretical models were compared to the experimental results, seen in Figure 5.15. As
seen in the other studies, large differences exist between the calculated values and the
collected data. In this particular case, the geometric mean model closely follows the
experimental data at lower thermal conductivities, but deviates after 33.3 vol.%. As

Chapter 5. PPS Based Composites 101
seen in many of the models, steep increases in thermal conductivity are seen between
33.3 and 50 vol.%.
Below 33.3 vol.% the majority of the models predict ke f f -values less than the mea-
sured data. As previously mentioned, the model assumes randomly distributed,
discrete particles within a homogeneous medium, which is generally not the case.
Interaction between particles increases the thermal conductivity of the composite,
accounting for slight improvements in the experimental data.
At higher concentrations, Bruggeman’s model appears to be the most similar to the
experimental data. Most of the models predict large increases in thermal conductivity
at high concentrations of filler. The experimental data does not reflect this extreme
increase in ke f f due to issues with high thermal resistance at the interface between
the matrix and filler. These models predict very high thermal conductivity values,
which would result if an effective method of reducing interfacial phonon scattering
was discovered.
5.4 Other Studies
5.4.1 The Effect of a Coupling Agent
Amino silane ((C2H5O)3SiC3H6NH2) is a common coupling agent used to improve
the bond between inorganic and organic fillers. It was used in this study to modify
the surface of some of the composites containing hBN. As previously discussed, high
thermal interfacial resistance exists when filler materials are added into a polymer
matrix. One suggested method of improving the interfacial adhesion was through the
chemical functionalization of both the polymer and filler. In this particular study, PPS
was used as a matrix material and mixed with 33.3 vol.% and 74 vol.% of treated hBN.

Chapter 5. PPS Based Composites 102
0.0 0.1 0.2 0.3 0.4 0.5 0.6 0.702468
101214161820
Ther
mal
Con
duct
ivity
(W/m
-K)
Volume % of hBN
Series Model Parallel Model Geometric-Mean Model Maxwell's Model Bruggeman's Model Nielsen Model Experimental
Figure 5.15: Theoretical predictions compared to experimental data for increasingcontent of hBN in PPS.
5.4.1.1 Methodology
The silane-based coupling agent, Struktol SCA 1100, was combined with a 50-50 water
to ethanol mixture to form a homogeneous solution. Once the silane was dispersed
within the mixture, hBN was added to the solution and mixed for 10 minutes using
a magnetic stirrer. The powder was then filtered and dried for over 12 hours at
approximately 60 °C. For all of the surface modifications, a ratio of 8 parts of silane to
100 parts of hBN was used, as suggested by the supplier of the amino silane.
Upon evaluating preliminary data regarding the thermal conductivity of treated
polymer composites, the results were not as expected. As seen in Figure 5.16, the
addition of amino silane to the hBNPTX60 did not yield favourable results.
Silane-based coupling agents are not only used to improve the adhesion between

Chapter 5. PPS Based Composites 103
polymer matrix and filler, but also to promote uniform dispersion of particles. A
homogeneous distribution of hBN within the matrix results in a reduction of filler-
filler interactions [95]. Therefore, fewer random continuous conductive paths through
the material form, decreasing thermal conductivity. Due to the difficult nature of
differentiating between hBN and PPS at high filler loading, SEM micrographs do not
aid in the confirmation of this hypothesis.
Studies have also shown decreases in thermal conductivity with excessive amounts
of silane [3]. If the coating of silane on the surface of the particle is too large, then it
may act as a thermal barrier and decrease the thermal conductivity. In a study by Yung
et al, they found 1% coupling agent sufficient to enhance thermal conductivity, but 2%
was counterproductive causing decreased thermal conductivities [3]. The converse
may also be true, where hBN was not coated enough to improve the properties of the
composite.
A thermogravimetric analyzer (TGA), from TA Instruments model Q50, was used
to investigate the efficiency of the process used to coat amino silane on the surface of
hBN. This analysis was performed on both PPS-hBNPT110 platelets and PPS-hBNPTX60
spherical agglomerates. Both types of hBN were tested with and without surface
modifiers present by heating the material to 900 °C at 20 °C/min in a controlled nitrogen-
gas environment.
The results of the TGA analysis show minimal losses in weight for both the treated
and as-received hBN, as seen in Table 5.3. The organic coupling agent is volatile in
comparison to hBN, therefore any weight loss found by heating the material to 900 °C
would be equivalent to the amount of amino silane coating the surface of the treated
hBN. For the as-received, untreated hBN, the results were as expected and negligible
weight loss was seen. An increased loss was seen for hBNPTX60 spherical agglomerates
when compared to PPS-hBNPT110. These results suggest that the silane treatment was
successful in coating hBNPTX60, but did not coat the PPS-hBNPT110 platelets.

Chapter 5. PPS Based Composites 104
2
4
6
8
10 As-Recieved Surface Modified
5033.3
Thre
mal
Con
duct
ivity
(W/m
-K)
Composition (vol.% of hBN)
Figure 5.16: Effect of using a silane-based coupling agent on PPS-hBN composites.
The TGA thermographs also indicated the onset of degradation for the surface mod-
ifier was around 70 °C, and continued to 650 °C. These results suggest the processing
techniques used for fabricating the polymer composite materials would degrade the
surface modifier, rendering the coupling agent ineffective.

Chapter 5. PPS Based Composites 105
hBN Filler Weight Loss
PTX60, as-received <0.05%PTX60, surface modified 1.13%PT110, as-received <0.05%PT110, surface modified <0.05%
Table 5.3: TGA analysis of hBN weight loss upon heating to 900 °C

Chapter 6
Conclusions and Recommendations
6.1 Conclusions
The miniaturization of electronics is heavily dependent on the ability of electronic
packaging to dissipate heat. As devices decrease in size and increase in power density,
the need for multifunctional materials with high thermal conductivities and electrical
resistivity grows. Polymer-matrix composites have been evaluated as an alternative
to the current standards, such as embedded heat sinks. These materials are desirable
because of their low cost, ease of processing, chemical stability, and electrical resistivity.
Polymers are typically thermal insulators, and as such need the addition of thermally
conductive fillers to improve their ke f f . For this research thesis, PMCs were fabricated
and characterized in terms of their thermal, electrical, mechanical properties, as well
as their morphological characteristics. In the first study, LLDPE was used as the
matrix, and was combined with hBN and SiC to determine the effects of different
fillers, content, and porosity on the composite’s properties. Then PPS was used as a
high temperature matrix material and was combined with various types of hBN to
discover the effects of size, shape, and aspect ratio on the material, as well as the effect
of hybrid ceramic fillers.
106

Chapter 6. Conclusions and Recommendations 107
In the first parametric study, LLDPE was combined with SiC, hBN, and a hybrid
of the both. The thermal conductivity was found to increase along with filler content,
as did the electrical conductivity and compressive modulus. hBN was found to be
more effective in promoting the thermal conductivity of the material when compared
to SiC. Hexagonal boron nitride is also a much softer material, which also has a
graphite-layer structure providing a lubricative effect, and therefore is more desirable
for manufacturing. The combination of hybrid filler materials, of both SiC and hBN,
was found to have the best ke f f . It is believed that the improvement of ke f f was
not only a result of increased filler content, but also a synergistic effect. Dielectric
analysis determined that the addition of ceramic fillers into the polymer matrix did
not compromise the electrical resistivity, regardless of the amount of filler placed in
the composite. In general the compressive modulus and strength increased with filler
content. Different types of mixing methods, dry-blending and melt-blending, were also
contrasted. After comparing the effective thermal conductivity values, dry-blending
was deemed the best alternative with respect to ke f f . The random agglomerates of fillers
scattered in the material aid in the formation of continuous conductive pathways,
in turn increasing the ke f f of the composite, which is desirable for this particular
application.
Novel cellular composites were also successfully fabricated to determine the feasi-
bility of maintaining high thermal conductivity while reducing the overall mass of the
material. These composites were created using a technique that has not been applied
to this particular problem, and as such have not been documented with respect to their
effective thermal conductivities. Expancel®microspheres were found to be an effective
means of aligning hBN platelets within a composite, aiding in the formation of three-
dimensional thermally conductive networks throughout the material. Alignment of
filler particles is a direct result of extensional flow fields during the expansion process
of the microspheres. An optimal volume expansion was found to exist, through the

Chapter 6. Conclusions and Recommendations 108
addition of 1.5× the theoretically-calculated amount of microspheres required to fill
either a 20- or 40-vol.% void. The thermal conductivity for these unique cellular com-
posites were measured to have significantly high thermal conducitivy values when
compared to neat LLDPE.
The next study focused on the use of PPS as a high temperature matrix material.
Different types of hBN with varying sizes, shapes, and aspect ratios were used to de-
termine the effect of filler geometry on the material’s properties. The composites were
melt-blended, which resulted in the break down of the spherical and medium-density
agglomerate particles. Both the thermal conductivity and mechanical properties were
enhanced for the composites containing different sizes of filler particles working to-
gether to create a synergistic effect, as seen for those materials with hBNPT371.
Hybrid fillers were also used in PPS-hBN composites. This analysis was con-
ducted in order to determine whether a synergistic effect occurs when two ceramics
varying in size, shape, and aspect ratio are combined to improve the properties of ma-
terial. hBNPTX60 and hBNPT110 were added to PPS in ratios of PPS-hBN1:0, PPS-hBN4:1,
PPS-hBN3:1, PPS-hBN2:1, and PPS-hBN0:1. In all of the composites, SEM micrographs
confirm the separation of PTX60 into small hBN crystals, and the original spherical
shape was not maintained due to the aggressive processing conditions. An optimal
ratio was found with respect to the thermal conductivity and mechanical properties,
PPS-hBN3:1. The smaller PTX60 particles appear to bridge gaps between the larger
PT110 platelets, in turn creating a positive synergistic effect.
Comparisons between the matrix materials, LLDPE and PPS with respect to ef-
fective thermal conductivity found no significant deviation. Therefore, the matrix
material can be selected based on the application and tailored to suit each individual
task without having a large effect on the ke f f .
A silane coupling agent was also used in hopes of improving the interfacial ther-
mal resistance between the filler and matrix, along with improving the dispersion of

Chapter 6. Conclusions and Recommendations 109
particles within the polymer. The addition of silane to the surface of hBN did not yield
the desired results, and further research in this area will have to be conducted.
Finally, data collected from micromechanical modelling was compared to the ex-
perimental results for solid, single filler composites, in regards to their effective thermal
conductivities. None of the models fit the empirical data exactly. Nielsen’s was the only
model used that took shape, aspect ratio, and packing factor into consideration, and
as such generally fit the measured data the best. Most of the models underestimated
the effective thermal conductivity of the composites at low filler concentrations, likely
because they assume the particles are discrete, spherical particles. All of the models
also did not take interfacial thermal resistance into account, which was a larger issue
for high filler content composites.
6.2 Recommendations
The effective thermal conductivity of the composites was greatly affected by the over-
whelming presence of the interfacial thermal barrier. The resistance at the surface
between the matrix and filler materials provided a strong hindrance to even greater
increases in ke f f . An effective method of reducing phonon scattering, as a result of
interfacial resistance, is needed to improve the heat dissipation within a composite. A
possible solution to this problem could include a better coating of coupling agents on
the surface of the filler materials, allowing improved bonding of the particles to the
matrix. Further studies to develop a more effective method of coating the fillers could
lead to a decrease in difference between calculated ke f f values and experimental data.
It is also recommended that a method for maintaining the shape of the PT371,
PTX60 and PTX25 agglomerates be found. For a more detailed study on the effect of
size, shape, and aspect ratio, the original shape of the hBN clusters must remain as
close to the manufacturer’s specifications as possible. Maintaining the spherical shape

Chapter 6. Conclusions and Recommendations 110
of the PTX25 and PTX60 could assist in promoting the isotropic properties of hBN,
which contrasts the anisotropic thermal conductivity seen with the hBN371 platelets.
By employing a dry-blending technique to combine the composites, along with low
pressures during the compression molding step, damage to the fillers could possibly
be minimized.
Even though novel cellular structures were successfully fabricated, they provide
only a preliminary foundation for the future development and characterization. The
porous structure-property relationships of these materials must be further evaluated
and optimized. A technique to improve the dispersion of microspheres within the
composite would be beneficial. Also, the use of various sized Expancel® could be
used in order to further investigate the effects of pore size on ke f f .
There are still a number of material properties that should be evaluated in order
to confirm the feasibility of these composites for use in electronic packaging. These
studies include, but are not limited to: breakdown strength, shear stress behaviour,
corona effect, tensile testing, environmental conditioning, and thermal cycling.
Finally, finite element models (FEM) and rapid prototypes should be employed to
determine the effects of using this material within typical heat sink conditions. This
process will aid in determining the feasibility of using these composites and act as
validation to this experimental work. The FEM models can also be further developed
and validated with the experimental data found in this research thesis, improving
the predictions. This material could either be used as a compliment to the current
standards or as its own independent component, and therefore should be tested within
each capacity.

Bibliography
[1] E. Bogatin. Roadmaps of Packaging Technology. Integrated Circuit Eng. Corporation, 1997.
[2] W. Zhou, D. Yu, C. Min, Y. Fu, and X. Guo. Thermal, dielectric, and mechanical propertiesof sic particles filler with linear low-density polyethylene composites. Journal of AppliedPolymer Science, 112(3):1695–1703, 2009.
[3] K.C. Yung, J. Wang, and T.M. Yue. Thermal management for boron nitride filler metalcore printed circuit board. Journal of Composite Materials, 42(24):2615–2627, 2008.
[4] S.V. Rotkin, V. Perebeinos, A.G. Petrov, and P. Avouris. An essential mechanism of heatdissipation in carbon nanotube electronics. Nano Letters, 9:1850–1855, 2009.
[5] H. Asai, K. Yano, K. Iyogi, N. Iwase, and T. Fujiwara. Design and characteristics of a newlydeveloped cavity-up plastic and ceramic laminated thin bga package. IEEE Transactionson Advanced Packaging, 22:460–466, 1999.
[6] T. Nishino, M. kotera, and Y. Sugiura. Residual stress of particulate polymer compositeswith reduced thermal expansion. Journal of Physics: Conference Series, 184:1–4, 2009.
[7] G.W. Lee, M. Park, J. Kim, J.I. Lee, and H.G. Yoon. Enhanced thermal conductivity ofpolymer composites filled with hybrid filler. Composites: Part A, 37:727–734, 2006.
[8] C.P. Wong and R.S. Bollampally. Thermal conductivity, elastic modulus, and coefficientof thermal expansion of polymer composites filled with ceramic particles for electronicpackaging. Journal of Applied Polymer Science, 74:3396–3403, 1999.
[9] Dupont. Kapton mt data sheet. Technical report, Dupont, 2010.
[10] J.H. Lau, C.P. Wong, J.L. Prince, and W. Nakayama. Electronic Packaging: Design, Materials,Process, and Reliability. McGraw-Hill, Inc., New York, New York, 1998.
[11] S. Nemat-Nasser, S. Nemat-Nasser, T. Plaisted, A. Starr, and A.V. Amirkhizi. Biomimetics:Biologically Inspired Technologies. CRC Press, 2005.
[12] K.K. Wang, Y.L. Kang, P.G. Song, F. Xu, and X.H. Li. Preparation of sicp/a356 electronicpackagaing materials and its thixo-forging. Transactions of Nonferrous Metals Society ofChina, 20:s988–s992, 2010.
[13] S.V. Nair, J.K. Tien, and R.C. Bates. Sic-reinforced aluminum metal matrix composites.International Metals Reviews, 30:275–290, 1985.
111

BIBLIOGRAPHY 112
[14] D. Cree and M. Pugh. Production and characterization of a three-dimensional cellularmetal-filled ceramic composite. Journal of Materials Processing Technology, 210:1905–1917,2010.
[15] Y. Chen and D.D.L. Chung. Silicon-aluminum network composites fabricated by liquidmetal infiltration. Journal of Materials Science, 29:6069–6075, 1994.
[16] M.E. Smagorinski, P.G. Tsantrizos, S. Grenier, A. Cavasin, T. Brzezinski, and G. Kim. Theproperties and microstructure of al-based composites reinforced with ceramic particles.Material Science and Engineering, A244:86–90, 1998.
[17] K. Yoshida and H. Morigami. Thermal properties of diamond/copper composite material.Microelectronics Reliability, 44:303–308, 2004.
[18] J.A. Kerns, N.J. Colella, D. Makowiecki, and H.L. Davidson. Dymalloy: A composite sub-strate for high power density electronic components. Proceedings for SPIE - The InternationalSociety for Optical Engineering, pages 66–71, 1995.
[19] H.L. Davidson, N.J. Colella, J.A. Kerns, and K. Makowiecki. Copper-diamond compos-ite substrates for electronic components. Proceedings of 45th Electronic Components andTechnology Conference, pages 538–541, 1995.
[20] W.B. Johnson and B. Sonuparlak. Diamond/al metal matrix composites formed by thepressureless metal infiltration process. Journal of Materials Research, 8:1169–1173, 1993.
[21] F.A. Khalid, O. Beffort, and U.E. Klotz. Microstructure and interfacial characteristics ofaluminum-diamond composite materials. Diamond and Related Materials, 13:393–400, 2004.
[22] C. Zweben. Advanced composites and other advanced materials for electronic packagingthermal management. Proceedings of 2001 International Symposium on Advanced PackagingMaterials, pages 360–365, 2001.
[23] P. Yih and D.D.L. Chung. Copper-matrix molybdenum particle composites made fromcopper coated molybdenum powder. Journal of Electronic Materials, 24:841–851, 1995.
[24] Y.M. Chen and J.M. Ting. Ultra high thermal conductivity polymer composites. Carbon,40:359–362, 2002.
[25] G. Kalaprasad, P. Pradeep, G. Mathew, C. Pavithran, and S. Thomas. Thermal conductivityand thermal diffusivity analyses of low-density polyethylene composites reinforced withsisal, glass and intimately mixed sisal/glass fibres. Composites Science and Technology,60:2967–2977, 2000.
[26] J.M. Keith, J.A. King, M.G. Miller, and A.M. Tomson. Thermal conductivity of carbonfiber/liquid crystal polymer composite. Journal of Applied Polymer Science, 102:5456–5462,2006.
[27] W.M. Alvino. Plastics for Electronics. McGraw-Hill, Inc., New York, New York, 1995.
[28] Y. Xu, D.D.L. Chung, and C. Mroz. Thermally conducting aluminum nitride polymer-matrix composites. Composites: Part A, 32:1749–1757, 2001.

BIBLIOGRAPHY 113
[29] W.D. Callister Jr. Fundamentals of Materials Science and Engineering: An Integrated Approach.John Wiley & Sons, Inc., Hoboken, NJ, second edition, 2005.
[30] H. Ishida and S. Rimdusit. Very high thermal conductivity obtained by boron nitride-filledpolybenzoxazine. Thermochimica Acta, 320:177–186, 1998.
[31] S.L. Shinde and J. Goela. High Thermal Conductivity Materials. Springer, 2006.
[32] Y.M. Chiang, D.P. Birnie III, and D. Kingery. Physical Ceramics: principles for ceramic scienceand engineering. J. Wiley, New York, 1997.
[33] K. Watari and S.L. Shinde. High thermal conductivity materials. Materials Research SocietyBulletin, 26:440–444, 2001.
[34] H. He, R. Fu, Y. Han, Y. Shen, and D. Wang. High thermal conductive si3n4 particle fillerepoxy composites with a novel structure. Journal of Electronic Packaging, 129(49):469–472,2007.
[35] S.R. Kim, D.H. Kim, D.J. Kim, M.H. Kim, and J.M. Park. Study on thermal conductivityof polyetheretherketone/thermally conductive filler composites. solid State Phenomena,124–126:1097–1082, 2007.
[36] W.Y. Zhou, S.H. Qi, H.Z. Zhao, and N.L. Liu. Thermally conductive silicone rubberreinforced with boron nitride particle. Polymer Composites, 282:23–28, 2007.
[37] A.R. Blythe. Electrical resistivity measurements of polymer materials. Polymer Testing,4:195–209, 1984.
[38] G. Xu and P.B. McGrath. Electrical and thermal analysis of polymer insulator undercontaminated surface conditions. IEEE Transactions on Dielectrics and Electrical Insulation,3:289–298, 1996.
[39] H. Yeganeh and H.R. Moeini. Novel polyurethane electrical insulator coatings based onamide-ester-ether polyols derived from castor oil and re-cycles poly(ethylene terphtha-late). High Performance Polymers, 19:113–126, 2007.
[40] H.G. Cho, U.Y. Lee, S.H. Kang, K.J. Lim, and I.H. Choi. Electrical property of polymerinsulator with end-fitting design. Proceedings for IEEE International Symposium on ElectricalInsulation, pages 296–299, 2004.
[41] Y. Agari, A. Ueda, and S. Nagai. Thermal conductivities of composites in several types ofdispersion systems. Journal of Applied Polymer Science, 42:1665–1669, 1991.
[42] K. Wattanakul, H. Manuspiya, and N. Yanumet. Thermal conductivity and mechanicalproperties of bn-filled epoxy composite: effects of filler content, mixing conditions andbn agglomerate size. Journal of Composite Materials, 2011.
[43] S. Chung, Y. Im, H. Kim, S. Park, and H. Jeong. Evaluation for micro scale structures fab-ricated using epoxy-aluminum particle composite and its application. Journal of MaterialsProcessing Technology, 160:168–173, 2005.

BIBLIOGRAPHY 114
[44] B.Y. Zhang, M. Li, and X.B. Chen. Influence of novel additive on bmi resin and bmi resinmatrix composite. Journal of Materials Science, 42:9170–9175, 2007.
[45] J.F. Harper and S.J. Michiels. The behaviour of polyphenylene sulphide carbon/glasshybrid composites under compressive loading. Key Engineering Materials, 144:17–26, 1998.
[46] W. Zheng, Y.H. Lee, and C.B. Park. The effects of exfoliated nano-clay on the extrusionmicrocellular foaming of amorphous and crystalline nylon. Journal of Cellular Plastics,42:271–288, 2006.
[47] Tim A. Osswald. Polymer Processing Fundamentals. Hanser Publishers, 1998.
[48] X. Han, C. Zeng, and L. James. Extrusion of polystrene nanocomposite foams withsupercritical co2. Polymer Engineering & Science, 43:1261–1275, 2003.
[49] R.K. Everett, D.P. Harvey, P. Matic, R.S. Schechter, N.K. Batra, K.E. Simmonds, and A. Kee.A preliminary investigation of the microstructure and mechanical properties of porouspolymers. Technical report, Naval Research Laboratory, 2003.
[50] D. Eaves. Handbook of Polymer Foams. Rapra Technology Limited, Shawbury, Shrewbury,Shropshire, U.K., 2004.
[51] M.R. Barzegari, J. Yao, and D. Rodrigue. Compression molding of polyethylene foams un-der a temperature gradient: Morpholgy and flexural modulus. Cellular Polymers, 28:237–248, 2009.
[52] L. Whinnery, S. Goods, and B. Even. Expancel foams: Fabrication and characterizationof a new reduced density cellular material for structural applications. Technical report,Sandia National Laboratories, 2000.
[53] J. Yao, M.R. Barzegari, and D. Rodrigue. Polyethylene foams produced under a tempera-ture gradient with expancel and blends thereof. Cellular Polymers, 29:259–281, 2010.
[54] Y.W. Kim, S.H. Kim, H.D. Kim, and C.B. Park. Processing of closed-cell silicon oxycarbidefoams from a preceramic polymer. Journal of Materials Science, 39:5647–5662, 2004.
[55] M. Okamoto, P.H. Nam, P. Maiti, and T. Kotaka. Biaxial flow-induced alignment of silicatelayers in polypropylene/clay nanocomposite foam. Nano Letters, 1:503–505, 2001.
[56] D.X. Yan, K. Dai, Z.D. Xiang, Z.M. Li, X. Ji, and W.Q. Zhang. Electrical conductivity andmajor mechanical and thermal properties of carbon nanotube-filler polyurethane foams.Journal of Applied Polymer Science, 120:3014–3019, 2011.
[57] R.F. Hill and P.H. Supancic. Thermal conductivity of platelet-filled polymer composites.Journal of the American Ceramic Society, 85:851–857, 2002.
[58] I.H. Tavman and H. Akinci. Transverse thermal conductivity of fiber reinforced polymercomposites. International Journal of Heat and Mass Transfer, 27:253–261, 2000.
[59] R. Pal. On the lewis-nielsen model for thermal/electrical conductivity of composites.Composites:Part A, 39:718–726, 2008.

BIBLIOGRAPHY 115
[60] R.C. Progelhof, J.L. Throne, and R.R. Ruetsch. Methods of predicting the thermal con-ductivity of composite systems: A review. Polymer Engineering & Science, 16:615–625,2004.
[61] C. Ould-Lahoucine, H. Sakashita, and T. Kumada. Measurement of thermal conductivityof buffer materials and evaluation of existing correlations predicting it. Nuclear Engineeringand Design, 216:1–11, 2002.
[62] W. Zhou, S. Qi, Q. An, H. Zhao, and N. Liu. Thermal conductivity of boron nitridereinforced polyethylene composites. Materials Research Bulletin, 42:1863–1873, 2007.
[63] D. Kumlutas and I.H. Tavman. A numerical and experimental study on thermal conduc-tivity of particle filler polymer composites. Journal of Thermoplastic Composite Materials,19:441–455, 2006.
[64] L.E. Nielsen. The thermal and electrical conductivity of two-phase systems. Industrial andEngineering Chemistry Fundamentals, 13:17–20, 1974.
[65] P. Cognard. Handbook of adhesives and sealants. Elsevier, 2005.
[66] Y.H. Hou, M.Q. Zhang, and M.Z. Rong. Thermally induced performance decay in con-ductive polymer composites. Polymer Composites, 25(3):270–279, 2004.
[67] A. Saleem, L. Frormann, and A. Iqbal. High performance thermoplastic composites: Studyon the mechanical, thermal, and electrical resistivity properties of carbon fiber-reinforcedpolyetheretherketone and polyethersulphone. Polymer Composites, 28(6):785–796, 2007.
[68] ExxonMobil Chemical. ExxonmobilTM lldpe ll 8555 series, 2011.
[69] Ticona. Fortron®: Polyphenylene sulphide (pps), 2007.
[70] J.B. Casady and R.W. Johnson. Status of silicon carbide (sic) as a wide-bandgap semicon-ductor for high-temperature applications: A review. Sold-State Electronics, 39(10):1409–1422, 1996.
[71] P.G. Neudeck. Progress in silicon carbide semiconductor electronics technology. Journalof Electronic Materials, 24(4):283–288, 1995.
[72] C. Raman. Boron nitride in thermoplastics: effect of loading, particle morphology andprocessing conditions. Proceedings of the NATAS Annual Conference on Thermal Analysis andApplications, 2008.
[73] L. Rapoport, Y. Feldman, M. Homyonfer, H. Cohen, J. Sloan, and J.L. Hutchison. Inorganicfullerene-like material as additives to lubricants: structure function relationship. Wear,225–229:975–982, 1999.
[74] Momentive Performance Materials Inc. Hot pressed boron nitride shapes data sheet, 2010.
[75] S.N. Leung, M.O. Khan, E. Chan, H. Naguib, F. Dawson, V. Adinkrah, and L. Lakatos-Hayward. Development of thermally conductive and electrically insulating polymercomposites for electronic packaging applications. Proceedings of the Society of PlasticsEngineers: Annual Technical Conference, 2011.

BIBLIOGRAPHY 116
[76] Astm e1225-09: Standard test method for thermal conductivity of solids by means of theguarded-comparative-longitudinal heat flow technique. ASTM, 2009.
[77] I.S. Gunes, F. Cao, and S.C. Jana. Effect of thermal expansion on shape memory behaviorof polyurethane and its nanocomposites. Journal of Polymer Science: Part B: Polymer Physics,46:1437–1449, 2008.
[78] S. Iyer, A. Detwiler, S. Patel, and D.A. Schiraldi. Control of coefficient of thermal expansionin elastomers using boron nitride. Journal of Applied Polymer Science, 102:5153–5161, 2006.
[79] Y.A. Dzenis and V.M. Ponomarev. Thermal expansion of a polymer composite with anaggregating disperse filler. Mekhanika Kompozitnykh Materialov, 1:70–77, 1989.
[80] M. Vetterli, R. Tavangar, L. Weber, and A. Kelly. Influence of the elastic properties ofthe phases on the coefficient of thermal expansion of a metal matrix composite. SciptaMaterialia, 64:153–156, 2011.
[81] J. Gonzalez, C. Albano, M. Ichazo, and B. Diaz. Effects of coupling agents on mechanicaland morphological behavior of the pp/hdpe blend with two different caco3. EuropeanPolymer Journal, 38(12):2465–2475, 2002.
[82] P.H.T. Vollenberg and D. Heikens. Particle size dependance of the young’s modulus offilled polymers: 1. preliminary experiments. Polymers, 30(9):1656–1662, 1989.
[83] H.M. Akil, M.F. Omar, and Z.A. Ahmad. High-strain-rate behavior of polymer matrixnanocomposites. Society of Plastic Engineers: Plastics Research Online, 2011.
[84] K. John and S.V. Naidu. Sisal fiber/glass fiber hybrid composites: The impact and com-pressive properties. Journal of Reinforced Plastics and Composites, 23:1253–1256, 2004.
[85] G.V. Reddy, T.S. Rani, K.C. Rao, and S.V. Naidu. Flexural, compressive, and interlaminarshear strength properties of kapok/glass composites. Journal of Reinforced Plastics andComposites, 28:1665–1677, 2008.
[86] Q. An, S. Qi, and W. Zhou. Thermal, electrical, and mechanical properties of si3n4 fillerlldpe composites. Polymer Composites, 30:866–871, 2008.
[87] L. Matuana-Malanda, C.B. Park, and J.J. Balatinecz. Characterization of microcellularfoamed pvc/cellulosic-fibre composites. Journal of Cellular Plastics, 329:449–468, 1996.
[88] E.R. Salmon. Coefficient of thermal expansion of encapsulants - is it always a constant?IEEE Electrical Insulation Magazine, 4:26–28, 1988.
[89] C. Raman. Hot pressed boron nitride shapes data sheet. Technical report, MomentivePerformance Materials Inc., 2007.
[90] N. Tsutsummi, N. Takeuchi, and T. Kiyotsukuri. Measurement of thermal diffusivity offiller-polyimide composites by flash radiometry. Journal of Polymer Science Part B: PolymerPhysics, 29(9):1085–1093, 2003.
[91] B.G. Wang, H.L Lv, and J.C. Yang. Estimation of solvent diffusion coefficient in amor-phous polymers using the sanchez-lacombe equation-of-state. Chemical Engineering Sci-ence, 62:775–782, 2007.

BIBLIOGRAPHY 117
[92] D.R. Paul and L.M. Robeson. Polymer nanotechnology: Nanocomposites. Polymer,49:3187–3204, 2008.
[93] S.M. Kulkarni and Kishore. Effect of filler-fibre interactions on compressive strength offly ash and short-fiber epoxy composites. Journal of Applied Polymer Science, 87:836–841,2002.
[94] K.G. Satish, B. Siddeswarappa, and K.M. Kaleemulla. Characterization of in-plane me-chanical properties of laminated hybrid composites. Journal of Minerals Characterization &Engineering, 9:105–114, 2010.
[95] P. Sae-oui, C. Sirisinha, U. Thepsuwan, and K. Hatthapanit. Roles of silane coupling agentson properties of silica-filled polychloroprene. European Polymer Journal, 42:479–486, 2006.