elite recruitment and political stability: the impact of
TRANSCRIPT

Elite Recruitment and Political Stability:
The Impact of the Abolition of China’s Civil Service Exam∗
Ying Bai†and Ruixue Jia‡
April 9, 2015
Abstract
This paper studies how the abolition of an elite recruitment system – China’s civil
exam system that lasted over 1,300 years – affects political stability. Employing a panel
dataset across 262 prefectures and exploring the variations in the quotas on the entry-
level exam candidates, we find that higher quotas per capita were associated with a
higher probability of revolution participation after the abolition and higher incidence of
uprisings in 1911 that marked the end of the 2,000 years of imperial rule. This finding
is robust to various checks including using the number of small rivers and short-run
exam performance before the quota system as instruments. The patterns in the data
appear most consistent with a model in which the abolition affected citizens’ prospect of
upward mobility (POUM) more in regions with higher quotas under the exam system. In
addition, we document that modern human capital also contributed to the revolution and
that social capital strengthened the effect of quotas on the participation in the revolution.
∗We are grateful to Daron Acemoglu, Philippe Aghion, Hoyt Bleakley, Ethan Bueno de Mesquita, Davide
Cantoni, Heng Chen, Julie Cullen, Gordon Dahl, Georgy Egorov, Joseph Esherick, Roger Gordon, Avner
Greif, Gordon Hanson, James Kung, Shuo Liu, Helene Lundqvist, Torsten Persson, Nancy Qian, Marit Re-
havi, James Robinson, Gerard Roland, Guido Tabellini, Alan Taylor, Joachim Voth, Noam Yuchtman, Fabrizio
Zilibotti and seminar/workshop participants at the All-UC economic history conference, Barcelona GSE Sum-
mer Forum, BREAD pre-conference, CIFAR, NBER Summer Institute, NEUDC, Northwestern University,
Stockholm Institute of Transition Economics, Tsinghua-UCSD conference on China’s Political Economy, UC
Berkeley, UC Davis, UC Merced, UC San Diego, University of Chicago, University of Hong Kong and Uni-
versity of Zurich for their helpful discussions. Financial support from the Canadian Institute for Advanced
Research is gratefully acknowledged.†Division of Social Science, Hong Kong University of Science and Technology, [email protected]‡School of International Relations and Pacific Studies, University of California San Diego, and CIFAR,
1 Introduction
For over 1,300 years, China used a civil service exam to recruit elites, including high level
state bureaucrats and a much larger non-official gentry.1 The exam system was one of the
most important institutions in Chinese history. It affected the competence of the bureaucracy,
the circulation of elites, the allocation of talent and the perception of social mobility among
average citizens (Weber 1951, Chang 1962, Qian 1982, Elman 2000). In September 1905, the
exam system was abruptly abolished and the primary way of recruiting elites for the late
imperial China was changed to a less transparent system. The existing literature has long
argued that access to elite status plays a crucial role in determining social order (Pareto 1916,
Mosca 1939, Acemoglu and Robinson 2008, North, Wallis and Weingast 2009). In this paper,
we investigate one important political consequence of the change in elite recruitment: how
the abolition of the exam contributed to revolution participation in the late 19th and early
20th century across China and thereby hastened the fall of the Qing dynasty in 1911. We
also provide evidence to understand the mechanism behind the link between the abolition of
the exam and political instability.
One feature that facilitates analysis of the exam system is that it was governed by long-
standing quotas. For the entry-level of the exam, all 262 prefectures were assigned specific
quotas that determined the number of candidates succeeding in the exam and entering the
elite class.2 The quota assignment did not change over time and hence did not respond to
change in the population, development or conflict propensity in a prefecture.3 The persistence
of quotas is an example of “state simplifications” where the state lacked the capacity to
implement a more complicated proportional system (Scott 1998). This simplification was
also reflected in the stepwise feature of the quotas. The quota for each prefecture consisted
of two parts: each county in the prefecture received a quota and the prefecture as a whole
received an additional quota that could be shared among counties.4 The values of the two
parts followed a stepwise rule – 8, 12, 15 and 20 accounted for over 70% of the cases, roughly
according to the administrative scale. The persistence and lumpiness of quota values provide
significant regional variations. We use quotas per capita at the prefecture level to measure the
influence of the exam system and examine their roles in citizens’ participation in revolutionary
organizations before and after the abolition in 1905.
1The gentry in China refers to those who passed the exams. A small share of the gentry became governmentofficials while the remaining did not have official positions but still held privileged status. The gentry andtheir immediate family members accounted for around 2% of the population in the mid-19th century (Chang1955).
2A prefecture is the administrative level below the province. In the Qing dynasty, 18 provinces were locatedin the traditional agricultural area. There were 10 to 20 prefectures under each province and 10 to 20 countiesunder each prefecture.
3The quota assignment only changed once in the Qing dynasty due to the fighting of the Taiping Rebellion.See Section 2.1 for more discussions on the quotas.
4Individuals in counties could compete for the additional quotas for the prefecture so that the quota wasbinding at the prefecture level. The mean and standard deviation of prefecture-level quotas are 114 and 76,respectively.
1

The abolition of the exam was driven by the combination of internal demand and external
shocks. In the late Qing period, China was defeated in a series of wars against the West and
was forced to open. The exam system, in contrast to the modern and Western education
system, was considered by many intellectuals as one of the roots of the underdevelopment of
China. For example, the exam sought out men who were obedient to their elders rather than
candidates with technical knowledge or political ability. The exams focused on reciting the
classics and did not include modern Western topics such as engineering and science (Castrillon
2012). The demand for the abolition of the exam became much stronger in 1905, when Japan
won the Russo-Japanese War. Japan’s success was attributed to the Meiji Restoration and
Modernization, which set an example for the Qing dynasty and facilitated the the abolition
of the exam (The Imperial Edict 1905, Franke 1960).
Historians and sociologists have conjectured that the abolition of the exam affected the
collapse of the dynasty which soon followed (Franke 1970, Rozman 1982, Elman 2009).5 We
focus on revolution participation (defined by participating in revolutionary organizations) in
the late 19th and early 20th century for two reasons. First, the revolution transformed China
from an imperial system to a republic and was the most significant political change in China
for over 2,000 years. Second, for average citizens in such a non-democratic society, few options
existed to express discontent or demand redistribution. Rebellions and revolutions were the
main means. Several revolutionary organizations emerged by the 1890s. We investigate how
the abolition of the exam contributed to participation in these organizations. We construct
a dataset of the prefectures of origin for the 1,277 registered revolutionaries between 1900
and 1906 from the major revolutionary organizations.6 The revolutionaries for whom we
can get information were members of major revolutionary groups at the national level, who
could motivate more participants at different local levels. We are concerned about whether
the missing of information on revolutionaries is random. This concern matters only if the
missing is correlated with quotas and varies before and after the abolition, which is not
very likely. Nevertheless, as a further check for this concern, we collect a second dataset
to measure revolutionary activities. Based on reports from a major Japanese newspaper in
1911, we code the spatial distribution of the early uprisings in 1911 across China. The strong
positive correlation between the cumulative number of revolutionaries and the incidence of
uprisings in a prefecture suggests that it is reasonable to examine both measures as outcomes.
We also collect a set of observable characteristics of prefectures to control for geographical
characteristics, political and economic importance as well as urbanization.
Using difference-in-differences as our baseline estimation strategy and comparing the im-
5Section 2.5 discusses qualitative evidence based on historical studies and diaries of individuals living inthis period.
6We start from 1900 because the majority of revolutionaries before 1900 came from one province (Guang-dong). We also construct a county-level dataset in Guangdong province where we can trace the revolutionariesto 1894. We stop in 1906 because the largest revolution group was divided into many groups in 1907. As aresult, systematic data on the lists of major revolutionary groups was only available until 1906. But we alsoexamine the incidence of revolution in 1911.
2

pact of quotas on revolution participation before and after the abolition of the exam system,
we find that a one standard deviation increase in the logged quotas per capita (0.7) implies
about a 7.7 percentage point higher probability of revolution participation in the prefecture-
level data between 1900 and 1906, i.e., about 48% of the mean probability in this period.7 We
find no pre-trends before September 1905. When examining the correlation with quotas and
the 1911 Revolution, we find that a one standard deviation increase in the logged quotas per
capita was associated with about a five percentage point higher probability of early uprisings
in 1911, which is about one third of the mean probability of incidence.
Two main concerns about our baseline findings are whether the results reflect the role of
quotas and whether they are specific to the abolition of the exam. For instance, prefectures
with higher quotas might be more pro-conflict or different in political sentiment. Another
possibility is that a general revolutionary upheaval occurred in 1905. Our findings might
capture the impact of such an upheaval rather than abolition of the exam. To speak to
the first concern, we employ the incidence of the Boxer Rebellion between 1899 and 1901
as a placebo. Since the Boxer Rebellion was motivated by proto-nationalist sentiments and
opposition to foreign imperialism and Christianity, it was correlated with ideology and conflict
propensity in a prefecture. However, it was uncorrelated with the exam system and we would
not expect quotas to affect its incidence. We find no impact of quotas on the incidence
of the Boxer Rebellion, showing that our finding is unlikely to be driven by pro-conflict
sentiment correlated with quotas. To check the second concern, we examine the impact of
other historical events in this period and show that they did not exhibit a similar effect on
revolution participation.
Despite the fact that the prefecture-level quota was persistent, it is still conceivable that
the quota might be correlated with omitted variables whose impact differed before and after
the abolition of the exam. For example, political networks correlated with the quota system
might influence the selection of bureaucrats more after the abolition. To deal with this
concern, we further employ two instruments for quotas based on geographical and historical
features. Exploring the stepwise feature, we use the number of small rivers (given the length
of rivers) in a prefecture as an instrument.8 Given the same population, the number of small
rivers in a prefecture affected the number of counties under its administration.9 Since each
county was usually assigned a positive quota according to the stepwise rule, the number
of counties was positively correlated with the quota. These two links are supported by the
data. We also conduct various placebo tests to make sure that the instrument is not correlated
with other dimensions such as transportation, agriculture or climate. The second instrument
7Per capita refers to per 1 million population throughout this paper.8See Section 3.4 for different measures of small rivers.9The logic that the number of small rivers affected the number of counties looks similar to that in Hoxby
(2000). However, the channel is different. Rivers did usually not serve as county boundaries in China andother Asian countries where agriculture was the dominant sector. Instead, every county would like to includerivers within its administrative boundaries but the number of rivers would also increase the administrativecosts. In equilibrium, each county usually included one or two small rivers within its boundary.
3

explores the short-run change in exam performance before the quota system. Compared with
the level of performance, short-run change was more likely to driven by some random factors
such as the supply of talents. It affected the assignment of quotas but did not affect human
capital in the long run. The main finding using the differences-in-differences method still
holds using the two instruments.
Why would the abolition of the exam contribute to revolution participation? We lay out
four hypotheses around the major players in society. First, the “state capacity” hypothesis
concerns the role of the state. The abolition of the exam might signal or be driven by the
deterioration in state capacity. Second, the “elite resistance” hypothesis refers to the role of
the existing elites who had succeeded in the exam system and might be negatively affected
by the abolition of the exam. Third, the “elite eligibility” hypothesis is about the role of
the commoners who hoped to become elites through the exam and whose prospects were
negatively affected by the abolition. Finally, the “modern human capital” hypothesis refers
to the role of those who switched to the modern and Western education system and might
be exposed to revolutionary and modernization ideology.
For each hypothesis, we provide direct and indirect evidence for or against it. The em-
pirical patterns appear to be most consistent with the “elite eligibility” hypothesis. The
other hypotheses differ from the data in important ways.10 The tests of these hypothesis also
deliver some new findings. For example, we find that modern human capital (those studying
abroad) contributed to the revolution, which is consistent with the modernization hypothesis
in Huntington (1968). But the impact of modern human capital did not differ before and
after the abolition and hence cannot explain our main findings.
The “elite eligibility” hypothesis is closely related to the prospect of upward mobility
(POUM) hypothesis formalized in Benabou and Ok (2001) where the poor do not support
high levels of redistribution because of the hope that they or their offspring may make it up
the income ladder. Little evidence on this hypothesis comes from authoritarian regimes, as
it is unclear how redistribution can be realized without a democracy.11 In this perspective,
revolution can be thought of as a way of achieving redistribution. Recently, Acemoglu, Egorov
and Sonin (2015) provide a dynamic model on the relationship between social mobility and
political stability and demonstrate that there can be multiple equilibria. Our study provides
new empirical evidence for this literature.
To formalize our interpretation, we construct a simple model to highlight the role of elite
eligibility on revolution participation.12 The model provides a reduced-form way of capturing
the change in prospect. It can also be interpreted as change in the expected returns on the
10Our approach is not to cherry-pick evidence but to present as much evidence as possible.11Existing empirical evidence for the hypothesis includes the results from the US (Alesina and La Ferrara
2005), Russia (Ravallion and Lokshin 2000) and a set of OECD countries (Corneo and Gruner 2001).12We borrow several elements of the model on riots in Passarelli and Tabellini (2013). Clearly this is not
the only model to formalize our interpretation. For instance, Leventoglu (2005) introduces mobility to thepolitical transition framework in Acemoglu and Robinson (2001b), which can also be interpreted as the roleof elite eligibility.
4

investment in the exam.13 Moreover, the change in prospect was very likely to be correlated
with frustrations. We do not intend to disentangle these factors. This simple model also
predicts that the role of prospect is strengthened by social capital that helps overcome the
collective action problem. We also provide further evidence for this additional prediction.14
Besides the POUM literature, our study also adds to the growing literature on the impor-
tance of political institutions for development and stability (Acemoglu and Robinson 2001a,
2001b, Besley and Persson 2011). In particular, our study provides empirical evidence on
the role of elite recruitment, which has been argued to affect political development (Selig-
man 1964, Acemoglu and Robinson 2008, North, Wallis and Weingast 2009). But we are
not aware of existing empirical evidence.15 Finally, we are the first to systematically study
the long-lived exam system and the republic revolution, adding quantitative findings to the
existing historical studies such as Franke (1970) and Rozman (1982).
The rest of the paper is organized as follows. Section 2 discusses the historical background,
the data and some qualitative historical evidence. Section 3 presents the empirical results.
Section 4 presents further evidence to understand the mechanism. Section 5 concludes the
paper.
2 Historical Background and Data
We first describe the exam system, present the data on quotas and explain how it came to be
abolished. Then, we describe the revolutionary participation and the uprising in the critical
year of 1911 as well as related data. We also provide qualitative historical evidence on the
link between the abolition of the exam and revolution participation.
2.1 The Civil Service Exam and the Assignment of Quotas
The Structure of the Exam The civil service examination system was established in AD
605 during the Sui Dynasty (581-618). The system was used on a small scale during Sui
and the subsequent Tang dynasty (618-907) and was expanded under the Song dynasty (960-
1276). After being interrupted during the Mongol Yuan dynasty (1276-1368), the examination
system became the primary channel for recruiting elites during the Ming (1368-1644) and
Qing (1644-1911) dynasties. The structure and process of the civil examination system
13In a different context, Campante and Chor (2012) argue that the lack of adequate economic opportunitiesfor an increasingly educated populace was an important factor in the Arab Spring.
14This finding contributes to a large literature on the economic and political impacts of social capital. Wewill not give an overview of the vast literature here but would like to point out that this role of social capital inrevolution can be related to Satyanath, Voigtlander and Voth (2013) who show that social capital facilitatedthe rise of the Nazi Party. Naturally, the impact of the republic revolution was very different from that of theNazi Party.
15The lack of evidence may be due to the fact that elite recruitment usually evolves gradually. For instance,in traditional European societies, elite status was mainly hereditary and was gradually changed to be based onmeritocratic exams in the 19th century. But many changes took place underlying this switch: the Industrialand the French Revolutions, economic development as well as political democratization.
5

remained stable in the late imperial period (the Ming and Qing dynasties). The contents
of the examinations were dominated by the Confucian texts – the Four Books and the Five
Classics (Elman, 2000).16
Given the importance of the exam in political selection, systemic institutions were set up
to keep the system as fair as possible. For instance, all essays were transcribed before marking
so examiners could not identify a student by their calligraphy, and the Emperor personally
supervised the final stage of the examination. The children of officials working in the central
government were required to take the exam in the home prefectures of the officials. Despite
these institutions, corruption still happened. In 1781, the Emperor executed 56 officials in
Gansu province for selling examination degrees. All these evidence shows that the exam was
perceived by commoners to be a relatively fair system in allocating the elite status ex ante,
despite the fact that the offspring of existing elites were more likely to succeed in the exam
ex post. (Elman 2000).17
Figure 1 illustrates the basic structure of this system. It consists of three stages of
exams. The entry level is a prefecture-level licensing examination18 held in the capitcal of
the prefecture after the annual primary testing in the county seat. This level of examination
took place twice every three years. The candidates who passed this exam were termed “the
Literati”19 They became the lower gentry class and were exempt from taxes and corporal
punishment. The political status also provided an opportunity to manage local affairs, become
secretarial assistants to officials, and to teach – three important sources of income for Chinese
gentry (Chang 1962). Since this level determines the entry to the gentry class, it constitutes
our focus in the analysis.
The second level is a triennial provincial-level qualifying examination in the provincial
capital. The successful candidates were termed “the Recommended Man” and were eligible
to become lower-level officials. The third level is a national examination taking place in
the capital, with re-examination to rank the candidates in the imperial palace. These can-
didates were termed “the Presented Scholar”20, many of whom were selected for high-level
government positions.
16The Four Books and Five Classics collectively constituted the foundation of Confucianism and were thebasis of the exam. The Five Classics consist of the Book of Odes, the Book of Documents, the Book ofChanges, the Book of Rites, and the Spring and Autumn Annals. The Four Books are comprised of theDoctrine of the Mean, the Great Learning, Mencius, and the Analects.
17Selling lower-level exam degrees to raise money for the government became a more important issue in thelast decades of the dynasty. However, this issue did not stop commoners from investing in the exam system(Chang 1955). In fact, the abolition was to stop the investment in the exam system. As stated in the ImperialEdict on the abolition in 1905, “as long as the system of examinations is not abolished, students will trusttheir good fortune for obtaining the highest degrees, and their desire for the difficult work of real bettermentwill be diverted. The people will follow their example, and the hope for the establishment of private schoolswill be small.”
18Yuankao in Chinese.19Xiucai in Chinese.20Jinshi in Chinese.
6

Eligibility and Entry Costs The exam was, in principle, open to men from all socio-
economic backgrounds and hence every male could in theory take the exam regardless of
his background. The degree could not be inherited so that children of the existing elites
still needed to compete with the commoners in the exam. There was no limit on age or
the number of attempts to pass the exam. In practice, exam takers needed to invest time
and money in preparing for the exam and forgo the opportunities to work, which hindered
men from poor families to take the exam. Wang (1989) estimates that an average family
(of five individuals) needed land holdings of around 1.5 acre to afford the entry-level exam
for one individual, while 30-40% households in the late Qing period owned land above this
threshold.21 In addition, clans often pooled resources to support promising individuals from
poor families. The population influenced by the exam system was further amplified by the
fact that family members of the exam-takers also became involved in the investment (Wang
2013).
As a result of the open nature, at least two million men – about 2.5% of the male
population aged between 15 and 49 in the mid-Qing era – registered for each prefecture-
level exam, while the total quota for each exam was around 30,000 (Elman 2000).22 Because
of a large amount of repeated exam takers, we do not have regional information on exam-
takers. Conceptually, exploring the number of exam takers is not helpful as it is endogenous
to the probability of success governed by quotas per capita.
The Assignment of Quotas and the Related Data The numbers of successful candi-
dates in each exam level were controlled by a quota system. The quota for the prefecture-level
examination was at the prefecture level whereas the quota for the exams at higher level was
assigned at the province level. The quota system worked as an institutional means to confine
and regulate the power of elites (Elman 2000). It also allowed central authorities to recruit
officials from different parts of the country.
The quota for a prefecture consisted of two parts: each county in the prefecture received a
quota and the prefecture as a whole received an additional quota that could be shared among
counties. The quota was therefore binding at the prefecture level. The data on quotas comes
from the Imperially Established Institutes and Laws of the Great Qing Dynasty (Kun, Gang
et al. 1899). Figure A.1 in the appendix gives an example of how the quotas were recorded.
There was no standard formula for the regional quota, but two features of the assignment
deserve emphasis. First, the quota assignment was very stable during the Qing dynasty.
The quota assigned in 1724 persisted until 1851, when the civil war (the Taiping Rebellion)
started and the government increased quotas to encourage contribution to the fight. After
the war, the revised quota assigned in 1873 persisted until the abolition of the exam. We
collect the quota data for both the early Qing dynasty (1724-1851) and the late Qing dynasty
21He only had information from one region in China. Naturally, the land concentration varied significantlyacross regions.
22The total population size in the mid-Qing dynasty was around 300 million and the population of the maleaged between 15 and 50 was around 80 million.
7

(1873-1904). Our main analysis focuses on quotas in the latter period, and the results are
robust to using quotas in the early period.
Second, quotas assigned to each county and the additional quota for each prefecture
followed a stepwise rule: the most common quota values are 8, 12, 15 and 20, roughly based
on the administrative scale. As shown in Figure A.2, these four values account for over 70%
of the observations.
Both features are examples of “state simplifications” where the state lacked the capacity
to implement a more complicated proportional system (Scott 1998).23 Our empirical analysis
focuses on the variations in quotas per capita at the prefecture level, while controlling for
province fixed effects. Variations come from the lumpiness of quota values, the persistence
over time and variation in prefecture population. Province fixed effects only explain 30% of
the variations in the quotas, leaving a large chunk for our exploration within provinces. Figure
2 maps the spatial distribution of quotas as well as quotas per million individuals (based on
the population in 1880). Table 1 provides the data sources and summary statistics for these
variables. For each prefecture-level exam, the mean and standard deviation of quotas are 114
and 76, whereas the mean and standard deviation of quotas per million individuals are 136
and 141.24
In addition, to measure the prospect for the lower-level elites, we collect information
on the origin of candidates who succeeded in the highest-level exams (i.e., the presented
scholars) and the prefecture origin of all the key officials. The number of presented scholars
was controlled by a province-level quota. The data comes from Zhu and Xie (1980) and Qian
(2005) who list the name, and county of origins of all presented scholars and all key officials
(higher than or equal to the level of vice-provincial governors). Around 27,000 presented
scholars came out of all the 112 national exams in the Qing dynasty. Over 90 percent of
the 4,200 key officials held a presented scholar degree. We employ the number of presented
scholars and key officials in each prefecture to measure the probability of moving up to the
top of the social ladder.
2.2 The Abolition of the Exam
In the late Qing period, China was defeated in a series of wars against the West: the First
Opium War (1839-42), the Second Opium War (1856-60), the Sino-French War (1883-85), and
the Sino-Japanese War (1894-95). The exam system was seen by many intellectuals as one
of the roots of the underdevelopment of China. For example, the exam sought out men who
are “obedient to their elders” rather than candidates with technical knowledge or political
ability. Further, the exams focused on reciting the classics and did not include modern topics
23Scott argues that for a state to exercise its power across a large population, it often has to simplify, codify,and and regularize local practices, at the cost of ignoring local variation and local knowledge.
24Since there was no limit on the number of attempts, one way to understand the probability of success isto calculate 1− (1− 2q)n, where q indicates quotas per capita and n indicates the times a man could attemptto take the exam in his life. If n = 10, the probability is 0.27% for a man in the prefecture with the meanquotas per capita. At the household level, the probability of success depends on the number of male members.
8

such as engineering or science.
Motivated by the criticisms leveled against the exam system, the government tried to
reform the exam system. Franke (1960) provides a detailed description of the process. In
1901, the format of the exam essay (known as the eight-legged essay because the essay had to
be divided into eight sections) was relaxed and the three-level exam structure was retained.
In late 1903 and early 1904, the Committee on Education submitted a memorandum urging
the abolition of the examination system. The memorandum received imperial approval on 13
January 1904, indicating that the exam would gradually be abolished within the next decade.
However, on 2 September 1905, The Empress Dowager Cixi abruptly endorsed a memo-
randum ordering the abolition of the examination system at all levels. One important external
factor behind the abolition is the success of Japan in the Russo-Japanese War of 1904-05,
which was the first major military victory in the modern era of an Asian power over a Eu-
ropean nation. Japan’s success was attributed to the Meiji Restoration and Modernization,
which set an example for the Qing dynasty and facilitated the abolition of the exam (Franke
1960). As stated in the memorandum of the abolition, “those who have carefully studied the
situation know that the secret of Prussia’s victory over France and of Japan’s over Russia lay
in their primary schools; in fact, the root of prosperity and strength is in the establishment
of schools, and in this respect it is now only China that lags in the rear” (The Imperial Edict
1905).25
As also pointed out in the memorandum of the abolition, the resources of the government
was not adequate for the opening of enough modern schools and there were no teachers
that could teach modern subjects. Even with universal modern schools, it required more
than 10 years before men of talents “of the modern sort” could be produced. However, any
postponement in the abolition would just delay the availability of talents even more. The
pressing of strong neighbors made any delay even more costly (The Imperial Edict 1905).
Along with the abolition, the dynasty attempted to switch to a Western-style education
system.26 The intention of the reform was to modernize China. However, the modern system
favored the existing elite more than the previous exam system. First, without an open exam
to compete for the elite status, the incumbents could have more influence on elite recruitment
(Spence 1990). Second, it was also easier for existing elites to adapt to the new system. The
new system valued foreign educational background in elite recruitment and gave similar titles
(such as quasi-presented scholars) to those with a foreign educational background. Many of
the gentry sent their children to study abroad so that they could obtain elite status after
returning home (Wang 1960, Castrillon 2012). It became much more difficult for commoners
to afford to study abroad and the link between their exam performance and their political
25See Ferguson (1906) for the English translation of the memorandum.26The government also tried to provide alternative channels for the existing elites. These options were
very limited and restricted to those who got degrees at the provincial level and national level. The relatedgovernment document on these options,“Regulations on the Options for the Degree-Holders”, was issued in1906. Tsing (2007) provides more discussions on why these regulations did not mitigate the shock of theabolition.
9

status was interrupted. Wang (1960) studies the mobility changes during this tradition, and
points out that the new system limited the higher education opportunity to a small group of
men from official and professional families while under the old scheme, a scholar with limited
financial resources had a good chance of succeeding.
A main challenge for our study is whether the abolition of the exam reflected some
revolutionary upheaval in China. For example, the Russo-Japanese War might affect regions
with higher quotas more. In Section 3.3, we conduct several placebo tests to show that our
findings are driven by the abolition of the exams rather than other events in this period.
2.3 The Revolutionaries and the Early Uprisings in 1911
In the 1890s, underground anti-Qing groups, with the support of Chinese revolutionaries in
exile, tried to overthrow the Qing dynasty. These groups arose mainly in response to the
decline of the Qing state, which had proven ineffective in its efforts to modernize China and
confront foreign aggression. The opposition was exacerbated by ethnic resentment against
the ruling Manchu minority. The earliest revolutionary organizations were founded outside
of China. For example, Sun Yat-sen’s Xingzhonghui (Revive China Society) was established
in Honolulu in 1894 and spread to Hong Kong and Guangzhou in Guangdong province.
Chang (1982) describes the background of six major groups during 1900-06 and provides
the lists of registered revolutionaries. His primary source is the member rosters of revolu-
tionary organizations that were disclosed after the success of the revolution. In addition, he
also added members based on biographies and memoirs. Table A.1 in the appendix describes
the six groups in detail. In 1907, the largest group (the Chinese Revolutionary Alliance) was
divided into many groups. As a result, systematic data on the lists of major revolutionary
groups was only available until 1906.
The revolutionaries launched many small-scale uprisings. Most were repressed by the
government. The turning point was the success of the Wuchang Uprising in Hubei Province
on October 10, 1911, following which uprisings spread across China. The revolution ended
with the abdication of the “Last Emperor” Puyi on February 12, 1912, which marked the
end of over 2,000 years of imperial rule and the beginning of China’s republican era.27 We
will also examine the link of quotas and the uprisings in 1911.
Data on the Origins of the Revolutionaries Based on information about the six major
groups that provides a revolutionary’s name, county of origin and the year of joining the
organization in Chang (1982), we construct a dataset of prefecture-level revolutionaries across
China between 1900 and 1906.28 This is the period when the revolution was spreading
27The new republic was by no means a well-functioning democracy. Figure A.3 in the appendix shows thepolity scores of China between 1890 and 2000. As is shown, although the republican period had better scoresthan the previous dynasty (before 1911) and the following People’s Republic of China (after 1949), China onlyobtained a positive score once in the year of 1912.
28As the data on the members in the Chinese Revolutionary Alliance was already compiled in Luo (1958),Chang (1982) only provides information on the founders. We add the information on members in Luo (1958).
10

across the country and hence, the origins of participants were widely distributed. The 1,277
recorded participants with identifiable origins came from 151 prefectures (from 17 out of the
18 provinces). The lowest share was 1.4% (from Shaanxi in the west) and the highest share
was 11.93% (from Hubei in the south). Related summary statistics are presented in Table
1. In our empirical analysis, we examine both whether there were any participants and the
number of participants.
One concern about the data quality is whether the early records were less precise than
the late ones. To deal with this concern, we construct a county-level dataset for the province
where the revolutionary groups started, namely Guangdong between 1894 and 1906. We
complement the prefecture-level analysis with the county-level analysis within Guangdong.
Figure A.5 plots the probability of revolution participation over time. The trend of the
county-level data is very similar to that in the prefecture-level data between 1900 and 1906.29
Another important concern is the selection of registered revolutionaries. For this concern
to matter for our analysis, the selection of registered revolutionaries needs to be systematically
correlated with the quota and differs before and after the abolition of the exam, which seems
to be a strong assumption. Nevertheless, as a validity check of the data, we collect a second
dataset on the uprisings in 1911 from a Japanese source.
Data on the Early Uprisings in 1911 After the success of the Wuchang Uprising,
many other uprisings occurred throughout the country over a compressed time period. The
uprisings was closely followed by Japanese newspapers. On 3 November 1911, the Tokyo
Nichi Nichi Shimbun (the Tokyo Daily News) provided a detailed map on the incidence of
uprisings across China. We code the information to be a dummy variable indicating whether
there was any uprising in a prefecture in 1911. Note that this information only included the
early uprisings, while there were still uprisings in December 1911. Therefore, it is reasonable
to think of them as the immediate echo to the success of the Wuchang Uprising by existing
revolutionaries in a short episode rather than a slow diffusion of the uprisings. If there were
more revolutionaries in a prefecture, the probability of echoing was likely to be higher.
This data helps us further check the reliability of the revolutionary data we collect. Figure
A.6 in the appendix maps the spatial distribution of the uprisings and that of origin of
revolutionaries. As is shown, the incidence of uprising is highly correlated with the number
of revolutionaries originating from the prefecture. The correlation between the cumulative
number of revolutionaries during 1900-06 and the incidence of uprisings is 0.33 (significant
at the one percent level). With this information, we can also link quotas to the incidence of
uprisings.
One concern is that the Japanese newspaper might consult news reports in China and the
reporting might reflect the number of newspapers across regions. We collect the number of
newspapers for each prefecture in 1911 and find that the correlation between the incidence of
29This analysis is only feasible for Guangdong as the majority of revolutionaries before 1900 originated fromGuangdong.
11

early uprisings and the number of newspapers is very weak (with a p-value of 0.325).30 We
also include the number of newspapers per capita when we analyze the impact of quotas on
the incidence of earlier uprisings.
Other Information on the Revolutionaries Ideally, one would also like to know the
family and educational background of the revolutionaries. Unfortunately, there is no sys-
tematic information on the revolutionaries besides their origins. For the largest group (the
Chinese Revolutionary Alliance), we also know the age of the revolutionaries. Figure A.7
plots their age distribution. The median age is 24, thus suggesting that the majority of the
revolutionaries were young.31
We have also gathered biographical information for 63 out of the 106 cadres of the Chinese
Revolutionary Alliance. 32 of them received traditional education only whereas 31 received
some modern or western education besides traditional education. Among those receiving
traditional education only, 12 joined the revolutionary group before 1905 and 20 joined after
1905. In contrast, among those receiving some modern education, 17 joined the revolutionary
group before 1905 and 14 joined after 1905. These numbers suggest that more people educated
under the exam system became revolutionaries after the abolition of the exam. But this
finding has to be taken with a grain of salt because those with biographies available are the
very top leaders and those with modern educational background were more likely to become
cadres and have biographies.
2.4 Other Prefecture Characteristics
We include four sets of prefecture characteristics as our baseline controls. See Table 1 for
more information on the data sources and summary statistics.
First, besides logged population size in 1880, we also control for the logged area of the
prefectures.
Second, due to the potential importance of geography, we include two dummy variables:
coast – whether a prefecture is situated on the coast and major rivers (those ranked as the
first and second order streams in the Chinese river hierarchy) – whether a prefecture is located
along major rivers.
Third, part of China was forced to open to trade after the first opium war (1839-42). The
regions that were forced to open were known as treaty ports. Following the openness, new
knowledge and economic forces began to penetrate China’s economy, which might be corre-
lated with the diffusion of revolutionary thought. Therefore, we use treaty port indicators to
control for the possible effect of foreign influence.
Fourth, the participation in revolution might also be correlated with economic condi-
tions. We control for urbanization measures from Rozman (1974), where Chinese cities were
30The data on the number of newspapers comes from Shi, Yao and Ye (1991).31In the Qing dynasty, the average age of the literati, recommended men and presented scholars were around
24, 30 and 35, respectively (Chang 1955).
12
classified into three groups: large cities were those with a population of 300,000 and above,
middle-level cities those with a population between 70,000 and 300,000, and small cities those
with a population between 30,000 and 70,000.
Additionally, besides these first four baseline controls, we construct another dataset to
measure the importance of a prefecture. These measures include (i) whether a prefecture is a
provincial capital, (ii) the land tax per capita in 1820 (Liang 1981) and (iii) the designations
by the government indicating whether a region belonged to any of the four groups: chong
(important in transportation/communication), fan (import in business), pi (difficult to gather
taxes) and nan (high in crimes). The designation information is available for both counties
and prefectures and is coded based on Liu (1993).
Table A.2 in the appendix presents the correlations between these prefecture characteris-
tics and quotas per capita. As expected, quotas per capita is positively correlated with the
prosperity and importance of a prefecture. We will control for the effect of prosperity and
importance before and after the abolition of the exam in our analysis.
2.5 Qualitative Evidence
Before presenting the quantitative results, we discuss some historical records to show that
our hypothesis was also borne out by qualitative evidence.
The dramatic change in the elite recruitment system due to the abolition of the exam
and the possible consequences were clearly realized an average citizen who lived through this
period. Liu Dapeng, a village gentry in Shanxi province (in northwestern China) kept diaries
between 1891 and 1942. He learned about the abolition around September 10, 1905. He
and other villagers realized that the ending of the exam system would transform channels
for social mobility and that many other changes would inevitably follow. In an entry in
December, 1905, he learned from his friend in the provincial capital that many students
joined recently established organizations and was worried that “disasters and calamities will
arise from them” (see Harrison (2005) for a systematic analysis of the diaries).
The importance of the abolition of the exam in revolution was also recognized by revo-
lutionary leaders. Hu Hanmin, who became a key leader of the Kuomintang party after the
success of revolution, once remarked, “who would have followed the revolution if the exam
were not abolished?”.32
Given these qualitative evidence, it is not surprising that scholars in the China field have
conjectured that the abolition of the exam had important consequences on the collapse of
the last dynasty. Franke (1970) states that the abolition of the examination system resulted
in “the dissolution of existing political and social order”, and hence the importance of this
measure for the final collapse of the traditional system which soon followed cannot be over-
estimated. Rozman (1982) emphasizes that the abolition unlocked changes in what must be
32The website in memory of the 100th anniversary of the 1911 Revolution provides more anecdotal evidenceon the importance of the abolition of the exam: http://news.ifeng.com/mainland/special/xinhaigeming100/.
13

the main institutional base of any government: “the means of awarding status to society’s
elites and staffing the administration.” Elman (2009) remarks that the demise of the Qing
was already assured when the Qing state “lost control of the education system”.
Our main contribution is to construct systematic datasets to examine the link between
the abolition of the exam and revolution participation. Moreover, we provide evidence to
shed light on the mechanism behind the impact.
3 Empirical Results
In Section 3.1, we estimate the impact of quotas per capita on revolution participation before
and after the abolition of the exam. We also present the link between quotas and the incidence
of early uprisings in the 1911 Revolution. In Section 3.2 and Section 3.3, we present two sets
of placebo tests to ensure that the baseline estimates are specific to the role of quotas and
the abolition of the exam. Finally, to deal with omitted variables, we present results using
two instrumental variables in Section 3.4.
3.1 Linking Quotas to Revolution Participation
The Impacts of Quotas before and after the Abolition Our baseline estimations
are based on data across 262 prefectures between 1900 and 1906. We examine the link
between quotas per capita and revolution participation before and after the abolition using
the following specification:
Rp,t = β ln (Quota
Pop)p×Postt + ϑ ln Popp×Postt+θXp×Postt+λp+γt+δprov×γt+εp,t.
The dummy variable Postt is 0 for the years before 1905 and 1 for 1905 and 1906. Rp,t is
a dummy indicating whether there is any revolutionary in prefecture p and year t. ln (QuotaPop )p
is the logged quotas per capita for the entry-level exam and ln Popp is the logged population
size in 1880.
λp and γt indicate prefecture and year fixed effects to control for all time-invariant dif-
ferences between prefectures and changes over time that affect all prefectures similarly. In
addition, we also include very flexible provincial-specific trends: δprov×γt. This will help
us deal with potential confounding factors at the province level such as the quotas at the
province level for candidates in higher-level exams. This is feasible because within-province
variations account for the major part of the variations in quotas.
Xp is a vector of other prefecture-level characteristics discussed in Section 2.4. To further
control for size effects, we control for logged area size. Additionally, we include a set of
dummy variables indicating whether the prefecture located on the coast, the Yangtze River
or any major river, whether the prefecture is a treaty port and dummies for city ranks (to
measure urbanization).
14

The results are presented in Table 2. Column (1) presents the results including logged
quotas per capita, logged population and all the fixed effects. They show that prefectures
with higher quotas per capita had a higher probability of revolution participation after the
abolition of the exam. Table A.3 presents a robustness check including flexible nonlinear
terms of ln Popp, showing that the effect of population size is captured by the linear term in
our baseline estimations.
Columns (2)-(4) further include different sets of controls and column (5) reports the results
weighted by population sizes. On average, a one standard deviation increase in the logged
quotas per capita (0.7) implies about a 7.7 percentage point higher probability of revolution
participation, which is about 48% of the mean probability (16 percentage points).
Columns (6)-(7) report the results for the number of revolutionaries. Column (6) uses a
linear estimation whereas column (7) employs a Poisson estimation. The results deliver the
same message as the estimations using the revolutionary indicator: a one standard deviation
increase in the logged quotas per capita increased the numbers of revolutionaries after the
abolition by about 0.38, around half the mean number of revolutionaries in the prefecture-
level data (0.7). Column (8) shows that the results are also robust to using the number of
revolutionaries per 100,000 inhabitants as the dependent variable.
The Dynamic Impacts of Quotas Our baseline estimations focus on the average impacts
of quotas before and after the abolition. We can also examine the link between the quotas
and revolution participation year by year. This way, we can examine whether there were
already different trends for prefectures with different quotas before and after the abolition.
The specification is as follows:
Rp,t =
1906∑τ=1901
βτ ln(Quota
Pop)p×Yearτ+
1906∑τ=1901
υτ ln Popp×Yearτ
+
1906∑τ=1901
θτXp×Yearτ+λp+γt+δprov×γt+εp,t,
where the year of 1900 is left as a comparison.
We leave the estimates across different specifications in Table A.4 in the appendix and
visualize the main results in column (4) in panel (a) of Figure 3, where the solid line connects
the estimates and the shaded area indicates the 95% confidence intervals with standard errors
clustered at the prefecture level.
The figure shows that there were no significant differences in the pre-trends for the pre-
fectures with high and low quotas while the positive impact of quotas occurred in 1905, when
the exam system was abolished. The magnitudes of the impacts are around 0.13 for 1905
and 1906, similar to the baseline estimates in Table 2.
To clarify, the impact in 1905 in the yearly data is driven by the timing of the revolution-
ary groups. The majority of new members in 1905 belonged to the Revolutionary Alliance
15
that was officially established in August 1905. The Revolutionary Alliance was the largest
revolution group in this period and later became the core of the KMT party. Among the
members that joined in 1905, 25% joined before September 2, 1905 and 75% of the members
joined after the abolition date. Therefore, it is not surprising that there was an impact in
1905.
We also have information on the exact date of participation for the Revolutionary Al-
liance.33 The earliest members joined in July, 1905 (before its official establishment). This
limitation implies that we do not have rich monthly information. Nevertheless, this informa-
tion allows us to check whether quotas mattered for those who joined in July and August.
We examine the correlation between quotas per capita and revolution participation month
by month and visualize the results in the Figure A.4 in the appendix. As shown, quotas
per capita were not significantly correlated with the participation before the abolition date
but mattered after that. We do not have a structural theory to explain the effect month by
month, but it is reasonable to see an immediate response after the abolition: the marginal
individuals who were deciding to participate or not were likely to be mobilized quickly. One
might be concerned about the communication technology in this period. Given the impor-
tance of the exam system, the abolition decision reached citizens very soon. As discussed
in the qualitative evidence in Section 2.5, citizens who lived in a relatively isolated village
in Shanxi Province (northwestern China) already learned about the abolition a few days af-
ter the official abolition. Moreover, to examine whether the effects of quotas per capita on
revolution participation changed significantly after the abolition, we regress the revolution-
ary indicator on the interaction between logged quotas per capita and the post-September
dummy. The results are presented in Table A.5, which shows that prefectures with higher
quotas per capita had a higher probability of revolution participation after September 2,
1905.
We focus on the period between 1900 and 1906 because the majority of revolutionaries
came from one province (Guangdong) before 1900. This limitation shortens the number of
years for our estimations on the dynamic impacts. In addition, the number of revolutionaries
is naturally smaller before the abolition, which might mechanically affect the finding of no-
pretrends. To deal with this concern, we construct a county-level panel for 92 counties in
Guangdong, where we can trace revolutionaries back to 1894. As shown in Figure A.5,
quite a few counties already had revolutionary participation before 1900. Considering that
counties could still compete for some quotas at the prefecture capital, we also control for
prefecture-specific trends (δpref×γt) in our analysis.
Replacing the variables in the prefecture-level analysis with county-level information, the
estimates on the dynamic impacts are presented in Table A.6 in the appendix. Panel (b)
of Figure 3 visualizes the results in column (4) of Table A.6. Once again, it shows that the
effect of quotas took place after the abolition of the exam.
33Unfortunately no such detailed information available for the other five revolutionary groups.
16

Correlation Between Quotas and The Incidence of Uprisings The previous results
are obtained from difference-in-differences analysis. The incidence of early uprising in 1911
is cross-sectional information by definition. Hence, we can only examine a cross-sectional
correlation as follows:
Ip,1911= αln(Quota
Pop)p+ν ln Popp+θXp+δprov+εp,
where Ip,1911 indicates whether there was an early uprising in prefecture p in 1911.
The results are presented in columns (1)-(5) of Table 3. They show that quotas were
positively correlated with the incidence of the early uprisings in 1911: a one standard devi-
ation increase in logged quotas per capita was associated with about a five percentage point
higher probability of early uprisings, which is around one third of the mean probability (15
percentage points). As shown in columns (4)-(5), newspapers per capita had no significant
impact on the the incidence of uprisings while the impact of quotas varies little after including
newspapers per capita.
Two main concerns about our baseline findings are whether the results are driven by the
role of quotas and whether they are specific to the abolition of the exam. We examine these
two issues in Section 3.2 and Section 3.3.
3.2 Using the Boxer Rebellion as a Placebo
We are concerned whether our findings on the role of quotas reflect the impacts of other
prefecture characteristics. For instance, prefectures with higher quotas per capita might be
more pro-conflict or different in political sentiment. To check this concern, we use the Boxer
Rebellion between 1899 and 1901 to conduct a placebo test. Similar to the 1911 Revolution,
the Boxer Rebellion was also motivated by proto-nationalist sentiments and opposition to
foreign imperialism and Christianity. However, it had little to do with the exam system, as
most of the participants were landless peasants (Esherick 1987). Therefore, we use it as a
check to ensure that prefectures with higher quotas were not necessarily always pro-conflict
or more motivated by proto-nationalist sentiments.
The data on the Boxer Rebellion comes from the appendix in the Boxer Protocol (1901).
The Protocol was a treaty signed between the Qing government and eleven foreign powers
involved in suppressing the Boxer Rebellion. It listed the prefectures and counties where
the Boxer operated and killed foreigners, which gives us a dummy variable to measure the
incidence of the rebellion.
In contrast to the impact on the 1911 Revolution, as shown in columns (8)-(10) of Table
3, quotas per capita were not at all correlated with the incidence of the Boxer Rebellion. This
test implies that the above findings are specific to quotas rather than other omitted variables
such as whether certain prefectures were more pro-conflict. Since the Boxer Rebellion affected
the northern prefectures more, we also limit the sample to the prefectures with a latitude
higher than that of the southernmost prefecture with the Boxer Rebellion. The results are
17

presented in columns (6), (7) and (11) and are similar to those obtained when using the whole
sample.
Another related test that we conduct on potential ideological difference is to examine
party identification after the success of the revolution. In particular, compared with the
other parties (the Republican Party and the Democratic Party), Kuomintang (which literally
means “Chinese Nationalist Party”) was known to be more radical. In contrast, the party
ideology of the Republicans was based on Jean-Jacques Rousseau’s The Social Contract
whereas the Democratic Party emphasized that stability was its primary goal. We do not
find that quotas per capita were of importance for party identification, which is also consistent
with the placebo test using the Boxer Rebellion. The results and discussions are presented
in Table A.7 and Section A.1 in the appendix.
3.3 Checking the Impacts of Other Historical Events
Another main concern on our main findings is that the abolition of exam might be concurrent
with other policy shocks. If these shocks increased a general revolutionary upheaval, our
findings might capture the impact of such an upheaval rather than abolition of the exam. To
speak to this concern, we examine the impacts of all the important historical events during
1895-1910 on revolution participation.
First, most of the important historical events during 1895-1910 were not concurrent with
the abolition of the exam. There were three important events during 1895-1905 (Cameron
1931): the failure of the Qing government in the Sino-Japanese War in 1895, the Hundred
Days’ Reform in 1898,34 and the Boxer Rebellion and the agreement to sign the Boxer
Protocol in 1901. In particular, the treaty following the Sino-Japanese War and the Boxer
Protocol required the Qing government to pay large indemnities that might indirectly increase
the tax burden of citizens. Thus, these events might trigger some revolutionary upheaval.
However, different from the abolition of the exam, the elite recruitment system was not
changed in these events. We use the county-level information between 1894 and 1906 to
check their impacts. As shown in Panel (b) of Figure 3, quotas per capita did not exhibit any
significant effect in the years of 1895, 1898 or 1901. These results can be taken as placebo
tests, confirming that our finding is specific to the year of the abolition of the exam.
Second, besides the domestic events, some international ones might also create revolu-
tionary upheaval in China. Our main findings might capture the interaction between quotas
per capita and general upheaval. If this story were true, we would expect that such effects
were larger in regions with more information exposure or higher foreign penetration. To test
this prediction, we employ newspaper density and a dummy indicating foreign enclaves as the
pertinent proxies.35 We examine the triple effect of logged quotas per capita, the abolition
34The Hundred Days’ Reform was a failed 104-day national cultural, political and educational reform move-ment from 11 June to 21 September 1898. The reform touched the economic and political system, the educationsystem as well as the military. But none of them really succeeded.
35The data on foreign enclaves comes from Yan (1955).
18

timing dummy, and the two proxies. The results are presented in Table A.8 in the appendix.
As shown in columns (1)-(2), information exposure and foreign penetration cannot explain
our findings. We do not find significant heterogeneous effects regarding foreign penetration
either.
Finally, we focus on one of the most influential international events in 1905 – the Russo-
Japan war, which partly triggered the abolition of the exam. We hypothesize that the impact
of quotas per capita would be strengthened by Japanese exposure if the change in the quota’s
effect captures the revolution upheaval due to the Russo-Japan war. With the inclusion of the
triple interaction of logged quotas per capita, the post-abolition dummy, and the Japanese
enclave dummy, our baseline results still hold and we do not find any significant triple effect
(Columns (3)-(4)). Moreover, we further check the influence of the Russo-Japan using the
number of students studying in Japan. We collect yearly information on the origins of Chinese
students studying in Japan. We will discuss these results in more detail in Section 4.4 when
examining the impact of modern human capital. In short, we find a positive impact of them
on revolution participation but this effect did not change before and after 1905.
Together, these tests show that our baseline findings are unlikely to be driven by historical
events other than the abolition of the exam.
3.4 Results from Instrumental Variables
Using the difference-in-differences strategy, we can rule out the effects of omitted variables
only when their effects did not change before and after the abolition of the exam. Given
that the government still selected bureaucrats after the abolition, which was likely to be
affected by omitted variables (OV) positively correlated with quotas (such as political net-
works). The role of such omitted variables was likely to become more important in elite
recruitment after the abolition and hence decreased the probability of revolution participa-
tion, i.e., βOVpost − βOV
pre < 0. Given that β = (βpost − βpre) + cov(Quota,OV)var(Quota) (βOV
post − βOVpre ), the
DID estimate is likely to be biased downwards. For this concern, we further employ explore
two instruments for quotas.
Instrument I: The number of small rivers (given river lengths) Our first instrument
stems from geographical characteristics. Conceptually, for two prefectures with the same
population size, the prefecture with more counties tended to have more quotas, because the
quota assignment followed the stepwise role and each county would get some quota. Therefore,
we would like to find an instrument that affected the formation of counties in a prefecture
but did not affect revolution through any other channels such as economic development.
The number of rivers is a reasonable candidate for two reasons. First, counties were usually
formed around rivers. As shown in Figure A.8 in the appendix, county seats were generally
located on rivers. Second, it is not efficient to have many rivers within a county due to high
administrative costs (e.g. tax collection costs). These two reasons lead to a positive link
19

between the number of rivers and the number of counties.
However, the number of rivers might affect other dimensions besides the number of coun-
ties (e.g. economic development). To take into consideration potential confounding impacts
of rivers on development, we exclude major rivers and use the number of small rivers normal-
ized by the total length of rivers. The idea is that the shape of rivers affected the number of
counties, given their length.
In sum, the channel that number of small rivers affects the prefecture-level is as follows:
(#small rivers
River length)p
(a)−→ (#counties
River length)p
(b)−→ (Quota/Pop
River length)p.
Figure 4 illustrates this channel. Panel (a) visualizes the positive correlation between
the number of counties and the number of small rivers, given the length of rivers. Panel
(b) visualizes the positive correlation between logged quotas per capita and the number of
counties, given the length of rivers. The two links together imply that the number of small
rivers has a strong positive impact on quotas per capita, as presented in columns (1)-(2)
of panel (a) in Table 4. Column (3) further shows no significant correlation between the
instrument and the change in quotas per capita, which happened once due to the fighting of
the Taiping Rebellion and should not be explained by geography. Section A.2 in the appendix
further gives an example in the data to further illustrate the channel behind the instrument.
We also conduct four sets of tests to check whether our instrument might affect other di-
mensions besides quotas. First, we examine whether the river feature affects transportation
conditions. Using the official designation of transportation centers (see Section 2.4 for discus-
sions of the data source), columns (4) and (5) show that our instrument is uncorrelated with
the importance for transportation regardless of using a dummy for a prefecture or the aver-
age of the counties in a prefecture. As expected, being located on a major river is correlated
with transportation importance. Second, we examine whether the instrument is correlated
with the suitability of different crops, premised on the notion that the number of small rivers
might be correlated with agricultural suitability. We employ the suitability for three crops:
wetland rice - a stable food highly dependent on water; foxmillet - a traditional Chinese
drought-resistant crop; and sweet potato - the main New World crop adopted in China.36
Columns (6)-(8) show that there is no significant correlation between our instrument and
crop suitability. Third, we also wonder whether the incidence of climate disasters might
systematically differ between the two prefectures with a different density of small rivers. We
construct a measure on the drought/flood index during 1800-99, and find that our instru-
ment is not significantly correlated with it, as reported in column (9).37 Finally, we check
whether the number of small rivers affects the fragmentation of basins that may also affect
the suitability of agriculture. As shown in column (10), we do not any significant impact
36The suitability data is from FAO (2012).37The weather data comes from the State Meteorological Society (1981). Weather conditions are coded into
five indicators: -2(extreme flood), -1 (flood), 0 (normal), 1 (drought) and 2 (extreme drought).
20

on basin fragmentation measured by the Herfindahl-Hirschman index. In Section 4.1 below,
we examine the impact of language fragmentation on revolution participation and find that
language fragmentation dampened the impact of quotas. This is another piece of evidence
suggesting that the concern of fragmentation is unlikely to drive our findings. Of course,
there may still be some dimensions these tests do not capture. But they suggest that the
major omitted variables are unlikely to be a critical concern.
Together with the relevance tests, these placebo tests suggest that the number of small
rivers is a reasonable instrument. Additionally, we define small rivers as rivers of less than
70, 80, ..., 120 km and show that the results are robust to such variations. These checks are
presented in Table A.9 and discussed in Section A.3 in the appendix.
Instrument II: Exam performance before the quota system Our alternative instru-
ment stems from historical roots of the quota system. The regional quota system was initially
employed during the Ming dynasty (AD 1368-1644). In 1425, a provincial-level quota system
was introduced to balance the opportunity to pass the national exam. In 1436, the central
government began to appoint government officials to each prefecture to select candidates for
the province-level exam (Li 1989). In short, the quota system was initially introduced during
1425-36.
We hypothesize that the performance in the exam before 1425, measured by the number of
presented scholars (those succeeding in the national-level exam), could affect the subsequent
quota assignment. However, instead of using the level of the performance as an instrument,
we employ changes in the performance in the very short run as another instrument for two
reasons. First, the short-run change rules out the time-invariant prefecture-specific factors
that can have long-run impacts. Compared with the level of performance, the short-run
change is more like be driven by random factors. For instance, it could capture the supply of
exceptional students that did not persist in the long run. Another example is the idiosyncratic
preference of an emperor could also affect the short-run performance of a prefecture but did
not have a persistent effect. Second, the change also captures the fact that the performance
in more recent years played a more important role than that in more distant years when the
quotas got assigned.
Following this thought experiment, we divide the pre-1425 period into two sub-periods of
similar length (1368-1398 and 1399-1425). Denote the logged number of presented scholars
in the first three decades as ln(1 + PresentedScholar0) and that during the second three
decades ln(1 + PresentedScholar1). We employ the first difference of exam performance
∆ln PresentedScholar as our alternative instrument. To further control for potential level
effects, we also include the initial level in our analysis.
Similar to the first instrument, we examine the relevance of this instrument and whether
it affects other factors besides the quota. Columns (1)-(3) of panel (b) in Table 4 present the
results from the relevance tests. As placebo tests, we examine whether this instrument affects
changes in the number of presented scholars in longer periods. We looked at seven periods
21

(defined by the tenures of emperors), and take the first difference in the number of presented
scholars. By regressing these differences on our instrument, we do not find any significant
correlations, as shown in columns (4)-(9). Thus, the relevance and placebo tests in panel
(b) suggest that the short-run performance before the quota system is another reasonable
instrument.
Estimation results from two instruments Given the relevance tests as well as the
placebo tests, we perform the instrument variable estimations. The first-stage and second-
stage estimations are as follows:
ln (Quota
Pop)p×Postt = ρ1(
#small rivers
River length)p×Post04t +δ ln River lengthp×Postt
+ρ2∆ ln Pres.Scholarp×Post04t+σ ln (1 + Pres.Scholar0)p×Post04t
+ν ln Popp×Postt+θXp×Postt+λp+γt+δprov×γt+εp,t,
and
Rp,t = β
ln(Quota
Pop)p×Post04t+δ ln River lengthp×Postt+σ ln (1 + Pres.Scholar0)p×Post04t
+ν ln Popp×Postt+θXp×Postt+λp+γt+δprov×γt+εp,t.
The results are presented in Table 5. Before presenting the results using both instru-
ments, columns (1)-(3) report the results using the river instrument. Column (1) reports the
reduced-form result and shows that this instrument is significantly correlated with revolution
participation. Column (2) reports the IV estimate (0.38). Column (3) includes the second
instrument as a regressor. The insignificant effect of the second instrument suggests that it
does not have any direct effect on revolutionaries besides the channel of quotas – this method
can be regarded as an easy-to-interpret version of the over-identification test. The first stage
F -statistics are above 40, implying that this instrument is not weak. Similarly, columns
(4)-(6) report the corresponding results using the second instrument. The estimate from the
instrument is around 0.24.
Columns (7)-(9) combine the two instruments. Column (7) reports the reduced-form re-
sult while column (8) presents the IV estimate. Column (9) further includes all variables used
in the placebo tests (transportation, crop suitability, climate shocks and basin fragmentation
index) and the estimate varies very little. Consistent with the tests in columns (3) and (6),
the p-value of the over-id test is around 0.5.
The estimate using the two instruments is about twice that of the estimate using the
differences-in-differences method. This difference is consistent with the concern of omitted
variable. Naturally, another explanation for the difference is that the IV estimates provides
local average treatment effects specific to the two instruments.
22

4 Understanding the Mechanism
Having established the link between quotas and revolution participation after the abolition
of the exam system with different methods, we now turn to understanding the mechanism.
It is worthwhile emphasizing that for any factor to account for our main findings, it needs to
explain two patterns in the data: (1) its effect should be correlated with quotas per capita,
and (2) its effect changed discontinuously before and after the abolition of the exam.
Using these two criteria, we lay out four hypotheses based on the role of the state and
that of different groups of citizens. The first hypothesis is the role of “state capacity”: the
abolition of the exam might signal or was driven by deterioration in state capacity and the
impact might be larger in regions with higher quotas per capita. A second hypothesis is “elite
eligibility”: the abolition of the exam affected the prospect of becoming an elite for a large
group of commoners and the impact is larger in prefectures with higher quotas per capita
that determine the probability of becoming an elite. A third hypothesis is “elite resistance”:
the existing elites might dislike the abolition and the amount of them was also positively
correlated with quotas. A final hypothesis is “modern human capital”: there might also
be more modern human capital in prefectures with higher quotas per capita and modern
education facilitated revolution.
We present multiple pieces of evidence for or against each hypothesis and find that the
empirical patterns appear most consist with the “elite eligibility” hypothesis. So we first
present evidence for this hypothesis and formalize it in a simple model. Then, we come to
the other three hypotheses and point out why they differ from the data in important ways.
4.1 Elite Eligibility
One interpretation of the empirical findings is that the abolition affected the prospect of
a large group of commoners who hoped to become elites through the exam system. To
check whether this hypothesis is reasonable, we would like to check whether the prospect for
commoners changed before and after the abolition of the exam. We find supportive evidence
for this hypothesis. Given this finding, we formalize the logic in a simple model, which
delivers a further prediction on social capital. Thus, we also bring the role of social capital
to data.
Evidence for the Change in Prospect To show that the quotas mattered for the
prospect of upward mobility, we link quota per capita for a prefecture to the number of
presented scholars and key officials from each prefecture during the Qing dynasty (1644-
1904), while controlling for province fixed effects and population sizes in the mid-Qing pe-
riod. The results are presented in columns (1)-(4) of Table 6. To facilitate the comparison
across regimes, beta coefficients are reported so that the coefficients should be interpreted as
how many standard deviations the dependent variable will change, per standard deviation
increase in logged quotas per capita. p-values are reported in squared brackets.
23

To examine the change in the influence of quotas before and after the abolition of exam,
we examine the link between quotas and the origins of political newcomers. For the period
before the abolition, the political newcomers were the presented scholars that succeeded
in the national exam who were eligible to become top officials. After the abolition, the
government selected people with a foreign-educational background and gave them a degree of
quasi-presented scholars. Columns (5)-(6) of Table 6 present the correlations between quotas
per capita and the number of newcomers in 1904 (before the abolition), while columns (7)-
(8) present that for case in 1907 (after the abolition). They show that the importance of
quotas per capita in determining the number of newcomers decreased significantly after the
abolition. In 1904, a one standard deviation in logged quotas per capita explains about a 0.3
standard deviation of political newcomers and the correlation is significant at the 1% level.
In contrast, in 1907, the correlation between quotas per capita and political newcomers is
not significant and the magnitude of the correlation is also halved. The difference between
the impacts of quotas in 1904 and 1907 is significantly different, with p-values of 0.046 and
0.009 for the newcomer dummy and the number of newcomers, respectively.
This quantitative evidence is also consistent with a large historical literature on the role of
the exam in social mobility. There is not enough space to list all contributions by historians
and sociologists to this literature. On average, the literature on the role of the exam in social
mobility documents that 40-60 percent of the successful candidates came from non-official
backgrounds (i.e., neither their fathers nor their grandfathers had earned a degree) and that 80
percent of the descendants beyond the grandson generation of the local prominent individuals
became unknown due to the exam system.38 This line of historical research is sometimes
criticized for not considering the background of extended families or even more generations
(Hymes 1986, Hao and Clark 2012). Conceptually, including larger kin network or lineage
could decrease the estimates and reveal more advantages of those from elite families than
focusing on grandfather-father-son associations. However, using detailed inter-generational
data, Campbell and Lee (2003) find that kin networks did not monopolize opportunities, even
though distant kin influenced the chances of obtaining a title.
For our interpretation, what matters is the weakening of the role of quotas after the
abolition of the exam. The weakening link made prefectures with higher quotas per capita
more likely to lose from the reform. Consequently, the likelihood of revolution participation
became higher in the prefectures that lost more. To formalize this logic, we construct a
38Kracke (1947) examines the candidate lists in the Song dynasty and demonstrates that approximately 60percent of all successful candidates came from non-official backgrounds. Chang (1955) indicates that at least 35percent of the gentry class in the 19th century were “newcomers” (neither their fathers nor their grandfathershad held gentry status.) Studying the biographies of the candidates in Ming and Qing dynasties, Ho (1962)finds that over 40 percent of those succeeding at the highest level (i.e., the presented scholars) came from non-official backgrounds. Using a different method, Hsu (1949) studied the background of prominent individualsmentioned in the gazetteers of four widely separated regions in China and found that roughly 50 percent ofthe local prominent individuals came from unknown origins and roughly 80 percent of the descendants beyondthe grandson generation of the local predominant became unknown. He also pointed out that the fairly highdegree of mobility was driven by the civil service exam system.
24

simple model of revolution participation to highlight the role of prospect of upward mobility
(or perceived mobility). The model borrows several elements from the model on riots in
Passarelli and Tabellini (2013). The model provides a reduced-form way of capturing the
change in prospect of upward mobility, which can also be interpreted as a change in the
expected returns on the investment in the exam. This formalization also delivers additional
predictions that can be further tested.
A Simple Model on Prospect and Revolution There are two types of agents in econ-
omy: the poor commoners with income w0 and the small group of rich elites with income w1,
where w1 > w0. Under the status quo without revolution, a commoner perceives that he will
become a rich elite in the next period with probability η0(q) and stay poor with probability
1 − η0(q), where q indicates quotas per capita and η0 is increasing in q.39 The abolition of
the exam can be considered as a decease in ∂η0(q)∂q .
The commoner decides whether or not to participate in the revolution. If the revolution
succeeds, the probability of becoming rich becomes η1(q) instead of η0(q). Joining a revolution
is costly. The cost is the sum of two components: µ + εi, where µ is known and common
to all agents and εi reflects individual heterogeneity. εi follows a distribution G(ε), which is
continuous and has density g(ε).
Following Passarelli and Tabellini (2013), we use a simplified way of capturing the com-
plementarity in participation, namely that the benefit of participation grows proportionately
with the number of other members also participating in the revolution, p. λ captures how
easy it is to overcome the collective action problem. One natural measure of λ is social capi-
tal: in prefectures with more social capital, it is easier for people to coordinate and overcome
the collective action problem. Another way of interpreting λ is that the value of revolution
is higher or the probability of being reported to the government is lower for people with
stronger group identity.
Given the cost and benefit of revolution, a poor agent i participates in the revolution if:
pλ[η1(q)− η0(q)](w1 − w0)− µ− εi ≥ 0.
The probability of participation becomes a fixed point of the following condition:
p = G(pλ[η1(q)− η0(q)](w1 − w0)− µ). (1)
We focus on the interior solution.40 The revolution condition gives the following compar-
39Similarly, a rich agent perceives that he will become poor in the next period with probability ηr0 and stayas rich with probability 1 − ηr0 . The participation of such agents in the revolution is trivial.
40Similar to Passarelli and Tabellini (2013), we assume λ(η1 − η0)(w1 −w0)g(pλ(η1 − η0)(w1 −w0)−µ) < 1to rule out the case of multiple equilibria.
25

ative statics:
∂p
∂q=gp∗λ(w1 − w0)[∂η1(q)
∂q − ∂η0(q)∂q ]
1− gλ(η1 − η0)(w1 − w0)(2)
Under the exam system, equation (2) captures the impact of quotas per capita on revo-
lution participation. After the abolition of the exam, the link between quotas per capita and
upward mobility gets changed: ∂η0(q)∂q is changed to be
∂η′0(q)∂q . As a result, the comparative
statics after the abolition of the exam becomes:
∂p′
∂q=gp∗λ(w1 − w0)[∂η1(q)
∂q − ∂η′0(q)∂q ]
1− gλ(η1 − η0)(w1 − w0)(3)
The difference between equations (3) and (2) gives the impact of quotas on the partici-
pation before and after the abolition of the exam:
∂p′
∂q− ∂p
∂q=
gp∗λ(w1 − w0)
1− gλ(η1 − η0)(w1 − w0)[∂η0(q)
∂q− ∂η′0(q)
∂q] > 0. (4)
As discussed in the previous subsection,∂η′0(q)∂q < ∂η0(q)
∂q . Thus, equation (4) implies that
individuals of status w0 is more likely to participate in the revolution in prefectures with a
higher q after the abolition of the exam. This prediction is consistent with the differences-in-
differences strategy in our baseline analysis: the first difference is with respect to q and the
second difference is with respect to the abolition of the exam.
In addition, this simple model also delivers a few other predictions. For example, the
impact of q is strengthened by inequality (w1 − w0) and social capital (λ). We do not have
information on inequality in this period.41 However, we can explore the measure of social
capital across prefectures to test whether the impact of quotas per capita was strengthened
by social capital.
Evidence on the Role of Social Capital λ in the model captures the role of social
capital and can be interpreted as how easy it is to coordinate in revolution participation or
how strong group identity is. A higher λ can increase the expected benefits of revolution or
decrease the probability of being reported to the government. One inverse measure for λ is
language diversity explored in the ethno-linguistic fragmentation literature (Alesina and La
Ferrara 2000). Specifically, we calculate an ethno-linguistic fragmentation (ELF) measure
proposed by Alesina and LaFerrara (2005b): ELF = 1 −∑N
i=1 s2i , where si represents the
share of dialect i over the total area in a prefecture. The information on dialects comes from
the Language Atlas of China (1988).
Moreover, considering that it may be more difficult to organize two large distinct groups
than many small groups, we borrow the polarization index (PI) in the ethnic conflict litera-
41Inequality itself is unlikely to explain our findings as it could not change dramatically in the short period.However, it can strengthen the impact of the abolition.
26
ture (Garcia-Montalvo and Reynal-Querol 2002), where PI = 1−∑N
i=1 si(1/2−si
1/2 )2.
To test whether the impact of quotas per capita was strengthened by social capital, we
examine the triple effect of logged quotas per capita, the abolition timing dummy and the
measures of linguistic fragmentation or polarization. The results are presented in Table 7.
Columns (1)-(3) use the fragmentation index whereas columns (4)-(6) use the polarization
measure. Both groups of results show that the effect of quotas was smaller in prefectures with
lower social capital. This finding is consistent with the role of social capital in strengthening
the impact of quotas per capita.
4.2 State Capacity
Another interpretation of our findings is that the abolition of the exam signaled or was
driven by a dramatic deterioration in state capacity. We test three predictions based on this
hypothesis. First, if signaling were the main driver of findings, we expect that other historical
events in this period (that might also signal a deterioration in state capacity) would also have
a similar impact on revolution participation. But as shown in Section 3.3, other historical
events in this period did not exhibit a similar impact to that of the abolition of the exam.
Below we present evidence from two new tests. We employ tax revenues as a measure of
state capacity and examine whether there was any dramatic change in different types of tax
revenues. Further, if state control were the main driver of our findings, we would expect to
see a larger impact in regions where political control was more important. We collect various
measures of political and economic importance for all prefectures and examine whether these
measures explain our finding.
Checking Changes in Capacity: Using Information on Tax Revenues One measure
of state capacity is tax revenues (Besley and Persson 2011). There were three major tax
sources in this period: land tax, internal tariffs (known as likin in Chinese) and customs
duties. Together, they accounted for over 80% of the total tax revenues. Information on the
prefecture-level taxes is very limited, but we can examine the impact of quotas on different
tax revenues before and after the abolition of exam at the provincial level.
On land taxes, we collect province-level information in 1893, 1903, and 1908.42 With
this information, we examine whether land taxes responded to the interaction of quotas per
capita and the abolition of the exam. The results are reported in columns (1)-(2) of Table
8A. They show that lnQuotaPop × Post is not significantly correlated with land taxes.
On internal tariffs, we collect yearly information at the provincial level during 1900-08.43
As shown in columns (3) and (4), lnQuotaPop × Post is not significantly correlated with internal
tariffs either.
Customs duties were the revenue source that experienced dramatic increase in this period.
We collect yearly data on the revenues for each customs and match the data with the province-
42The data comes from Wang (1973) and Liang (1981).43The data comes from Luo (1936).
27
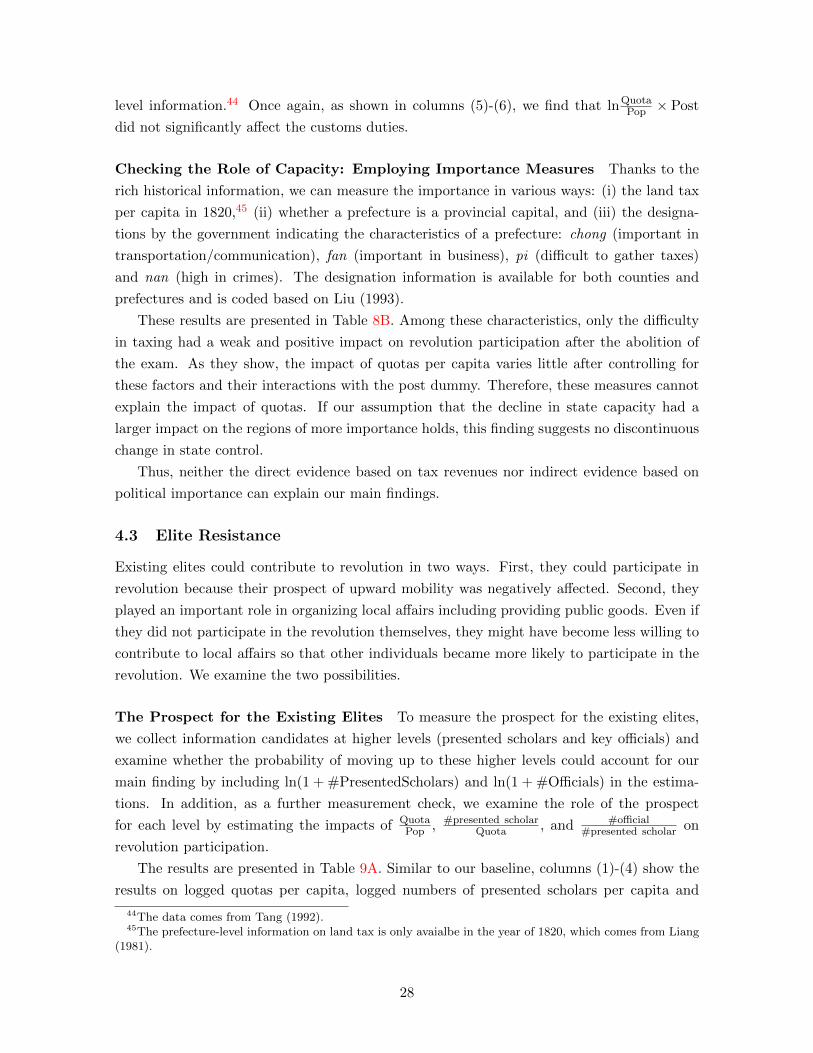
level information.44 Once again, as shown in columns (5)-(6), we find that lnQuotaPop × Post
did not significantly affect the customs duties.
Checking the Role of Capacity: Employing Importance Measures Thanks to the
rich historical information, we can measure the importance in various ways: (i) the land tax
per capita in 1820,45 (ii) whether a prefecture is a provincial capital, and (iii) the designa-
tions by the government indicating the characteristics of a prefecture: chong (important in
transportation/communication), fan (important in business), pi (difficult to gather taxes)
and nan (high in crimes). The designation information is available for both counties and
prefectures and is coded based on Liu (1993).
These results are presented in Table 8B. Among these characteristics, only the difficulty
in taxing had a weak and positive impact on revolution participation after the abolition of
the exam. As they show, the impact of quotas per capita varies little after controlling for
these factors and their interactions with the post dummy. Therefore, these measures cannot
explain the impact of quotas. If our assumption that the decline in state capacity had a
larger impact on the regions of more importance holds, this finding suggests no discontinuous
change in state control.
Thus, neither the direct evidence based on tax revenues nor indirect evidence based on
political importance can explain our main findings.
4.3 Elite Resistance
Existing elites could contribute to revolution in two ways. First, they could participate in
revolution because their prospect of upward mobility was negatively affected. Second, they
played an important role in organizing local affairs including providing public goods. Even if
they did not participate in the revolution themselves, they might have become less willing to
contribute to local affairs so that other individuals became more likely to participate in the
revolution. We examine the two possibilities.
The Prospect for the Existing Elites To measure the prospect for the existing elites,
we collect information candidates at higher levels (presented scholars and key officials) and
examine whether the probability of moving up to these higher levels could account for our
main finding by including ln(1 + #PresentedScholars) and ln(1 + #Officials) in the estima-
tions. In addition, as a further measurement check, we examine the role of the prospect
for each level by estimating the impacts of QuotaPop , #presented scholar
Quota , and #official#presented scholar on
revolution participation.
The results are presented in Table 9A. Similar to our baseline, columns (1)-(4) show the
results on logged quotas per capita, logged numbers of presented scholars per capita and
44The data comes from Tang (1992).45The prefecture-level information on land tax is only avaialbe in the year of 1820, which comes from Liang
(1981).
28

logged numbers of key officials per capita. Columns (5)-(8) present the results using the
ratios to measure the impacts. Both groups of results show that what mattered is the entry-
level quotas per capita. This finding is not surprising, considering that the size of existing
elites was very limited. In addition, they could easily adapt to the new system, as discussed
in the background.
The Importance of Public Goods Provision by the Elites The gentry class created
by the exam system played an important role in local governance. For example, they con-
tributed to the provision of public goods including the provision of schooling, the promotion
of irrigation projects as well as disaster relief (Chang 1955). Considering the importance of
the gentry class, another hypothesis is that the role of the gentry class was more important
in prefectures with higher quotas per capita. Therefore, these prefectures responded more
aggressively to the abolition of the exam by participating in revolution.
To test whether this hypothesis explains our main finding, we need to measure the impor-
tance of public goods. One candidate is the weather condition in a prefecture. Since historical
China was an agrarian economy vulnerable to weather shocks, it is reasonable to assume that
the contribution of public goods by the local gentry was more important in regions suffering
more frequently from droughts and floods. Hence, we employ long-run measures of weather
conditions to examine the importance of this alternative hypothesis.46 In particular, we em-
ploy the standard deviation of the weather indicators during the past century (1800-1899).
As shown in columns (1)-(2) of Table 9B, the importance of public goods cannot explain our
main findings. For completeness, we also include weather shocks in the short run. Columns
(3)-(4) further show that short-run weather shocks cannot explain main our findings.
Therefore, neither the prospect of the existing elite nor the importance of public goods
provided by them can explain our main findings.
4.4 Modern Human Capital
A final hypothesis to explain the republic revolution is that individuals who got educated in
foreign and modern schools were exposed to revolutionary ideology and participated in the
revolution to modernize China. Conceptually, the role of modern human capital does not
imply a discontinuous effect in 1905. Even though prefectures with higher quotas might also
be rich in modern human capital, the amount of modern human capital could not increase
immediately with the abolition of the exam. Nevertheless, we construct a dataset on modern
human capital to evaluate its contribution to the revolution, including the number of students
studying in Japan between 1900 and 1906, the number of modern firms between 1900 and
1906 as well as the number of students in modern primary schools in 1920. These measures
could also potentially mitigate the impact of the abolition on revolution because they capture
alternative mobility channels. Additionally, as discussed in the background, men with a
46The data comes from the same source as that used in the placebo tests for the instrument.
29

modern educational background were favored in elite recruitment after the abolition. What
we can evaluate is only the net effect.
The Number of Students Studying in Japan The number of students studying in
Japan is from Shen (1978), who edited the lists of all Chinese students in technological
academies, higher education institutions and universities based on the rosters of Japanese
institutions. This gives us prefecture-by-year information on the number of students. Among
the students studying abroad, we focus on those in Japan as it was the primary foreign
country for Chinese students in the late Qing period. For instance, the total number of
Chinese students overseas was estimated to be around 20,000 during 1900-1911, 90% among
whom studied in Japan (Yao, 2004).
We investigate the impacts of these students on revolution participation before and after
the abolition. Moreover, we allow for the triple effect of logged quotas, modern human
capital and the abolition of the exam. Columns (1)-(2) in Table 10 show that the number of
students studying in Japan per se had a positive impact on the participation in revolution
but its impact did not differ before and after the abolition of the exam. We do not find that
the effect of quotas varied with the number of students studying in Japan either.
The Number of Modern Firms The information on firms is obtained from Chang (1989),
who compiled ten series of detailed information on Chinese private enterprises including their
locations and establishment dates.47 Based on this information, we construct a prefecture-
by-year dataset on modern firms between 1900 and 1906. Similar to that using the number
of students studying in Japan, we examine the impacts of the number of firms before and
after the abolition as well as the triple effect related to logged quotas.
Columns (3)-(4) in Table 10 show that the number of modern firms had little impact on
revolution participation.
The Number of Students in Modern Primary Schools There is no systematic in-
formation on modern schools at the time of the abolition of the exam, as they were very
limited. The closest data we can get is the number of students in modern primary schools
in 1920, based on the surveys conducted by Christian organizations (Stauffer 1922). We use
this information as another proxy for modern human capital. The results are presented in
columns (5)-(6) in Table 10. Once more, it cannot explain the roles of quotas.
Column (7) reports the results after including all three measures. The impact of quotas is
still close to that from the baseline estimations, showing that these factors cannot explain our
findings. However, we do find that the association between the number of students studying
in Japan and revolution participation was significantly positive. This finding provides some
47All firms in this study meet the following five criteria: (i) the firm is organized as a company; (ii) thecapital is over 10,000 dollars; (iii) mechanization is used; (iv) there are over 30 employees; and (v) the valueof the output is over 50,000 dollars.
30
quantitative evidence for the modernization hypothesis in Huntington (1968).48 However, it
cannot explain our main findings on the change before and after the abolition.
5 Conclusion
This paper studies an important elite recruitment system in historical China and documents
its role in political stability. Exploring the unique historical event of the system, we find that
higher quotas per capita were associated with higher probability of revolution participation
after the abolition. After comparing various hypotheses, the data appears most consistent
with a theory where the abolition of the exam affected citizens’ prospect of upward mobility
and, therefore, their decision of revolution participation. These findings contribute to the
growing literature on the impact of political institutions on development. More specifically,
they provide new evidence on the role of perceived mobility on political stability.
In this process, we also document the roles of a few other factors in the revolution such
as modern human capital and social capital. Even though the event is unique for historical
China, the role of the elements on revolution documented in our study might apply to other
contexts of riots and revolution. For instance, the limitation of the elite recruitment mech-
anisms was also argued to contribute to the French Revolution (Brinton 1938, Goldstone
1991).
References
[1] Acemoglu, Daron, Georgy Egorov and Konstantin Sonin (2015), “Re-evaluating de Toc-queville: Social Mobility and Stability of Democracy”, mimeo, MIT, Northwestern andHigher School of Economics.
[2] Acemoglu, Daron, Simon Johnson, and James A. Robinson (2001a), “The Colonial Ori-gins of Comparative Development: An Empirical Investigation”, American EconomicReview, 91(5): 1369-1401.
[3] Acemoglu, Daron, and James A. Robinson (2001b), “A Theory of Political Transitions”,American Economic Review, 938-963.
[4] Acemoglu, Daron, and James A. Robinson (2008), “Persistence of Power, Elites andInstitutions”, American Economic Review, American Economic Review, 267-293.
[5] Alesina, Alberto, and Eliana La Ferrara (2000), “Participation in Heterogeneous Com-munities”, Quarterly Journal of Economics, 115 (3): 847-904.
[6] Alesina, Alberto, and Eliana La Ferrara (2005a), “Preferences for Redistribution in theLand of Opportunities”, Journal of Public Economics, 89(5): 897-931.
[7] Alesina, Alberto, and Eliana La Ferrara (2005b), “Ethnic Diversity and Economic Per-formance”, Journal of Economic Literature 43(3): 762-800.
[8] Benabou, Roland, and Efe A. Ok (2001), “Social mobility and the Demand for Redis-tribution: the POUM Hypothesis”, Quarterly Journal of Economics, 116(2): 447-487.
48This finding is also consistent with the argument on education contributes to democracy in Glaeser,Giacomo and Shleifer (2007).
31

[9] Besley, Timothy, and Torsten Persson (2011), “The Logic of Political Violence”, Quar-terly Journal of Economics, 126 (3): 1411-1445.
[10] Brinton, Crane (1938), The Anatomy of Revolution, New York: Vintage.[11] Cameron, Meribeth Elliott (1931), The Reform Movement in China, 1898-1912, Stanford
University Press.[12] Campbell, Cameron and James Lee (2003), “Social Mobility from a Kinship Perspective:
Rural Liaoning, 1789-1909”, International Review of Social History, 48: 1-26.[13] Campante, Filipe and Davin Chor (2012), “Why was the Arab World Poised for Revolu-
tion? Schooling, Economic Opportunities, and the Arab Spring”, Journal of EconomicPerspectives, 167-187.
[14] Castrillon, David (2012), “The Abolition of the Imperial Examination System and TheXinhai Revolution of 1911”, Mimeo.
[15] Chang, Chung-li (1955), The Chinese Gentry: Studies on Their Role in NineteenthCentury Chinese Society, Seattle: University of Washington Press.
[16] Chang, Chung-li (1962), The Income of the Chinese Gentry. Seattle, WA: University ofWashington Press.
[17] Chang, Yu-fa (1982), Qingji de geming tuanti (Revolutionary Organizations of the QingPeriod), Taipei: Academia Sinica, Institute of Modern History.
[18] Chang, Yu-fa (1989), “Private Industries in the Late Ch’ing and the Early Republic ofChina, 1860-1916”, Bulletin of the Institute of Modern History, Academia Sinica (18):315-561.
[19] Corneo, Giacomo, and Hans Peter Gruner (2002), “Individual Preferences for PoliticalRedistribution”, Journal of Public Economics, 83-107.
[20] Elman, Benjamin (2000), A Cultural History of Civil Examinations in Late ImperialChina, University of California Press.
[21] Elman, Benjamin (2013), Civil Examinations and Meritocracy in Late Imperial China,Harvard University Press.
[22] Elman, Benjamin (2009), “Civil Service Examinations” in Berkshire Encyclopedia ofChina, Berkshire Publishing Group.
[23] Esherick, Joseph (1987), The Origins of the Boxer Uprising, Univ of California Press.[24] FAO (2012), GAEZ (Global AgroEcological Zones), http://fao.org/Ag/AGL/agll/gaez/
index.htm.[25] Ferguson, John C (1906), “The Abolition of the Competitive Examinations in China”,
Journal of the American Oriental Society 27: 79-87.[26] Franke, Wolfgang (1960), The Reform and Abolition of the Traditional China Examina-
tion System, Harvard East Asian Monographs: Cambridge.[27] Franke, Wolfgang (1970), A Century of Chinese Revolution, 1851-1949, Oxford: Black-
well.[28] Garcia-Montalvo, J. and M. Reynal-Querol (2002), “Why Ethnic Fractionalization? Po-
larization, Ethnic Conflict and Growth”, mimeo, Universitat Pompeu Fabra.[29] Ge, Jianxiong (Ed.) (2000), Zhongguo renkoushi (China Population History), Shanghai:
Fudan University Press.[30] Glaeser, Edward L., Giacomo AM Ponzetto, and Andrei Shleifer (2007), “Why Democ-
racy Needs Education?”, Journal of Economic Growth, 12 (4): 77-99.[31] Goldstone, Jack (1991), Revolution and Rebellion in the Early Modern World, University
of California Press.[32] Hao, Yu, and Gregory Clark (2012), “Social Mobility in China, 1645-2012: A Surname
Study”, mimeo, UC Davis.
32
[33] Harvard Yenching Insitute (2007), CHGIS, Version 4, Cambridge.[34] Harrison, Henrietta (2005), The Man Awakened from Dreams: One Manas Life in a
North China village, 1857-1942, Stanford University Press.[35] Ho, Ping-ti (1959), “Aspects of Social Mobility in China, 1368–1911”, Comparative
Studies in Society and History 1: 330-359.[36] Ho, Ping-ti (1962), The Ladder of Success in Imperial China: Aspects of Social Mobility,
1368-1911, New York: Columbia.[37] Hoxby, Caroline (2000), “Does Competition among Public Schools Benefit Students and
Taxpayers?” American Economic Review, 1209-1238.[38] Hsu, Francis (1949), “Social Mobility in China”, American Sociological Review, 764-771.[39] Huntington, Samuel (2006), Political Order in Changing Societies, Yale University Press.[40] Hymes, Robert (1986), Statesmen and gentlemen: The Elite of Fu-chou, Chiang-hsi, in
Northern and Southern Sung, Cambridge University Press.[41] Kun, Gang et al. (Ed.), (1899), Qinding da Qing huidian shili (Imperially Established
Institutes and Laws of the Great Qing Dynasty), Beijing: Zhonghua shu ju (reprinted in1991).
[42] Kracke, Edward (1947), “Family vs. Merit in Chinese Civil Service Examinations Underthe Empire”, Harvard Journal of Asiatic Studies, 10: 102-121.
[43] Leventoglu, Bahar (2005), “Social Mobility and Political Transitions” , Journal of The-oretical Politics 17: 465-496.
[44] Liang, Fangzhong (1981), Zhongguo lidai hukou, tiandi, tianfu tongji (Historical Statis-tics of Population, Land and Taxation in China), Shanghai, Shanghai renmin chubanshe.
[45] Liu, Cheng-yun (1993), “Chong, Fan, Pi, and Nan: An Exploration of the Ranking ofQing Administrative Units”, Bulletin of Institute of History and Philology, AcademiaSinica 64 (1): 175-204.
[46] Luo, Jialun (Ed.) (1958), Geming wenxian (Documents on the Revolutionary), vol. 2.Taipei: Zhongyang wenwu gongyingshe.
[47] Luo, Yudong (1936), Zhongguo lijin shi (A History of Likin in China), Shanghai:Shangwu Shudian.
[48] Mosca, Gaetano (1939), The Ruling Class, New York, NY: McGraw-Hill.[49] North, Douglass C., John Joseph Wallis, and Barry R. Weingast (2009), Violence and
Social Orders, Cambridge University Press: Cambridge, UK.[50] Passarelli, Francesco, and Guido Tabellini (2013),“Emotions and Political Unrest”,
mimeo, Bocconi University.[51] Pareto, Vilfredo (1916), The Mind and Society, Lightning Source UK: UK. (reprinted in
2011)[52] Qian, Mu (1982), Traditional Government in Imperial China: A Critical Analysis, Chi-
nese University Press, 1982.[53] Qian, Shifu (2005), Qingdai zhiguan nianbiao (A Chronological Table of Qing Officials).
Beijing: Zhonghua shuju.[54] Ravallion, Martin, and Michael Lokshin. (2000), “Who Wants to Redistribute? The
Tunnel Effect in 1990 Russia”, Journal of Public Economics, 87-104[55] Rozman, Gilbert (1973), Urban Networks in Ch’ing China and Tokugawa Japan, Prince-
ton: Princeton University Press.[56] Rozman, Gilbert (Ed.) (1982), The Modernization of China, Simon and Schuster.[57] Scott, James C. (1998), Seeing Like a State: How Certain Schemes to Improve the
Human Condition Have Failed, Yale University Press.[58] Shen Yunlong (Ed.) (1978), Qingmo gesheng guanfei zifei liuri xuesheng xingmingbiao
33

(The Lists of Oversea Students in Japan in the Late Qing Period), Taipei: Wenhai Press.[59] Spence, Jonathan (1990), The Search for Modern China, WW Norton & Company.[60] Stauffer, Milton (1922), The Christian Occupation of China: a General Survey of the Nu-
merical Strength and Geographical Distribution of the Christian Forces in China, Shang-hai: China Continuation Committee.
[61] Tsing, Chung-Kai (2007), “A Study on the Future of Traditional Intellectuals after theCivil Service Examination Abolished in Late Ching China, 1905-1926”, mimeo, NationalChengchi University.
[62] The State Meteorological Society (1981), Zhongguo jinwubainian hanlao fenbu tuji(Yearly Charts of Dryness/Wetness in China for the Last 500-Year Period), Beijing:Ditu Press.
[63] Satyanath, Shanker, Nico Voigtlander, and Hans-Joachim Voth (2013), “Bowling forFascism: Social Capital and the Rise of the Nazi Party in Weimar Germany, 1919-33”,NBER Working paper No. 19201.
[64] Seligman, Lester G (1964), “Elite Recruitment and Political Development,” Journal ofPolitics, 26 (3): 612-626.
[65] Shi, He, Fuzhong Yao, and Cuidi Ye (1991), The Directory of Modern Chinese Journaland Newspapers, Fuzhou: Fujian People’s Press.
[66] Tang, Xianglong (1992), Zhongguo jin dai hai guan shui shou he fen pei tong ji, 1861-1910 (Distribution of Taxes and the Chinese Maritime Customs Statistics, 1861-1910),Beijing : Zhonghua shuju.
[67] Wang, Yi-chu (1960), “Western Impact and Social Mobility in China”, American Soci-ological Review, 25: 843-855.
[68] Wang, Yanfeng (2007), “A Summary on the Qing Grain Price Records during the Periodfrom Daoguang to Xuantong”, Researches In Chinese Economic History (2): 102-108.
[69] Wang, Yeh-chien (1973), Land Taxation in Imperial China 1750-1911, Cambridge: Har-vard University Press.
[70] Wang, Yuesheng (1989), “Qingdai keju renkou yanjiu” (Research on the Civil ServiceExam Population), Population Research (Renkou yanjiu), Vol. 3, 42-47.
[71] Weber, Max (1951), The Religion of China: Confucianism and Taoism, The Free Press.[72] Wurm, Stephen Adolphe, Rong Li, Theo Baumann, Mei W. Lee (ed.) (1987), The Lan-
guage Atlas of China, Hong Kong : Longman Group.[73] Yan, Zhongping (1955), Zhongguo jindai jingjishi tongji ziliaoxuanji (Selected Statistical
Materials on Modern Chinese Economic History), Beijing: Kexue chubanshe.[74] Yao, Linqing (2004), “The Chinese Overseas Students: An Overview of the Flows
Change”, 12th Biennial Conference of the Australian Population Association: 15-17.[75] Zhu, Baojiong, and Peilin Xie (Ed.) (1980), Ming Qing jinshi timing beilu suoyin (Index
of Names of Jinshi Graduates in the Ming and Qing Periods), Shanghai: Shanghai guji.
34

Figure 1: The Structure of the Civil Service Exam
Notes: The number of prefecture-level exam graduates was governed by a prefecture-level quota. We code the prefecture-level data based on Kun, Gang et al. (1899).
The number of national-level exam graduates was governed by a province-level quota. We coded their prefectures of origin based on the lists of names and origins in Zhu and
Xie (1980).
The number of provincial-level exam graduates was governed by provincial-level quota. We do not have prefecture-level information on these graduates.
The number of exam-takers comes from Elman (2013). Note that there was no limit on age or the number of attempts to take the exam.
35

Figure 2: Distribution of Quotas Across Prefectures
(a) Spatial Distribution of Quotas
(b) Spatial Distribution of Quotas per Million People
Notes: This figure shows that there are great regional variations in quotas and quotas per capita. For example, province
fixed effects only explain 30% of the variations in the quotas across prefectures.
36

Figure 3: The Dynamic Impacts of ln (Quotas per capita) on Revolution Participation
(a) Prefecture-level Analysis (1900-1906)
(b) County-level Analysis (1894-1906)
Notes: These figures present the dynamic effects of quotas per capita on revolution participation, using the year 1900
as the reference. Panel (a) presents the results using the prefecture-level data between 1900 and 1906, where the solid
line connects the estimates and the shaded area indicates the 95% confidence intervals. Panel (b) adds the results using
the county-level data between 1894 and 1906, where the dashed line connects the estimates.
37
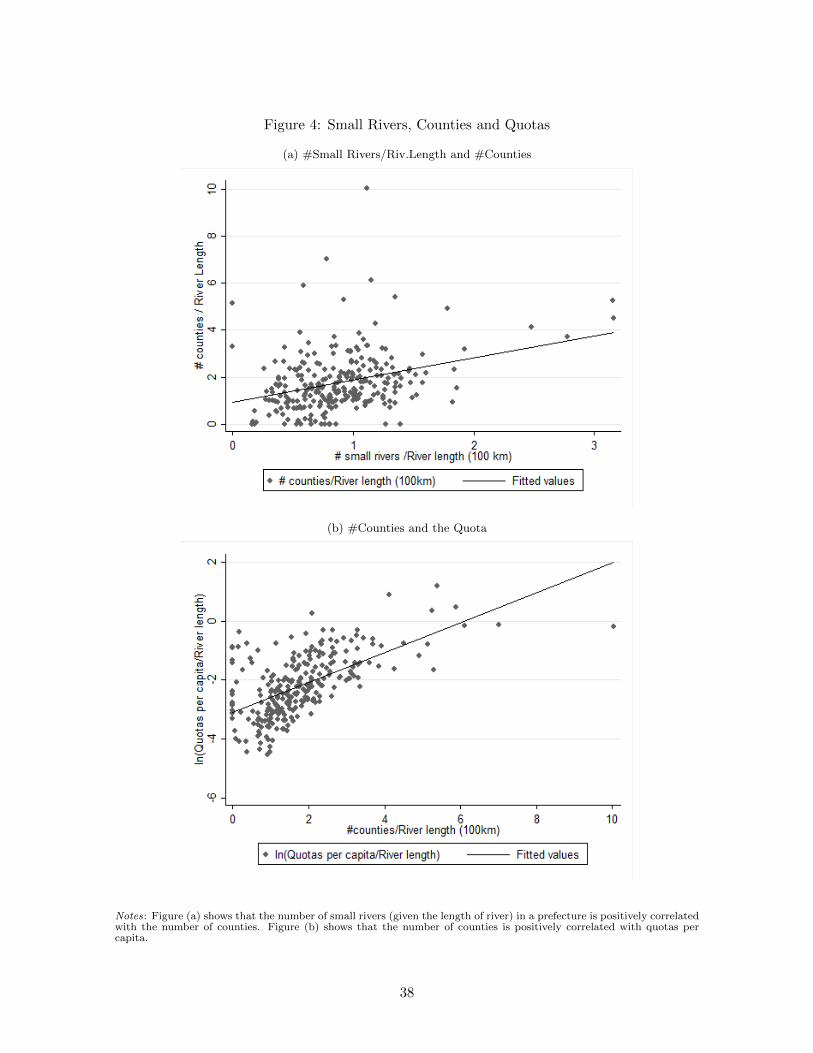
Figure 4: Small Rivers, Counties and Quotas
(a) #Small Rivers/Riv.Length and #Counties
(b) #Counties and the Quota
Notes: Figure (a) shows that the number of small rivers (given the length of river) in a prefecture is positively correlatedwith the number of counties. Figure (b) shows that the number of counties is positively correlated with quotas percapita.
38

Table 1: Summary Statistics for the Main Variables
Variables Variables Definition Data Sources Obs. Mean S.D.Revolutionaries Having or not 1, 2 1,834 0.155 0.362
# revolutionaries 1, 2 1,834 0.696 3.231Early Uprisings in 1911 Incidence of early uprisings in 1911 3 262 0.160 0.367Measures of the Exam Quotas 4 262 113.771 75.604
ln (Quotas per million) 4 262 4.636 0.700# presented scholars 5 262 95.977 146.355# key officials 6 262 15.580 30.390
Baseline Controls ln (Pop in 1880) 7 262 13.620 1.074ln Area 8 262 9.336 0.770Treaty port 9 262 0.115 0.319Small city 10 262 0.198 0.400Middle city 10 262 0.122 0.328Large city 10 262 0.038 0.192Major river 8 262 0.618 0.487Coast 8 262 0.134 0.341
Instrumental Variables # small rivers/river length 8 262 0.886 0.435River length 8 262 6.847 0.713∆ Presented scholars before 1425 5 262 0.377 0.727
Placebo Tests Incidence of the Boxer Rebellion 11 262 0.099 0.300Transportation (pref) 12 262 0.615 0.488Transportation (cnty) 12 262 0.380 0.300Fox millet suitability 13 262 2.877 1.334Rice suitability 13 262 1.991 1.075Sweet Potato suitability 13 262 2.622 0.992Climate shocks 14 262 0.063 0.092Basin HHI 8 262 0.608 0.243
Modern Human Capital # domestic modern firms 15 1,834 0.097 0.573# oversea students in Japan 16 1,834 0.793 2.725# students in modern primary schools 17 262 10,540 14,600
Social Capital Language fragmentation index 18 262 0.087 0.164Language polarization index 18 262 0.162 0.298
Data Sources:
1: Chang, Yu-fa (1982), Revolutionary Organizations of the Qing Period.
2: Luo, Jialun (1958), Documents on the Revolutionary, vol. 2.
3: The Tokyo Nichi Nichi Shimbun, 3 November, 1911.
4: Kun, Gang et al. (Ed.) (1899), Imperially Established Institutes and Laws of the Great Qing Dynasty.
5: Zhu, Baojiong, and Peilin Xie (Ed.) (1980), Index of Names of Jinshi Graduates in the Ming and Qing Periods.
6: Qian, Shifu (2005), A Chronological Table of Qing Officials.
7: Ge, Jianxiong (2000), China Population History.
8: Harvard Yenching Institution (2007), CHGIS, Version 4.
9: Yan, Zhongping (1955), Selected Statistical Materials on Modern Chinese Economic History.
10: Rozman, Gilbert (1973), Urban Networks in Ching China and Tokugawa Japan.
11: The Boxer Protocol (1901).
12: Liu, Cheng-yun (1993), “Chong, Fan, Pi, and Nan: An Exploration of the ranking of Qing Administrative Units”.
13: FAO (2012), GAEZ: http://fao.org/Ag/AGL/agll/gaez/ index.htm.
14: The State Meteorological Society (1981).
15: Chang, Yufa (1989), “Private Industries in the Late Ch’ing and the Early Republic of China, 1860-1916”.
16: Shen, Yunlong (Ed.) (1978), The Lists of Oversea Students in Japan in the Late Qing Period.
17: Stauffer (1922), The Christian occupation of China.
18: The Language Atlas of China (1987).
39

Table 2: The Impact of Quotas I: On Revolution Participation
Revolutionary = 0/1 #RevolutionariesRevolutionaries
per 100,000(1) (2) (3) (4) (5) (6) (7) (8)
Linear Linear Linear Linear Weighted Linear Poisson Linearln (Quota/Pop) * Post 0.139*** 0.148*** 0.124*** 0.111** 0.131*** 0.539** 0.980** 1.162***
(0.044) (0.044) (0.045) (0.045) (0.050) (0.211) (0.418) (0.216)ln Pop * Post 0.216*** 0.242*** 0.235*** 0.221*** 0.191*** 0.815*** 1.290*** 0.688***
(0.025) (0.029) (0.029) (0.031) (0.032) (0.176) (0.282) (0.169)ln Area * Post -0.050 -0.059* -0.057* -0.019 -0.063 -1.433*** -0.664***
(0.033) (0.034) (0.035) (0.027) (0.111) (0.285) (0.173)Coastal * Post -0.075 -0.109 -0.077 -0.168 -0.802** -0.079
(0.086) (0.087) (0.086) (0.496) (0.344) (0.379)Major River * Post 0.094** 0.088* 0.086* -0.032 -0.959*** 0.566**
(0.046) (0.048) (0.044) (0.181) (0.252) (0.225)Treaty Port * Post 0.108 0.130* 0.408 -0.153 0.616*
(0.078) (0.078) (0.384) (0.250) (0.347)Small City * Post -0.013 0.021 0.022 0.527* 0.476*
(0.056) (0.092) (0.427) (0.296) (0.276)Middle City * Post 0.013 -0.012 0.587 0.437 -0.010
(0.082) (0.083) (0.627) (0.278) (0.337)Large City * Post 0.136 0.258* 1.428 -0.295 -0.529
(0.137) (0.131) (1.449) (0.321) (0.591)
Prefecture FE Y Y Y Y Y Y Y YYear FE Y Y Y Y Y Y Y YProv. FE * Year FE Y Y Y Y Y Y Y YObservations 1,834 1,834 1,834 1,834 1,834 1,834 1,057 1,834R-squared 0.450 0.452 0.456 0.461 0.396 0.244 0.270
Notes: This table reports the impact of quota on revolution participation after the abolition of the exam, compared with that before the abolition. The results in column (5)are weighted by population size. Standard errors in parenthesis are clustered at the prefecture level: * significant at 10%; ** significant at 5%; *** significant at 1%.
40

Table 3: The Impact of Quotas II: On Early Uprisings in 1911 and the Boxer Rebellion
Incidence of the Republic Revolution1911
Incidence of the Boxer Rebellion1899-1901
(1) (2) (3) (4) (5) (6) (7) (8) (9) (10) (11)All All All All All Northern Northern All All All Northern
ln (Quota/Pop) 0.094** 0.085** 0.075* 0.094** 0.076* 0.123** 0.128** 0.023 0.010 0.000 0.013(0.040) (0.043) (0.044) (0.040) (0.045) (0.051) (0.052) (0.023) (0.024) (0.024) (0.036)
lnPop 0.108*** 0.132*** 0.122*** 0.109*** 0.123*** 0.135*** 0.137*** 0.062*** 0.041** 0.026 0.041(0.027) (0.032) (0.035) (0.027) (0.036) (0.041) (0.041) (0.017) (0.018) (0.020) (0.025)
Newspaper density -0.232 -0.597 -1.513(1.027) (1.221) (1.408)
ln Area -0.035 -0.039 -0.040 -0.043 -0.046 0.045** 0.058*** 0.073***(0.040) (0.041) (0.041) (0.050) (0.050) (0.020) (0.022) (0.027)
Coastal -0.126 -0.130 -0.128 -0.196* -0.186 -0.052 -0.046 -0.032(0.081) (0.088) (0.089) (0.111) (0.113) (0.053) (0.056) (0.092)
Main River 0.038 0.038 0.005 0.002 -0.046 -0.056(0.050) (0.050) (0.057) (0.057) (0.037) (0.049)
Treaty Port 0.046 0.051 0.177 0.196 -0.062 -0.062(0.087) (0.090) (0.117) (0.124) (0.039) (0.060)
Small City -0.004 -0.002 -0.057 -0.053 -0.013 -0.017(0.071) (0.071) (0.076) (0.077) (0.035) (0.046)
Middle City -0.016 -0.016 -0.033 -0.032 0.156** 0.194**(0.084) (0.084) (0.099) (0.099) (0.064) (0.080)
Large City 0.077 0.083 -0.064 -0.050 0.064 0.058(0.150) (0.146) (0.175) (0.171) (0.084) (0.106)
Province FE Y Y Y Y Y Y Y Y Y YObservations 262 262 262 262 262 191 191 262 262 262 191R-squared 0.231 0.242 0.248 0.231 0.248 0.326 0.328 0.385 0.394 0.422 0.417
Notes: Columns (1)-(7) shows that higher quotas were associated with higher probability of early uprisings in 1911. Columns (8)-(11) show that the quota did not affect theBoxer Rebellion. The Boxer Rebellion was motivated by proto-nationalist sentiments and opposition to foreign imperialism and Christianity, which was unlikely to be correlatedwith the exam system. Columns (6), (7), (11) limit the sample to the prefectures with latitude higher than that of the southernmost prefecture with the Boxer Rebellion.Standard errors in parenthesis are clustered at the prefecture level: * significant at 10%; ** significant at 5%; *** significant at 1%.
41

Table 4: Relevance and Placebo Tests of the Two Instruments
(a) IV1: #small river / river length
Relevance Tests Placebo Testsln (Quota/Pop) Transportation Suitability Climate Basin
Late Qing Early Qing Change Pref.CountyAverage
Rice FoxmilletSweetPotato
Drought/Flood
HH Index
(1) (2) (3) (4) (5) (6) (7) (8) (9) (10)#Small River/RiverLeng. 0.260** 0.262* -0.001 -0.118 -0.071 0.172 0.034 0.135 0.010 0.034
(0.121) (0.140) (0.029) (0.084) (0.060) (0.124) (0.184) (0.132) (0.014) (0.053)ln (River Length) 0.213* 0.223 -0.009 0.020 0.033 0.066 -0.064 -0.273* 0.020* -0.068
(0.126) (0.140) (0.032) (0.087) (0.072) (0.143) (0.201) (0.144) (0.011) (0.042)Major River 0.131* 0.113 0.018 0.150** 0.126*** 0.010 -0.078 0.101 0.011 -0.020
(0.069) (0.069) (0.015) (0.070) (0.046) (0.106) (0.123) (0.116) (0.009) (0.035)Baseline Controls Y Y Y Y Y Y Y Y Y YProvince FE Y Y Y Y Y Y Y Y Y YObservations 262 262 262 262 262 262 262 262 262 262R-squared 0.772 0.749 0.702 0.287 0.237 0.690 0.720 0.541 0.400 0.378
(b) IV2: short-run change in performance
Relevance Tests Placebo Tests: Changes in Presented Scholars in the Long Runln (Quota/Pop) 1436-1505vs. 1506-1572vs. 1573-1643vs. 1644-1722vs. 1723-1795vs. 1796-1861vs.
Late Qing Early Qing Change 1368-1435 1436-1505 1506-1572 1573-1643 1644-1722 1723-1795(1) (2) (3) (4) (5) (6) (7) (8) (9)
∆ln(PresentedScholar) 0.224*** 0.214*** 0.009 -0.024 -0.104 -0.084 -0.125 0.037 -0.058(0.044) (0.044) (0.013) (0.087) (0.079) (0.064) (0.081) (0.096) (0.072)
ln (PresentedScholar0) Y Y Y Y Y Y Y Y YBaseline Controls Y Y Y Y Y Y Y Y YProvince FE Y Y Y Y Y Y Y Y YObservations 262 262 262 262 262 262 262 262 262R-squared 0.785 0.761 0.704 0.424 0.135 0.160 0.273 0.471 0.183
Notes: Columns (1)-(3) show that the instrument is correlated with the level of quotas but not the change. The other columns present different sets of placebo tests. Columns(4)-(10) in panel (a) show that the instrument was not correlated with transportation importance, agricultural suitability, climate shocks or basin fragmentation. Columns(4)-(9) in panel (b) show that the instrument did not affect the growth of successful candidates in the long run. The baseline controls include (i) logged population in 1880and logged area; (ii) whether a prefecture is located on the coast and whether it is located on a major river; (iii) whether a prefecture has a treaty port; and (iv) whether aprefecture was counted as a big city, a middle-size city or a small city. Standard errors in parenthesis are clustered at the prefecture level: * significant at 10%; ** significantat 5%; *** significant at 1%.
42
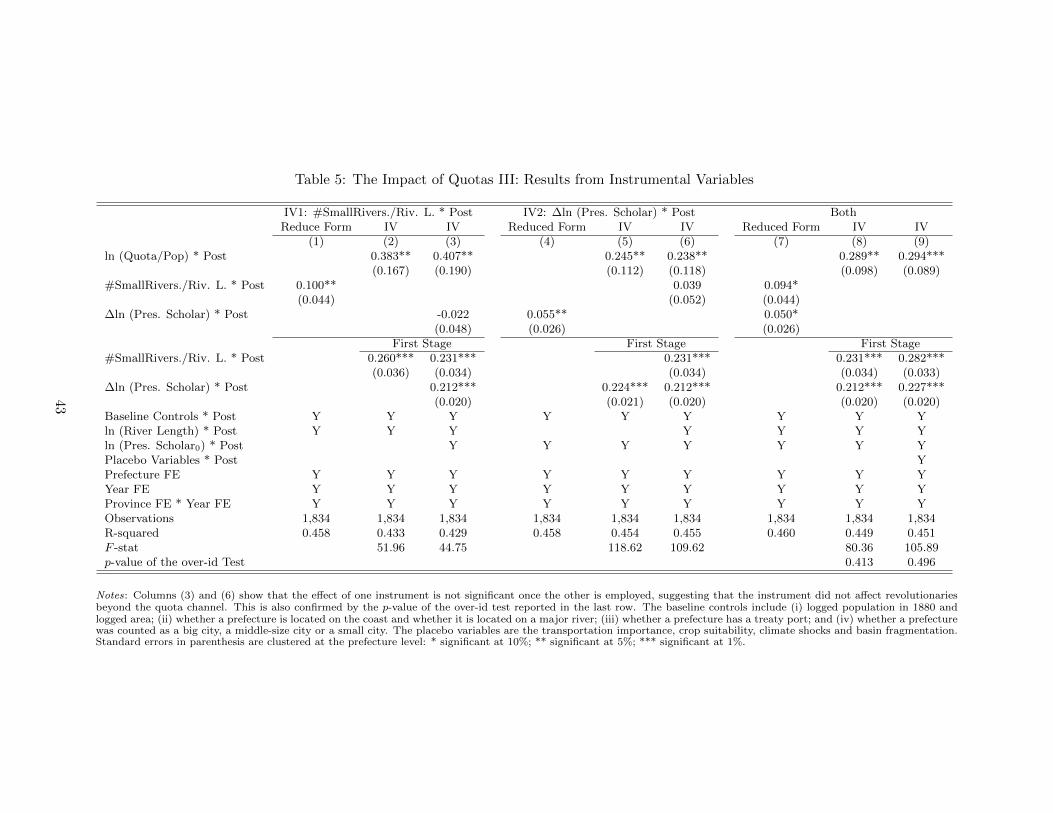
Table 5: The Impact of Quotas III: Results from Instrumental Variables
IV1: #SmallRivers./Riv. L. * Post IV2: ∆ln (Pres. Scholar) * Post BothReduce Form IV IV Reduced Form IV IV Reduced Form IV IV
(1) (2) (3) (4) (5) (6) (7) (8) (9)ln (Quota/Pop) * Post 0.383** 0.407** 0.245** 0.238** 0.289** 0.294***
(0.167) (0.190) (0.112) (0.118) (0.098) (0.089)#SmallRivers./Riv. L. * Post 0.100** 0.039 0.094*
(0.044) (0.052) (0.044)∆ln (Pres. Scholar) * Post -0.022 0.055** 0.050*
(0.048) (0.026) (0.026)First Stage First Stage First Stage
#SmallRivers./Riv. L. * Post 0.260*** 0.231*** 0.231*** 0.231*** 0.282***(0.036) (0.034) (0.034) (0.034) (0.033)
∆ln (Pres. Scholar) * Post 0.212*** 0.224*** 0.212*** 0.212*** 0.227***(0.020) (0.021) (0.020) (0.020) (0.020)
Baseline Controls * Post Y Y Y Y Y Y Y Y Yln (River Length) * Post Y Y Y Y Y Y Yln (Pres. Scholar0) * Post Y Y Y Y Y Y YPlacebo Variables * Post YPrefecture FE Y Y Y Y Y Y Y Y YYear FE Y Y Y Y Y Y Y Y YProvince FE * Year FE Y Y Y Y Y Y Y Y YObservations 1,834 1,834 1,834 1,834 1,834 1,834 1,834 1,834 1,834R-squared 0.458 0.433 0.429 0.458 0.454 0.455 0.460 0.449 0.451F -stat 51.96 44.75 118.62 109.62 80.36 105.89p-value of the over-id Test 0.413 0.496
Notes: Columns (3) and (6) show that the effect of one instrument is not significant once the other is employed, suggesting that the instrument did not affect revolutionariesbeyond the quota channel. This is also confirmed by the p-value of the over-id test reported in the last row. The baseline controls include (i) logged population in 1880 andlogged area; (ii) whether a prefecture is located on the coast and whether it is located on a major river; (iii) whether a prefecture has a treaty port; and (iv) whether a prefecturewas counted as a big city, a middle-size city or a small city. The placebo variables are the transportation importance, crop suitability, climate shocks and basin fragmentation.Standard errors in parenthesis are clustered at the prefecture level: * significant at 10%; ** significant at 5%; *** significant at 1%.
43

Table 6: The Impacts of Quotas on Political Newcomers Under Different Regimes
Quotas and Elite Recruitment1644-1904
Before the Abolition1904
After the Abolition1907
Title Presented Scholar Key Official New Presented Scholar Quasi-Presented Scholar0/1 Number 0/1 Number 0/1 Number 0/1 Number(1) (2) (3) (4) (5) (6) (7) (8)
ln (Quota/Pop) 0.309*** 0.381*** 0.246*** 0.335*** 0.226*** 0.271*** 0.112 0.137p-value [0.000] [0.000] [0.002] [0.000] [0.007] [0.002] [0.151] [0.106]
ln Pop 0.661*** 0.578*** 0.671*** 0.463*** 0.515*** 0.556*** 0.260*** 0.293***p-value [0.000] [0.000] [0.000] [0.000] [0.000] [0.000] [0.001] [0.000]
Prov. FE Y Y Y Y Y Y Y YObs. 262 262 262 262 262 262 262 262R-sq. 0.322 0.366 0.358 0.337 0.260 0.202 0.365 0.241p-value 0.046 0.009
Notes: The table shows the link between the quota density and the number of political newcomers across prefectures under different regimes: there was a strong link betweenthe quota density and the number of political newcomers (shown in columns (1)-(6). This link was very much weakened with the abolition of the exam (shown in in columns(7)-(8)).Beta coefficients are reported. p-values are reported in squared brackets: * significant at 10%; ** significant at 5%; *** significant at 1%. In the last row, the number in column(7) reports the p-value from the test on the difference between the impacts of quotas in 1904 and 1907 on the newcomer dummy (0.226 in column (5) vs. 0.112 in column (7)).Similarly, the number in column (8) reports that on the number of newcomers (0.271 in column (6) vs. 0.137 in column (8)).
44
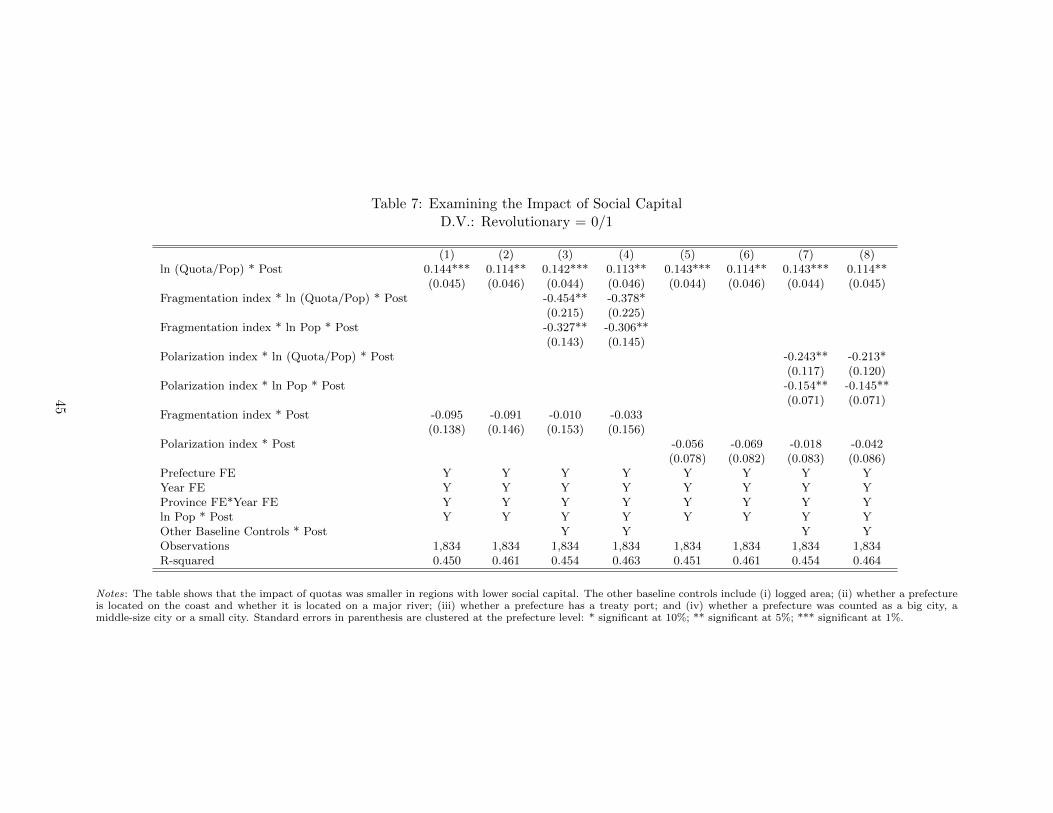
Table 7: Examining the Impact of Social CapitalD.V.: Revolutionary = 0/1
(1) (2) (3) (4) (5) (6) (7) (8)ln (Quota/Pop) * Post 0.144*** 0.114** 0.142*** 0.113** 0.143*** 0.114** 0.143*** 0.114**
(0.045) (0.046) (0.044) (0.046) (0.044) (0.046) (0.044) (0.045)Fragmentation index * ln (Quota/Pop) * Post -0.454** -0.378*
(0.215) (0.225)Fragmentation index * ln Pop * Post -0.327** -0.306**
(0.143) (0.145)Polarization index * ln (Quota/Pop) * Post -0.243** -0.213*
(0.117) (0.120)Polarization index * ln Pop * Post -0.154** -0.145**
(0.071) (0.071)Fragmentation index * Post -0.095 -0.091 -0.010 -0.033
(0.138) (0.146) (0.153) (0.156)Polarization index * Post -0.056 -0.069 -0.018 -0.042
(0.078) (0.082) (0.083) (0.086)Prefecture FE Y Y Y Y Y Y Y YYear FE Y Y Y Y Y Y Y YProvince FE*Year FE Y Y Y Y Y Y Y Yln Pop * Post Y Y Y Y Y Y Y YOther Baseline Controls * Post Y Y Y YObservations 1,834 1,834 1,834 1,834 1,834 1,834 1,834 1,834R-squared 0.450 0.461 0.454 0.463 0.451 0.461 0.454 0.464
Notes: The table shows that the impact of quotas was smaller in regions with lower social capital. The other baseline controls include (i) logged area; (ii) whether a prefectureis located on the coast and whether it is located on a major river; (iii) whether a prefecture has a treaty port; and (iv) whether a prefecture was counted as a big city, amiddle-size city or a small city. Standard errors in parenthesis are clustered at the prefecture level: * significant at 10%; ** significant at 5%; *** significant at 1%.
45

Table 8A: Checking Changes in State Capacity I: Examining Taxes
ln (Land Tax) ln (Internal Tariff) ln (Custom Duties)(1) (2) (3) (4) (5) (6)
ln (Quota/Pop) * Post -0.067 -0.124 0.061 0.604 -0.304 -0.882(0.170) (0.153) (0.390) (0.347) (0.631) (1.172)
ln Pop * Post 0.184 0.233* -0.068 0.495 0.006 0.088(0.185) (0.126) (0.403) (0.282) (0.460) (0.600)
Province FE Y Y Y Y Y YOther Baseline Controls * Post Y Y YObservations 52 52 126 126 117 117R-squared 0.823 0.953 0.231 0.397 0.193 0.286
Notes: This table shows that provincial-level taxes did not respond to the interaction of quotas per capita and theabolition. Other baseline controls include (i) logged area of a province; (ii) the share of prefectures located on the coastor a major river; (iii) the share of prefectures being treaty ports; and (iv) the share of prefectures counted as big cities,middle-size cities or small cities. Standard errors in parenthesis are clustered at the province level: * significant at 10%;** significant at 5%; *** significant at 1%.
Table 8B: Checking the Role of State Capacity II: Results Using Importance MeasuresD.V.: Revolutionary = 0/1
(1) (2) (3) (4) (5) (6) (7)ln (Quota/Pop) * Post 0.110** 0.127** 0.108** 0.109** 0.104** 0.108** 0.114**
(0.045) (0.051) (0.046) (0.047) (0.046) (0.044) (0.052)Taxes per capita in 1820 * Post -0.135 -0.099
(0.260) (0.240)Province Capital * Post 0.098 0.110
(0.120) (0.118)Communication (Chong) * Post 0.021 0.043
(0.049) (0.050)Business (Fan) * Post 0.011 -0.040
(0.053) (0.061)Difficulty of taxing (Pi) * Post 0.090* 0.092
(0.054) (0.056)Crime (Nan) * 0.075 0.070
(0.046) (0.053)Prefecture FE Y Y Y Y Y Y YYear FE Y Y Y Y Y Y YProvince FE * Year FE Y Y Y Y Y Y YBaseline Controls * Post Y Y Y Y Y Y YObservations 1,799 1,834 1,834 1,834 1,834 1,834 1,799R-squared 0.463 0.461 0.461 0.461 0.463 0.463 0.468
Notes: This table shows that prefectures of more importance generally did not respond more to the abolition, and that
the impact of quotas per capita cannot be explained by the importance measures. The only importance measure that
has a weak effect is the difficulty of taxing. The baseline controls include (i) logged population in 1880 and logged area;
(ii) whether a prefecture is located on the coast and whether it is located on a major river; (iii) whether a prefecture
has a treaty port; and (iv) whether a prefecture was counted as a big city, a middle-size city or a small city. Standard
errors in parenthesis are clustered at the prefecture level: * significant at 10%; ** significant at 5%; *** significant at
1%.
46

Table 9A: Investigating the Role of Existing Elites ID.V.: Revolutionary = 0/1
(1) (2) (3) (4) (5) (6) (7) (8)ln (Quota/Pop) * Post 0.111** 0.115**
(0.045) (0.052)ln (Pres. Scholar+1/Pop) * Post 0.033 -0.026
(0.026) (0.036)ln (Official+1/Pop) * Post 0.041 0.038
(0.026) (0.030)
100*QuotaPop
* Post 0.035*** 0.040***
(0.009) (0.011)100*Pres.Scholar
Quota* Post 0.063 0.043
(0.077) (0.076)Official
Pres.Scholar* Post -0.031 0.015
(0.072) (0.071)Prefecture FE Y Y Y Y Y Y Y YYear FE Y Y Y Y Y Y Y YProvince FE*Year FE Y Y Y Y Y Y Y YBaseline controls * Post Y Y Y Y Y Y Y YObservations 1,834 1,834 1,834 1,834 1,834 1,834 1,778 1,778R-squared 0.461 0.457 0.458 0.462 0.463 0.456 0.458 0.466
Notes: This table shows that what mattered for revolution participation is the prospect for those who had not become
elites (measured by ln Quota or Quota/Popu) rather than that for the existing elites. The baseline controls include (i)
logged population in 1880 and logged area; (ii) whether a prefecture is located on the coast and whether it is located
on a major river; (iii) whether a prefecture has a treaty port; and (iv) whether a prefecture was counted as a big city,
a middle-size city or a small city. Standard errors in parenthesis are clustered at the prefecture level: * significant at
10%; ** significant at 5%; *** significant at 1%.
Table 9B: Investigating the Role of Existing Elites IID.V.: Revolutionary = 0/1
(1) (2) (3) (4)
S.D. of Indictors Drought/Flood1800-1899 in year t
ln (Quota/Pop)*Post 0.111** 0.123** 0.108** 0.111**(0.046) (0.050) (0.046) (0.047)
Weather*Post 0.011 -0.038 0.066 0.050(0.086) (0.083) (0.098) (0.106)
Weather* ln (Quota/Pop)*Post -0.030 0.091(0.152) (0.184)
Weather* ln Pop*Post 0.122 0.027(0.106) (0.116)
Weather 0.031 0.032(0.026) (0.026)
Prefecture FE Y Y Y YProvince FE*Year FE Y Y Y YBaseline Controls*Post Y Y Y YObservations 1,834 1,834 1,834 1,834R-squared 0.461 0.463 0.462 0.462
Notes: The table shows that the demand for public goods provision by the elites (proxied by weather shocks) did nothave any significant impact on revolution participation. The baseline controls include (i) logged population in 1880 andlogged area; (ii) whether a prefecture is located on the coast and whether it is located on a major river; (iii) whethera prefecture has a treaty port; and (iv) whether a prefecture was counted as a big city, a middle-size city or a smallcity. Standard errors in parenthesis are clustered at the prefecture level: * significant at 10%; ** significant at 5%; ***significant at 1%.
47

Table 10: Evaluating the Impact of Modern Human CapitalD.V.: Revolutionary = 0/1
(1) (2) (3) (4) (5) (6) (7)ln (Quota/Pop) * Post 0.098** 0.094** 0.112** 0.123*** 0.090* 0.134** 0.102*
(0.044) (0.044) (0.046) (0.047) (0.047) (0.061) (0.060)ln (Japan stu.+1) 0.121*** 0.117*** 0.119***
(0.035) (0.034) (0.034)ln (Japan stu. +1) * Post 0.002 0.016 0.019
(0.052) (0.059) (0.059)ln (Japan stu. +1) * ln (Quota/Pop) * Post 0.078 0.048
(0.065) (0.074)ln (Japan stu. +1) * ln Pop * Post 0.000 -0.027
(0.044) (0.047)ln (Firm+1) 0.075 0.076 0.047
(0.084) (0.084) (0.084)ln (Firm+1) * Post -0.063 -0.115 -0.081
(0.117) (0.144) (0.144)ln (Firm+1) * ln (Quota/Pop) * Post 0.300 0.349*
(0.184) (0.191)ln (Firm+1)* ln Pop * Post 0.140 0.148
(0.115) (0.111)ln (Stu. in 1920+1) * Post 0.011 0.017* 0.016
(0.009) (0.010) (0.010)ln (Stu. +1) * ln (Quota/Pop) * Post 0.012 0.004
(0.008) (0.009)ln (Stu. +1)* ln Pop * Post 0.014** 0.013*
(0.006) (0.007)
Prefecture FE Y Y Y Y Y Y YYear FE Y Y Y Y Y Y YProvince FE*Year FE Y Y Y Y Y Y YBaseline Controls * Post Y Y Y Y Y Y YObservations 1,834 1,834 1,834 1,834 1,834 1,834 1,834R-squared 0.474 0.476 0.461 0.463 0.462 0.465 0.482
Notes: The table shows that the number of students studying in Japan had a positive impact on revolution participation but the effects did not change before and after theabolition of the exam in 1905. The other measures did not have a significant impact on revolution participation. The baseline controls include (i) logged population in 1880and logged area; (ii) whether a prefecture is located on the coast and whether it is located on a major river; (iii) whether a prefecture has a treaty port; and (iv) whether aprefecture was counted as a big city, a middle-size city or a small city. Standard errors in parenthesis are clustered at the prefecture level: * significant at 10%; ** significantat 5%; *** significant at 1%.
48
A Appendix
A.1 Results on the Party Identification
We link the quotas to individuals’ party identification among parliament members in 1912,
using the following cross-sectional specification:
KMTi,p= ϕln(Quota
Pop)p+ν ln Popp+θXp+δprov+εi,p,
where KMTi,p is a dummy indicating whether a party member i belongs to the Kuomintang
or not. Compared with the other parties – the Republican Party (Kunghotang) and the
Democratic Party(Minzhutang) – Kuomintang (which literally means “Chinese Nationalist
Party”) was known to be more radical. In contrast, the party ideology of the Kunghotang was
based on Jean-Jacques Rousseau’s The Social Contract whereas the Minzhutang emphasizes
that stability was their primary goal.
The results are presented in columns (1)-(2) in Table A.7. Among the 703 party members
for whom we can identify the origins and ages, 434 were identified with the Kuomintang.
Based on the individual-level information, we do not find any significant impact of quotas per
capita on party identification. However, consistent with the hypothesis that the Kuomintang
was more radical, we find that younger people were more likely to identify themselves as
Kuomintang members.
Columns (4)-(8) report the results using prefecture-level information to examine the link
between the quotas and the number of party members. As is shown, quotas per capita
increased the party member probability for both the Kungmintang and the other parties.
This finding is expected because more revolutionaries should be associated with a higher
probability of party members after the success of the revolution. However, the magnitudes
of the impacts for the Kungmintang and the other parties are not significantly different.
Consistent with the placebo test using the Boxer Rebellion, the finding on party identification
once again shows that potential ideological differences cannot explain the impact of quotas.
A.2 An Example for the Instrument
Qingzhou and Xuzhou were two prefectures of similar population size and area size. Qingzhou
had a population of 3.8 million and an area of 17,000 km2, whereas Xuzhou had a population
of 4 million and an area of 17,000 km2. There were 21 small rivers in Qingzhou and 18
small rivers in Xuzhou. As a result, Qingzhou was divided into 11 counties while Xuzhou 8
counties. Due to the stepwise rule, each county was assigned a positive quota. Adding the
additional quota for the whole prefecture, Qingzhou had a quota of 195, higher than that
of Xuzhou (167). Consequently, the quotas per capita at the prefecture-level was higher in
Qingzhou (51.3 per million) than that in the Xuzhou (41.8 per million). This is the variation
we explore in our analysis.
A-1
Note that this difference also holds at the county level due to the fact that county-level
population sizes were smaller in Qingzhou (with more counties). There was no systematic
information on the county-level population, but we can rely on average population sizes. On
average, a county in Qingzhou had a population of 0.35 million while a county in Xuzhou had
a population of 0.5 million. Depending on the scale and importance, counties in Qingzhou got
assigned quota values of 12, 15 and 20. Thus, quotas per capita for a country in Qingzhou
ranged between 34.3 per million to 57 per million. In contrast, counties in Xuzhou got
assigned quota values of 16 and 20. Hence, quotas per capita for a county in Xuzhou ranged
between 32 per million to 40 per million.
A.3 Varying the Definition of Small Rivers
For robustness checks of using small rivers as an instrument, we vary the definition of small
rivers to be those under the length of X km (X = 70, 80, 90,...,120), while controlling for the
interaction of the post dummy and those above X km. These results are presented in Table
A.9. They show that the results are robust to these variations.
Moreover, we find no similar impact of the number of big rivers per se, which once again
confirms that our river instrument is reasonable.
A-2
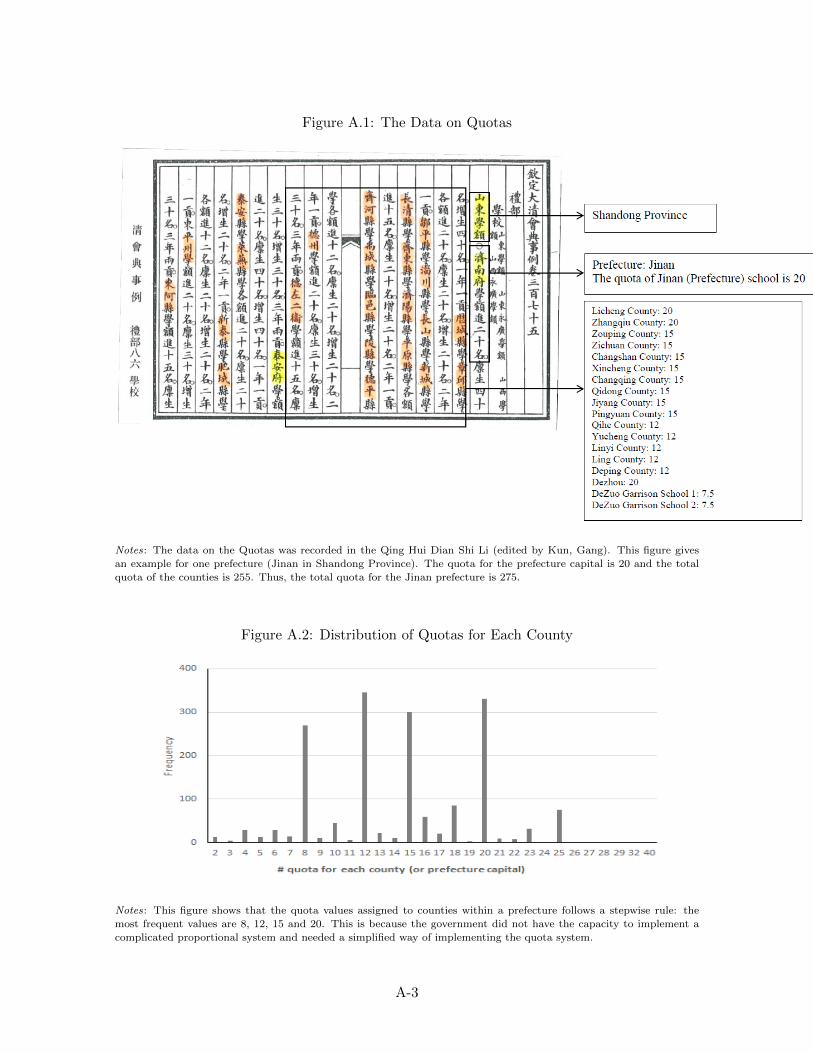
Figure A.1: The Data on Quotas
Notes: The data on the Quotas was recorded in the Qing Hui Dian Shi Li (edited by Kun, Gang). This figure gives
an example for one prefecture (Jinan in Shandong Province). The quota for the prefecture capital is 20 and the total
quota of the counties is 255. Thus, the total quota for the Jinan prefecture is 275.
Figure A.2: Distribution of Quotas for Each County
Notes: This figure shows that the quota values assigned to counties within a prefecture follows a stepwise rule: the
most frequent values are 8, 12, 15 and 20. This is because the government did not have the capacity to implement a
complicated proportional system and needed a simplified way of implementing the quota system.
A-3

Figure A.3: Polity Scores for China between 1890 and 2000
Notes: This figure reports the polity scores of China between 1890 and 2000, based on the information from Polity IV.
The range of the score is between -10 and 10.
Figure A.4: The Monthly Impacts of Quotas per capita in 1905
Notes: This figure plots the impact of logged quotas per capita on the participation in the Revolution Alliance in 1905
and shows no pre-trends before September.
A-4

Figure A.5: Revolution Participation Over Time
Notes: This figure plots the mean of revolutionary probability in the prefecture-level data between 1990 and 1906 and
in the county-level data between 1894 and 1906.
Figure A.6: Revolutionaries and the 1911 Revolution
Notes: This map shows that the origins of revolutionaries are correlated with the incidence of uprisings in 1911.
A-5

Figure A.7: Age Distribution of the Revolutionaries in the Chinese Revolution Alliance
Notes: This figure plots the age distribution of the revolutionaries in the Chinese Revolution Alliance.
A-6

Figure A.8: Rivers and County Seats
Notes: This map shows that county seats (indicated by the dots) are generally located on rivers. The bold rivers
indicate the major ones (those ranked as the first and second order streams in the Chinese river hierarchy).
A-7

Table A.1: Revolutionary Groups between 1900 and 1906
Revolutionary Group Year of Estab. Origin
(i) Xingzhonghui 1894 Honolulu(the Revive China Society)(ii) Junguomin Jiaoyuhui 1903 Japan(the Society of National Military Education)(iii) Huaxinghui 1903 Changsha, Hunan(the China Arise Society)(iv) Guangfuhui 1904 Shanghai(the Revive the Light Society(v) Tongmenghui 1905 Alliance between (i) and (iii)(the Chinese Revolutionary Alliance)(vi) Rizhihui 1905-06 Wuhan, Hubei(the Society for Daily Improvement)
Notes: The table lists the information on the six major revolutionary groups between 1900 and 1906. The data source
is Chang (1982).
A-8
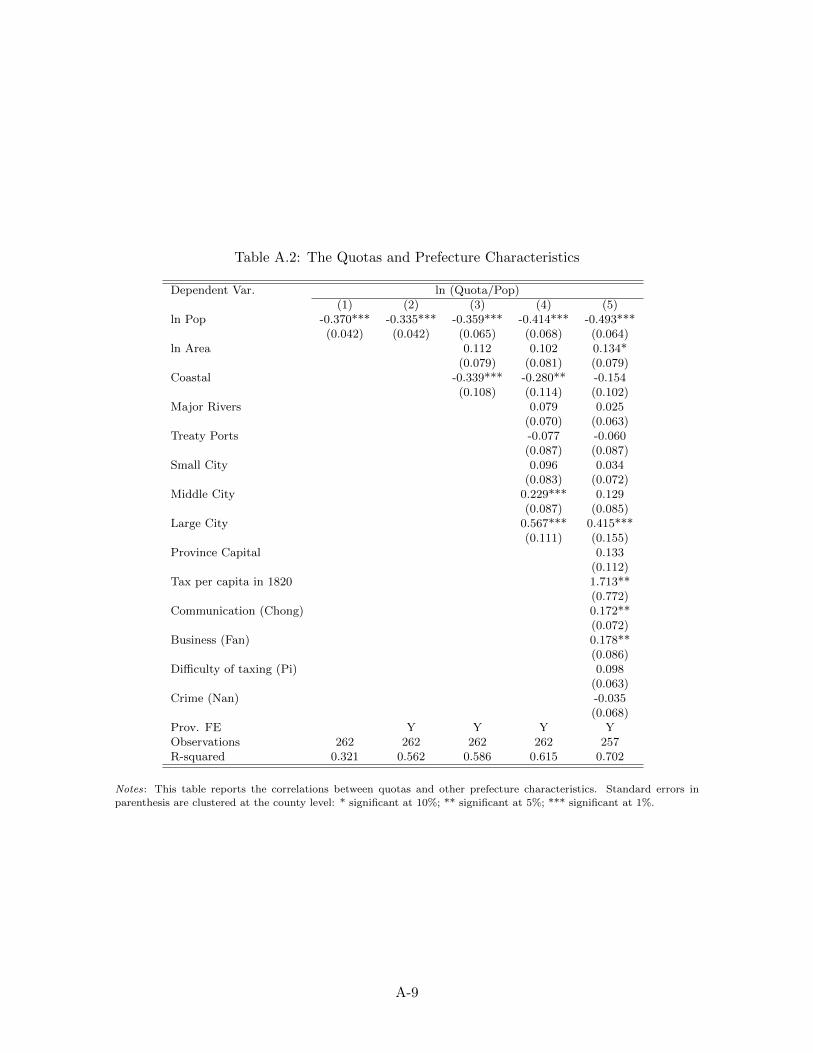
Table A.2: The Quotas and Prefecture Characteristics
Dependent Var. ln (Quota/Pop)(1) (2) (3) (4) (5)
ln Pop -0.370*** -0.335*** -0.359*** -0.414*** -0.493***(0.042) (0.042) (0.065) (0.068) (0.064)
ln Area 0.112 0.102 0.134*(0.079) (0.081) (0.079)
Coastal -0.339*** -0.280** -0.154(0.108) (0.114) (0.102)
Major Rivers 0.079 0.025(0.070) (0.063)
Treaty Ports -0.077 -0.060(0.087) (0.087)
Small City 0.096 0.034(0.083) (0.072)
Middle City 0.229*** 0.129(0.087) (0.085)
Large City 0.567*** 0.415***(0.111) (0.155)
Province Capital 0.133(0.112)
Tax per capita in 1820 1.713**(0.772)
Communication (Chong) 0.172**(0.072)
Business (Fan) 0.178**(0.086)
Difficulty of taxing (Pi) 0.098(0.063)
Crime (Nan) -0.035(0.068)
Prov. FE Y Y Y YObservations 262 262 262 262 257R-squared 0.321 0.562 0.586 0.615 0.702
Notes: This table reports the correlations between quotas and other prefecture characteristics. Standard errors in
parenthesis are clustered at the county level: * significant at 10%; ** significant at 5%; *** significant at 1%.
A-9
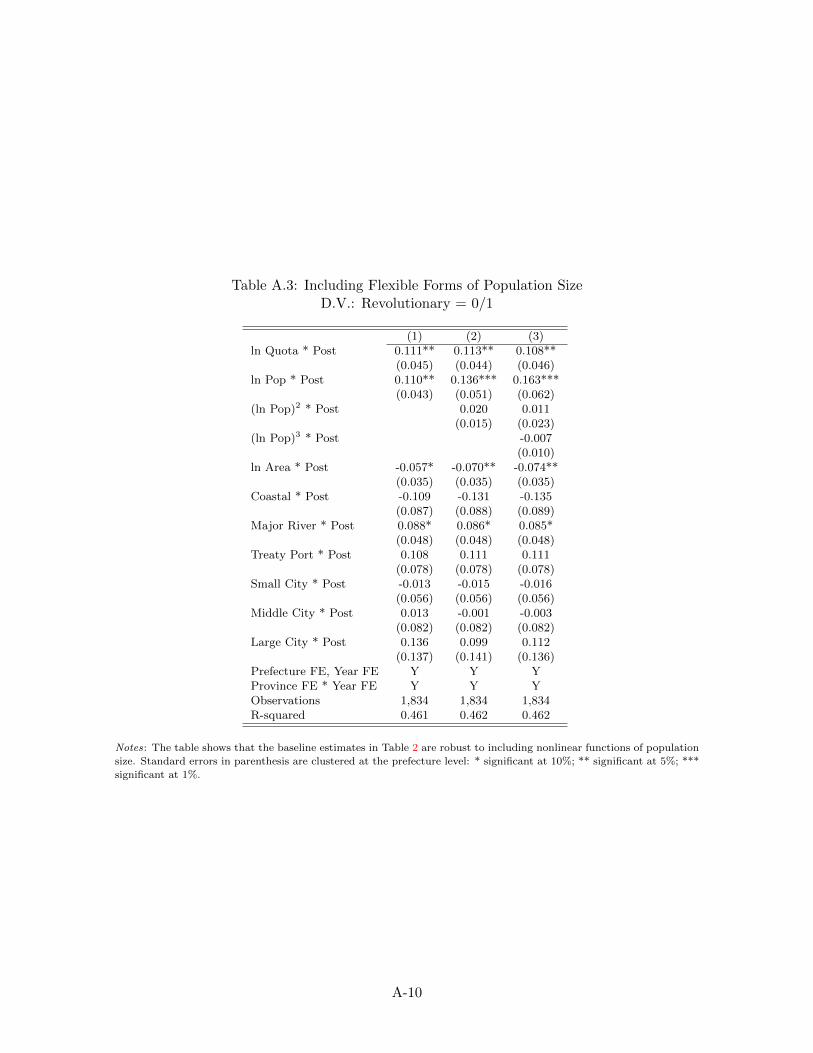
Table A.3: Including Flexible Forms of Population SizeD.V.: Revolutionary = 0/1
(1) (2) (3)ln Quota * Post 0.111** 0.113** 0.108**
(0.045) (0.044) (0.046)ln Pop * Post 0.110** 0.136*** 0.163***
(0.043) (0.051) (0.062)(ln Pop)2 * Post 0.020 0.011
(0.015) (0.023)(ln Pop)3 * Post -0.007
(0.010)ln Area * Post -0.057* -0.070** -0.074**
(0.035) (0.035) (0.035)Coastal * Post -0.109 -0.131 -0.135
(0.087) (0.088) (0.089)Major River * Post 0.088* 0.086* 0.085*
(0.048) (0.048) (0.048)Treaty Port * Post 0.108 0.111 0.111
(0.078) (0.078) (0.078)Small City * Post -0.013 -0.015 -0.016
(0.056) (0.056) (0.056)Middle City * Post 0.013 -0.001 -0.003
(0.082) (0.082) (0.082)Large City * Post 0.136 0.099 0.112
(0.137) (0.141) (0.136)Prefecture FE, Year FE Y Y YProvince FE * Year FE Y Y YObservations 1,834 1,834 1,834R-squared 0.461 0.462 0.462
Notes: The table shows that the baseline estimates in Table 2 are robust to including nonlinear functions of population
size. Standard errors in parenthesis are clustered at the prefecture level: * significant at 10%; ** significant at 5%; ***
significant at 1%.
A-10
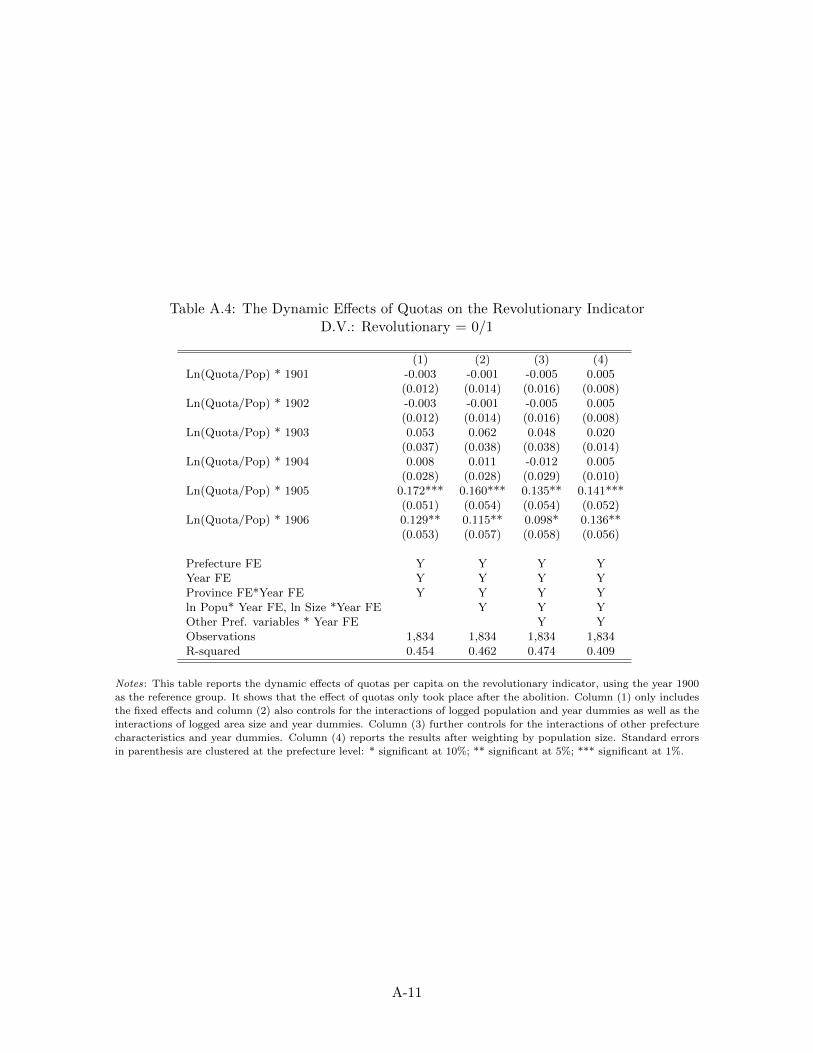
Table A.4: The Dynamic Effects of Quotas on the Revolutionary IndicatorD.V.: Revolutionary = 0/1
(1) (2) (3) (4)Ln(Quota/Pop) * 1901 -0.003 -0.001 -0.005 0.005
(0.012) (0.014) (0.016) (0.008)Ln(Quota/Pop) * 1902 -0.003 -0.001 -0.005 0.005
(0.012) (0.014) (0.016) (0.008)Ln(Quota/Pop) * 1903 0.053 0.062 0.048 0.020
(0.037) (0.038) (0.038) (0.014)Ln(Quota/Pop) * 1904 0.008 0.011 -0.012 0.005
(0.028) (0.028) (0.029) (0.010)Ln(Quota/Pop) * 1905 0.172*** 0.160*** 0.135** 0.141***
(0.051) (0.054) (0.054) (0.052)Ln(Quota/Pop) * 1906 0.129** 0.115** 0.098* 0.136**
(0.053) (0.057) (0.058) (0.056)
Prefecture FE Y Y Y YYear FE Y Y Y YProvince FE*Year FE Y Y Y Yln Popu* Year FE, ln Size *Year FE Y Y YOther Pref. variables * Year FE Y YObservations 1,834 1,834 1,834 1,834R-squared 0.454 0.462 0.474 0.409
Notes: This table reports the dynamic effects of quotas per capita on the revolutionary indicator, using the year 1900
as the reference group. It shows that the effect of quotas only took place after the abolition. Column (1) only includes
the fixed effects and column (2) also controls for the interactions of logged population and year dummies as well as the
interactions of logged area size and year dummies. Column (3) further controls for the interactions of other prefecture
characteristics and year dummies. Column (4) reports the results after weighting by population size. Standard errors
in parenthesis are clustered at the prefecture level: * significant at 10%; ** significant at 5%; *** significant at 1%.
A-11

Table A.5: The Impact of Quotas: Monthly Data
(1) (2) (3) (4) (5)Weighted
ln(Quota/Pop) * Post 0.062** 0.057** 0.065** 0.061** 0.053**(0.026) (0.027) (0.027) (0.028) (0.025)
ln Pop * Post 0.040** 0.024 0.029 0.042** 0.039**(0.016) (0.019) (0.019) (0.020) (0.015)
ln Area * Post 0.031 0.036 0.029 -0.003(0.023) (0.023) (0.024) (0.012)
Major River * Post -0.050* -0.050* -0.023(0.030) (0.030) (0.020)
Coastal * Postt -0.110* -0.081(0.062) (0.052)
Treaty Port * Post 0.049 -0.014(0.073) (0.058)
Small City 0.034 0.074(0.042) (0.051)
Middle City -0.103 -0.104(0.068) (0.068)
Large City 0.003 0.079(0.102) (0.098)
Prefecture FE Y Y Y Y YYear FE Y Y Y Y YProvince FE*Year FE Y Y Y Y YObservations 1,572 1,572 1,572 1,572 1,572R-squared 0.149 0.150 0.151 0.158 0.097
Notes: This table reports the impact of quotas per capita on the revolutionary indicator after Sep. 1905. Standard
errors in parenthesis are clustered at the prefecture level: * significant at 10%; ** significant at 5%; *** significant at
1%.
A-12

Table A.6: Year-by-Year Impacts across Counties in GuangdongD.V.: Revolutionary = 0/1
(1) (2) (3) (4)ln (Quota/Pop) * 1894 -0.087 -0.095 -0.065 -0.059
(0.109) (0.116) (0.126) (0.091)ln (Quota/Pop) * 1895 0.028 0.051 0.080 0.099
(0.137) (0.135) (0.156) (0.155)ln (Quota/Pop) * 1896 -0.188* -0.178 -0.145 -0.127
(0.106) (0.109) (0.122) (0.086)ln (Quota/Pop) * 1897 -0.067 -0.038 0.034 -0.011
(0.121) (0.116) (0.132) (0.069)ln (Quota/Pop) * 1898 -0.188* -0.178 -0.145 -0.127
(0.106) (0.109) (0.122) (0.086)ln (Quota/Pop) * 1899 -0.138 -0.122 -0.073 -0.083
(0.108) (0.111) (0.123) (0.086)
ln (Quota/Pop) * 1901 -0.149 -0.145 -0.100 -0.114(0.124) (0.125) (0.147) (0.089)
ln (Quota/Pop) * 1902 -0.149 -0.140 -0.091 -0.089(0.111) (0.118) (0.132) (0.088)
ln (Quota/Pop) * 1903 0.153 0.167 0.201 0.079(0.108) (0.112) (0.128) (0.073)
ln (Quota/Pop) * 1904 -0.149 -0.140 -0.091 -0.089(0.111) (0.118) (0.132) (0.088)
ln (Quota/Pop) * 1905 0.224* 0.255** 0.244* 0.202*(0.116) (0.119) (0.141) (0.102)
ln (Quota/Pop) * 1906 0.175 0.191 0.262* 0.199**(0.128) (0.134) (0.146) (0.099)
Post- vs. Pre- 0.293*** 0.305*** 0.292*** 0.252***(0.074) (0.077) (0.081) (0.087)
Year FE Y Y Y YCounty FE Y Y Y YPrefecture FE * Year FE Y Y Y Yln Pop * Year FE, ln Size * Year FE Y Y YOther characteristics * Year FE Y YObservations 1,196 1,196 1,196 1,196R-squared 0.328 0.337 0.357 0.335
Notes: This table reports the dynamic effects of quotas per capita using data from 92 counties in Guangdong between
1894 and 1906, using the year of 1900 as the reference. It shows that the quotas only had an effect after the abolition.
Column (4) reports the results weighting by population sizes. Standard errors in parenthesis are clustered at the county
level: * significant at 10%; ** significant at 5%; *** significant at 1%.
A-13

Table A.7: Quotas and Party Identification
Individual-Level Prefecture-Level Prefecture-Level
KMT=0/1KMT(0/1)
Other(0/1)
Diff. #KMT #Other Diff.
(1) (2) (3) (4) (5) (6) (7) (8)ln (Quota/Pop) -0.035 -0.039 0.131** 0.200*** -0.069 0.297 0.333** -0.037
(0.048) (0.048) (0.052) (0.053) (0.072) (0.183) (0.130) (0.232)Age in 1912 -0.005*
(0.003)
All Controls Y Y Y Y YProvince FE Y Y Y Y Y YObservations 702 701 262 262 262 262R-squared 0.181 0.185 0.425 0.429 0.483 0.480
Notes: This table shows that quotas per capita did not affect party identification, although younger people tend to
join the more radical party (the Kuomintang), as shown in the individual-level analysis in columns (1)-(2). Columns
(3)-(8) report the results using prefecture-level data: quotas per capita increase the party member probability for both
the Kungmintang and the other parties but the impacts of quotas are not significantly different in terms of party
identification. Controls include (i) logged population in 1880 and logged area; (ii) whether a prefecture is located on
the coast and whether it is located on a major river; (iii) whether a prefecture has a treaty port; and (iv) whether a
prefecture was counted as a big city, a middle-size city or a small city. Standard errors in parenthesis are clustered at
the prefecture level: * significant at 10%; ** significant at 5%; *** significant at 1%.
A-14

Table A.8: Examing the Impact of International Events
(1) (2) (3) (4) (5)
ln (Quota/Pop)* Post 0.103** 0.114** 0.111** 0.119*** 0.109**(0.045) (0.045) (0.046) (0.046) (0.046)
Newspaper per capita * Post 3.275 0.688(14.433) (14.676)
Newspaper per capita * ln (Quota/Pop)* Post 0.910 3.347(13.810) (16.857)
Newspaper per capita * ln Pop* Post 0.024 4.913(16.538) (17.352)
Enclave * Post -0.169 0.047 -0.029(0.253) (0.421) (0.456)
Enclave * ln (Quota/Pop)* Post 0.045 -0.596 -0.584(0.307) (0.669) (0.716)
Enclave * ln Pop* Post 0.046 -0.401 -0.494(0.284) (0.554) (0.547)
Enclave * Post -0.173 -0.294 -0.154(0.318) (0.507) (0.496)
Japanese Enclave * ln (Quota/Pop) * Post 0.318 0.907 0.665(0.338) (0.722) (0.730)
Japanese Enclave * ln Pop* Post 0.203 0.620 0.558(0.326) (0.617) (0.538)
Prefecture FE Y Y Y Y YYear FE Y Y Y Y YProvince FE*Year FE Y Y Y Y YBaseline Controls * Post Y Y Y Y YObservations 1,834 1,834 1,834 1,834 1,834R-squared 0.462 0.462 0.461 0.464 0.468
Notes: The table shows that foreign penetration could not explain our main findings. The baseline controls include (i)
logged population in 1880 and logged area; (ii) whether a prefecture is located on the coast and whether it is located
on a major river; (iii) whether a prefecture has a treaty port; and (iv) whether a prefecture was counted as a big city,
a middle-size city or a small city. Standard errors in parenthesis are clustered at the prefecture level: * significant at
10%; ** significant at 5%; *** significant at 1%.
A-15

Table A.9: Robustness Checks of Using Small RiversD.V.: Revolutionary = 0/1
Small Rivers ≤70 KM ≤80 KM ≤90 KM ≤100 KM ≤110 KM ≤120 KM(1) (2) (3) (4) (5) (6)
ln (Quota/Pop) * Post 0.392** 0.383** 0.376** 0.374** 0.399** 0.394*(0.166) (0.167) (0.175) (0.176) (0.195) (0.205)
# Rivers (>70 km)/River L * Post -0.077(0.077)
# Rivers (>80 km) /River L * Post -0.034(0.097)
# Rivers (>90 km) /River L * Post -0.062(0.122)
# Rivers (>100 km) /River L * Post -0.056(0.116)
# Rivers (>110 km) /River L * Post 0.052(0.137)
# Rivers (>120 km) /River L * Post 0.031(0.157)
Baseline Controls * Post Y Y Y Y Y Yln (River Length) * Post Y Y Y Y Y YMajor river * Post Y Y Y Y Y YPrefecture FE Y Y Y Y Y YYear FE Y Y Y Y Y YProvince FE*Year FE Y Y Y Y Y YObservations 1,834 1,834 1,834 1,834 1,834 1,834R-squared 0.431 0.433 0.434 0.434 0.429 0.430
Notes: This table shows that the results using the number of smaller rivers as an instrument are robust to variationsin defining smaller rivers. The baseline controls include (i) logged population in 1880 and logged area; (ii) whether aprefecture is located on the coast and whether it is located on a major river; (iii) whether a prefecture has a treatyport; and (iv) whether a prefecture was counted as a big city, a middle-size city or a small city. Standard errors inparenthesis are clustered at the prefecture level: * significant at 10%; ** significant at 5%; *** significant at 1%.
A-16