eliminating os-caused large jvm pauses for latency-sensitive java-based cloud platforms
TRANSCRIPT

Eliminating OS-caused Large JVM Pauses
for Latency-sensitive Java-based Cloud Platforms
Zhenyun Zhuang, Cuong Tran, Haricharan Ramachandra, Badri Sridharan
{zzhuang, ctran, hramachandra, bsridharan}@linkedin.com
LinkedIn Corporation, 2029 Stierlin Court Mountain View, CA 94043 United States
Abstract—For PaaS-deployed (Platform as a Service)customer-facing applications (e.g., online gaming and onlinechatting), ensuring low latencies is not just a preferred feature,but a must-have feature. Given the popularity and powerful-ness of Java platforms, a significant portion of today’s PaaSplatforms run Java. JVM (Java Virtual Machine) manages aheap space to hold application objects. The heap space can befrequently GC-ed (Garbage Collected), and applications can beoccasionally stopped for long time during some GC and JVMactivities.
In this work, we investigated the JVM pause problem.We found out that there are some (and large) JVM STWpauses cannot be explained by application-level activities andJVM activities during GC; instead, they are caused by OSmechanisms. We successfully reproduced such problems androot-cause-ed the reasons. The findings can be used to enhanceJVM implementation. We also proposed a set of solutions tomitigate and eliminate these large STW pauses. We share theknowledge and experiences in this writing.
Keywords-PaaS; Java; JVM; Performance; Cloud platform
I. INTRODUCTION
PaaS (Platform as a Service) cloud platform [1], where
customer applications are deployed to platform servers
that reside in the “cloud”, promises a cost-effective and
adminstration-efficient solution to the traditional needs of
deploying applications. Many of the PaaS-deployed appli-
cations are customer-facing (e.g., online gaming and online
chatting), thus ensuring low latencies is not just a preferred
feature, but a must-have feature for these applications.
Various studies have suggested that 200ms latency is the
maximum latency an online user can tolerate before going
away. Because of this, ensuring lower-than-200ms (or even
smaller) latency should be part of the defined SLA (Service
Leve Agreements) for applications serving online users.Given the popularity and powerfulness of Java platforms,
a significant portion of today’s PaaS platforms run Java.
One example is Oracle Java Cloud [2], which provides
cloud-deployed Java applications using WebLogic Server
[3]. Despite tremendous efforts put at various layers (e.g.,
application layer, JVM layer) to improve the performance
of Java applications, based on our production experiences,
Java applications can occasionally experience unexplainable
large STW (Stop-The-World) JVM pauses that cannot be
explained by typical known reasons at application layer.Java-based applications run in JVM (Java Virtual Ma-
chine), which manages a heap space to hold application
objects. The heap space can be frequently GC-ed (Garbage
Collected), and JVM could be stopped during GC and
JVM activities (e.g., Young or Full GC), which introduce
STW (Stop-The-World) pauses to the applications. De-
pending on JVM options supplied when starting the JVM
instance, various types of GC and JVM activities are logged
into GC log files. Though GC-induced STW pauses that
scan/mark/compact heap objects are well-known and paid
much attention to, as we find out, there are some (and large)
STW pauses could be caused by OS (Operating System)
mechanisms. In our production environments, we have been
seeing OS-caused large STW pauses (>11 seconds) hap-
pened to our mission-critical Java applications. Such pauses
cannot be explained by application-level activities and the
garbage collection activities during GC.
For latency-sensitive and mission-critical Java applica-
tions, the larger-than-SLA STW pauses are intolerable.
Hence we spent efforts investigating the problem. We suc-
cessfully reproduced the problem in lab environments and
root caused the reasons. The large STW pauses are caused by
GC logging write() calls being blocked. These write() calls,
though are issued in buffered write mode (i.e., non-blocking
IO), can still be blocked due to certain OS internal mecha-
nisms related to “writeback” [4] IO activities. Specifically,
when buffered write() needs to write to a file, it firstly writes
to memory pages in OS cache. These memory pages can
be locked by OS cache-flushing mechanism of “writeback”,
which could last for substantially long time when IO traffic is
heavy. Furthermore, for typical production applications, the
application-level logging (e.g., access logs) and log rotations
also prove to be sources of background IO traffic.
We proposed solutions to mitigate the large STW pauses.
These solutions span in different layers including enhancing
JVM, reducing background IO traffic, improving application
IO, and separating GC logging from other IO. Depending
scenarios, these solutions can be applied separately or in
tandem.
In this work, we share our findings. For the remainder of
the paper, after providing necessary technical background in
section II, we present the production issue and investigations
in Section III. Based on the findings, we propose the
solutions in Section IV. We perform performance evaluation
and show the results in Section V. Section VI gives related
works. And finally Section VII concludes the work.

2016-01-14T22:08:28.028+0000: 312052.604: [GC (Allocation Failure) 312064.042: [ParNew
Desired survivor size 1998848 bytes, new threshold 15 (max 15)
- age 1: 1678056 bytes, 1678056 total
: 508096K->3782K(508096K), 0.0142796 secs] 1336653K->835675K(4190400K), 11.4521443 secs]
[Times: user=0.18 sys=0.01, real=11.45 secs]
2016-01-14T22:08:39.481+0000: 312064.058: Total time for which application threads were stopped: 11.4566012 seconds
Figure 1. A large STW pause (11.45 seconds) that is not caused by the application itself
II. BACKGROUND
A. JVM and heap management
A JVM (Java Virtual Machine) is a virtual environment
to run Java applications. JVM has well defined specification
that can be implemented by different vendors, with the
most widely adopted JVM being Oracle’s HotSpot. JVM
implementations typically feature a set of optimizations
aimed at running the program faster. The memory space that
host application objects is the heap. JVM enables automatic
memory management for Java applications by providing
garbage collection on heap space.Depending on specific garbage collectors, JVM may
scan/mark/remark/compact objects to free heap space for
later usage during garbage collection. These actions may
incur STW pauses to the applications, and during the pauses
the application has to stop processing. Based on JVM
options provided during command line instance starting,
various GC statistics can be recorded into a gc log file.
B. File System and asynchronous IO
Many types of file systems have been designed to support
various types of media and different scenarios. A special file
system is tmpfs, which uses RAM to create temporary file
systems for short-term use. To deal with the potential incon-
sistency during system crush, journal file systems introduce
transaction-level consistency to file system structures. Many
popular file systems such as EXT4 [5] fall into this category.
To write to file systems, system calls such as write()
are provided. Writing can operate in asynchronous mode
(i.e., non-blocking, or buffered) or synchronous mode (i.e.,
blocking). In typical scenarios, asynchronous writing will
modify the data in memory first and the write() call returns
before the data are persisted into disk.
C. OS page cache and cache writeback
Page cache is provided by OS to expedite the data access
for slower (than RAM) disk drives. OS keeps a portion of
the RAM for caching the file data. Modified page cache will
be periodically written to disk files for persistence. There
are several mechanisms controlling how soon a particular
“dirty” (i.e., containing newer-than-disk data) page needs to
be written back. When writing happens, it appears to the
users that there is bursty IO happening to disks.
D. Application logging and log rotation
Server applications oftentimes need to log its activities
(e.g., received queries, sent responses). A typical example
is a web server which maintains a history of page requests.
Logging frameworks such as Apache log4j [6] are adopted
to facilitate and format the application logging.
In many non-trivial deployment scenarios such as business
environments, log rotation is required to automate the pro-
cess of archiving application logs. Many logging practices
are used, and the typical process is to periodically read
some dated log files, process them, compress the raw files
or relocate them. Whenever the rotation kicks off, a set of
log files accumulated during last rotation period are read,
processed and compressed.
III. PRODUCTION ISSUE AND INVESTIGATIONS
Let’s start with a real production issue we experienced
at LinkedIn. The production issue is about very large JVM
STW pauses, which we can easily reproduce in lab environ-
ments using custom-built Java workload and background IO
traffic. Since the applications are latency sensitive, we spent
efforts investigating the problem.
A. Production issue
The Java heap space which JVM manages is GC-ed when
the heap is almost full. JVM could be stopped during certain
GC and JVM activities (e.g., Young or Full GC), which
introduce STW pauses to the applications. Depending on
JVM options supplied when starting the Java applications,
various types of GC and JVM activities are logged into GC
log files.
In our production environments, we have been seeing
unexplainable large STW pauses (>5 seconds) happened
to our mission-critical Java applications. Such STW pauses
cannot be explained by application-level activities and the
garbage collection activities during GC. In Figure 1 we show
a large STW pause of more than 11 seconds and some
GC information. With a mere 4GB heap size, the garbage
collection typically takes sub-second to complete, and the
simple GC log options incurs little overhead, however the
application threads stopped for more than 11 seconds. The
user and sys time are both negligible, hence the amount of
work done by GC (e.g., collected heap size) is not able to
explain the large pause value.
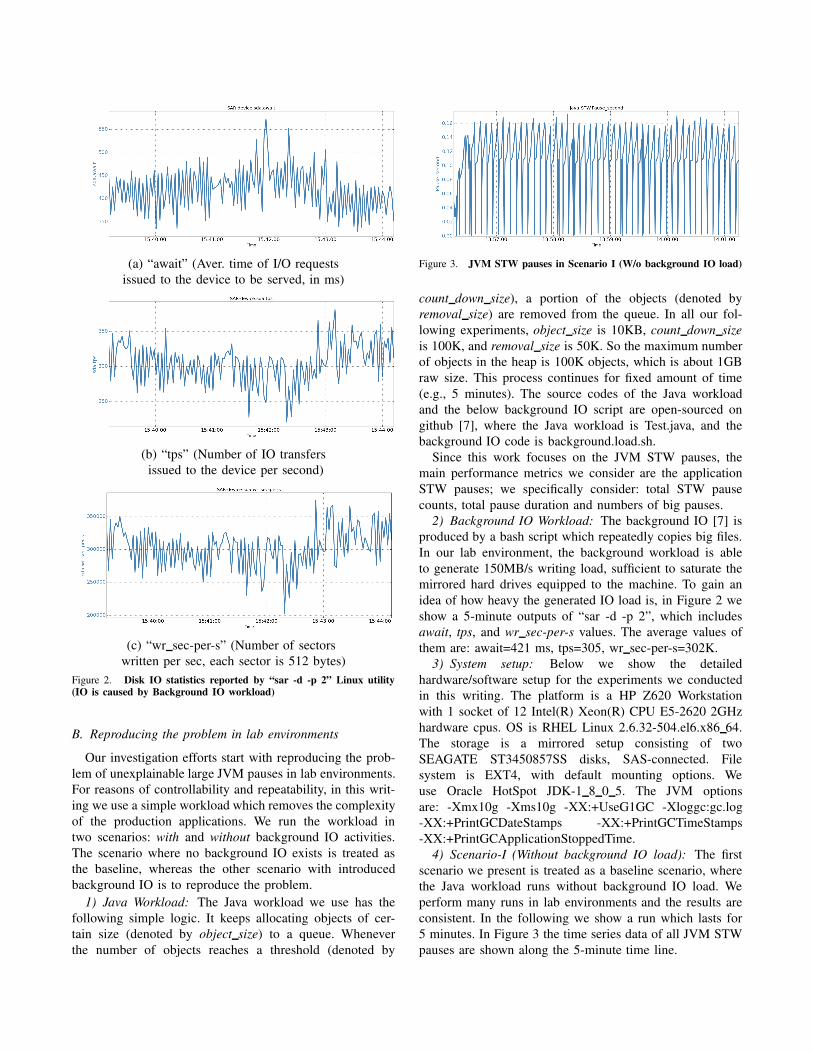
(a) “await” (Aver. time of I/O requests
issued to the device to be served, in ms)
(b) “tps” (Number of IO transfers
issued to the device per second)
(c) “wr sec-per-s” (Number of sectors
written per sec, each sector is 512 bytes)
Figure 2. Disk IO statistics reported by “sar -d -p 2” Linux utility
(IO is caused by Background IO workload)
B. Reproducing the problem in lab environments
Our investigation efforts start with reproducing the prob-
lem of unexplainable large JVM pauses in lab environments.
For reasons of controllability and repeatability, in this writ-
ing we use a simple workload which removes the complexity
of the production applications. We run the workload in
two scenarios: with and without background IO activities.
The scenario where no background IO exists is treated as
the baseline, whereas the other scenario with introduced
background IO is to reproduce the problem.
1) Java Workload: The Java workload we use has the
following simple logic. It keeps allocating objects of cer-
tain size (denoted by object size) to a queue. Whenever
the number of objects reaches a threshold (denoted by
Figure 3. JVM STW pauses in Scenario I (W/o background IO load)
count down size), a portion of the objects (denoted by
removal size) are removed from the queue. In all our fol-
lowing experiments, object size is 10KB, count down size
is 100K, and removal size is 50K. So the maximum number
of objects in the heap is 100K objects, which is about 1GB
raw size. This process continues for fixed amount of time
(e.g., 5 minutes). The source codes of the Java workload
and the below background IO script are open-sourced on
github [7], where the Java workload is Test.java, and the
background IO code is background.load.sh.
Since this work focuses on the JVM STW pauses, the
main performance metrics we consider are the application
STW pauses; we specifically consider: total STW pause
counts, total pause duration and numbers of big pauses.
2) Background IO Workload: The background IO [7] is
produced by a bash script which repeatedly copies big files.
In our lab environment, the background workload is able
to generate 150MB/s writing load, sufficient to saturate the
mirrored hard drives equipped to the machine. To gain an
idea of how heavy the generated IO load is, in Figure 2 we
show a 5-minute outputs of “sar -d -p 2”, which includes
await, tps, and wr sec-per-s values. The average values of
them are: await=421 ms, tps=305, wr sec-per-s=302K.
3) System setup: Below we show the detailed
hardware/software setup for the experiments we conducted
in this writing. The platform is a HP Z620 Workstation
with 1 socket of 12 Intel(R) Xeon(R) CPU E5-2620 2GHz
hardware cpus. OS is RHEL Linux 2.6.32-504.el6.x86 64.
The storage is a mirrored setup consisting of two
SEAGATE ST3450857SS disks, SAS-connected. File
system is EXT4, with default mounting options. We
use Oracle HotSpot JDK-1 8 0 5. The JVM options
are: -Xmx10g -Xms10g -XX:+UseG1GC -Xloggc:gc.log
-XX:+PrintGCDateStamps -XX:+PrintGCTimeStamps
-XX:+PrintGCApplicationStoppedTime.
4) Scenario-I (Without background IO load): The first
scenario we present is treated as a baseline scenario, where
the Java workload runs without background IO load. We
perform many runs in lab environments and the results are
consistent. In the following we show a run which lasts for
5 minutes. In Figure 3 the time series data of all JVM STW
pauses are shown along the 5-minute time line.

Figure 4. JVM STW pauses in Scenario II (With background IO load)
We also consider the following statistics values about
STW pauses for the 5-minute run: (1) Total pause duration,
i.e., the aggregated pause time for all STW pauses; and (2)
Counts of large STW pauses (i.e., more than 2/1/0.5/0.25
seconds). We observe that all pauses are very minor, and no
STW pause exceeds 0.25 second. The total STW pauses is
about 32.8 seconds.
5) Scenario-II (With background IO load): The second
scenario is running the same Java workload with the back-
ground IO load, which represents a production environment
where there are significant IO load generated. The IO load
can come from the OS, other applications on the same
node, or the IO activities by the same Java application that
experiences the large JVM STW pauses. In Figure 4 the
time series data of all JVM STW pauses are shown along
the 5-minute time line.
When the background IO runs, the same Java workload
has seen 1 STW pause exceeding 3.6 second, and 3 pauses
exceeding 0.5 seconds during a mere 5-minute run! As a
result, the total STW pause time is 36.8 seconds, 12% more
than Scenario-I. These results are shown in Table I.
C. Investigations
After ruling out all other possible reasons, our investiga-
tions turned to JVM internals. Since JVM works by invoking
system calls [8] just like other applications, we tried to
understand what system calls that cause the STW pauses.
We used strace [9], a tool for tracing system calls, to profile
the Java workload. We found that several write() system calls
have unusually large execution time.
Examining the time stamps of the system calls and the
JVM pauses, we found that they correlate well. In Figure 5,
we plot the time series of the two latencies. Such apparent
correlations suggest that the large STW pauses are caused
by the large write() call latencies.
Table ISTATISTICS OF JVM STW PAUSES FOR 5-MINUTE RUN IN SCENARIO II
Metric Total pause >2s >1s >0.5s >0.25s
Value 36.8 (second) 1 1 3 4
(a) JVM STW pauses
(b) Strace-reported write() system call latencies
Figure 5. Time series correlation between JVM STW pauses andwrite() system call latencies reported by strace utility
Though JVM GC logging uses buffered writes, the cor-
relations between GC pauses and write() latencies suggest
that the buffered writes of GC logging are still blocked due
to some reasons. We examined the two time series data
carefully, in Figure 6 we show one snapshot of a large
JVM STW pause of 1.59 seconds. Let’s explain the data.
At time 35.04 (line 1), 1 a young GC starts and takes 0.12
seconds to complete. The young GC finishes at time 35.17
and JVM tries to output the young GC statistics to gc log
file by issuing a write() system call (line 4). The write() call
is blocked for 1.47 seconds and finally finishes at time 36.64
(line 5), taking 1.47 seconds. When write() call returns at
36.64 to JVM, JVM records this STW pause of 1.59 seconds
(i.e., 0.12 + 1.47) (line 3). In other words, the actual STW
pause time consists of two parts: (1) GC time (e.g., young
GC) and (2) GC logging time (e.g., write() time).
These data suggest that GC logging process is on the
JVM’s STW pause path, and the time taken for logging
is part of STW pause. If the logging (i.e., write() calls) is
blocked, the blocking time contributes to the STW pause.
The new question is why buffered writes are blocked?
Digging into various resources including the kernel source
code, we realize that buffered writes could be stuck in kernel
code. There are multiple reasons including: (1) stable page
write; and (2) journal committing.
Stable page write: JVM writing to GC log files firstly
dirties the corresponding file cache pages. Even though
1For consistency, we use Linux system time (as opposed to JVM time);and for simplicity, we limit the time stamp to 2 decimal digits.

gc.log:
1 2015-12-21T13:32:33.736-0800: 86.268: Total time for which application threads were stopped: 0.1714770 seconds
2 2015-12-21T13:32:35.047-0800: 87.578: [GC pause (G1 Evacuation Pause) (young) 7814M->4114M(10G), 0.1227713 secs]
3 2015-12-21T13:32:36.641-0800: 89.172: Total time for which application threads were stopped: 1.5946271 seconds
strace output:
4 [pid 11797] 13:32:35.169922 write(3, ”2015-12-21T13:32:33.736-0800: 86”..., 224 <unfinished ...>
5 [pid 11797] 13:32:36.640856 <... write resumed> ) = 224 <1.470906>
Figure 6. Correlating gc log and strace output for a large JVM STW pause
the cache pages are later persisted to disk files via OS’s
writeback mechanism, dirtying the cache pages in memory is
still subject to page contention caused by stable page write.
With stable page write, if a page is under OS writeback,
write() to this page has to wait for the writeback completion.
This is to ensure data consistency by avoiding partially fresh
page being persisted to disk.
Journal committing: For journaling file system, appro-
priate journals are generated during file writing. When
appending to the gc log file results in new blocks being
allocated, file system needs to commit the journal data to
disk first. During journal committing, if the OS has other
IO activities, the commitment might need to wait. If the
background IO activities are heavy, the waiting time can be
noticeably long. Note that EXT4 file system has a feature of
delayed allocation which postpones certain journal data to
OS writeback time, which alleviates this problem. Note also
that changing EXT4’s data mode from the default default
“ordered” mode to “writeback” does not really address this
cause, as the journal needs to be persisted before write-to-
extend write() call returns.
D. Background IO activities
From the standpoint of a particular JVM garbage col-
lection, background IO activities are inevitable in typi-
cal production environments. There are several sources of
such IO activities: (1) OS activity; (2) administration and
housekeeping software; (3) other co-located applications;
(4) IO of the same JVM instance. First, OS contains many
mechanisms (e.g., “/proc” file system [10]) that incur data
writing to underlying disks.
Enterprise machines oftentimes feature softwares that
facilitate administrations. For instance, machines with
CFEngine [11] installed needs to periodically download
configuration files from other nodes, and the configuration
files are persisted to local disks. Depending on software
type and the scale, these administration software may incur
significant (and bursty) IO loads.
Oftentimes an enterprise node may have other co-located
applications that also incur disk IO. These co-located ap-
plications may or may not be identical JVM instances. Co-
locating applications can help achieve better business cost
efficiency by sharing the same computing resources (e.g.,
hardware).
Finally, the particular Java application may have other
types of logging (e.g., access logs as commonly seen in web
servers) and log rotations (e.g., compressing log files and
relocate them). Depending on application type and traffic
volume, the IO traffic incurred can be quite heavy, as we
observed with our products.
IV. SOLUTION
We have seen that due to OS mechanisms (i.e., page cache
writeback, journaling file system), JVM could be blocked
for large periods during GC logging due to the internal page
contention with other IO activities. Despite the dominance of
HotSpot JVM adoption, we expect this problem should also
occur to other JVM implementations that log information to
files 2. For instance, we observe the same issue happened to
OpenJDK [12].
There are various approaches that can help mitigate this
problem. In the following we list 4 types of possible
approaches: (1) Enhancing JVM; (2) Reducing background
IO; (3) Improving application IO; (4) Separating GC logging
from other IO; These approaches differ in the degree of
effectiveness and the amount of adoption effort. The three
approaches of enhancing JVM, separating GC logging from
other IO, and reducing background IO are application-
transparent, meaning no application change is needed. The
only approach that requires application change is the ap-
proach of improving application IO.
A. Enhancing JVM
Firstly, the JVM implementation could be enhanced to
completely address this issue. Particularly, if the GC logging
activities are separated from the critical JVM GC processes
that cause STW pauses, then the corresponding problem
which is caused by GC logging blocking will go away. For
instance, JVM can put the GC logging into a different thread
which handles the log file writing independently, hence not
contributing to the STW pauses. Taking the separate-thread
approach however risks losing last GC log information
during JVM crash. It might make sense to expose a JVM
flag allowing users to specify their preference.
Though a JVM-side enhancement is a clean and preferred
solution, it is in the hands of the JDK provider (e.g., Oracle)
2Based on incomplete information, there are 80+ JVM implementationsalready.

and out of most users’ (e.g., LinkedIn) control. Hence we
present this only as a reference point and will propose this
to JDK provider as an offline effort, which is beyond the
scope of this work.
B. Reducing background IO
Since the extent of STW pauses caused by background
IO depends on how heavy the background IO is, various
ways to reduce the background IO intensity can be applied.
Specifically, if the IO coming from administration house-
keeping software is heavy, we can move to less IO-intensive
software. Also, de-allocating other IO-intensive applications
on the same node will certainly reduce the background IO.
C. Improving application IO
For the particular JVM instance that suffers from large
STW pauses, we should try to reduce the intensity of other
types of logging. One particular IO reduction about this
is improving on the log rotation. Enterprise applications
that serve external requests (e.g., frontend users or backend
service requests) normally have a log rotation mechanism to
persist the service access logs. The straightforward and pop-
ular logging rotation mechanism simply keeps outputing raw
access logs, and another process periodically compresses the
raw logs files. This mechanism could incur heavy and bursty
IO writing (i.e., one for continuous raw log writing, the other
for bursty compressed log writing).
To reduce the amount IO incurred in the straightforward
log rotation process, we propose a “compressed-logging”
approach, which only logs “compressed” access logs. With
this approach, in stead of writing both raw and compressed
files to disk as in the previous approach, it only writes the
compressed logs. Since the raw access logs typically can
result in very high compression ratio (e.g., 20X 3), the write
IO saving is huge. In addition, because the output log files
are already compressed, the compression part of log rotation
is no longer needed. A less obvious benefit is the saving on
the reading of raw logs during log rotation.
In some production environments, the raw logs are also
used by other processes (e.g., log mining), compressed-
logging may violate the existing workflow. Addressing this
problem is rather simple - it is not hard to modify the
other workflows to adapt to compressed-logging (e.g., by
reading/de-coding the compressed logs).
D. Separating GC logging from other IO
For latency-sensitive applications such as online ones
servicing interactive users, large STW pauses (e.g., >250ms)
typically are intolerable. Based on our experiences, ensuring
< 200ms pauses is a mandatory for these applications.
To avoid large latency STW pauses induced by OS,
various methods can be applied, and the bottom line is
3We have tried many raw logs, and a typical 1GB log can be compressedto only dozens of MBs.
Figure 7. JVM pauses when GC logging to SSD (With b/g IO load)
to avoid gc logging being blocked by OS IO activities. A
straightforward approach is to put gc log file on another
file system which is different from other OS IO activities.
One example file system is tmpfs [13], a memory-based file
system. Tmpfs has the advantage of very low writing latency
since it does not incur actual disk writing. By putting the
JVM GC log file on tmpfs (i.e., -Xloggc:/tmpfs/gc.log), JVM
logging will not blocked by other IO that write to disk files.
There is a persistency problem with tmpfs-based ap-
proach, however. Since tmpfs does not have backup disk,
during system crush the GC log file will be lost. A remedy
to this is to periodically backup the log file to persistent
storage to reduce the amount of the loss.
Another approach is to put gc log file on faster disks such
as SSD (Solid State Disks) [14], which typically has much
better IO performance in terms of writing latency and tps
(transactions per second). Depending on the IO load, SSD
can be adopted as a dedicated drive for gc logging, or shared
with other IO loads.
The disadvantage of SSD-approach is the higher cost
associated with SSD when compared to its HDD counterpart.
Cost-wise, rather than using SSD, a more cost-effective
approach is to put gc log file on a dedicated HDD. With
only the IO activity being the gc logging, the dedicated HDD
should be able to meet the low-pause JVM performance
goal. In fact, the Scenario-I we show in Section III can
mimic such a setup, since in that setup no other IO activities
exist on the gc-logging drive.
V. EVALUATION
For the four types of approaches we proposed, the first
approach of enhancing JVM cannot be evaluated at this time.
The second approach is self-explanatory, that is, if there is
no (or less) background IO, then the type of STW pauses we
consider in this work will disappear (or become less severe).
Hence, in this work, we focus on evaluating the other two
approaches of: (1) Separating GC logging from other IO;
and (2) Improving application IO.
All the performance runs we conducted in this section
use the same lab environment as we described in Section III
unless explicitly mentioned otherwise.

(a) JVM STW pauses
(b) Sar-reported disk IO “await”
Figure 8. Time series correlation between JVM STW pauses and diskIO latency reported by sar utility (raw logging and log rotation)
A. Separating GC logging from other IO
We evaluate this approach by putting the gc log file on
a SSD file system. We run the same Java workload and the
background IO load as in Scenario-II of Section III. All
STW pauses and the time stamps are shown in Figure 7 for
the 5-minute run.
For the statistics of the pauses, we notice that the JVM
pausing performance are on-par with the Scenario-I of Sec-
tion III, and all pauses are under 0.25 seconds (as opposed
to the large pauses of 3.6 second seen in Scenario-II).
The performance numbers are huge improvements, which
indicate the background IO load does not cause large STW
pauses to the JVM instance.
B. Improving application IO
To evaluate the approach of improving application IO, we
introduce application logging to the Java workload. The raw
logging rate is 40MB per second, and no other background
IO is introduced.
The raw logging uses asynchronous writing, and the actual
writing to disk is governed by OS’s writeback mechanism.
The OS we use sets the writeback period to 5 seconds (i.e,
vm.dirty writeback centisecs=500), so every 5 seconds, the
dirty pages corresponding to the log files will be flushed to
disk. The log rotation process uses gzip utility to compress
the raw logs, and the process is kicked off every 30 seconds
(i.e., each kickoff compresses about 1.2GB of raw log data).
We now evaluate the proposed compressed-logging ap-
proach. We start with the default scenario where raw log
(b) JJVM STW pauses
(b) Sar-reported disk IO “await”
Figure 9. Time series correlation between JVM STW pauses and diskIO request latency reported by sar utility (Compressed-logging)
files are written and traditional log rotation is invoked. The
time series of JVM STW pauses and sar-reported disk await
metric are shown in Figure 8, and the statistics of STW
pauses are also aggregated in Table II. For this 10-minute
run, we see that 2 larger-than-250ms pauses are observed.
The performance is not as severe as when we invoke heavier
background IO workload, but it still violates a 250ms-SLA
(Service Level Agreements) twice in only 10 minutes.
We then adopt the compressed-logging approach by only
logging compressed application logs. The time series of
JVM STW pauses and sar-reported disk await metric are
shown in Figure 9. We observe no single STW pause is more
than 250ms. In fact, the largest pause we see is 181ms.
C. Summary
In this section, we evaluated the two approaches of
Improving application IO and Separating GC logging from
other IO. Based on the nature of the approaches and the
performance results we obtained, we feel the latter approach
of separating GC logging from other IO is preferred, both
because of its easy adoption (i.e., no application code
change, only needs to change -Xloggc option during JVM
startup) and better performance.
Table IISTATISTICS OF JVM STW PAUSES FOR 10-MINUTE RUN (RAW LOGGING
AND LOG ROTATION)
Metric Total pause >2s >1s >0.5s >0.25s
Value 64.8 (second) 0 0 0 2

VI. RELATED WORK
A. JVM implementation and tuning
JVM, the running environment for Java-based applica-
tions, has seen different embodiments each with certain de-
sign tradeoffs. Besides the widely deployed Oracle HotSpot
[15], OpenJDK [12] and IBM J9, some companies de-
sign/implement their own JVM [16], [17].
With the increasing popularity of Java-based platforms,
the performance tuning options also grow. There are all
sorts of scenarios where Java applications can potentially
perform better by various types of tunings. In addition,
special tunings can be applied for specific scenarios where
Java applications run [18], [19].
B. Application performance on Linux System
Performance study of various components of Linux are
studied [20]. Application performance, particularly Java
performance, can be affected by the interactions between
different layers across the software stack. For instance,
with the increasing adoption of multi-core, various studies
have been done analyzing the performance scalability of
applications running on multi-core platforms [21]–[23].
Focusing on Java-based applications, our recent work [24]
identified performance issues caused by Linux THP (Trans-
parent Huge Pages) feature and Java heap management and
proposed solutions to address the issues.
VII. CONCLUSION
In this work, we studied the large STW pauses faced
by Java-based PaaS applications. We identified that the GC
logging by JVM, coupled with OS-level mechanisms, causes
this issue. We propose a set of solutions that address this
problem and share the knowledge we learned.
REFERENCES
[1] M. Soni, “Cloud computing basics—platform as a service(paas),” Linux J., vol. 2014, no. 238, Feb. 2014.
[2] “Oracle java cloud service,” https://cloud.oracle.com/java.
[3] “Weblogic server,” https://www.oracle.com/middleware/weblogic/index.html.
[4] R. Love, Linux Kernel Development, 3rd ed. Addison-WesleyProfessional, 2010.
[5] “Ext4 filesystem,” https://www.kernel.org/doc/Documentation/filesystems/ext4.txt.
[6] “Apache log4j,” http://logging.apache.org/log4j/.
[7] “Workloads of java and background io,”https://github.com/zhenyun/JavaGCworkload.
[8] R. Love, Linux System Programming: Talking Directly to theKernel and C Library. O’Reilly Media, Inc., 2007.
[9] “strace - trace system calls and signals,”http://linux.die.net/man/1/strace.
[10] A. M. Bishop, “The /proc file system and procmeter,” LinuxJ., vol. 1997, no. 36es, Apr. 1997. [Online]. Available:http://dl.acm.org/citation.cfm?id=326832.326837
[11] D. Zamboni, Learning CFEngine 3: Automated System Ad-ministration for Sites of Any Size. O’Reilly Media, Inc.,2012.
[12] “Openjdk,” http://openjdk.java.net/.
[13] “Tmpfs file system,” https://www.kernel.org/doc/Documentation/filesystems/tmpfs.txt.
[14] “Enterprise ssds,” https://queue.acm.org/detail.cfm?id=1413263.
[15] “Java hotspot virtual machine,”http://www.oracle.com/technetwork/articles/javase/index-jsp-136373.html.
[16] G. Tene, B. Iyengar, and M. Wolf, “C4: The continuouslyconcurrent compacting collector,” SIGPLAN Not., vol. 46,no. 11, Jun. 2011.
[17] T. Printezis, “Use of the jvm at twitter: A bird’s eye view,”SIGPLAN Not., vol. 49, no. 11, pp. 1–1, Jun. 2014.
[18] G. Chen, R. Shetty, M. Kandemir, N. Vijaykrishnan, M. J.Irwin, and M. Wolczko, “Tuning garbage collection for re-ducing memory system energy in an embedded java environ-ment,” ACM Trans. Embed. Comput. Syst., vol. 1, no. 1, pp.27–55, Nov. 2002.
[19] V. Horky, P. Libic, A. Steinhauser, and P. Tuma, “Dos anddon’ts of conducting performance measurements in java,” inProceedings of the 6th ACM/SPEC International Conferenceon Performance Engineering, ser. ICPE ’15, 2015.
[20] R. Bryant, R. Forester, and J. Hawkes, “Filesystem per-formance and scalability in linux 2.4.17,” in Proceedingsof the FREENIX Track: 2002 USENIX Annual TechnicalConference, Berkeley, CA, USA, 2002.
[21] S. Boyd-Wickizer, A. T. Clements, Y. Mao, A. Pesterev,M. F. Kaashoek, R. Morris, and N. Zeldovich, “An analysisof linux scalability to many cores,” in Proceedings of the9th USENIX Conference on Operating Systems Design andImplementation, ser. OSDI’10, 2010.
[22] X. Song, H. Chen, R. Chen, Y. Wang, and B. Zang, “A casefor scaling applications to many-core with os clustering,” inProceedings of the Sixth Conference on Computer Systems,ser. EuroSys ’11, 2011.
[23] L. Chen and G. R. Gao, “Performance analysis of cooley-tukey fft algorithms for a many-core architecture,” in Pro-ceedings of the 2010 Spring Simulation Multiconference, ser.SpringSim ’10, 2010.
[24] Z. Zhuang, C. Tran, H. Ramachandra, and B. Sridharan,“Ensuring high-performance of mission-critical java applica-tions in multi-tenant cloud platforms,” in Proceedings of the2014 IEEE 7th International Conference on Cloud Computing(CLOUD), Anchorage, AK, USA, 2014.