elevation-dependent trends in precipitation...
TRANSCRIPT

Elevation-Dependent Trends in Precipitation Observed during NAME
ANGELA K. ROWE, STEVEN A. RUTLEDGE, TIMOTHY J. LANG, PAUL E. CIESIELSKI, AND
STEPHEN M. SALEEBY
Department of Atmospheric Science, Colorado State University, Fort Collins, Colorado
(Manuscript received 28 September 2007, in final form 7 April 2008)
ABSTRACT
Radar data from the 2004 North American Monsoon Experiment (NAME) enhanced observing periodwere used to investigate diurnal trends and vertical structure of precipitating features relative to localterrain. Two-dimensional composites of reflectivity and rain rate, created from the two Servicio Meteo-rológico Nacional (SMN; Mexican Weather Service) C-band Doppler radars and NCAR’s S-band polari-metric Doppler radar (S-Pol), were divided into four elevation groups: over water, 0–1000 m (MSL),1000–2000 m, and greater than 2000 m. Analysis of precipitation frequency and average rainfall intensityusing these composites reveals a strong diurnal trend in precipitation similar to that observed by the NAMEEvent Rain Gauge Network. Precipitation occurs most frequently during the afternoon over the SierraMadre Occidental (SMO), with the peak frequency moving over the lower elevations by evening. Also, theprecipitation events over the lower elevations are less frequent but of greater intensity (rain rate) than thoseover the SMO. Precipitation echoes were partitioned into convective and stratiform components to allowfor examination of vertical characteristics of convection using data from S-Pol. Analyses of reflectivityprofiles and echo-top heights confirm that convection over the lower terrain is more intense and verticallydeveloped than convection over the SMO. Warm-cloud depths, estimated from the Colorado State Uni-versity–NAME upper-air and surface gridded analyses are, on average, 2 times as deep over the lowerterrain as compared with over the SMO. Using a simplified stochastic model for drop growth, it is shownthat these differences in warm-cloud depths could possibly explain the observed elevation-dependent trendsin precipitation intensity.
1. Introduction
The onset of the North American monsoon (NAM)during mid- to late June marks a shift in warm-seasonclimate, characterized primarily by an abrupt transitionfrom relatively hot, dry weather to cooler, rainy condi-tions in the semiarid regions of southwestern UnitedStates and western Mexico (e.g., Douglas et al. 1993;Adams and Comrie 1997). The arrival of strong con-vection in this region has also been linked to a decreasein precipitation over the Great Plains in the UnitedStates (e.g., Douglas et al. 1993; Mock 1996; Higginset al. 1997) and to an increase in rainfall over the EastCoast of the United States (e.g., Higgins et al. 1997).Accurate modeling and prediction of the establishmentand variability of the NAM is crucial not only for im-
proved warm-season forecasting but also for manage-ment of water resources, which is especially importantfor regions in northwestern Mexico, where 50%–80%of the annual water resource is received from monsoonprecipitation (Gochis et al. 2006).
The main goal of the North American Monsoon Ex-periment (NAME) is to better understand and modelprecipitation processes occurring in the core region ofthe NAM for improved prediction of warm-season rain-fall (Higgins et al. 2006). The local topography of thiscore area in northwestern Mexico is dominated by theSierra Madre Occidental (SMO), which extends to over3000 m (MSL; Fig. 1) and has been found to have im-portant impacts on the diurnal cycle of monsoon pre-cipitation in this region (e.g., Gochis et al. 2003, 2004;Lang et al. 2007). The diurnal trend of rainfall is gen-erally characterized by the initiation of convection overthe peaks and western foothills of the SMO during thelate afternoon (Lang et al. 2007), followed by a west-ward propagation and upscale growth into mesoscaleconvective systems (MCSs) during the late evening/
Corresponding author address: Angela K. Rowe, Departmentof Atmospheric Science, Colorado State University, Fort Collins,CO 80523.E-mail: [email protected]
4962 M O N T H L Y W E A T H E R R E V I E W VOLUME 136
DOI: 10.1175/2008MWR2397.1
© 2008 American Meteorological Society
MWR2397

early morning hours (Farfán and Zehnder 1994; Jano-wiak et al. 2005; Lang et al. 2007). For example, Lang etal. (2007) found that precipitation occurring over theGulf of California is approximately 12 h out of phasewith precipitation over the SMO. This diurnal cycle isphase shifted a few hours in global and regional modelscompared to the observations (Collier and Zhang2007); therefore, crucial questions need to be addressedregarding the preferred location of convective initiationalong the SMO, frequency and intensity of rainfall, andthe evolution of the precipitating features in relation tolocal forcing in order to improve simulations of thediurnal cycle in numerical models (Lang et al. 2007).
The 2004 NAME field campaign included a variety ofobservational platforms and instrumentation, such assurface stations, a research vessel, satellites, wind pro-filers, an upper sonde network, rain gauge networks,radars, and a research aircraft, among others (Higginset al. 2006). These platforms provided a wealth of datato analyze both the horizontal and vertical characteris-tics of precipitation. Data from the NAME Event Rain
Gauge Network (NERN)—consisting of 87 automatic-recording, tipping-bucket rain gauges positioned alongsix transects—highlighted a strong dependence of pre-cipitation frequency and intensity on elevation (Gochiset al. 2004). These results revealed two main daily andsubdaily precipitation features: 1) a core region of fre-quent but moderate-intensity precipitation over thehigh terrain of the SMO, and 2) an elevation-dependentdiurnal cycle of precipitation where rainfall occurs ear-liest and most frequently over the higher elevations andlater in the afternoon/evening and overnight acrosslower elevations, but with less frequency and higherintensity (Gochis et al. 2004). Gochis et al. (2007) statedthat the NERN dataset likely captures the essential fea-tures of rainfall; however, because of the sparse cover-age of the NERN data, it is useful to explore precipi-tation characteristics using radar data, which are morecontinuous in space. For this reason, as well as the ob-vious lack of vertical information from the NERN data,radar data are needed to further examine the structure,kinematics, and morphology of convection, including
FIG. 1. NAME radar network domain with 2D gridded topography shaded by 500-m increments. Diamondsdenote the location of the three radars, and dashed circles represent the range of each radar. Sounding locationsare represented by Xs, including Mazatlan (23.2°N, 106.4°W), Los Mochis (25.7°N, 109.1°W), and La Paz (24.2°N,110.3°W). The square shows the location of the wind profiler, and the dash–dotted line indicates the cross sectionfor Fig. 13.
DECEMBER 2008 R O W E E T A L . 4963

the diurnal cycle of precipitating clouds within the coremonsoon region (Lang et al. 2007). This study uses dataprovided by the NAME radar network to investigatethe elevation-dependent trends in NAM precipitationin greater detail than rain gauge information allows,with an emphasis on vertical characteristics of convec-tion in this region.
2. Data and methodology
a. NAME radar network
The NAME enhanced observing period (EOP) oc-curred July through August 2004, during which threeground-based radars were operational in northwesternMexico (Higgins et al. 2006; Lang et al. 2007). The net-work consisted of the National Center for AtmosphericResearch’s (NCAR) S-band polarimetric Doppler ra-dar (S-Pol), located along the Gulf of California coast,and two C-band Doppler radars (digitized for NAME)operated by the Servicio Meteorológico Nacional(SMN; Mexican Weather Service): Guasave, locatednorth of S-Pol along the coast, and Cabo, located at thetip of the Baja peninsula (Fig. 1). S-Pol operated at twomain pulse repetition frequencies: 720 Hz (most com-mon) and 960 Hz, providing maximum unambiguousranges of approximately 210 and 150 km, respectively.Data from S-Pol were acquired from 8 July to 21 Au-gust 2004. S-Pol scans included a set of low-angle 360°surveillance scans, with elevation angles of 0.8°, 1.3°,and 1.8°, for rain mapping to the maximum range ofroughly 210 km, and a set of full volume scans extend-ing to higher elevation angles to describe the verticalstructure of precipitation. Also, sector volume scans,with azimuthal widths between 90° and 120°, were ob-tained for 36 cases (comprising about 95 h of scan time)to document the detailed temporal evolution of indi-vidual precipitating features. The SMN radars scannedat a single, fixed elevation angle, the choice of anglevarying between 0.5°, 1.0°, and 1.5° for Guasave andfixed at 0.6° for Cabo. These radars provided cover-age to a maximum unambiguous range of nominally230 km. Data from the Cabo and Guasave radars wereprocessed for the same time frame as the S-Pol opera-tions, although data from Guasave were not availablefor most of the period during 22–31 July because ofrecording problems (Lang et al. 2007).
b. Two-dimensional composites
A considerable amount of quality control was ap-plied to data from all three radars, as detailed in Langet al. (2007). Further details regarding the radar datacan be found at http://data.eol.ucar.edu/datafile/nph-get/
82.119/readme_NAME_regional_radar_composites_v2.1.pdf. The radar data were interpolated from the origi-nal polar-coordinate format to a two-dimensionalspherical grid. Sweep files from the lowest elevationangles at approximately the same time were combinedto create composites available every 15 min from 8 July0000 UTC through 21 August 2345 UTC at a 0.02°latitude–longitude resolution. The 2D composites usedin this study included Geostationary Operational Envi-ronmental Satellite (GOES) infrared brightness tem-perature (to filter sea clutter near the Cabo radar),near-surface reflectivity, and near-surface rain rate. Forgrid points where radar gates overlapped, the lowestelevation gate took precedence (Lang et al. 2007). S-Polrain rates were computed using a modified version ofthe Colorado State University (CSU) blended rainfallalgorithm (Cifelli et al. 2002), and rain rates for Caboand Guasave were computed using a reflectivity–rainrate (Z–R) relationship of Z � 133R1.5 (Z, mm6 m�3; R,mm h�1), derived from a polarimetrically tuned ap-proach to the S-Pol data (Bringi et al. 2004). Rain rateswere capped at 250 mm h�1 in order to reduce icecontamination. Information obtained from these 2Dcomposites was valuable for analyzing diurnal trends inprecipitation frequency and intensity across a relativelylarge portion of the NAME tier I region.
c. Three-dimensional dataset
A three-dimensional Cartesian dataset was createdusing only S-Pol data to allow for examination of thevertical structure of precipitating features. The horizon-tal range of this 3D dataset extended roughly 160 kmfrom S-Pol in all directions, with a vertical resolution of1 km. This information was available at a 15-min tem-poral resolution, and at the same 0.02° latitude/longi-tude horizontal resolution as the two-dimensional com-posites to allow for comparison with the horizontalview of precipitation. All major polarimetric variableswere available from this 3D dataset, including reflectiv-ity, differential reflectivity, specific differential phase,linear depolarization ratio, and correlation coefficient(e.g., Doviak and Zrnic 1993, chapter 6) and were usedfor quality control of the data. Only the reflectivity fieldwas used for analyses in this study; however, futurestudies will be devoted to the use of this polarimetricinformation for further understanding of microphysicalprocesses in this region.
d. Topographic data
Topographic data from the National GeophysicalData Center (NGDC) were also available on a 0.02°grid spacing, with elevation given in meters MSL. This
4964 M O N T H L Y W E A T H E R R E V I E W VOLUME 136

dataset was separated into four elevation groups (overwater and over land with the following elevation in-crements, 0–1000 m, 1000–2000 m, and greater than2000 m) in order to examine the characteristics of pre-cipitation over the coastal areas and water in relation toover the SMO. This specific grouping of elevation waschosen to correspond to the low, middle, and high el-evation groups used for the NERN data (Gochis et al.2004). A shift of 500 m in the group thresholds (e.g.,0–500 m, 500–1500 m, and �1500 m) produced similartrends to those observed in this study; therefore, theresults were not highly dependent on the elevationgrouping of choice.
e. Convective-stratiform partitioning
A partitioning scheme, following the algorithm de-scribed by Steiner et al. (1995) with modifications byYuter and Houze (1997, 1998), was applied to each gridpoint on the 2D reflectivity composites with reflectivitygreater than 0 dBZ to distinguish between convectiveand stratiform precipitation. Grid points were first par-titioned based on an absolute criterion, for which thegrid point was classified as convective if it exceeded athreshold of 40 dBZ (e.g., Steiner et al. 1995; DeMottand Rutledge 1998; Rickenbach and Rutledge 1998;Cifelli et al. 2002). If the grid point reflectivity was�40 dBZ, a gradient criterion was applied for which thereflectivity at that grid point had to exceed the param-eter �Z, defined as
�Z � acos��ПZbg ��2b ,
where Zbg was the average reflectivity within an 11-kmradius of that grid point, and a and b were user-specified parameters to optimize performance for thegiven dataset. For this study, a and b were 8 and 150 [ascompared with 8 and 64 used originally in Yuter andHouze (1997, 1998)], respectively, based on detailedtests of the classification for a variety of cases from theNAME radar dataset, including scattered convection,linear features, large mesoscale convective systems, andstratiform precipitation with embedded convection.Once both criteria were applied to each grid point, thepartitioning algorithm set a convective radius aroundeach convective grid point, based on background reflec-tivity (Zbg), and each point within this radius was alsoclassified as convective. For this study, the thresholdsfor Zbg were decreased by 5 dBZ [relative to Yuter andHouze (1997, 1998)] to compensate for convection thatwas incorrectly classified because of altering the b pa-rameter.
3. Elevation-dependent trends in rainfall intensityand frequency
a. Precipitation intensity as a function of terrain
The elevation-dependent trends in precipitation arefirst investigated using cumulative distribution func-tions of 15-min (greatest temporal resolution possiblefrom the radar data) and 24-h rainfall totals (mm). The2D rain-rate composites from the NAME radar net-work were used to obtain 15-min rainfall totals, whichwere then binned from 0 to 84 mm by 2-mm increments,and 24-h rainfall totals, binned from 0 to 270 mm by5-mm increments. The largest 15-min rainfall totals(Fig. 2a) occur in the 0–1000- and 1000–2000-m eleva-tion ranges, whereas the higher peaks over the SMO(�2000 m) are characterized by a greater fraction oflighter precipitation. This is consistent with resultsdrawn from NERN data, which found that, for 10-minevent rain totals, there was a clear progression towarda greater number of heavier precipitation events withdecreasing elevation (Gochis et al. 2007).
Figure 2b shows a similar trend with the greatest 24-hrainfall accumulations occurring over elevations below2000 m, with lower daily totals contributing to a greaterfraction of precipitation over the SMO (�2000 m). It isevident, however, that a greater separation betweenelevation groups exists for daily totals compared to 15-min totals. The lesser separation for 15-min totals indi-cates that precipitation may be intense both over thecoast and over the SMO (�2000 m), but the muchgreater difference in daily totals between elevationgroups suggests that precipitation over the lower eleva-tions has a longer duration than over the peaks of theSMO. A similar trend was observed by the NERN, forwhich Gochis et al. (2007) suggested the potential forthe foothills of the SMO to receive brief periods ofintense rainfall, but these intense rates are not sus-tained as long as over or nearer to the coast.
b. Hourly rainfall statistics
Negri et al. (1994) first identified the diurnal cycle ofprecipitation within the core North American monsoonregion using rainfall estimates derived from SpecialSensor Microwave Imager (SSM/I) observations. Thiscycle is characterized by convective initiation over thepeaks and western slopes of the SMO during the after-noon, and the occurrence of convection offshore duringthe early morning hours (consistent with the radar-based study of Lang et al. 2007). Because monsoonprecipitation is greatly influenced by the local topogra-phy, hourly rainfall intensities and precipitation fre-quency were examined using the rain rates from the
DECEMBER 2008 R O W E E T A L . 4965

2D radar composites to further investigate elevation-dependent diurnal trends in precipitation.
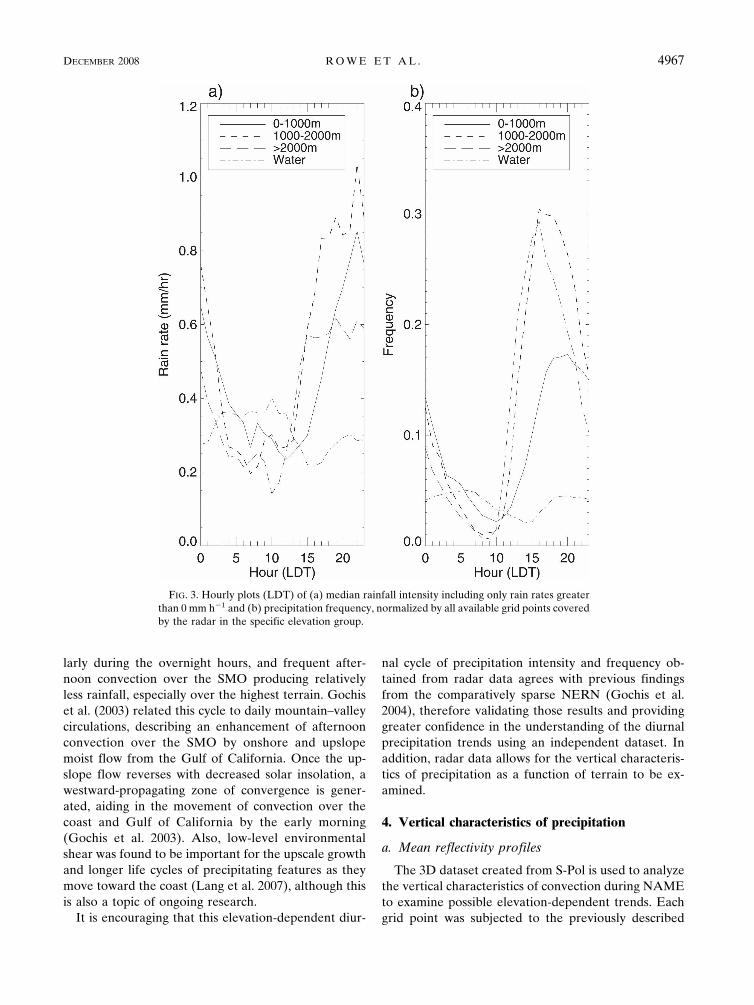
Figure 3a shows the median hourly conditional rain-fall rates over the NAME radar domain; median rateswere used instead of means to eliminate the influenceof outliers in the dataset. Figure 3b displays the pre-cipitation frequency as a function of topography andlocal daylight time (LDT; UTC � 6), normalized by thetotal number of radar points (raining and nonraining)available in each elevation group for all 2D composites.Similar to the NERN results, these plots show the ini-tiation of convection over the SMO during the after-noon and the tendency for greater intensity, but lessfrequent precipitation events to occur during the earlymorning hours over the low terrain (Gochis et al. 2004).More specifically, precipitation occurs most frequentlyat 1600 LDT over the SMO (Fig. 3b), where convectioninitiates over the high terrain (Fig. 3a). The highestfrequencies continue to be associated with precipita-
tion over the western slopes of the SMO as the dayprogresses and are characterized by the greatest me-dian rainfall intensities until after midnight when pre-cipitation is most intense and frequent over the coast(0–1000 m).
Diurnal characteristics of precipitation are further in-vestigated in Fig. 4 with plots of 6-h total rainfall (inmm) beginning at 0000, 0600, 1200, and 1800 LDT, nor-malized by the number of observations. These plotsshow the largest amount of total rainfall occurring overthe coastal plain at local midnight into the early morn-ing. The initiation of afternoon convection over theSMO is reflected by greater totals in the higher eleva-tions by noon and extending through 1700 LDT. In theevening (1800–2300 LDT), precipitation again tends tobe confined to the lower elevations as the afternoonconvection moves toward the coast and over water asthe day progresses. This emphasizes the trend of great-est rainfall amounts occurring over the coast, particu-
FIG. 2. Cumulative distribution functions calculated for (a) 15-min rain totals and (b) 24-hrain totals. Values are computed over the entire 2D composite domain for every availableradar volume scan.
4966 M O N T H L Y W E A T H E R R E V I E W VOLUME 136
larly during the overnight hours, and frequent after-noon convection over the SMO producing relativelyless rainfall, especially over the highest terrain. Gochiset al. (2003) related this cycle to daily mountain–valleycirculations, describing an enhancement of afternoonconvection over the SMO by onshore and upslopemoist flow from the Gulf of California. Once the up-slope flow reverses with decreased solar insolation, awestward-propagating zone of convergence is gener-ated, aiding in the movement of convection over thecoast and Gulf of California by the early morning(Gochis et al. 2003). Also, low-level environmentalshear was found to be important for the upscale growthand longer life cycles of precipitating features as theymove toward the coast (Lang et al. 2007), although thisis also a topic of ongoing research.
It is encouraging that this elevation-dependent diur-
nal cycle of precipitation intensity and frequency ob-tained from radar data agrees with previous findingsfrom the comparatively sparse NERN (Gochis et al.2004), therefore validating those results and providinggreater confidence in the understanding of the diurnalprecipitation trends using an independent dataset. Inaddition, radar data allows for the vertical characteris-tics of precipitation as a function of terrain to be ex-amined.
4. Vertical characteristics of precipitation
a. Mean reflectivity profiles
The 3D dataset created from S-Pol is used to analyzethe vertical characteristics of convection during NAMEto examine possible elevation-dependent trends. Eachgrid point was subjected to the previously described
FIG. 3. Hourly plots (LDT) of (a) median rainfall intensity including only rain rates greaterthan 0 mm h�1 and (b) precipitation frequency, normalized by all available grid points coveredby the radar in the specific elevation group.
DECEMBER 2008 R O W E E T A L . 4967

convective–stratiform partitioning to investigate fea-tures of both convective and stratiform precipitation inthis region. Using S-Pol data, conditional averages ofreflectivity as a function of height (MSL) and hour(LDT) were computed (Fig. 5). Only grid points withreflectivities greater than 0 dBZ are included [reflec-tivities were converted to linear units (mm6 m�3) foraveraging]. Also, the profiles do not extend above 12km because there are so few points above this levelsuch that the averages are heavily skewed toward thefew higher reflectivities, yielding unrealistic profiles.Over the SMO (�2000 m), the most intense convectionis confined to the afternoon hours consistent with theplots created from the 2D composites, but the greaterreflectivities do not extend as high as the convectionover the lower terrain. Reflectivities greater than 40dBZ in the 0–1000 m elevation range occur, on average,during more times of the day than the other elevationgroups, and extend to 5–6 km MSL during the lateafternoon. Over water, these higher reflectivities aremore limited to overnight and early morning hours, and
are confined to lower heights compared to convectionover land.
b. Land–water differences
A closer examination of differences between convec-tion over land and water in the S-Pol domain is possiblethrough comparisons of probability density functions(PDFs) for reflectivity (Figs. 6a,b). Differences be-tween reflectivities over land and water are evident byan overall shift to greater frequencies over land for agiven reflectivity band. This is especially noticeable forreflectivity bins greater than 30 dBZ, which show agreater occurrence of these reflectivity values at higheraltitudes over land compared to over water, indicatingthat convective cells are more intense over land thanover water. This tendency can also be seen in the diur-nal plots presented in Fig. 3, especially in the afternoonwhen median rainfall rates over land are more thanthree times greater than over water. The exception isduring the late morning when convection over land is aminimum prior to the initiation over the SMO. Johnson
FIG. 4. Plots of smoothed total rainfall (mm), normalized by the number of points availableat each grid point, for 6-h totals starting at 0000, 0600, 1200, and 1800 LDT, overlaid withsmoothed topography. Topography is contoured from 0 to 3000 m in 500-m increments.
4968 M O N T H L Y W E A T H E R R E V I E W VOLUME 136

et al. (2007) also observed this persistent diurnal cycleof strong convection over land and weak, infrequentconvection over the Gulf of California. Using calcula-tions of divergence, vertical motion, and heating, theyfound only weak upward motion associated with theless frequent convection over the water, principally inthe lower troposphere. These results further suggestthat during NAME, convection over land was morevertically intense with larger updrafts and occurrenceof precipitation-sized ice above the 0°C level (at about5 km) than convection over water.
c. Distributions of echo-top and 30-dBZ heights
To further investigate vertical characteristics of con-vection as a function of topography, echo-top heightsusing the S-Pol data are examined for each convectivegrid point with an observed rain rate greater than 0 mmh�1. Although this grid column approach does not takeinto account the effects of shear on convection, signifi-
cantly tilted updrafts appeared to be rare; therefore, itis a reasonable assumption that convective echo andrainfall at a particular grid point is associated withprocesses occurring directly over it in the same gridcolumn (DeMott and Rutledge 1998). Echo-top heightsare computed by determining the maximum heightwithin the grid column at which reflectivity just exceeds0 dBZ. Sensitivity tests were conducted for �5 and�10 dBZ but produced the same results as 0 dBZ. Inaddition to echo-top heights, the maximum height ofthe 30-dBZ contour is also computed to better under-stand the vertical intensity of convection duringNAME. The choice of using the 30-dBZ contour isbased on Zipser (1994) and Petersen et al. (1996) whofound that lightning production, and therefore (in-ferred) larger supercooled water and ice water con-tents, is linked to the presence of the 30-dBZ contourabove the freezing level.
Figures 7a,b show the number of convective points,
FIG. 5. Average reflectivities (dBZ ) as a function of hour (LDT) and height (km) aredisplayed for each of the four elevation groups for convective precipitation. Averagesare conditional in that they only include grid points with observed reflectivities greaterthan 0 dBZ.
DECEMBER 2008 R O W E E T A L . 4969

normalized by area, observed for a given echo-topheight and maximum 30-dBZ contour heights for waterand land, respectively. Similar to results from the 2Dcomposites, convection in the S-Pol region, in general,occurs less frequently over water than land. However,an important feature that can be noted both over waterand land are preferred peaks in echo-top heights near 5,9, and 12 km, which can be roughly described as a tri-modal distribution. A trimodal distribution in echo-topheight occurrence was also observed in previous studiesof tropical rainfall over the western Pacific Ocean.Johnson et al. (1999) described a structure in echo-topheight characterized by three dominant levels that werein close proximity to prominent stable layers: 2 km (topof the trade stable layer), 5 km (near the melting level),and 15–16 km (tropopause). Convection impingingupon layers of higher stability can retard cloud growth
and promote enhanced detrainment (Bretherton andSmolarkiewicz 1989).
To examine the effects of stability on convection inNAME, Fig. 8 shows the frequency distribution of tem-perature lapse rates exceeding certain thresholds forMazatlan (located approximately 96 km from S-Pol,Fig. 1) using 156 soundings obtained during NAME.Although the relationship between levels of enhancedstability and peaks in echo-top height frequency is notas strong as observed in Johnson et al. (1999), there isa layer of increased stability between 5 and 6 km (near0°C) suggesting that the prominent peak in echo-topheights near this level over land and water is associatedwith this layer of increased stability. This smaller layerof enhanced stability (slightly below 5 km) can be at-tributed to the effects of melting, whereas the largerpeak about 1 km higher is likely due to radiative effectsof the dry air layer (Mapes and Zuidema 1996) locateddirectly over a moist layer (Fig. 9).
The peaks in frequency of echo-top height at 9 kmand 12 km cannot be readily explained, since no obvi-ous stable layers are evident at these levels (Fig. 8). Tosearch for another possible explanation for the higherfrequency of echo-top heights at 9 km, a contouredfrequency by altitude diagram (CFAD) of relative hu-midity with respect to ice for Los Mochis is provided(Fig. 9). Although Los Mochis was located farther fromS-Pol (297 km) compared to Mazatlan (Fig. 1), LosMochis is chosen to represent the moisture content ofthe S-Pol environment because the Mazatlan soundingshave a significant dry bias, especially at low levels(Johnson et al. 2007). Figure 9 shows that below 6 km,relative humidities (RH) generally range between 60%and 80%. Above this level, the range of observed RHincreases dramatically, but with a greater frequency ofvery low RH and a mean of roughly 45%. Entrainmentof this dry air into convection at these levels would beexpected to reduce parcel buoyancy (Mapes andZuidema 1996) and thus could provide an explanationfor the observed peak in echo-top heights at 9 km.Analysis of equilibrium levels (EL) at soundings fromMazatlan and Los Mochis (not shown) indicate an av-erage EL of about 13 km in this region. It is possiblethis level of reduced parcel buoyancy may provide anexplanation for the observed peak in echo-top heightaround 12 km. Note also that no observations of echo-top height in Fig. 7 extend above 15 km because of thestabilizing influence of the tropopause, which was lo-cated around 15.5 km on average during NAME.
The normalized plots of echo-top and 30-dBZ heightoccurrences are also partitioned into the three eleva-tion groups over land (Figs. 7c–e). The trimodal distri-bution of echo-top heights observed in the land plot
FIG. 6. Reflectivity PDFs as a function of height (km MSL)for (a) land and (b) water. Reflectivities are binned from 15 to55 dBZ by 5-dBZ increments.
4970 M O N T H L Y W E A T H E R R E V I E W VOLUME 136
Fig 6 live 4/C

(Fig. 7a) is also present for the 0–1000-m and 1000–2000-m groups; however, only the peaks at 5 and 9 kmare present over the SMO (�2000 m), suggesting thatconvection over the high terrain of the SMO is shal-lower than over the lower terrain. Nesbitt et al. (2008),using brightness temperatures from satellite observa-tions, also found that convection over the higher terrain(�2250 m) is rarely of tropopause depth. They specu-late that the observed maximum height of convectionover the high terrain is limited by the lack of moistureavailable at cloud base relative to the lower elevations,thus significantly reducing the convective available po-tential energy (CAPE).
The diurnal variability of echo-top height distribu-tions are examined in Fig. 10, which shows the occur-rence of echo-top heights at 0000, 0600, 1200, and 1800LDT. At local noon, the highest frequency of echo-topheights is concentrated over the higher terrain at about5 km, reflecting the frequent shallow clouds initiating
over the SMO. At 1800 LDT, higher echo-top heightsare present over the SMO (10 km), but echo tops rarelyextend to upper levels; at the same time, echo-topheights of greater than 12 km occur over the lowerterrain. By midnight, there are overall fewer occur-rences of all echo-top heights than during the evening,and by morning the majority of the deeper convectionis concentrated over the lower terrain and adjacent wa-ters with some shallower convection existing over thewestern slopes of the SMO. This diurnal variability inecho-top height distributions suggests that the observedhigher-intensity precipitation over the lower terrain atnight is associated with deeper convection compared tothe shallower convection over the SMO that producesmore frequent, but less intense rainfall.
Although there is a noticeable difference in echo-topheight distributions with respect to terrain (Figs. 7a–e),30-dBZ heights are similar for each elevation groupwith normal-like distributions peaking around 5 km
FIG. 7. Number of convective points observed from S-Pol with respect to echo-top heightsand 30-dBZ heights for (a) over water, (b) all land, (c) 0–1000 m, (d) 1000–2000 m, and(e) �2000 m. Number of occurrence is normalized by the total area within the elevation group.
DECEMBER 2008 R O W E E T A L . 4971

(Figs. 7a,e). DeMott and Rutledge (1998) found similarresults when comparing radar data obtained from mul-tiple cruises aboard research vessel (R/V) Vickers dur-ing the Tropical Ocean and Global AtmosphereCoupled Ocean–Atmosphere Response Experiment(TOGA COARE). They concluded that despite thedifferences in echo-top height between cruises, convec-tion, whether shallow or deep, was just as intense interms of rainfall as shown by the observed similarities
in 30-dBZ distributions. For NAME, however, surfacerainfall rates differ with elevation. Therefore, the 30-dBZ contour is not an accurate representation of theintensity of the precipitation, suggesting there are otherfactors, such as cloud depth below this level, that needto be considered (discussed in section 5 below).
d. Comparison of NAME convection with othertropical locales
In addition to analyses of echo-top and 30-dBZheights, the contribution to convective rainfall as afunction of echo-top height from NAME is comparedwith all events during TOGA COARE, a study focus-ing on characteristics of tropical convection over ocean(Webster and Lukas 1992). In Fig. 11, the TOGACOARE information, adapted from Johnson et al.(1999), reveals a similar structure to that for convectionover water and land in NAME, in which all three dis-tributions exhibit a secondary peak at 9 km and a pri-mary peak at a higher echo-top height. Convection overland during NAME peaks again at 12 km; however, theconvection over water in NAME and the TOGACOARE convective cells peak at 14 km. The fasterdrop-off in height of the NAME convective rainfallprofiles is likely associated with a lower tropopause inthe NAME region (about 15.5 km versus about 17 kmin TOGA COARE). In general, both tropical localesobserved a similar trend of greater contributions oftropical convective rainfall tending to be produced byconvection with taller echo-top heights.
Vertical trends in reflectivity during NAME are com-pared to reflectivity PDFs (similar to Figs. 6a,b) con-structed from radar data from the Tropical RainfallMeasuring Mission/Large-Scale Biosphere–Atmo-sphere Experiment in Amazonia (TRMM/LBA;Fig. 12a) and the Eastern Pacific Investigation of Cli-mate Processes in the Coupled Ocean–AtmosphereSystem (EPIC; Fig. 12b), obtained from Pereira andRutledge (2006). Details regarding the easterly/westerly (TRMM/LBA) and northerly/southerly phases(EPIC) can also be found in Pereira and Rutledge(2006). The distribution of reflectivity for TRMM/LBA, which was conducted over land, is similar to theoverland portion of the NAME convection, with morefrequent observations of 30–35-dBZ heights at greaterheights. This is in comparison to NAME convectionover water and EPIC (an overwater experiment; Ray-mond et al. 2004); both are characterized by a greateroccurrence of higher reflectivities at lower levels thanthe convection over land. Frequent observations of re-flectivities over 45 dBZ do occur at greater heights forthe easterly regime of TRMM/LBA (relative to west-erly; Fig. 12a) and northerly regime of EPIC (relative
FIG. 9. CFAD of relative humidity with respect to ice for LosMochis (25.7°N, 109.1°W). The solid line represents the meanrelative humidity profile for the 207 soundings.
FIG. 8. Cumulative frequency (%) of stability (dT/dz) greaterthan �5° (solid), �4° (dashed), and �3°C km�1 (dotted) forMazatlan (23.2°N, 106.4°W) using 156 soundings during NAME.
4972 M O N T H L Y W E A T H E R R E V I E W VOLUME 136

to southerly; Fig. 12b); however, the occurrence ofthese higher reflectivities extend to even higher heightsduring NAME (roughly 7 km MSL) for both land andwater (Figs. 6a,b). This indicates that the precipitatingsystems during NAME, in general, were often deeperthan those observed during EPIC and TRMM/LBA.
5. Analysis of warm-cloud depths as a function oftopography
Although it has been shown that echo-top heightsover the lower terrain in NAME are higher than overthe SMO, this does not necessarily explain the observedtrend in rainfall intensity with respect to terrain (largerpeak rain rates over low terrain compared to over thehighest terrain). We now investigate possible differ-ences in warm-cloud depths with elevation, and the rolethese differences may contribute to peak rainfall inten-sity as a function of elevation. Deeper warm-cloud
depths provide for more coalescence growth as meltingice particles fall through this layer and accrete availableliquid water. Nesbitt et al. (2008) demonstrated the ten-dency for convection over the western slopes of theSMO to be comparatively shallow, with cloud-baseheights, estimated using a method from Stull (1995), ofless than 1.0 km (AGL) on average. For this study,lifting condensation levels (LCLs) and melting levelsare computed to further investigate this variation indepth with elevation.
The NAME radiosonde dataset, profiler wind datafrom the NCAR Integrated Sounding System (ISS)sites, Quick Scatterometer (QuikSCAT) retrieved sur-face oceanic winds, and aviation routine weather report(METAR) surface reports are used to objectively ana-lyze surface and upper-air fields at 6 h, 1° horizontaland 25-hPa vertical resolution over the domain from22°–35°N, 115°–100°W, referred to as the T1A domain(Johnson et al. 2007). Analyzed fields used in this study
FIG. 10. Number of convective points observed from S-Pol with respect to echo-top heightsand time of day (LDT). Number of occurrence is normalized by the total area within theelevation group. Note the x axes are not on the same scale.
DECEMBER 2008 R O W E E T A L . 4973

include geopotential height (m), temperature (°C), wa-ter vapor mixing ratio (g kg�1), and surface pressure(mb) from the version 3 Colorado State University(CSU) gridded analyses (Johnson et al. 2007). Data areavailable at 0000, 0600, 1200, and 1800 UTC for 7 Julythrough 15 August and are used to compute LCLs andmelting levels over each of the 1° grid points.1 The LCLis computed by decreasing the temperature of the sur-face parcel dry adiabatically with height, using this tem-perature to compute the saturation mixing ratio at eachvertical level, then determining the minimum level atwhich the computed saturation mixing ratio is equal tothe observed surface water vapor mixing ratio. In some
cases, especially over the higher terrain, this conditionis not met above ground level; therefore, over the SMO,LCLs are given the value of the local terrain elevation.Observations during NAME indicate that cloud basesfrequently intercept the higher terrain of the SMO,making this a reasonable assumption (Nesbitt et al.2008). Figure 13 displays a cross section at 24°N (shownin Fig. 1) of the LCLs (MSL) averaged over the EOPduring NAME for the region between 109° and 105°W.The average LCL increases in height with increasingelevation, and provides a rough estimate of a cloud-base height of about 0.5 km MSL over the lower ter-rain, which increases to approximately 2.5 km MSLover the SMO; these estimates are consistent withcloud-base heights computed by Nesbitt et al. (2008).
The melting level is estimated by finding the mini-mum level at which the observed temperature falls be-tween �4° and �1.5°C; these values are chosen toavoid brightband contamination when computing sta-tistics at this level. The average melting level for the T1
1 Upper-air gridded analyses over the SMO represent an inter-polation from sounding sites on the western Mexican coast to sitesa few hundred kilometers to the east of the SMO crest and thusmay not accurately represent conditions over higher elevations.Therefore, caution should be taken when using these results foranalyses other than qualitative comparisons.
FIG. 11. Comparison of contribution to convective rainfall from NAME (land and water)and TOGA COARE (all water). Information for TOGA COARE is adapted from Johnsonet al. (1999) for all events.
4974 M O N T H L Y W E A T H E R R E V I E W VOLUME 136

domain is approximately 5 km (dashed line in Fig. 13),consistent with radar observations, and coinciding withthe layer of enhanced stability at roughly 5 km ob-served from the Mazatlan sounding. Average warm-cloud depths, computed by finding the difference be-tween the LCL and melting level, are shown in Fig. 13.The depth of the warm-rain coalescence zone is foundto decrease with increasing elevation, as expected,reflecting the shallower convection over the SMOcompared to over the coast. Average warm-clouddepths vary from roughly 4500 m over the lower terrainto 2500 m over the highest elevations of the SMO.
It is hypothesized that the variations in warm-clouddepth between the higher and lower terrain are themajor contributor to the observed differences in pre-cipitation intensity with elevation. To test this hypoth-esis, a simplified model of stochastic drop growthfrom the Colorado State University Regional Atmo-spheric Modeling System (RAMS) microphysics algo-rithm (Saleeby and Cotton 2004) is used to simulateaverage rain rates with varying warm-cloud depths. A
homogenous cloud layer of 5 km is initially assumedabove the melting level; additional details regarding themodel simulation and assumptions are described in theappendix. Average precipitation rates for warm-clouddepths of 2500, 3500, and 4500 m are determined aftera 30-min model run, at which point the final rain spec-trum achieves equilibrium. These results are then nor-malized by the maximum simulated rain rate to deter-mine the relative effect of warm-cloud depth on rainfallintensity. Normalized rain rates decrease from 1.00 to0.86 to 0.73 for warm-cloud depths of 4500, 3500, and2500 m, respectively, indicating that decreasing warm-cloud depth leads to a decrease in average rainfall rate.For comparison, average convective rainfall rates arecomputed from the entire 2D radar composite domainand normalized by the highest observed average to ob-tain a value of 1.00 over the coastal plain (0–1000 m)where warm-cloud depths are roughly 4500 m. For el-evations in the 1000–2000-m range, where warm-clouddepths are on the average 3500 m, the relative rain ratereduced to 0.94, and over the SMO (warm-cloud depth
FIG. 12. Reflectivity PDFs adapted from Pereira and Rutledge (2006) for (a) TRMM/LBA and (b) EPIC. Thetop (bottom) panels represent the easterly (westerly) and northerly (southerly) regimes for TRMM/LBA andEPIC, respectively.
DECEMBER 2008 R O W E E T A L . 4975
Fig 12 live 4/C

approximately 2500 m), the observed rainfall rate isonly 0.61 of that observed over the coast. Although themagnitude of the reduction between simulated and ob-served rates is slightly different, the simulated trend ofdecreasing convective precipitation intensity with de-creasing warm-cloud depth, and therefore increasingelevation, agrees with the observed trend. This similartrend suggests that the differences in warm-cloud depthacross elevation groups may explain differences in peakrain rates with respect to elevation.
The previously described model simulation assumeda cloud layer of 5 km above the melting level for allwarm-cloud depths; however, recall from Fig. 7 thatecho-tops are generally higher over the lower terrainthan over the peaks of the SMO. To account for theshallower convection over the SMO, average rain ratesare produced from the model for a homogenous cloudlayer of 1 km above the melting level, with all otherassumptions remaining the same. Average precipitationintensities were reduced more for decreasing warm-cloud depths than for the 5-km layer. Specifically, de-creasing the warm-cloud depth from 4500 to 2500 m forthis revised simulation reduced the average precipita-tion by 61%, compared to the 73% reduction for the5-km layer. The magnitude of this reduction is the sameas the observed decrease in rain rate over the SMO,where warm-cloud depths are approximately 2500 mand echo-top heights are generally lower than over the
coast. This suggests that warm-rain processes are thedominant factor for precipitation over the highest ter-rain; however, in addition to warm-rain depth, the pro-cesses that occur above the melting level need to beconsidered to fully explain the observed trend in rain-fall intensity over the lower terrain. The polarimetricinformation available from S-Pol will be valuable forinvestigating differences in the microphysics of the pre-cipitating systems to improve understanding of the pro-cesses occurring in the core monsoon region.
6. Summary and conclusions
The North American Monsoon Experiment radarnetwork provided unprecedented observations of pre-cipitation systems within the North American mon-soon. Diurnal characteristics of precipitation are poorlyrepresented in numerical simulations of the NAM (e.g.,Collier and Zhang 2007); therefore, this study aims tocontribute to the basic understanding of trends in pre-cipitation intensity and frequency as a function of timeof day as well as local terrain. Cumulative distributionfunctions of rainfall totals, computed from the 2D rain-rate composites from the radar network, reveal a tran-sition to heavier precipitating events with decreasingelevation. The greater separation between elevationgroups for the daily rain totals compared to the 15-mintotals suggests the possibility for intense precipitationto occur over the foothills of the SMO, but these eventsare not as likely to be sustained for the same durationas those over the lower terrain. These results are con-sistent with trends found using the NAME Event RainGauge Network from Gochis et al. (2007); thereforevalidating these results using an independent dataset. Apronounced diurnal trend in precipitation frequencyand intensity is observed using the 2D rain-rate com-posites from the NAME radar network. Also consistentwith NERN results, the diurnal cycle is characterizedby frequent precipitation initiating over the SMOaround 1600 LDT (UTC � 6). This precipitation orga-nizes as it propagates toward the coast in the time-meaneasterly flow, leading to high intensity, but less frequentprecipitation over the lower terrain during the latenight–early morning hours.
Elevation-dependent trends in precipitating featureswere further investigated using a 3D dataset createdfrom S-Pol. Each of these grid points was subjected toa convective–stratiform partitioning algorithm based onYuter and Houze (1997, 1998), and vertical profiles ofreflectivity were constructed for both convective andstratiform precipitation. These profiles indicate a ten-dency for precipitation, especially convective, to be
FIG. 13. The average LCLs, melting level, smoothed elevations,and warm-cloud depths are plotted for a cross section along 24°N(line shown in Fig. 1). Average warm-cloud depths are deter-mined as the difference in height between the melting level andthe LCL. Elevation values less than 0 m indicate water.
4976 M O N T H L Y W E A T H E R R E V I E W VOLUME 136
more vertically intense over the lower terrain than overthe SMO. Analysis of the diurnal cycle of these reflec-tivity profiles show that the most intense convectionover the low terrain, in terms of reflectivity, occurs dur-ing the evening and early morning. The intense convec-tion that occurs over the SMO is limited to the after-noon, consistent with diurnal trends of near-surfaceprecipitation observed using the 2D composites fromthe entire network. Reflectivity information providedby the S-Pol composites also allowed for analysis ofecho-top height distributions as a function of terrain.Over both land and water, there is a tendency for atrimodal distribution in echo-top heights, with peaks at5, 9, and 12 km. The peaks at 5 and 12 km may beexplained by layers of enhanced stability present nearthese levels (melting level and equilibrium level, re-spectively) that limit vertical growth of convection,whereas the peak observed at 9 km is likely due to dryair entrainment. The peak at 12 km is absent over theSMO, indicating the tendency for convection over thehigher terrain to be shallower than over the coast.
To investigate possible explanations for the observedtrends in precipitation frequency and intensity, theCSU–NAME upper-air and surface gridded analyseswere used to compute average LCLs and melting levelsto compare warm-cloud depths over the various eleva-tion groups. As hypothesized, there is a decreasingtrend in warm-cloud depth with increasing elevation,with values ranging from an average of 4500 m over thelowest terrain to 2500 m over the SMO. A simplifiedmodel of stochastic droplet growth from the ColoradoState University RAMS microphysics algorithm wasused to determine the impact of these differences inwarm-cloud depth on precipitation intensity. Themodel allowed an assumed initial drop size distributionto fall through the melting level and grow through co-alescence for 30 min to determine average precipitationrates. The simulated trend of decreasing convectiveprecipitation intensity with decreasing warm-clouddepth (increasing elevation) corresponds to the ob-served trend, suggesting that the differences in warm-cloud depth between elevation groups could explain thedifferences in rainfall rates with respect to elevation.
There is a vast amount of polarimetric data collectedfrom S-Pol during NAME that may provide further de-tails regarding the microphysical variability of convec-tion as a function of terrain. This study only analyzedwarm-rain processes; however, the polarimetric infor-mation will allow for analysis of ice processes to pro-vide a better understanding of trends in rainfall pro-duction. These detailed analyses could aid in furtherunderstanding of the elevation-dependent diurnal char-acteristics of convection in the core monsoon region,
and ultimately improve prediction of warm-season pre-cipitation associated with the North American mon-soon. The variability of mesoscale organization and theinteraction of gust fronts with the sea breeze over thecoastal plain in contributing to rainfall variability willalso be the subject of future studies.
Acknowledgments. We thank the S-Pol radar stafffrom the Earth Observing Laboratory (EOL) ofNCAR—in particular the lead S-Pol engineers, DonFerraro and Jon Lutz, and science staff, Tammy Weck-werth, James Wilson, and Jothiram Vivekanandan. RitCarbone of NCAR (Co-PI on the S-Pol deployment)was critical to making radar observations in NAME asuccess. John Lutz, along with the assistance of ArturoValdez-Manzanilla of Juarez University and ArmandoRodriguez Davila of SMN, led the SMN radar upgradeand data collection efforts. Initial quality control anddistribution of radar data was led by Bob Rilling ofNCAR EOL, and further quality control of the datawas aided by Chad Christenson, Lee Nelson, andGustavo Pereira of Colorado State University. Wethank Gustavo Pereira also for his assistance in opti-mizing the convective–stratiform partitioning algo-rithm. We also thank Dr. Rob Cifelli, Dr. StephenNesbitt, and Paul Hein for insightful discussion and as-sistance in computer programming issues. Radar obser-vations and analyses were funded by the National Oce-anic and Atmospheric Administration (SMN radars)Grant NA17RJ1228 and the National Science Founda-tion (S-Pol) Grant ATM-0340544. Paul Ciesielski wassupported by NASA Grant NNG04GA22G.
APPENDIX
Details and Simplifications of the RAMSStochastic Growth Scheme
RAMS uses a bin-emulating approach to explicitlysimulate the warm-rain, collision–coalescence processby the method of moments (Tzivion et al. 1987). In thisscheme, an initial exponential droplet size distributionof hydrometeors is decomposed into 36 mass-doublingbins for two moments of the distribution (mixing ratioand number concentration; Saleeby and Cotton 2004).Bin collection interactions are then computed using re-alistic collection efficiencies and the hydrometeor dis-tributions are reconstructed from the updated bins.Evolution of the hydrometeor spectra is predictedthrough vapor deposition/evaporation, stochastic coa-lescence, and sedimentation (Walko et al. 1995; Meyerset al. 1997). For this study, evaporation was ignored,which did not alter the results significantly, and the
DECEMBER 2008 R O W E E T A L . 4977
initial distribution of hydrometeors was only allowed togrow through collection of cloud droplets in the warm-cloud layer.
Further simplifications to the RAMS stochasticgrowth scheme include assuming an initial rain mixingratio of 2 g kg�1 and an initial drop concentration of3800 m�3, yielding an initial average drop diameter of1 mm. These parameters are specified at the 5-km MSLlevel, corresponding to the 0°C level and, therefore, thetop of the warm-cloud zone. This drop size diameterresults in an initial reflectivity of about 36 dBZ, corre-sponding to a rain rate of approximately 10 mm h�1,which is similar to the observed initial average precipi-tation rate of 17 mm h�1. This observed precipitationrate was computed by determining the average reflec-tivity at 5 km, then applying the Z–R relationship usedin the composites to determine an estimated rainfallrate at this level. The distribution of hydrometeors withthese characteristics then falls through the warm-cloudregion, containing an initial cloud droplet concentra-tion of 300 cm�3. A typical value for cloud liquid waterof 1 g kg�1 is used, giving an initial average cloud drop-let diameter of 18 m. A cloud droplet concentration of100 cm�3 was also tested, but changes in the resultswere minimal. This increase in diameter results in ahigher collection efficiency, but is counteracted by thedecreased amount of droplets to collect, therefore bal-ancing each other and resulting in almost no change inprecipitation rates. Autoconversion is turned off toonly allow for collection of cloud droplets by raindrops(i.e., no self-collection of cloud droplets allowed).
REFERENCES
Adams, D. K., and A. C. Comrie, 1997: The North Americanmonsoon. Bull. Amer. Meteor. Soc., 78, 2197–2213.
Bretherton, C. S., and P. K. Smolarkiewicz, 1989: Gravity waves,compensating subsidence and detrainment around cumulusclouds. J. Atmos. Sci., 46, 740–759.
Bringi, V. N., T. Tang, and V. Chandrasekar, 2004: Evaluation ofa new polarimetrically based Z–R relation. J. Atmos. OceanicTechnol., 21, 612–623.
Cifelli, R., W. A. Petersen, L. D. Carey, S. A. Rutledge, and M. A.F. da Silva Dias, 2002: Radar observations of the kinematic,microphysical, and precipitation characteristics of two MCSsin TRMM LBA. J. Geophys. Res., 107, 8077, doi:10.1029/2000JD000264.
Collier, J. C., and G. J. Zhang, 2007: Effects of increased horizon-tal resolution on simulations of the North American mon-soon in the NCAR CAM3: An evaluation based on surface,satellite, and reanalysis data. J. Climate, 20, 1843–1861.
DeMott, C. A., and S. A. Rutledge, 1998: The vertical structure ofTOGA COARE convection. Part I: Radar echo distribu-tions. J. Atmos. Sci., 55, 2730–2747.
Douglas, M., R. A. Maddox, K. Howard, and S. Reyes, 1993: TheMexican monsoon. J. Climate, 6, 1665–1677.
Doviak, R. J., and D. S. Zrnic, 1993: Doppler Radar and WeatherObservations. Academic Press, 562 pp.
Farfán, L. M., and J. A. Zehnder, 1994: Moving and stationarymesoscale convective systems over northwest Mexico duringthe Southwest Area Monsoon Project. Wea. Forecasting, 9,630–639.
Gochis, D. J., J. C. Leal, C. J. Watts, W. J. Shuttleworth, and J.Garatuza-Payan, 2003: Preliminary diagnostics from a newevent-based monitoring system network in support of theNorth American Monsoon Experiment (NAME). J. Hydro-meteor., 4, 974–981.
——, A. Jimenez, C. J. Watts, J. Garatuza-Payan, and W. J.Shuttleworth, 2004: Analysis of 2002 and 2003 warm-seasonprecipitation from the North American Monsoon Experi-ment event rain gauge network. Mon. Wea. Rev., 132, 2938–2953.
——, L. Brito-Castillo, and W. J. Shuttleworth, 2006: Hydro-climatology of the North American monsoon region in north-west Mexico. J. Hydrol., 316, 53–70.
——, C. J. Watts, J. Garatuza-Payan, and J. Cesar-Rodriguez,2007: Spatial and temporal patterns of precipitation intensityas observed by the NAME event rain gauge network from2002 to 2004. J. Climate, 20, 1734–1750.
Higgins, R. W., Y. Yao, and X. Wang, 1997: Influence of theNorth American monsoon system on the U.S. summer pre-cipitation regime. J. Climate, 10, 2600–2622.
——, and Coauthors, 2006: The NAME 2004 field campaign andmodeling strategy. Bull. Amer. Meteor. Soc., 87, 79–94.
Janowiak, J. E., V. E. Kousky, and R. J. Joyce, 2005: Diurnal cycleof precipitation determined from the CMORPH high spatialand temporal resolution global precipitation analyses. J. Geo-phys. Res., 110, D23105, doi:10.1029/2005JD006156.
Johnson, R. H., T. M. Rickenbach, S. A. Rutledge, P. E. Ciesiel-ski, and W. H. Schubert, 1999: Trimodal characteristics oftropical convection. J. Climate, 12, 2397–2418.
——, P. E. Ciesielski, B. D. McNoldy, P. J. Rogers, and R. K.Taft, 2007: Multiscale variability of the flow during the NorthAmerican Monsoon Experiment. J. Climate, 20, 1628–1648.
Lang, T. J., D. A. Ahijevych, S. W. Nesbitt, R. E. Carbone, S. A.Rutledge, and R. Cifelli, 2007: Radar-observed characteris-tics of precipitating systems during NAME 2004. J. Climate,20, 1713–1733.
Mapes, B. E., and P. Zuidema, 1996: Radiative-dynamical conse-quences of dry tongues in the tropical atmosphere. J. Atmos.Sci., 53, 620–638.
Meyers, M. P., R. L. Walko, J. Y. Harrington, and W. R. Cotton,1997: New RAMS cloud microphysics parameterization. PartII. The two-moment scheme. Atmos. Res., 45, 3–39.
Mock, C. J., 1996: Climatic controls and spatial variations of pre-cipitation in the western United States. J. Climate, 9, 1111–1125.
Negri, A. J., R. F. Adler, E. J. Nelkin, and G. J. Huffman, 1994:Regional rainfall climatologies derived from Special SensorMicrowave Imager (SSM/I) data. Bull. Amer. Meteor. Soc.,75, 1165–1182.
Nesbitt, S. W., D. J. Gochis, and T. J. Lang, 2008: The diurnalcycle of clouds and precipitation along the Sierra Madre Oc-cidental observed during NAME-2004: Implications forwarm season precipitation estimation in complex terrain. J.Hydrometeor., 9, 728–743.
Pereira, L. G., and S. A. Rutledge, 2006: Diurnal cycle of shallowand deep convection for a tropical land and an ocean envi-
4978 M O N T H L Y W E A T H E R R E V I E W VOLUME 136

ronment and its relationship to synoptic wind regimes. Mon.Wea. Rev., 134, 2688–2701.
Petersen, W. A., S. A. Rutledge, and R. E. Orville, 1996: Cloud-to-ground lightning observations from TOGA COARE:Selected results and lightning location algorithms. Mon. Wea.Rev., 124, 602–620.
Raymond, D. J., and Coauthors, 2004: EPIC2001 and the coupledocean–atmosphere system of the tropical east Pacific. Bull.Amer. Meteor. Soc., 85, 1341–1354.
Rickenbach, T. M., and S. A. Rutledge, 1998: Convection inTOGA COARE: Horizontal scale, morphology, and rainfallproduction. J. Atmos. Sci., 55, 2715–2729.
Saleeby, S. M., and W. R. Cotton, 2004: A large droplet mode andprognostic number concentration of cloud droplets in theColorado State University Regional Atmospheric ModelingSystem (RAMS). Part I: Module descriptions and supercelltest simulations. J. Appl. Meteor., 43, 182–195.
Steiner, M., R. A. Houze Jr., and S. E. Yuter, 1995: Climatologicalcharacteristics of three-dimensional storm structure from op-erational radar and rain gauge data. J. Appl. Meteor., 34,1978–2007.
Stull, R. B., 1995: Meteorology Today for Scientists and Engineers.West Publishing, 385 pp.
Tzivion, S., G. Feingold, and Z. Levin, 1987: An efficient numeri-cal solution to the stochastic collection equation. J. Atmos.Sci., 44, 3139–3149.
Walko, R. L., W. R. Cotton, M. P. Meyers, and J. Y. Harrington,1995: New RAMS cloud microphysics parameterization: PartI: The single-moment scheme. Atmos. Res., 38, 29–62.
Webster, P. J., and R. Lukas, 1992: TOGA COARE: TheCoupled Ocean–Atmosphere Experiment. Bull. Amer. Me-teor. Soc., 73, 1377–1416.
Yuter, S. E., and R. A. Houze Jr., 1997: Measurements of rain-drop size distributions over the Pacific warm pool and impli-cations for Z–R relations. J. Appl. Meteor., 36, 847–867.
——, and ——, 1998: The natural variability of precipitatingclouds over the western Pacific warm pool. Quart. J. Roy.Meteor. Soc., 124, 53–99.
Zipser, E. J., 1994: Deep cumulonimbus cloud systems in thetropics with and without lightning. Mon. Wea. Rev., 122,1837–1851.
DECEMBER 2008 R O W E E T A L . 4979