elen london 23.10.18 - elengroup.com · disclaimer certain statements in this slide show, including...
TRANSCRIPT
London - October 23rd - 24th , 2018
COMPANY PRESENTATION

DISCLAIMER
Certain statements in this slide show, including those addressing the Company’s beliefs, plans, objectives,
estimates or expectations of possible future results or events, are forward-looking statements. Forward-looking
statements involve known or unknown risks, including general economic and business conditions, and conditions
in the industry we operate and may be affected should our assumptions turn out to be inaccurate. Consequently,
no forward-looking statement can be guaranteed and actual future results, performance, or achievements may
vary materially from those expressed or implied by such forward-looking statements. The Company undertakes
no obligation about the contents nor to update the forward-looking statements to reflect events or
circumstances that may arise after the date hereof.

3
El.En.1
Our Markets2
Growth drivers3
Financial Highlights4
AGENDA
Multiples & Comparables5
4
El.En.

5
Hi-Tech company
Hi-Tech industrial group active in opto-electronics with proprietary technologies and know how
developed over 35 years
International Group
More than 20 companies active worldwide on several markets and application segments. Listed on
the Milan Stock Exchange, Star segment since 2000
Among the leaders in the global market
Progressively widening its worldwide presence registering continuous growth over the years
Worldwide distribution network
>1,300 employees worldwide; 38 years average age
More than 40,000 laser sources sold and 5% of revenue invested in R&D
Constant and sustainable growth
14% Revenue CAGR 2011 – 2017
35% EBIT CAGR 2011 – 2017
FY 2017 Consolidated Revenue: €306m, up 21% YoY
El.En.
A Primary Player Providing Medical, Industrial, and Conservation
Laser Solutions Worldwide

6
El.En. Worldwide
SALES SUBSIDIARIES
PRODUCTION SITES
HEADQUARTER
PeopleEthics &
human rights
R & D
EnvironmentHealth & Safety
Italy 609
Europe 144
Japan 48
China 549
Brasil 24
1.374
employees
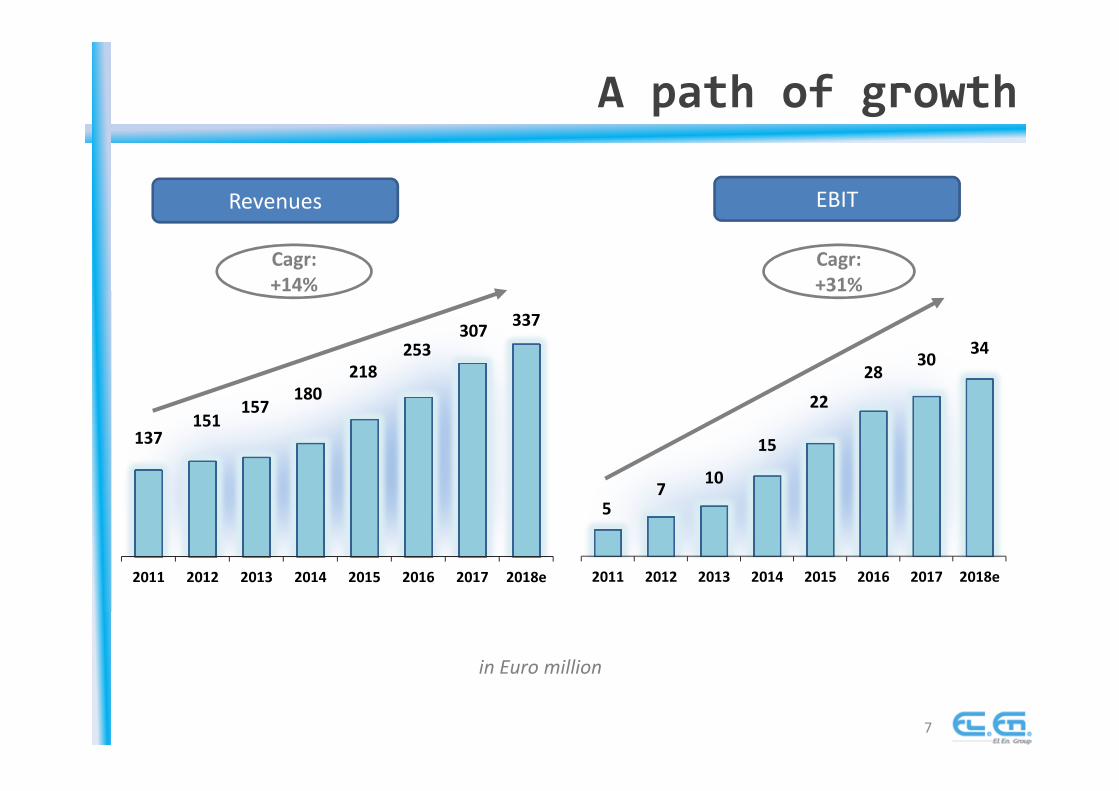
137151
157180
218
253307
337
2011 2012 2013 2014 2015 2016 2017 2018e
57
10
15
22
2830
34
2011 2012 2013 2014 2015 2016 2017 2018e
A path of growth
7
Revenues
Cagr:
+14%
EBIT
in Euro million
Cagr:
+31%

8
Our Markets

Medical & Aesth energy-based systems market
9
Key growth drivers:
� Increasingly aging population
� Desire to achieve or maintain more youthful appearance
� Increase in healthcare spending
� Requirements for fast and minimally invasive surgical procedures
US$ million 2014 2016 2021 CAGR
14-16
CAGR
16-21
Global non-invasive and minimally
invasive medical aesthetic treatment
systems 6.932 8.437 13.992 10% 11%
Energy-based treatment systems 2.033 2.670 4.380 15% 10%
Body shaping & Skin tightening 724 996 1.965 17% 15%
Skin rejuvenation 523 695 1.089 15% 9%
Hair removal 353 341 333 -2% 0%
Leg vein treatments 131 157 187 9% 4%
Acne reduction 96 110 125 7% 3%
Vaginal rejuvenation na 105 332 na 26%
Pigmented lesion & tattoo removal 80 99 142 11% 7%
Other 126 167 207 15% 4%
Total 2.033 2.670 4.380 15% 10%
Source: Medical Insight Report
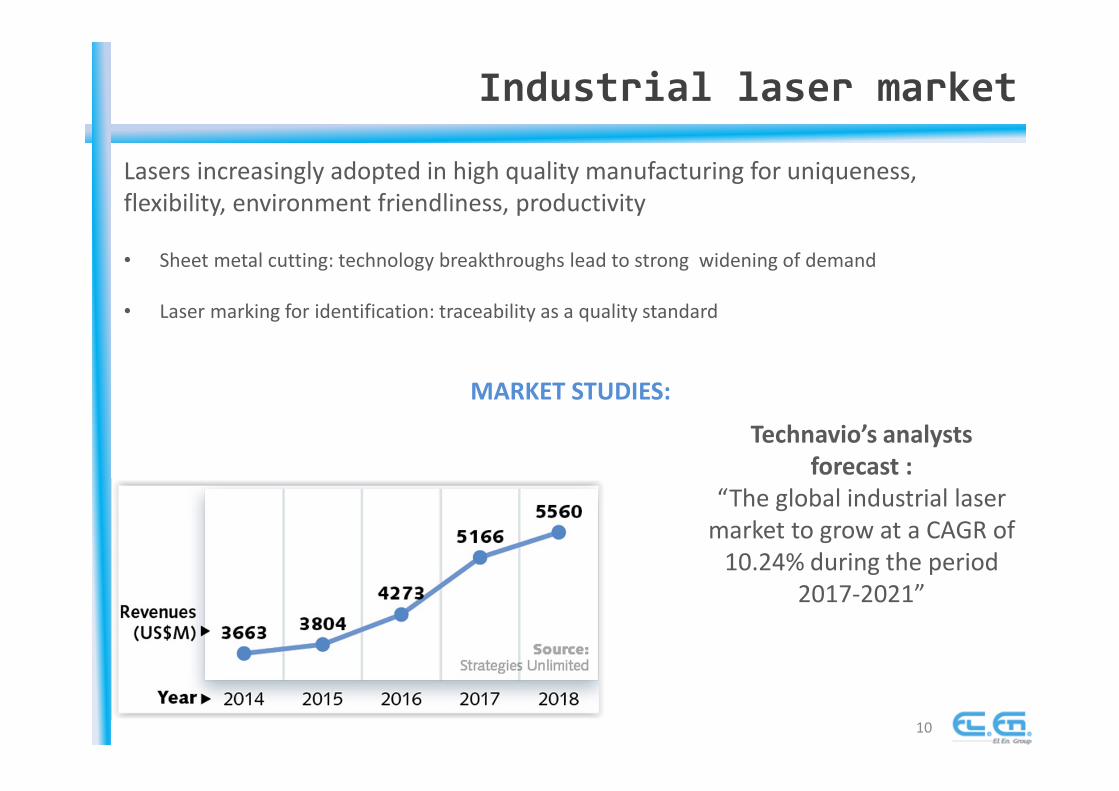
Industrial laser market
10
Lasers increasingly adopted in high quality manufacturing for uniqueness,
flexibility, environment friendliness, productivity
• Sheet metal cutting: technology breakthroughs lead to strong widening of demand
• Laser marking for identification: traceability as a quality standard
MARKET STUDIES:
Technavio’s analysts
forecast :
“The global industrial laser
market to grow at a CAGR of
10.24% during the period
2017-2021”

11
Growth drivers
� Expected growth in our main markets: Aesthetic , Surgery, Industrial
� Entering the body contouring and cellulite treatment market
� Novel dermatologic treatment device: 2019
� Hologic/ Cynosure focused again on Mona Lisa Touch
� Diabetic foot ulcers: seeking regulatory clearances worldwide
� New applications for medium power CO2 laser sources
� Strong demand for high power laser sheet metal cutting systems in China
and Europe
Growth drivers
12

� ONDA - Body contouring
� Motus AX expands to Motus AY
� BPH: Virtual basket and single use morcellator
� High Power sheet metal cutting systems - 15kW
� OEM systems for urology – 100 W Ho:YAG
New systems and devices
13
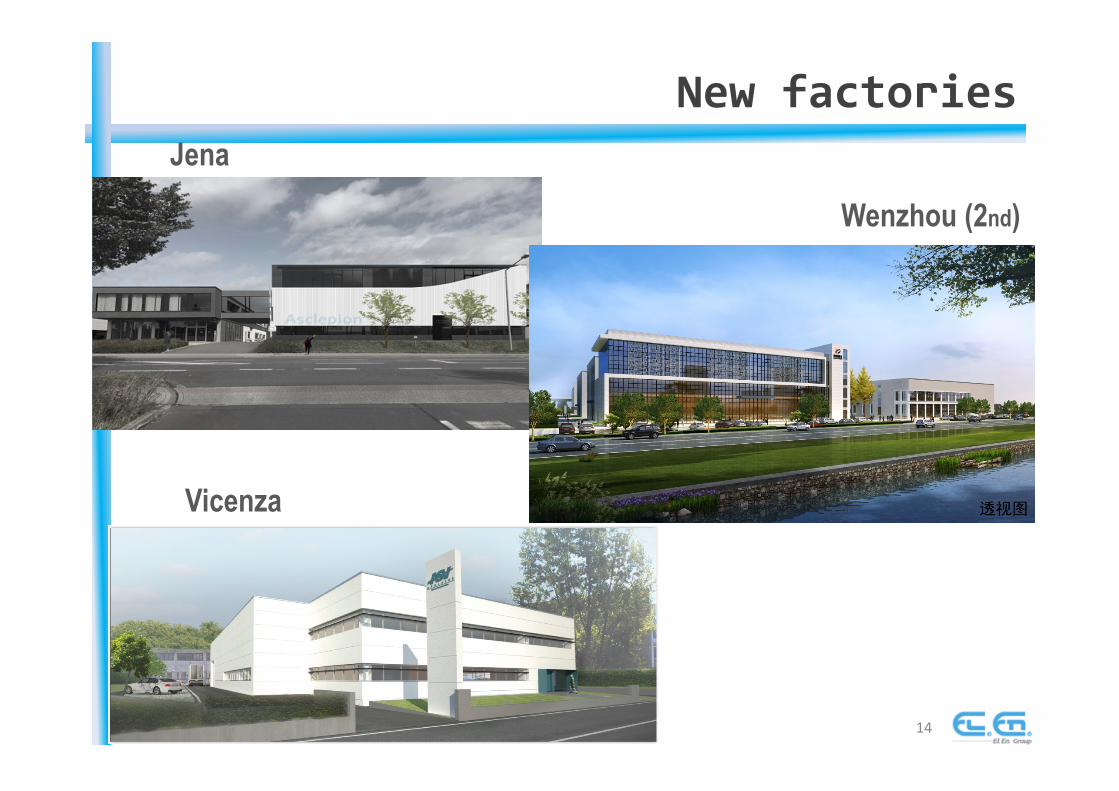
New factories
14
Wenzhou (2nd)
Vicenza
Jena

Financial Highlights15
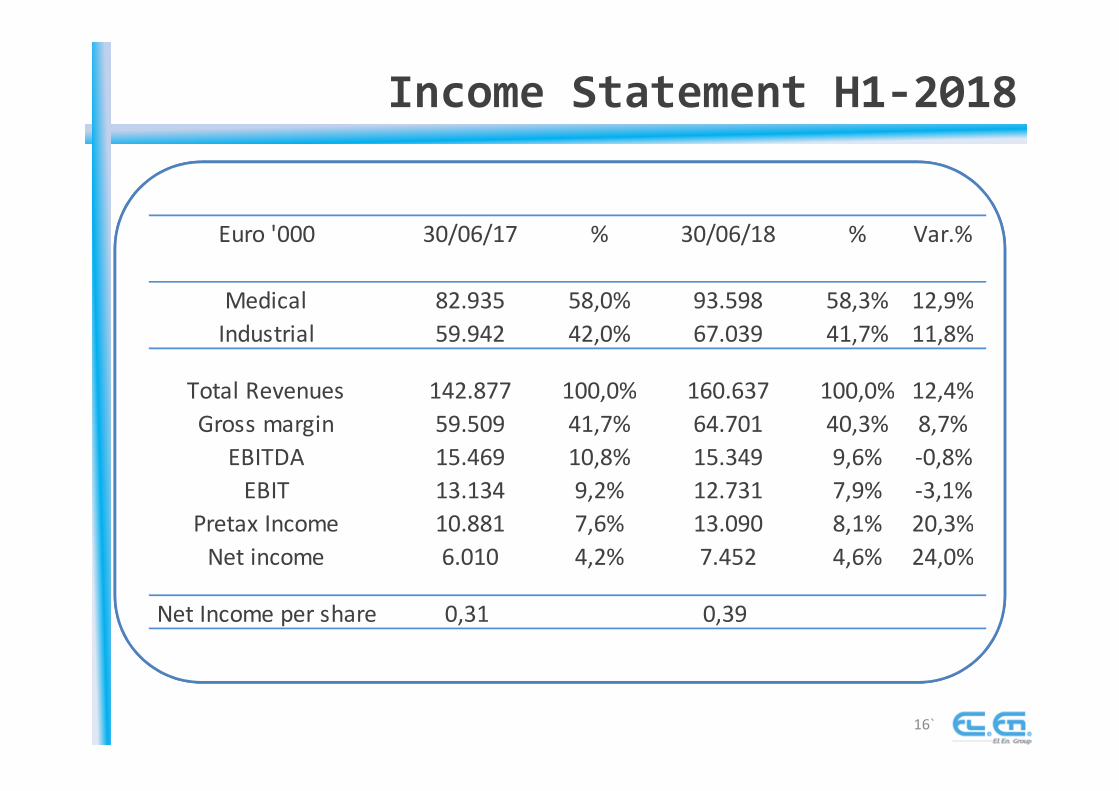
Income Statement H1-2018
16`
Euro '000 30/06/17 % 30/06/18 % Var.%
Medical 82.935 58,0% 93.598 58,3% 12,9%
Industrial 59.942 42,0% 67.039 41,7% 11,8%
Total Revenues 142.877 100,0% 160.637 100,0% 12,4%
Gross margin 59.509 41,7% 64.701 40,3% 8,7%
EBITDA 15.469 10,8% 15.349 9,6% -0,8%
EBIT 13.134 9,2% 12.731 7,9% -3,1%
Pretax Income 10.881 7,6% 13.090 8,1% 20,3%
Net income 6.010 4,2% 7.452 4,6% 24,0%
Net Income per share 0,31 0,39
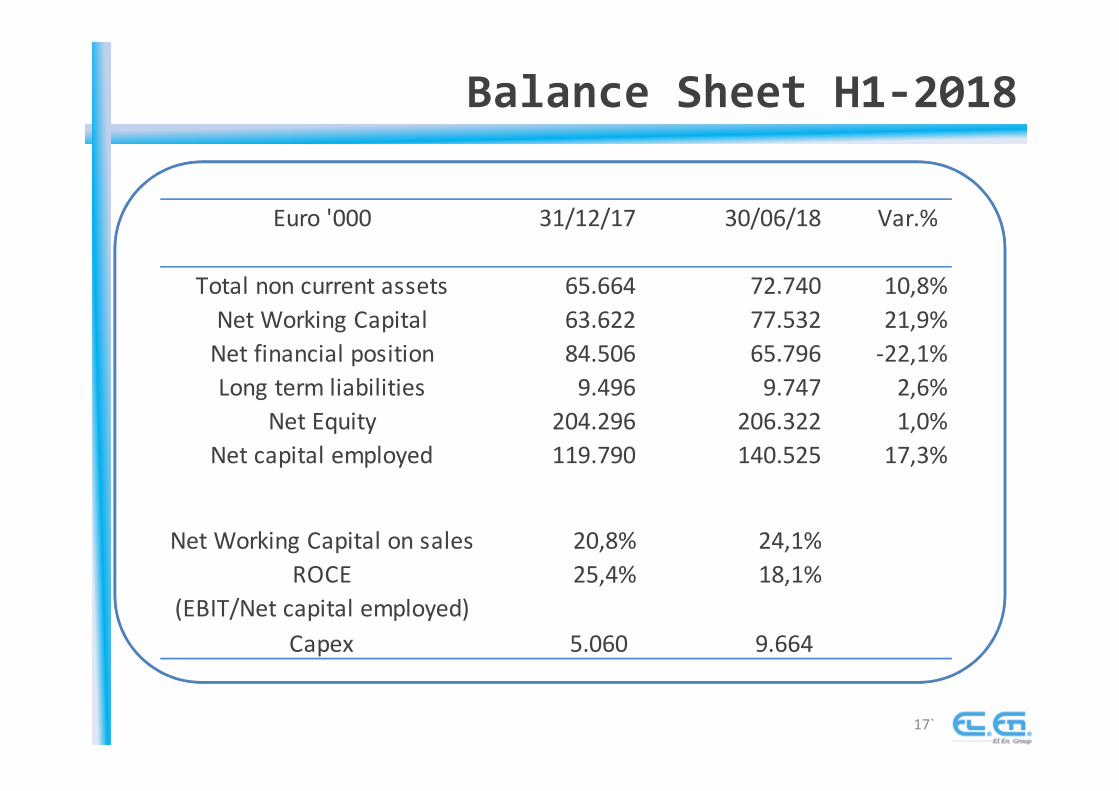
Balance Sheet H1-2018
17`
Euro '000 31/12/17 30/06/18 Var.%
Total non current assets 65.664 72.740 10,8%
Net Working Capital 63.622 77.532 21,9%
Net financial position 84.506 65.796 -22,1%
Long term liabilities 9.496 9.747 2,6%
Net Equity 204.296 206.322 1,0%
Net capital employed 119.790 140.525 17,3%
Net Working Capital on sales 20,8% 24,1%
ROCE
(EBIT/Net capital employed)
25,4% 18,1%
Capex 5.060 9.664

Cash flow Statement H1-2018
18`
50.000
60.000
70.000
80.000
90.000
100.000
+ -

14,24,6
41,2
15,8
6,3
45,0
Italy RoEU RoW
Industrial 2017
2018
Revenue breakdown H1-2018
19
in Euro million
+9%
+37%
+11%
13,819,6
49,5
15,025,1
53,5
Italy RoEU RoW
Medical2017
2018
+8%
+28%
+8%

48,4
14,34,8
15,1
51,1
21,2
5,315,7
Aesthetic Surgical Physioth. Service
2017
2018
Revenue breakdown H1-2018
20
+5%
+4%
in Euro million
+48%
+10%
45,5
8,2 1,8 4,3
51,9
8,3 2,1 4,6
Cutting Marking Laser sources Service
2017
2018
+14%
+1%
+13% +7%
Industrial
Medical

Guidance
21
2018 vs 2017:
Revenue: >+10%
EBIT: +10%

22
Multiples & Comparables

Multiples
23
Stockholder's Equity per share 9,9
Price / Book Value Adj. 1,9
EV /EBIT (80% EBIT) 13,8
EV / Sales (80% Sales) 1,1
El.En. Market Cap. 359,5 @ € 18,63
Net financial position 65,8 @ 30/06/18
Financial investments m/l term 12,2 @ 30/06/18
Enterprise Value 281,6
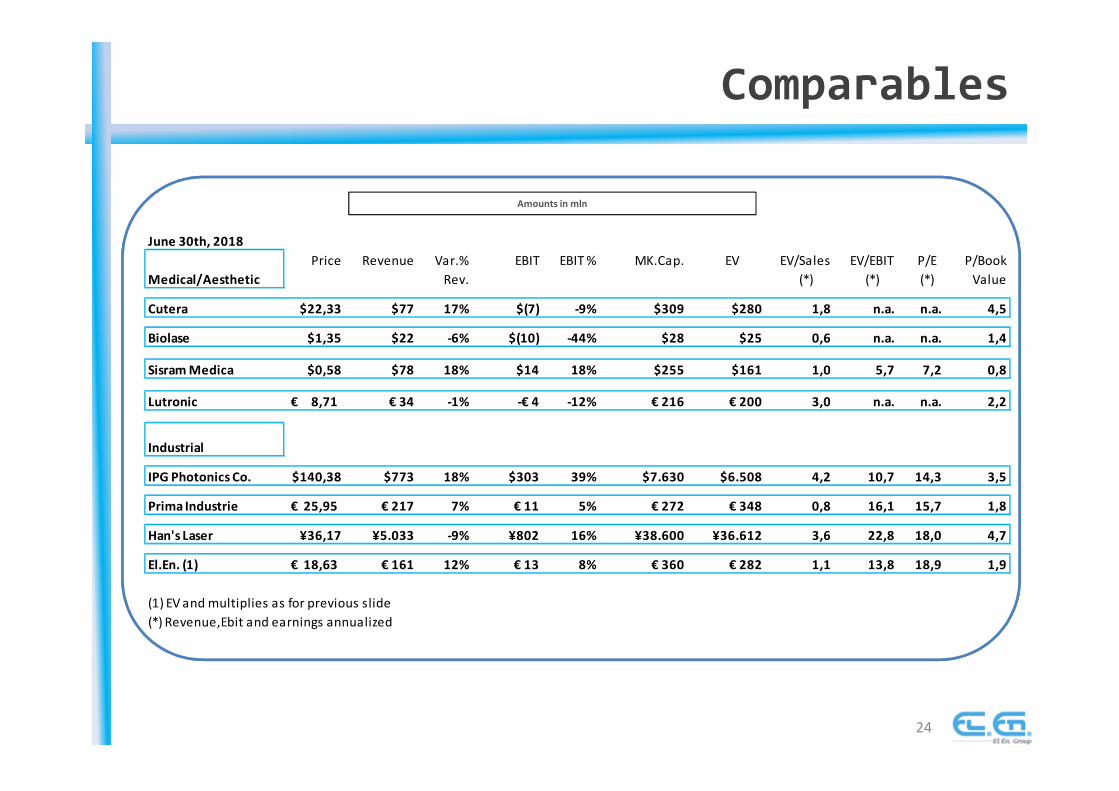
Comparables
24
Amounts in mln
June 30th, 2018
Medical/Aesthetic
Price Revenue Var.%
Rev.
EBIT EBIT % MK.Cap. EV EV/Sales
(*)
EV/EBIT
(*)
P/E
(*)
P/Book
Value
Cutera $22,33 $77 17% $(7) -9% $309 $280 1,8 n.a. n.a. 4,5
Biolase $1,35 $22 -6% $(10) -44% $28 $25 0,6 n.a. n.a. 1,4
Sisram Medica $0,58 $78 18% $14 18% $255 $161 1,0 5,7 7,2 0,8
Lutronic 8,71€ € 34 -1% -€ 4 -12% € 216 € 200 3,0 n.a. n.a. 2,2
Industrial
IPG Photonics Co. $140,38 $773 18% $303 39% $7.630 $6.508 4,2 10,7 14,3 3,5
Prima Industrie 25,95€ € 217 7% € 11 5% € 272 € 348 0,8 16,1 15,7 1,8
Han's Laser ¥36,17 ¥5.033 -9% ¥802 16% ¥38.600 ¥36.612 3,6 22,8 18,0 4,7
El.En. (1) 18,63€ € 161 12% € 13 8% € 360 € 282 1,1 13,8 18,9 1,9
(1) EV and multiplies as for previous slide
(*) Revenue,Ebit and earnings annualized

El.En. SPAEnrico ROMAGNOLI
Investor Relations Manager
tel. +39 055-8826807
E-mail: [email protected]
POLYTEMS HIR Financial Communication, IR and Press Office
Bianca FERSINI MASTELLONI - [email protected]
Silvia MARONGIU - [email protected]
Tel. +39 06-69923324
Contacts