elements of the policy agenda for higher education alabama association for institutional research...
TRANSCRIPT

Elements of the Policy Agenda for Higher Education
Alabama Association for Institutional Research
April 4, 2008
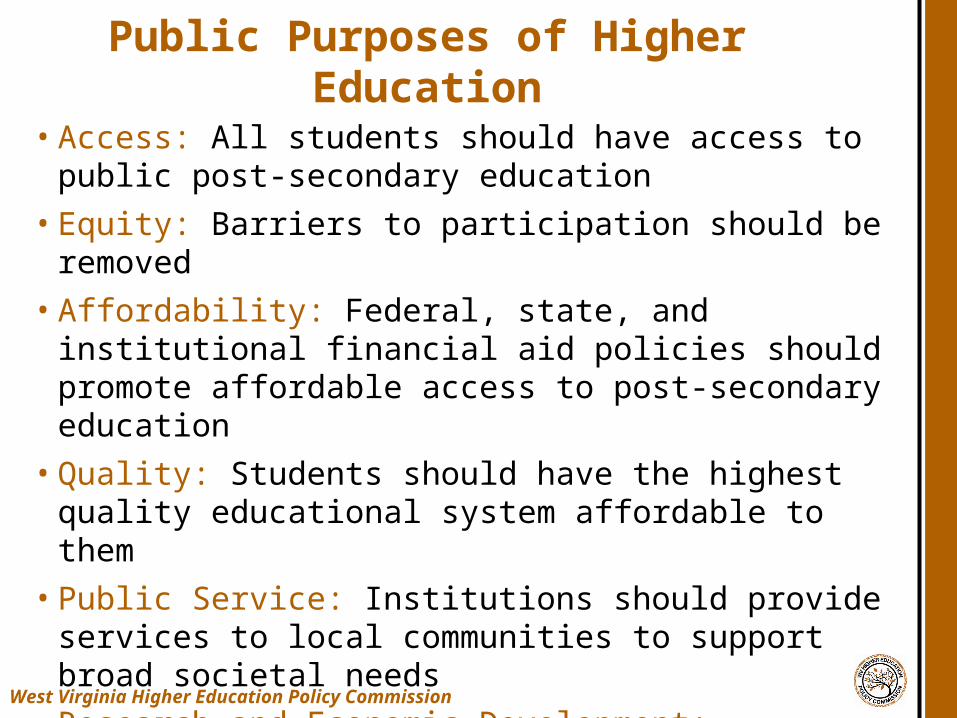
• Access: All students should have access to public post-secondary education
• Equity: Barriers to participation should be removed
• Affordability: Federal, state, and institutional financial aid policies should promote affordable access to post-secondary education
• Quality: Students should have the highest quality educational system affordable to them
• Public Service: Institutions should provide services to local communities to support broad societal needs
• Research and Economic Development: Institutions serve as the driver of the current economy and vehicle for expansion of the knowledge economy.
Public Purposes of Higher Education
West Virginia Higher Education Policy Commission
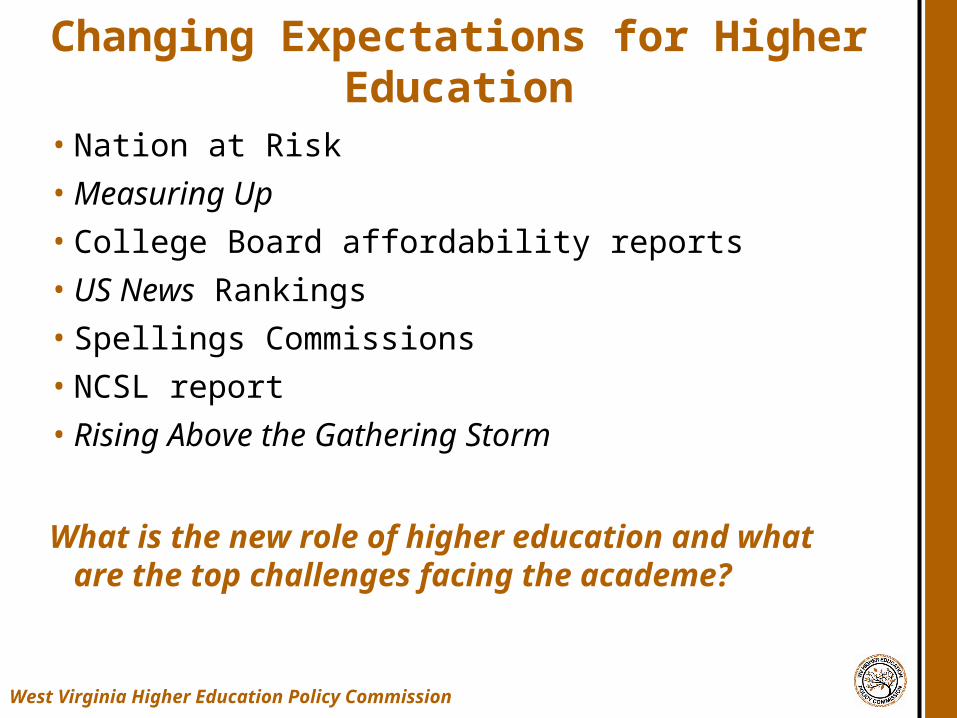
• Nation at Risk
• Measuring Up
• College Board affordability reports
• US News Rankings
• Spellings Commissions
• NCSL report
• Rising Above the Gathering Storm
What is the new role of higher education and what are the top challenges facing the academe?
Changing Expectations for Higher Education
West Virginia Higher Education Policy Commission
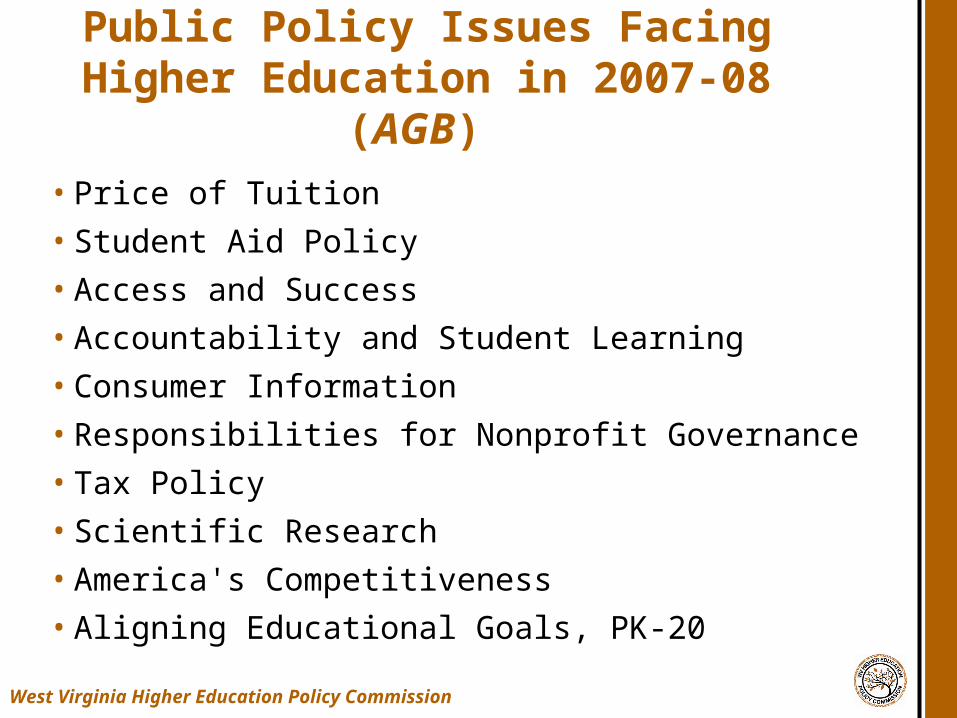
• Price of Tuition
• Student Aid Policy
• Access and Success
• Accountability and Student Learning
• Consumer Information
• Responsibilities for Nonprofit Governance
• Tax Policy
• Scientific Research
• America's Competitiveness
• Aligning Educational Goals, PK-20
Public Policy Issues Facing Higher Education in 2007-08 (AGB)
West Virginia Higher Education Policy Commission
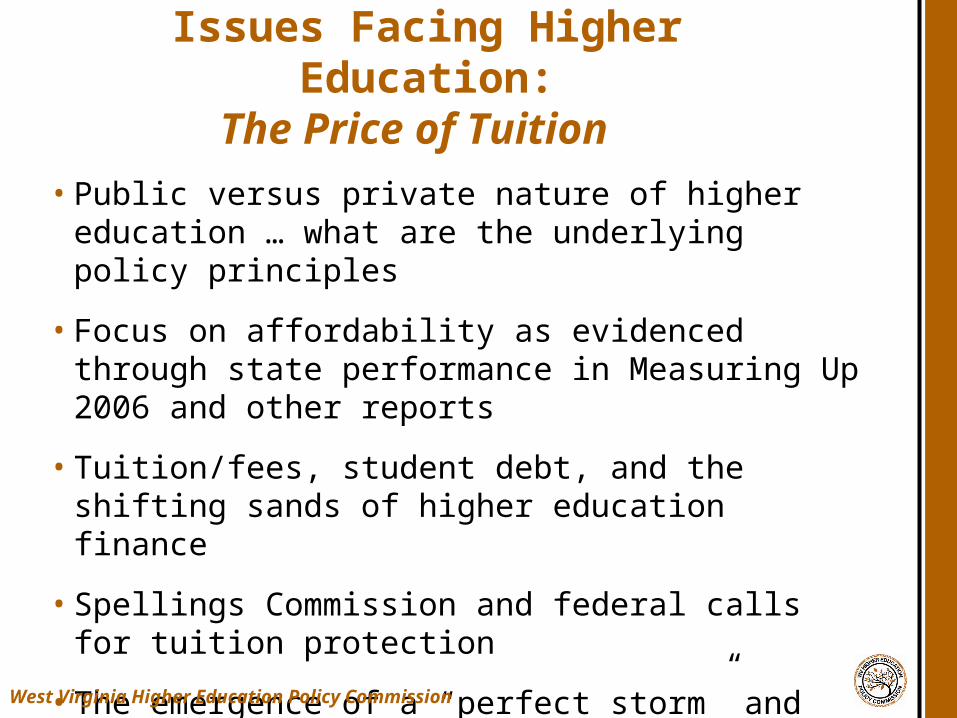
• Public versus private nature of higher education … what are the underlying policy principles
• Focus on affordability as evidenced through state performance in Measuring Up 2006 and other reports
• Tuition/fees, student debt, and the shifting sands of higher education finance
• Spellings Commission and federal calls for tuition protection
• The emergence of a “perfect storm” and the growing need to link policy mechanisms
Issues Facing Higher Education:The Price of Tuition
West Virginia Higher Education Policy Commission
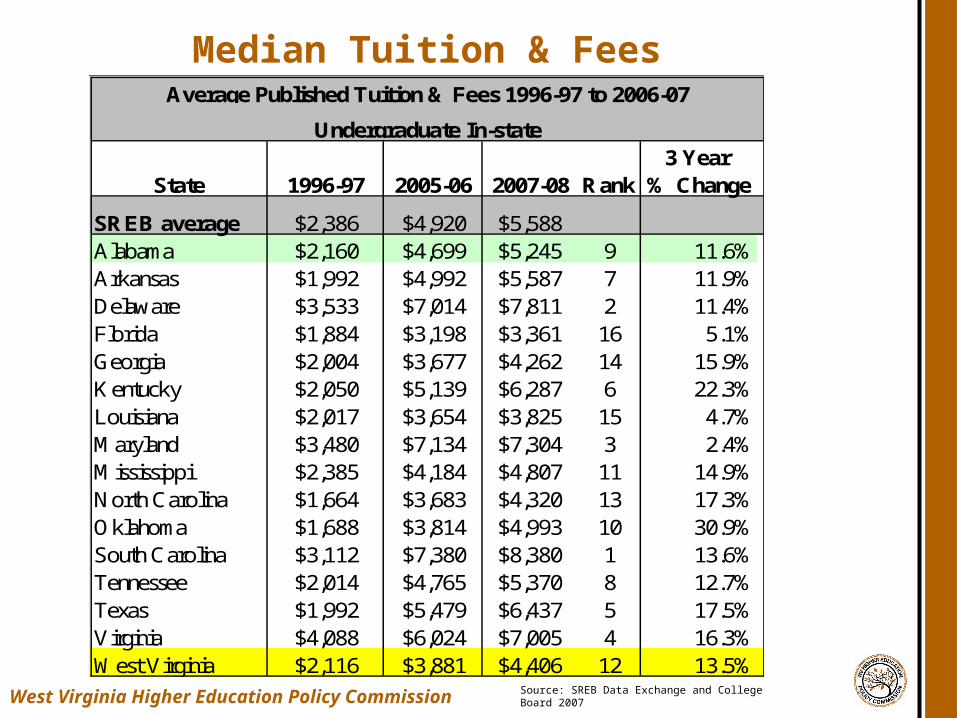
Median Tuition & Fees
Source: SREB Data Exchange and College Board 2007West Virginia Higher Education Policy Commission
3 Year State 1996-97 2005-06 2007-08 Rank % Change
SREB average $2,386 $4,920 $5,588Alabama $2,160 $4,699 $5,245 9 11.6%Arkansas $1,992 $4,992 $5,587 7 11.9%Delaware $3,533 $7,014 $7,811 2 11.4%Florida $1,884 $3,198 $3,361 16 5.1%Georgia $2,004 $3,677 $4,262 14 15.9%Kentucky $2,050 $5,139 $6,287 6 22.3%Louisiana $2,017 $3,654 $3,825 15 4.7%Maryland $3,480 $7,134 $7,304 3 2.4%Mississippi $2,385 $4,184 $4,807 11 14.9%North Carolina $1,664 $3,683 $4,320 13 17.3%Oklahoma $1,688 $3,814 $4,993 10 30.9%South Carolina $3,112 $7,380 $8,380 1 13.6%Tennessee $2,014 $4,765 $5,370 8 12.7%Texas $1,992 $5,479 $6,437 5 17.5%Virginia $4,088 $6,024 $7,005 4 16.3%West Virginia $2,116 $3,881 $4,406 12 13.5%
Average Published Tuition & Fees 1996-97 to 2006-07
Undergraduate In-state
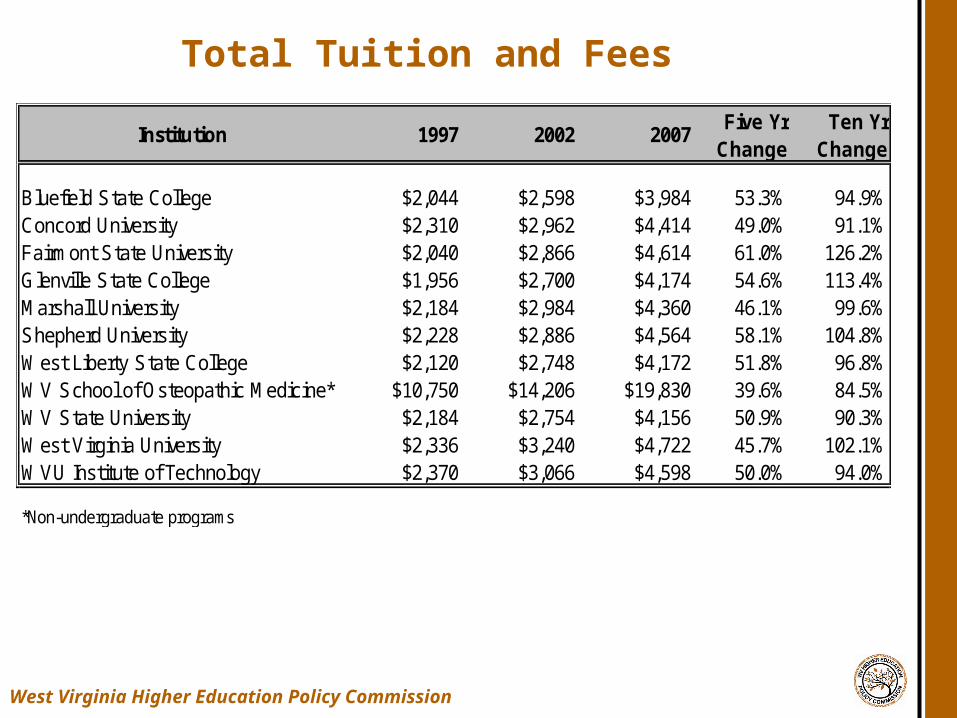
Total Tuition and Fees
West Virginia Higher Education Policy Commission
Institution 1997 2002 2007Five Yr
ChangeTen Yr
Change
Bluefield State College $2,044 $2,598 $3,984 53.3% 94.9%Concord University $2,310 $2,962 $4,414 49.0% 91.1%Fairmont State University $2,040 $2,866 $4,614 61.0% 126.2%Glenville State College $1,956 $2,700 $4,174 54.6% 113.4%Marshall University $2,184 $2,984 $4,360 46.1% 99.6%Shepherd University $2,228 $2,886 $4,564 58.1% 104.8%West Liberty State College $2,120 $2,748 $4,172 51.8% 96.8%WV School of Osteopathic Medicine* $10,750 $14,206 $19,830 39.6% 84.5%WV State University $2,184 $2,754 $4,156 50.9% 90.3%West Virginia University $2,336 $3,240 $4,722 45.7% 102.1%WVU Institute of Technology $2,370 $3,066 $4,598 50.0% 94.0%
*Non-undergraduate programs
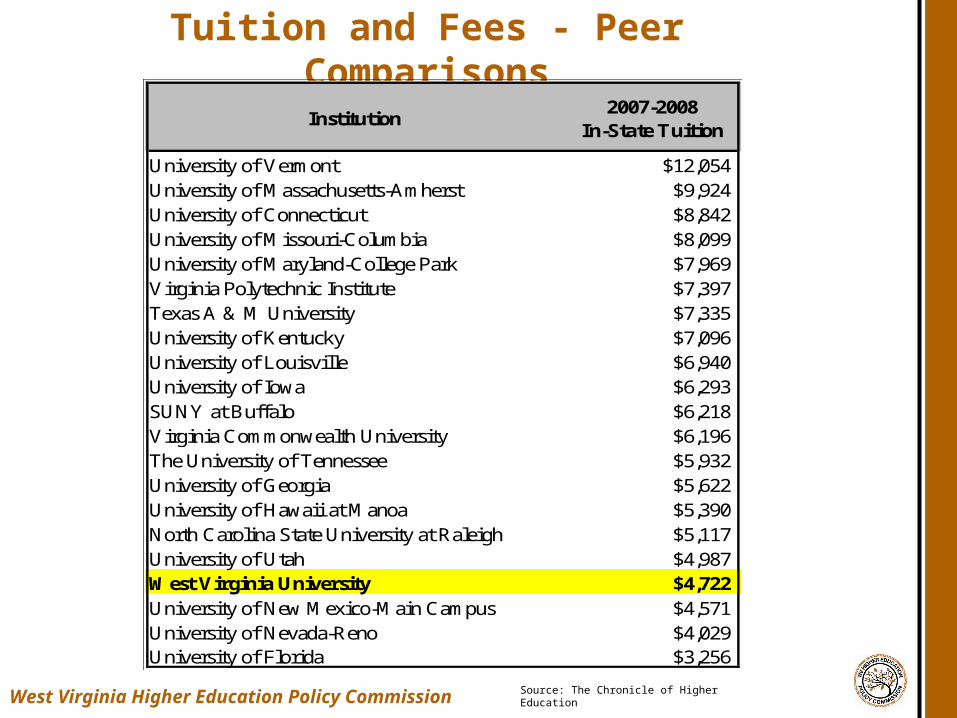
Tuition and Fees - Peer Comparisons
Source: The Chronicle of Higher EducationWest Virginia Higher Education Policy Commission
Institution2007-2008
In-State Tuition
University of Vermont $12,054University of Massachusetts-Amherst $9,924University of Connecticut $8,842University of Missouri-Columbia $8,099University of Maryland-College Park $7,969Virginia Polytechnic Institute $7,397Texas A & M University $7,335University of Kentucky $7,096University of Louisville $6,940University of Iowa $6,293SUNY at Buffalo $6,218Virginia Commonwealth University $6,196The University of Tennessee $5,932University of Georgia $5,622University of Hawaii at Manoa $5,390North Carolina State University at Raleigh $5,117University of Utah $4,987West Virginia University $4,722University of New Mexico-Main Campus $4,571University of Nevada-Reno $4,029University of Florida $3,256
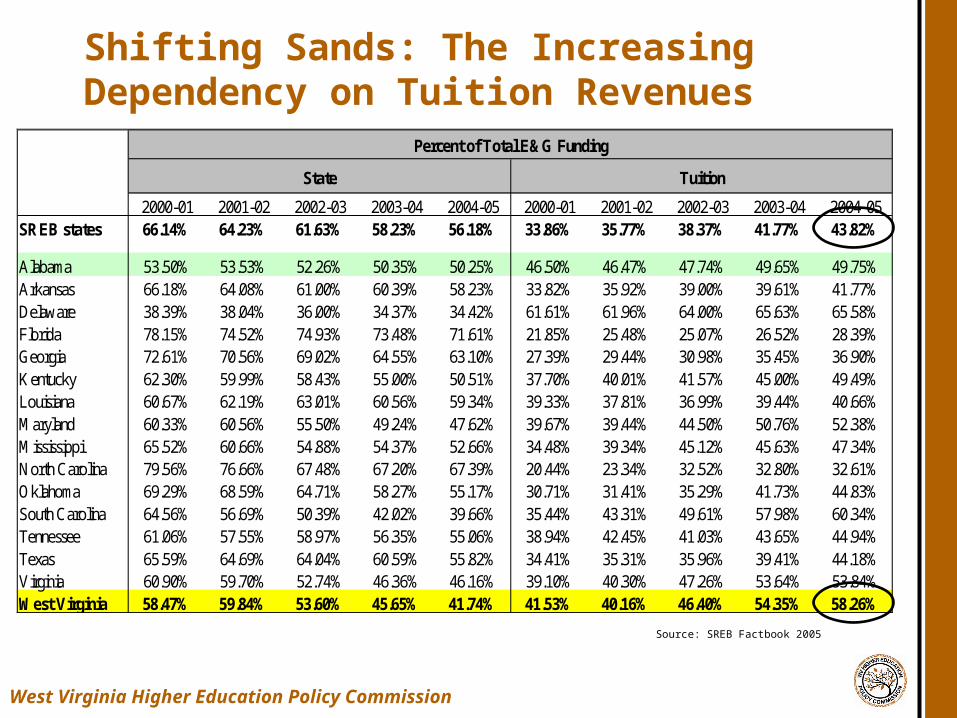
Shifting Sands: The Increasing Dependency on Tuition Revenues
2000-01 2001-02 2002-03 2003-04 2004-05 2000-01 2001-02 2002-03 2003-04 2004-05SREB states 66.14% 64.23% 61.63% 58.23% 56.18% 33.86% 35.77% 38.37% 41.77% 43.82%
Alabama 53.50% 53.53% 52.26% 50.35% 50.25% 46.50% 46.47% 47.74% 49.65% 49.75%Arkansas 66.18% 64.08% 61.00% 60.39% 58.23% 33.82% 35.92% 39.00% 39.61% 41.77%Delaware 38.39% 38.04% 36.00% 34.37% 34.42% 61.61% 61.96% 64.00% 65.63% 65.58%Florida 78.15% 74.52% 74.93% 73.48% 71.61% 21.85% 25.48% 25.07% 26.52% 28.39%Georgia 72.61% 70.56% 69.02% 64.55% 63.10% 27.39% 29.44% 30.98% 35.45% 36.90%Kentucky 62.30% 59.99% 58.43% 55.00% 50.51% 37.70% 40.01% 41.57% 45.00% 49.49%Louisiana 60.67% 62.19% 63.01% 60.56% 59.34% 39.33% 37.81% 36.99% 39.44% 40.66%Maryland 60.33% 60.56% 55.50% 49.24% 47.62% 39.67% 39.44% 44.50% 50.76% 52.38%Mississippi 65.52% 60.66% 54.88% 54.37% 52.66% 34.48% 39.34% 45.12% 45.63% 47.34%North Carolina 79.56% 76.66% 67.48% 67.20% 67.39% 20.44% 23.34% 32.52% 32.80% 32.61%Oklahoma 69.29% 68.59% 64.71% 58.27% 55.17% 30.71% 31.41% 35.29% 41.73% 44.83%South Carolina 64.56% 56.69% 50.39% 42.02% 39.66% 35.44% 43.31% 49.61% 57.98% 60.34%Tennessee 61.06% 57.55% 58.97% 56.35% 55.06% 38.94% 42.45% 41.03% 43.65% 44.94%Texas 65.59% 64.69% 64.04% 60.59% 55.82% 34.41% 35.31% 35.96% 39.41% 44.18%Virginia 60.90% 59.70% 52.74% 46.36% 46.16% 39.10% 40.30% 47.26% 53.64% 53.84%West Virginia 58.47% 59.84% 53.60% 45.65% 41.74% 41.53% 40.16% 46.40% 54.35% 58.26%
State Tuition
Percent of Total E&G Funding
Source: SREB Factbook 2005
West Virginia Higher Education Policy Commission
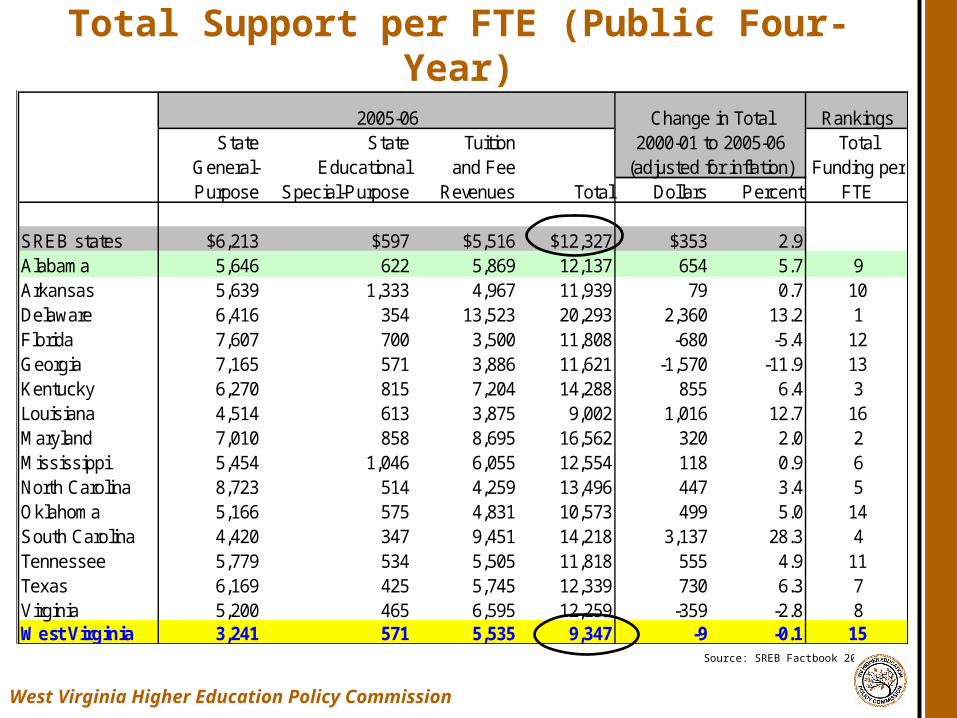
Total Support per FTE (Public Four-Year)
Source: SREB Factbook 2007
2005-06 Change in Total RankingsState State Tuition 2000-01 to 2005-06
General- Educational and Fee (adjusted for inflation)Purpose Special-Purpose Revenues Total Dollars Percent
SREB states $6,213 $597 $5,516 $12,327 $353 2.9Alabama 5,646 622 5,869 12,137 654 5.7 9Arkansas 5,639 1,333 4,967 11,939 79 0.7 10Delaware 6,416 354 13,523 20,293 2,360 13.2 1Florida 7,607 700 3,500 11,808 -680 -5.4 12Georgia 7,165 571 3,886 11,621 -1,570 -11.9 13Kentucky 6,270 815 7,204 14,288 855 6.4 3Louisiana 4,514 613 3,875 9,002 1,016 12.7 16Maryland 7,010 858 8,695 16,562 320 2.0 2Mississippi 5,454 1,046 6,055 12,554 118 0.9 6North Carolina 8,723 514 4,259 13,496 447 3.4 5Oklahoma 5,166 575 4,831 10,573 499 5.0 14South Carolina 4,420 347 9,451 14,218 3,137 28.3 4Tennessee 5,779 534 5,505 11,818 555 4.9 11Texas 6,169 425 5,745 12,339 730 6.3 7Virginia 5,200 465 6,595 12,259 -359 -2.8 8West Virginia 3,241 571 5,535 9,347 -9 -0.1 15
Total Funding per
FTE
West Virginia Higher Education Policy Commission
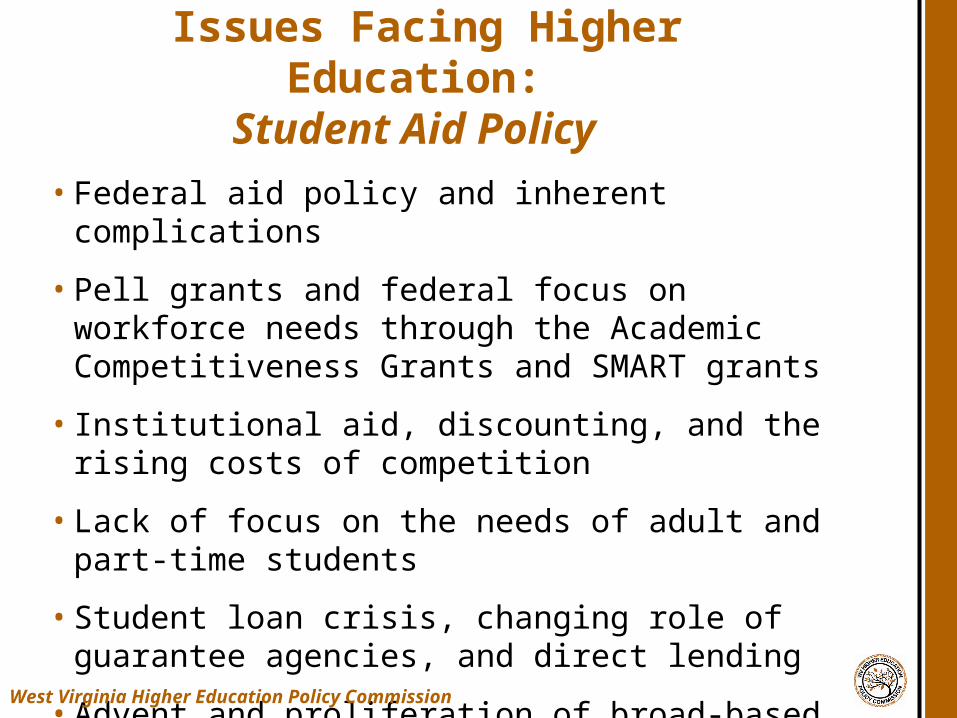
• Federal aid policy and inherent complications
• Pell grants and federal focus on workforce needs through the Academic Competitiveness Grants and SMART grants
• Institutional aid, discounting, and the rising costs of competition
• Lack of focus on the needs of adult and part-time students
• Student loan crisis, changing role of guarantee agencies, and direct lending
• Advent and proliferation of broad-based aid programs
Issues Facing Higher Education: Student Aid Policy
West Virginia Higher Education Policy Commission
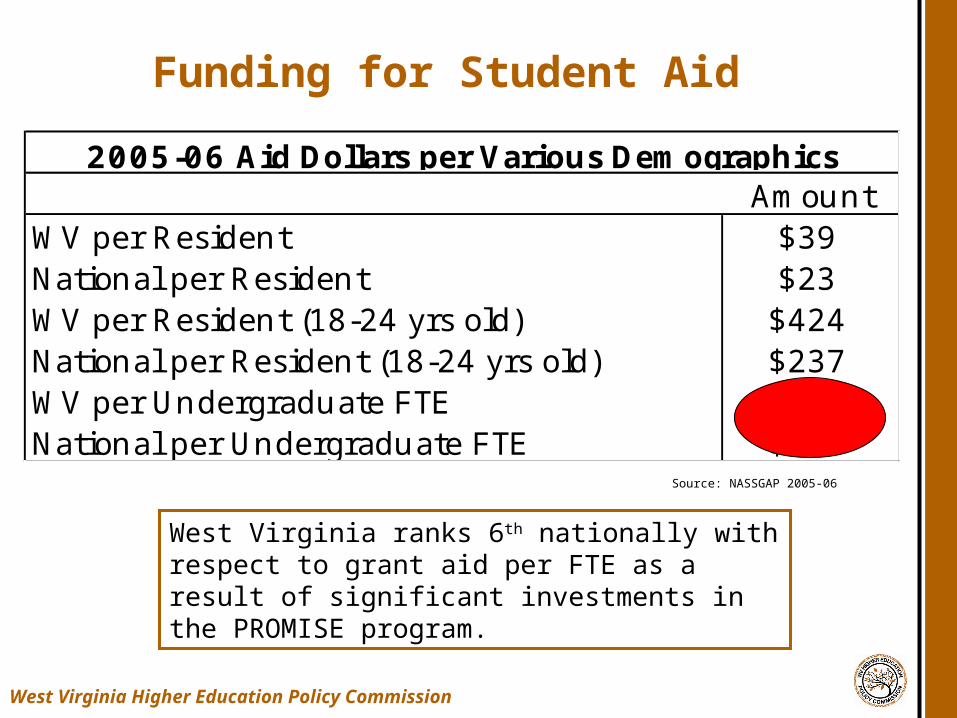
Funding for Student Aid
AmountWV per Resident $39National per Resident $23WV per Resident (18-24 yrs old) $424National per Resident (18-24 yrs old) $237WV per Undergraduate FTE $934National per Undergraduate FTE $575
2005-06 Aid Dollars per Various Demographics
Source: NASSGAP 2005-06
West Virginia ranks 6th nationally with respect to grant aid per FTE as a result of significant investments in the PROMISE program.
West Virginia Higher Education Policy Commission

State
Median Household
Income
Tuition and Fees (4 Year)
Tuition and Fees (2 Year)
Net Price (4 Year)
Alabama $37,150 12.1% 7.3% 26.5%Arkansas $36,658 12.3% 5.0% 25.7%Delaware $51,235 12.3% 4.3% 29.7%Florida $42,990 7.3% 4.4% 24.6%Georgia $45,926 6.5% 3.8% 23.7%Kentucky $36,699 13.1% 8.0% 22.2%Louisiana $37,236 8.7% 5.0% 22.6%Maryland $60,512 10.9% 4.8% 28.9%Mississippi $32,875 11.9% 5.3% 26.5%North Carolina $42,056 7.7% 3.1% 25.0%Oklahoma $37,645 8.6% 6.0% 22.9%South Carolina $40,230 16.2% 7.5% 32.4%Tennessee $39,406 11.2% 6.1% 27.1%Texas $41,422 11.4% 3.5% 26.3%Virginia $51,914 10.8% 4.1% 25.9%West Virginia $36,445 10.0% 7.2% 28.9%
Cost of Attendance
West Virginia Higher Education Policy Commission Source: SREB Factbook 2007; Measuring up 2006
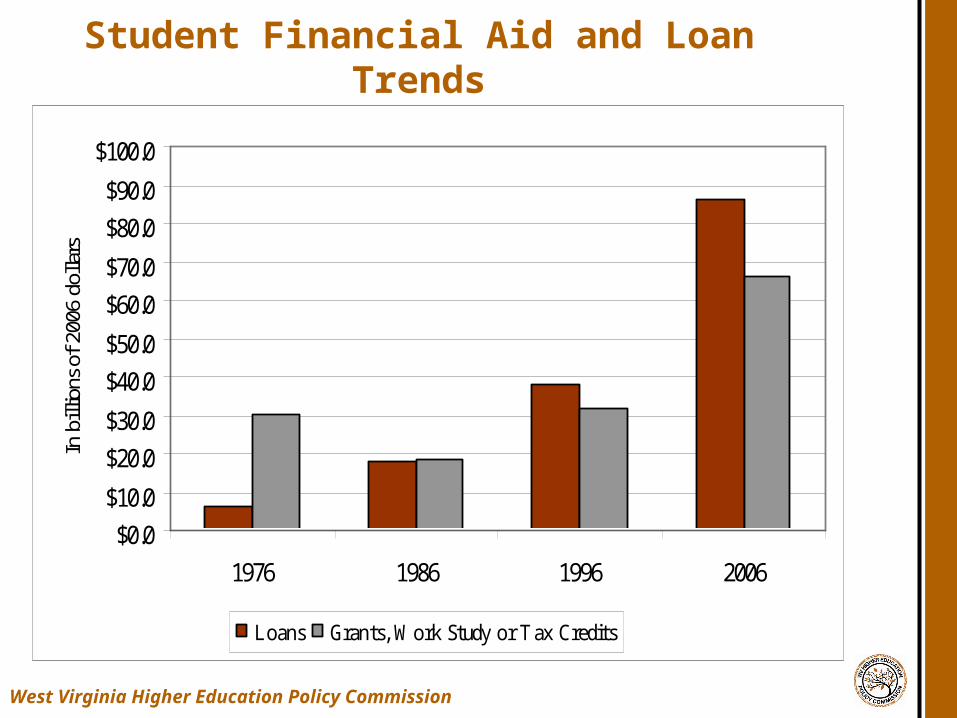
Student Financial Aid and Loan Trends
Source: The College Board
West Virginia Higher Education Policy Commission
$0.0
$10.0
$20.0
$30.0
$40.0
$50.0
$60.0
$70.0
$80.0
$90.0
$100.0
1976 1986 1996 2006
In b
illio
ns o
f 20
06 d
olla
rs
Loans Grants, Work Study or Tax Credits
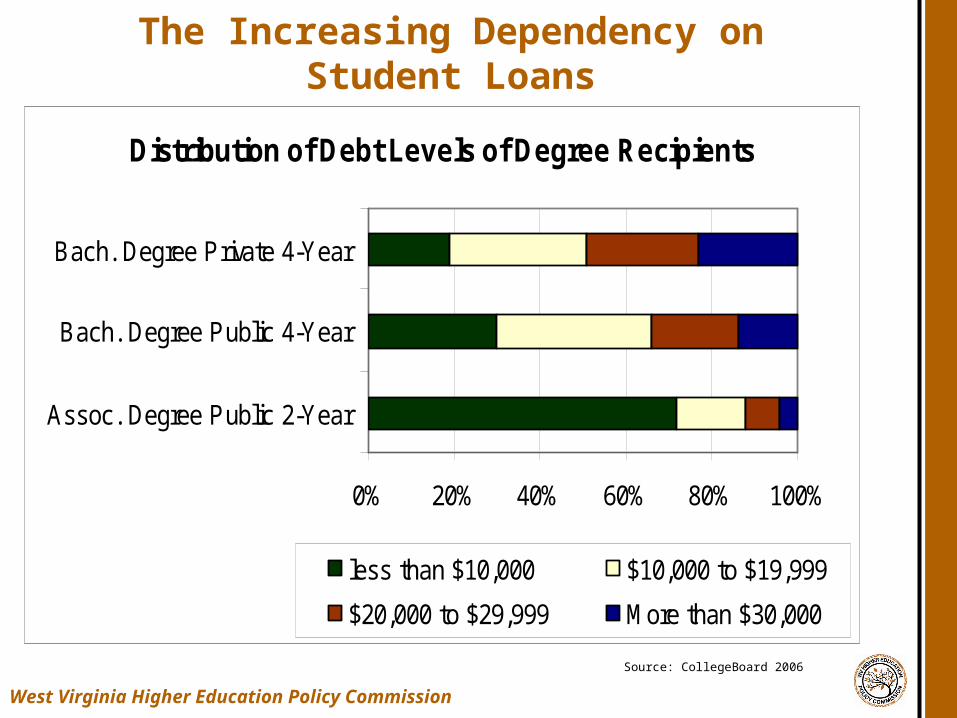
The Increasing Dependency on Student Loans
Source: CollegeBoard 2006
Distribution of Debt Levels of Degree Recipients
0% 20% 40% 60% 80% 100%
Assoc. Degree Public 2-Year
Bach. Degree Public 4-Year
Bach. Degree Private 4-Year
less than $10,000 $10,000 to $19,999
$20,000 to $29,999 More than $30,000
West Virginia Higher Education Policy Commission
Issues Facing Higher Education: Access and Success
West Virginia Higher Education Policy Commission
• Access pressures from minority, low-income, and emerging populations
• Adult students and the non-traditional challenge
• First generation college students in Appalachia
• Pressure from private and proprietary institutions
• The millennial, on-line learners, and changing access expectations
• Never ending transfer challenges
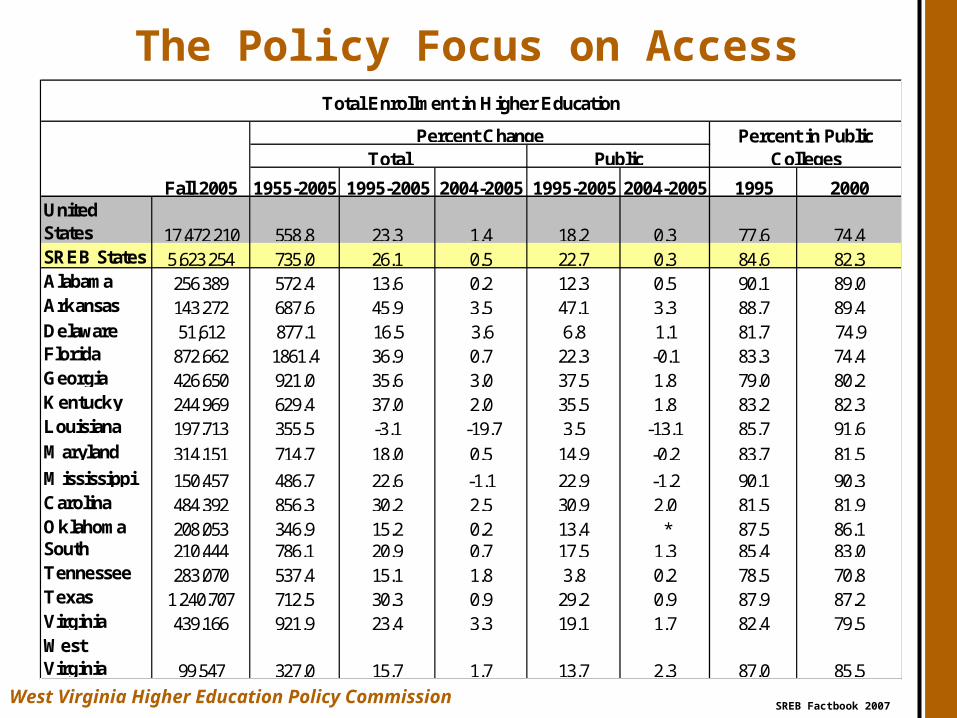
Fall 2005 1955-2005 1995-2005 2004-2005 1995-2005 2004-2005 1995 2000United States 17,472,210 558.8 23.3 1.4 18.2 0.3 77.6 74.4SREB States 5,623,254 735.0 26.1 0.5 22.7 0.3 84.6 82.3Alabama 256,389 572.4 13.6 0.2 12.3 0.5 90.1 89.0Arkansas 143,272 687.6 45.9 3.5 47.1 3.3 88.7 89.4Delaware 51,612 877.1 16.5 3.6 6.8 1.1 81.7 74.9Florida 872,662 1861.4 36.9 0.7 22.3 -0.1 83.3 74.4Georgia 426,650 921.0 35.6 3.0 37.5 1.8 79.0 80.2Kentucky 244,969 629.4 37.0 2.0 35.5 1.8 83.2 82.3Louisiana 197,713 355.5 -3.1 -19.7 3.5 -13.1 85.7 91.6Maryland 314,151 714.7 18.0 0.5 14.9 -0.2 83.7 81.5Mississippi 150,457 486.7 22.6 -1.1 22.9 -1.2 90.1 90.3North Carolina 484,392 856.3 30.2 2.5 30.9 2.0 81.5 81.9Oklahoma 208,053 346.9 15.2 0.2 13.4 * 87.5 86.1South 210,444 786.1 20.9 0.7 17.5 1.3 85.4 83.0Tennessee 283,070 537.4 15.1 1.8 3.8 0.2 78.5 70.8Texas 1,240,707 712.5 30.3 0.9 29.2 0.9 87.9 87.2Virginia 439,166 921.9 23.4 3.3 19.1 1.7 82.4 79.5West Virginia 99,547 327.0 15.7 1.7 13.7 2.3 87.0 85.5
Total Enrollment in Higher Education
TotalPercent Change
PublicPercent in Public
Colleges
The Policy Focus on Access
SREB Factbook 2007West Virginia Higher Education Policy Commission

Age Distribution of College Students
Under 18 18 to 24 25 to 49 50 to 64 65 and Older
Age Unknown
United States 3.2 58.0 34.3 3.4 0.4 0.6SREB states 3.2 59.7 33.7 2.8 0.3 0.3
Alabama 2.0 60.9 34.2 2.4 0.2 0.2Arkansas 5.9 58.7 31.9 2.8 0.5 0.2Delaware 3.8 60.3 31.3 3.0 0.2 1.3Florida 2.4 58.0 36.0 3.1 0.2 0.2Georgia 1.8 60.7 34.6 2.6 0.2 0.1Kentucky 5.3 56.4 34.2 3.2 0.5 0.5Louisiana 2.0 66.8 28.7 2.0 0.4 0.2Maryland 2.3 54.3 38.7 3.7 0.8 0.2Mississippi 1.2 63.8 31.1 2.2 0.2 1.5North Carolina 3.6 58.3 34.3 3.3 0.2 0.2Oklahoma 1.3 61.2 34.1 2.9 0.3 0.2South Carolina 3.3 64.2 29.0 2.9 0.2 0.5Tennessee 1.8 61.7 33.5 2.6 0.1 0.3Texas 4.2 59.7 33.3 2.3 0.2 0.3Virginia 4.5 59.5 31.8 3.6 0.2 0.3West Virginia 4.4 62.6 29.7 3.0 0.1 0.1
Percent of Total Students, Fall 2005
Source: SREB Factbook 2007West Virginia Higher Education Policy Commission
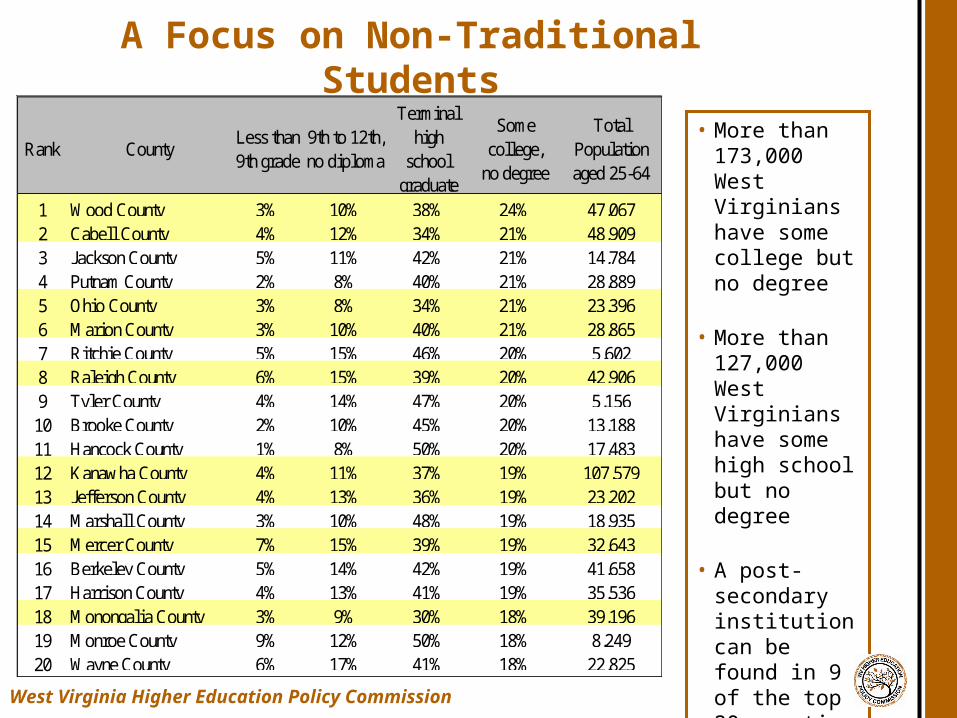
A Focus on Non-Traditional Students
• More than 173,000 West Virginians have some college but no degree
• More than 127,000 West Virginians have some high school but no degree
• A post-secondary institution can be found in 9 of the top 20 counties
Rank CountyLess than 9th grade
9th to 12th, no diploma
Terminal high
school graduate
Some college,
no degree
Total Population aged 25-64
1 Wood County 3% 10% 38% 24% 47,0672 Cabell County 4% 12% 34% 21% 48,9093 Jackson County 5% 11% 42% 21% 14,7844 Putnam County 2% 8% 40% 21% 28,8895 Ohio County 3% 8% 34% 21% 23,3966 Marion County 3% 10% 40% 21% 28,8657 Ritchie County 5% 15% 46% 20% 5,6028 Raleigh County 6% 15% 39% 20% 42,9069 Tyler County 4% 14% 47% 20% 5,156
10 Brooke County 2% 10% 45% 20% 13,18811 Hancock County 1% 8% 50% 20% 17,48312 Kanawha County 4% 11% 37% 19% 107,57913 Jefferson County 4% 13% 36% 19% 23,20214 Marshall County 3% 10% 48% 19% 18,93515 Mercer County 7% 15% 39% 19% 32,64316 Berkeley County 5% 14% 42% 19% 41,65817 Harrison County 4% 13% 41% 19% 35,53618 Monongalia County 3% 9% 30% 18% 39,19619 Monroe County 9% 12% 50% 18% 8,24920 Wayne County 6% 17% 41% 18% 22,825
West Virginia Higher Education Policy Commission

• The Spelling’s Commission found that …. Unit level data should be collected and available at the federal level Third party organizations should be encouraged to publish objective studies Student learning should be measured using tools such as the Collegiate Learning Assessment and the Measure of Academic Proficiency and Progress Interstate comparisons should be encouraged on measures such as adult literacy and general skills tests outcomes Accreditation agencies should examining learning outcomes more closely and share findings among states
Issues Facing Higher Education: Accountability and Student Learning
West Virginia Higher Education Policy Commission

• US News and World Report, Peterson’s and others dominate the landscape
• Voluntary system of accountability
• Targeted accent on graduation rates
• Challenges to accrediting agencies
• Calls for cost controls and new measures of performance
• Turn back the clock – Performance Funding re-emerges on the national landscape
• Need for reform of the general education core
• National exit exams on the horizon?
Implications of the National Focus on Accountability and Student Learning
West Virginia Higher Education Policy Commission
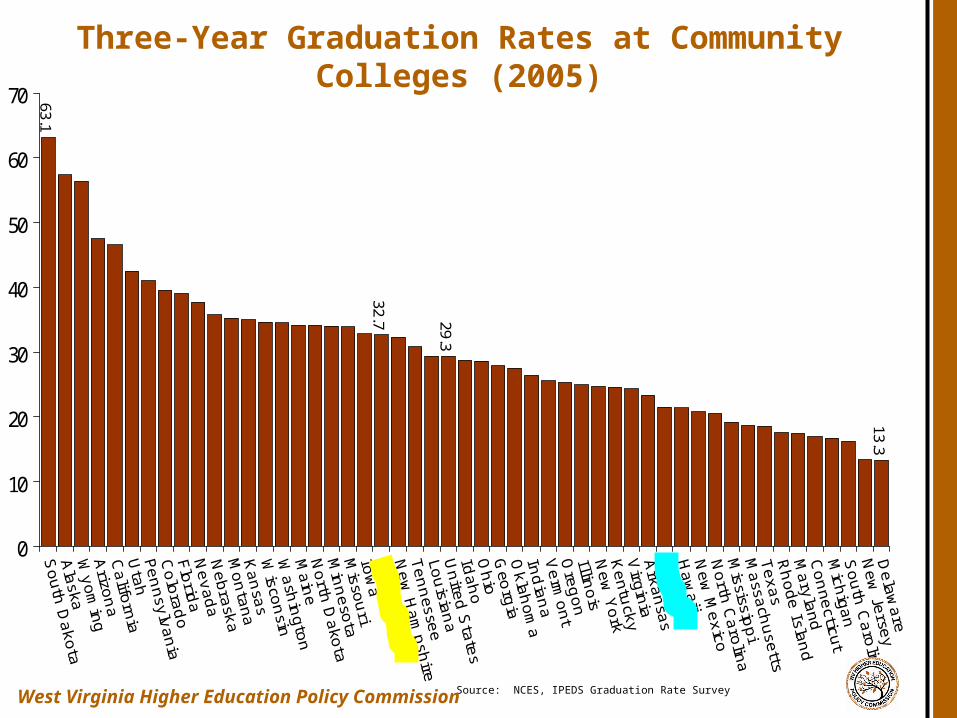
Three-Year Graduation Rates at Community Colleges (2005)
32.7
63.1
13.3
29.3
0
10
20
30
40
50
60
70
Source: NCES, IPEDS Graduation Rate SurveyWest Virginia Higher Education Policy Commission

Six-Year Graduation Rates at Four-Year Colleges (2005)
43.2
55.8
20.3
67.7
0
10
20
30
40
50
60
70
Source: NCES, IPEDS Graduation Rate SurveyWest Virginia Higher Education Policy Commission
• Issues of structure remain constant
• Institutional flexibility and the Virginia experiment
• Legislative – gubernatorial tensions
• Coordination v. Governance
• Accountability v. Autonomy
• Challenges of lay board governance and the need for professional development
• Responsibilities for more effective nonprofit governance
Issues Facing Higher Education: Governance
West Virginia Higher Education Policy Commission
• Federal protections such as the Hope and lifetime learning tax credits
• The Maine Compact and other state efforts to diversify payments
• Realization that most credits are back-end … tax credits upon degree completion may not open doors for traditionally disadvantaged groups
• State tax capacity and the balancing wheel
Issues Facing Higher Education: Tax Policy
West Virginia Higher Education Policy Commission
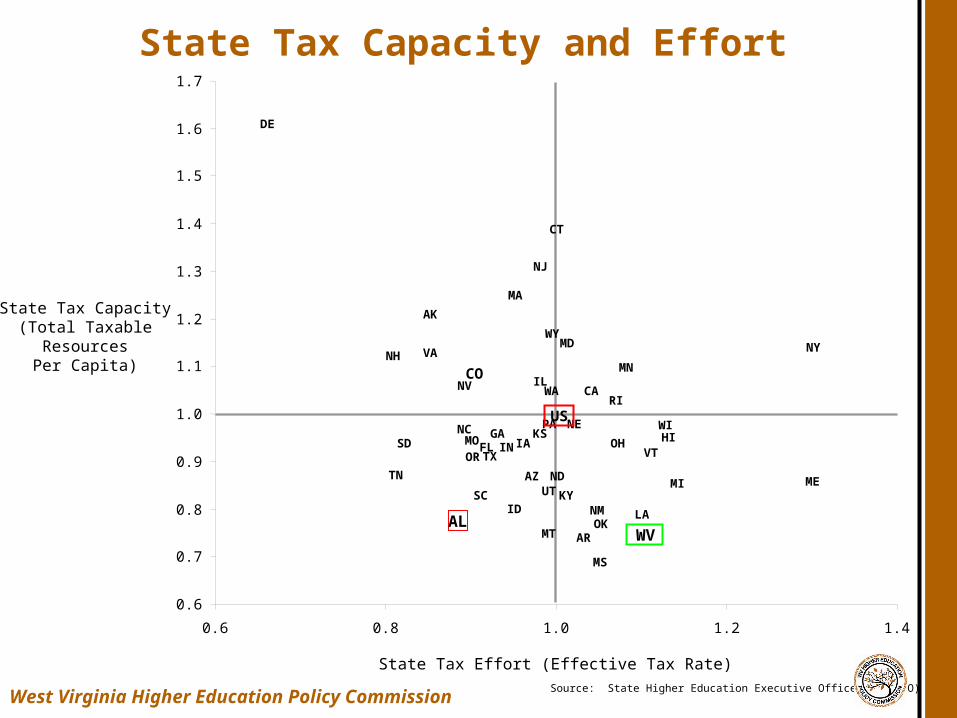
State Tax Capacity and Effort
Source: State Higher Education Executive Officers (SHEEO)
AL
AK
AZ
AR
CACO
CT
DE
GA HI
IL
IN IAKS
KY
LA
ME
MD
MA
MS
MT
NE
NV
NJ
NY
NC
ND
OH
OK
OR
PA
RI
SC
SD
UT
VT
VA
WA
US
FL
ID
MI
MN
MO
NH
NM
TN
TX
WV
WI
WY
0.6
0.7
0.8
0.9
1.0
1.1
1.2
1.3
1.4
1.5
1.6
1.7
0.6 0.8 1.0 1.2 1.4
State Tax Capacity (Total Taxable Resources
Per Capita)
State Tax Effort (Effective Tax Rate)
West Virginia Higher Education Policy Commission

State and Local Surplus as a % of Revenues (Boyd 2005)
Delaware -1.0Maryland -2.1Arkansas -4.2Virginia -4.2Oklahoma -4.3West Virginia -4.8Kentucky -4.8Georgia -5.2North Carolina -6.7Florida -6.8South Carolina -7.0Texas -8.9Tennessee -9.3Mississippi -9.8Louisiana -10.5Alabama -10.7
U.S. Avg. -5.7
All states will face continuing difficulty financing current services with existing revenue structures, and will not have resources for real increases in spending.
A total of 50 states face gaps under these assumptions, with 12 states facing gaps of 7 percent or more of revenue.
While these gaps are smaller than the current crisis-induced gaps in many state budgets that have resulted from swift sharp shifts in the economy and financial markets, they suggest that even after this crisis states and local governments will face continuing stress.
West Virginia Higher Education Policy Commission
• Global challenges and the China Syndrome
• Rising Above the Gathering Storm
• Renewed focus on research at the federal and state levels
• Kentucky’s bucks for brains efforts
• STEM fields
• K-20 issues
• Teacher education
Issues Facing Higher Education: Global Competitiveness and Research
West Virginia Higher Education Policy Commission

0
20
40
60
Age 25-34
Age 45-54
Differences in College Attainment (Associate and Higher) Between Young and Older Adults—U.S. and OECD Countries, 2004
Source: Education at a Glance 2006, OECDWest Virginia Higher Education Policy Commission
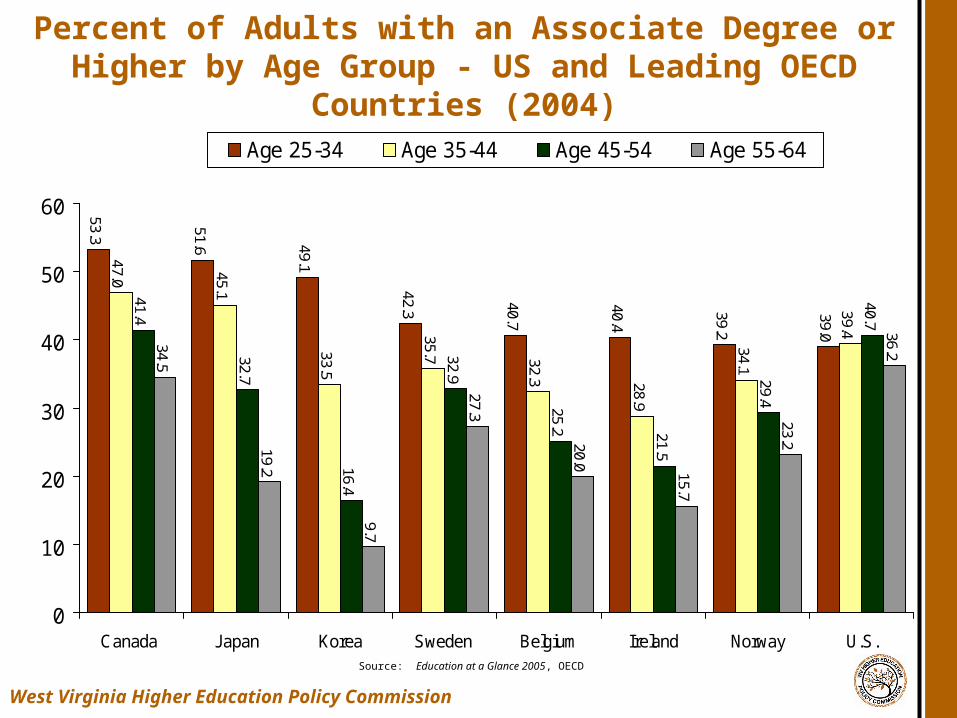
Percent of Adults with an Associate Degree or Higher by Age Group - US and Leading OECD Countries (2004)
Source: Education at a Glance 2005, OECD
53.3
51.6 49.1
42.3 40.7
40.4
39.2
39.0
47.0 45.1
33.5
35.7 32.3 28.9
34.1
39.4
41.4
32.7
16.4
32.9
25.2 21.5
29.4
40.7
34.5
19.2
9.7
27.3
20.0
15.7
23.2
36.2
0
10
20
30
40
50
60
Canada Japan Korea Sweden Belgium Ireland Norway U.S.
Age 25-34 Age 35-44 Age 45-54 Age 55-64
West Virginia Higher Education Policy Commission

• Educational Pipeline
• Student Preparation
• Curricula alignment
• Remediation Challenges
• Teacher education
• Professional development
• Cultural aspects, outreach, Gear Up
• PROMISE scholarships
Issues Facing Higher Education: Aligning Education K-20
West Virginia Higher Education Policy Commission

ACT-SAT Performance
Percent Tested
Average Score
Percent Tested
Average Score
Percent Tested
Average Score
Percent Tested
Average Score
Percent Tested
Average Score
Percent Tested
Average Score
Nation 34% 20.6 39% 20.8 42% 21.2 42% 1001 46% 1020 48% 1017AL 59% 19.8 75% 20.1 81% 20.3 8% 1090 10% 1119 9% 1119AR 63% 20.0 75% 20.2 75% 20.5 6% 1085 6% 1116 5% 1144DE 3% 21.9 2% 21.3 9% 21.7 68% 1000 71% 1002 72% 993FL 32% 20.7 40% 20.4 54% 19.9 47% 987 59% 995 65% 993GA 15% 20.4 22% 19.8 34% 20.3 64% 948 70% 980 69% 989KY 63% 20.0 71% 20.0 77% 20.7 11% 1083 11% 1102 10% 1132LA 74% 19.4 78% 19.6 79% 20.1 10% 1087 8% 1120 7% 1136MD 5% 20.2 11% 20.4 14% 21.6 62% 1008 67% 1020 70% 1002MS 70% 18.8 86% 18.6 96% 18.9 4% 1097 4% 1106 4% 1117NC 5% 19.5 13% 19.9 16% 21.0 57% 961 67% 998 71% 1004OK 64% 20.0 71% 20.5 71% 20.7 9% 1102 8% 1127 6% 1149SC 5% 19.1 35% 19.2 43% 19.6 64% 938 66% 981 62% 984TN 62% 20.2 95% 20.0 96% 20.7 12% 1107 16% 1117 13% 1143TX 31% 19.9 30% 20.1 30% 20.5 47% 980 51% 991 52% 999VA 4% 21.2 11% 20.6 18% 21.4 66% 995 68% 1016 73% 1022WV 56% 19.8 64% 20.3 66% 20.6 18% 1027 19% 1040 20% 1023
2007SATACT
1992 2007 19922002 2002
West Virginia Higher Education Policy Commission
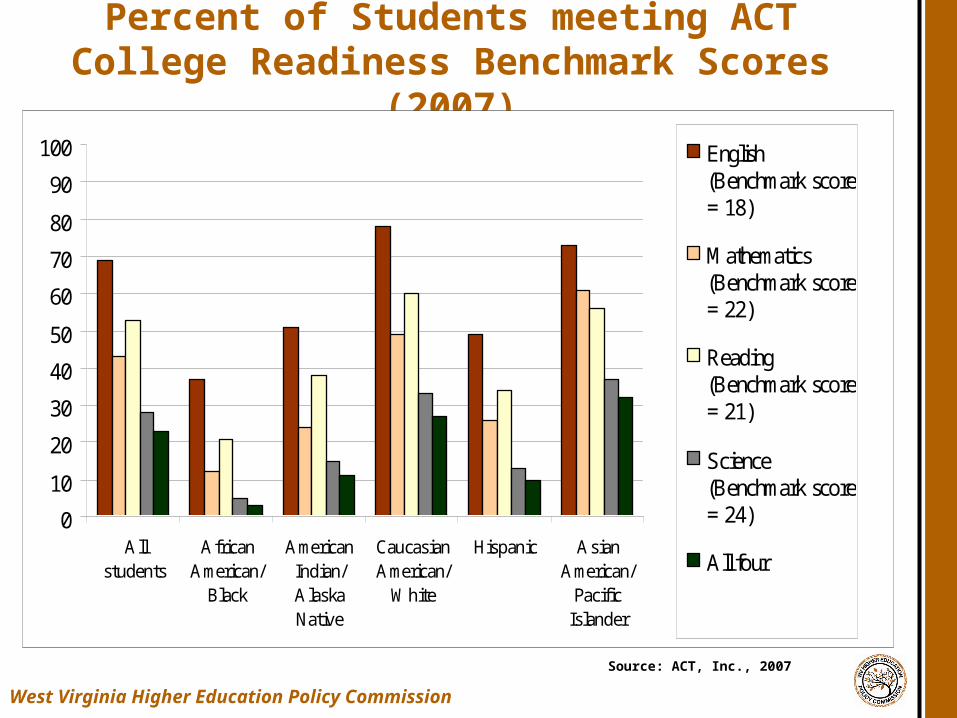
Percent of Students meeting ACT College Readiness Benchmark Scores (2007)
West Virginia Higher Education Policy Commission
0
10
20
30
40
50
60
70
80
90
100
Allstudents
AfricanAmerican/
Black
AmericanIndian/AlaskaNative
CaucasianAmerican/
White
Hispanic AsianAmerican/
PacificIslander
English(Benchmark score= 18)
Mathematics(Benchmark score= 22)
Reading(Benchmark score= 21)
Science(Benchmark score= 24)
All four
Source: ACT, Inc., 2007

Cracks in the Pipeline
Source: National Center for Higher Education Management Systems (2004)
StateFor every 100 Ninth Graders
Graduate from High
School
Enter College
Still Enrolled Sophomore
Year
Graduate within 6
years
South Dakota 100 82 56 36 28Iowa 100 84 52 33 27Pennsylvania 100 78 46 35 27Virginia 100 73 42 31 22Delaware 100 65 36 26 20Ohio 100 76 40 28 19Maryland 100 74 43 30 19North Carolina 100 64 41 28 19United States 100 70 39 27 18West Virginia 100 73 39 26 16Oklahoma 100 74 39 23 15Arkansas 100 75 42 27 15South Carolina 100 52 35 23 15Florida 100 55 29 21 15Louisiana 100 69 37 26 14Georgia 100 54 35 23 14Alabama 100 60 36 23 14Texas 100 68 35 22 13Tennessee 100 63 30 21 13Kentucky 100 65 34 22 11Mississippi 100 60 36 23 11
West Virginia Higher Education Policy Commission
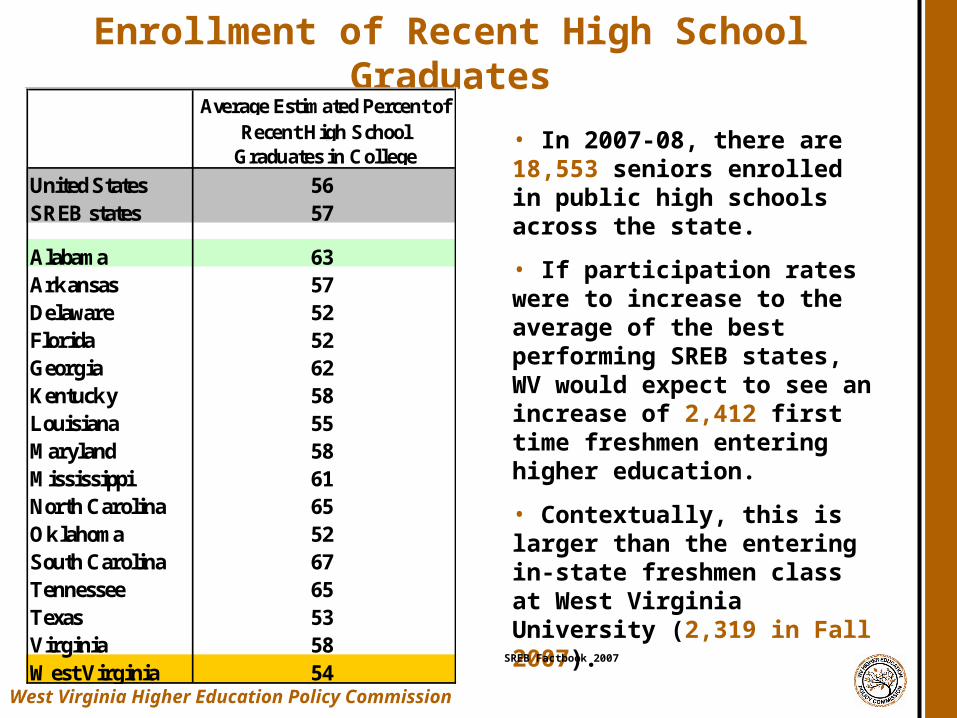
Enrollment of Recent High School GraduatesAverage Estimated Percent of
Recent High School Graduates in College
United States 56SREB states 57
Alabama 63Arkansas 57Delaware 52Florida 52Georgia 62Kentucky 58Louisiana 55Maryland 58Mississippi 61North Carolina 65Oklahoma 52South Carolina 67Tennessee 65Texas 53Virginia 58West Virginia 54
• In 2007-08, there are 18,553 seniors enrolled in public high schools across the state.
• If participation rates were to increase to the average of the best performing SREB states, WV would expect to see an increase of 2,412 first time freshmen entering higher education.
• Contextually, this is larger than the entering in-state freshmen class at West Virginia University (2,319 in Fall 2007).
SREB Factbook 2007
West Virginia Higher Education Policy Commission
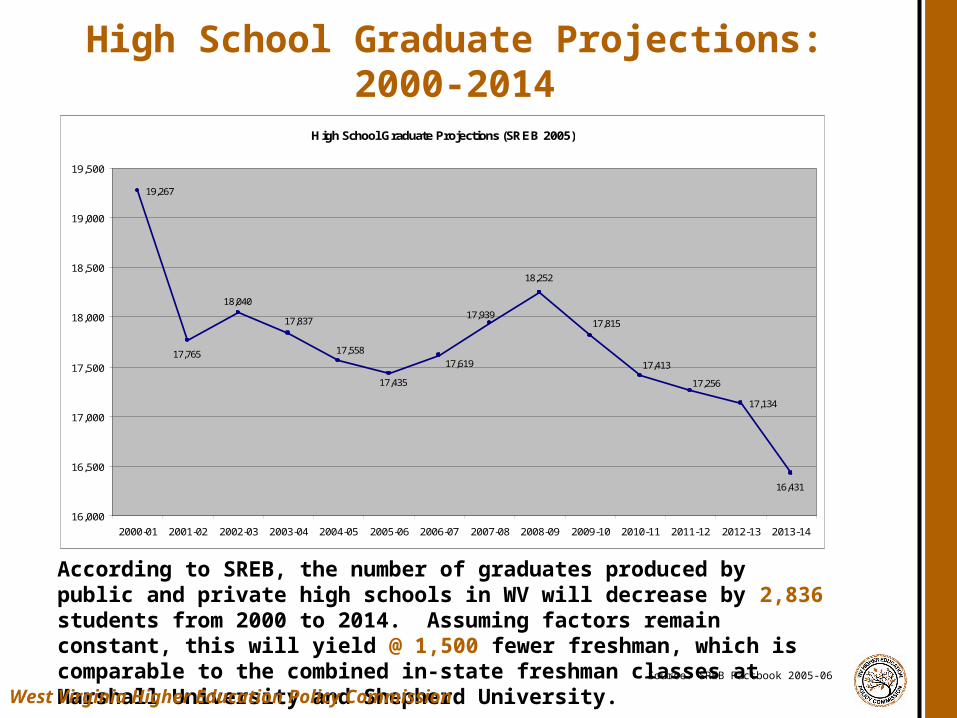
High School Graduate Projections: 2000-2014
According to SREB, the number of graduates produced by public and private high schools in WV will decrease by 2,836 students from 2000 to 2014. Assuming factors remain constant, this will yield @ 1,500 fewer freshman, which is comparable to the combined in-state freshman classes at Marshall University and Shepherd University.
Source: SREB Factbook 2005-06
High School Graduate Projections (SREB 2005)
19,267
17,134
17,765
18,040
17,837
17,558
17,435
17,619
17,939
18,252
17,815
17,413
17,256
16,431
16,000
16,500
17,000
17,500
18,000
18,500
19,000
19,500
2000-01 2001-02 2002-03 2003-04 2004-05 2005-06 2006-07 2007-08 2008-09 2009-10 2010-11 2011-12 2012-13 2013-14
West Virginia Higher Education Policy Commission

1990 1995 2000 2002 2005 % Change
United States 20.3% 23.0% 24.4% 24.4% 27.2% 6.9%
SREB States 18.6% 19.9% 22.4% 22.8% 23.8% 5.2%
Alabama 15.7% 17.3% 19.0% 20.6% 21.4% 5.7%
Arkansas 13.3% 14.2% 16.7% 19.7% 18.9% 5.6%
Delaware 21.4% 22.9% 25.0% 25.1% 27.6% 6.2%
Florida 18.3% 22.1% 22.3% 24.1% 25.1% 6.8%
Georgia 19.6% 22.7% 24.3% 24.4% 27.1% 7.5%
Kentucky 13.6% 19.3% 17.1% 18.8% 19.3% 5.7%
Louisiana 16.1% 20.1% 18.7% 20.4% 20.6% 4.5%
Maryland 26.5% 26.4% 31.4% 33.1% 34.5% 8.0%
Mississippi 14.7% 17.6% 16.9% 17.7% 18.7% 4.0%
North Carolina 17.4% 20.6% 22.5% 23.4% 25.1% 7.7%
O klahoma 17.8% 19.1% 20.3% 20.7% 22.4% 4.6%
South Carolina 16.6% 18.2% 20.4% 22.7% 23.0% 6.4%
Tennessee 16.0% 17.8% 19.6% 21.0% 21.8% 5.8%
Texas 20.3% 22.0% 23.2% 24.5% 25.1% 4.8%
Virginia 24.5% 26.0% 29.5% 31.7% 33.2% 8.7%
West Virginia 12.3% 12.7% 14.8% 16.1% 16.9% 4.6%
Percentage of Population 25 or O lder with a
Bachelor's Degree (Full Census and American Community Survey)
WV ranked 16th in the SREB in 2005 and 50th nationally.
In order to reach the SREB average, WV must create or import 101,000 college graduates.
Educational Attainment - SREB States
West Virginia Higher Education Policy Commission
AK
AR
DE
GA
HIIL
IN IAKS
LAME
MD
MA
MTNE
NV NJ
NY
NCND
OHOK
ORPARI
SCSD
VT
VA
WA
US
AL
CA
CO
CT
FL
IDKY
MIMN
MS
MONH
NMTN
TX
UT
wv
WI
WY
$15,000
$22,000
$29,000
$36,000
$43,000
$50,000
10 15 20 25 30 35 40 45
AZ
Personal Income
Per Capita
Percent of Adults Age 25-64 with Bachelor’s Degrees
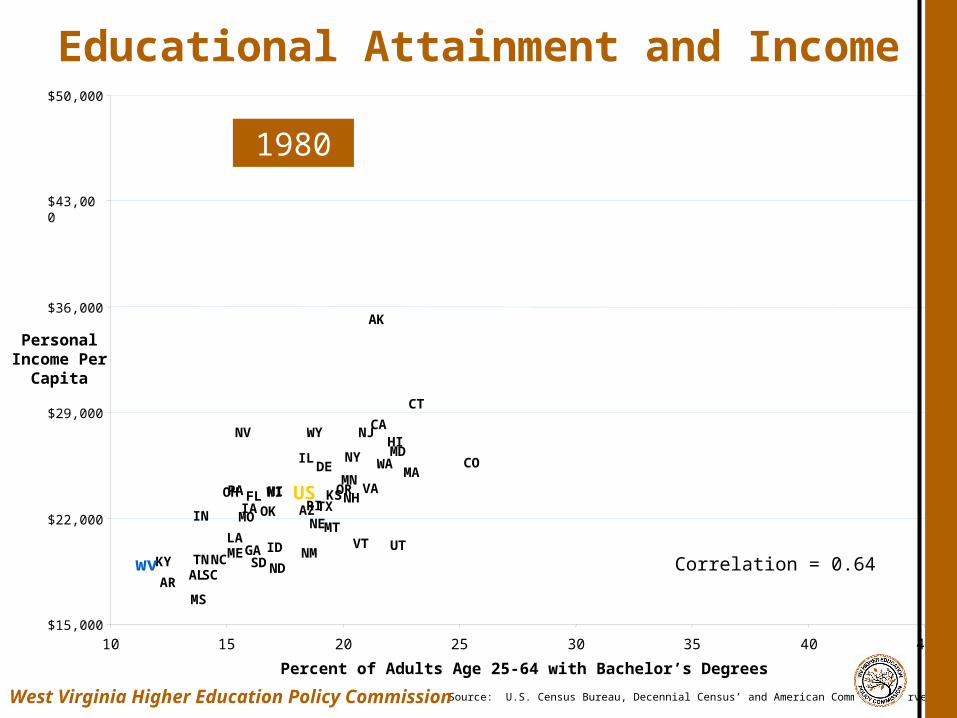
1980
Correlation = 0.64
Source: U.S. Census Bureau, Decennial Census’ and American Community Survey
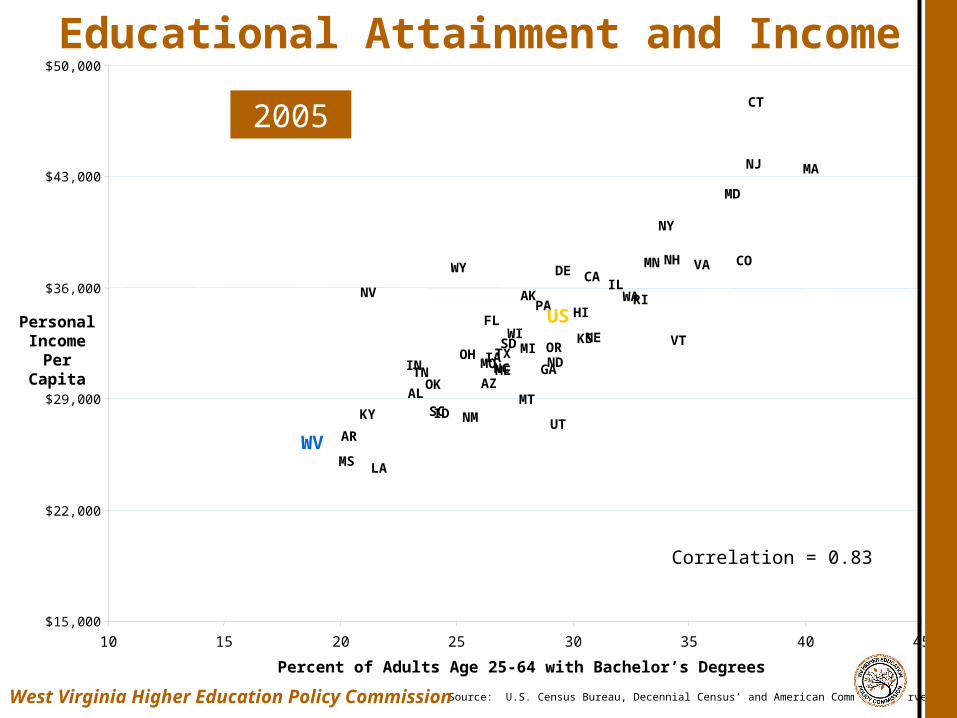
Educational Attainment and Income
West Virginia Higher Education Policy Commission
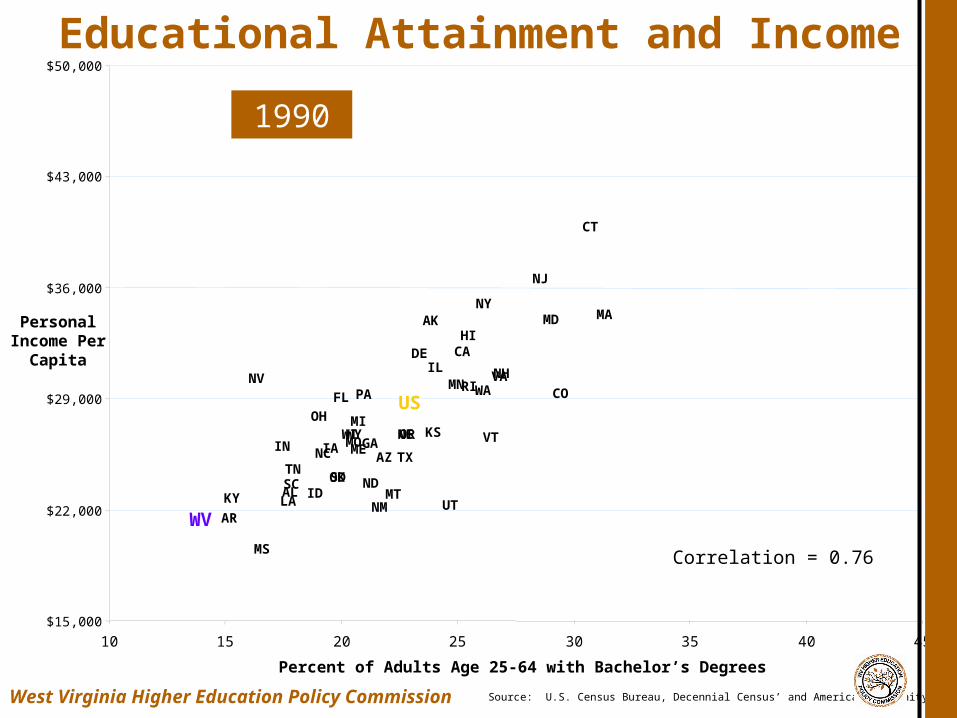
Source: U.S. Census Bureau, Decennial Census’ and American Community Survey
Educational Attainment and Income
AK
AR
DE
GA
HI
IL
IN IAKS
LA
ME
MD MA
MT
NE
NV
NJ
NY
NC
ND
OH
OK
OR
PARI
SC SD
VT
VAWA
US
AL
CA
CO
CT
FL
IDKY
MI
MN
MS
MO
NH
NM
TNTX
UTWV
WIWY
$15,000
$22,000
$29,000
$36,000
$43,000
$50,000
10 15 20 25 30 35 40 45
AZ
1990
Personal Income
Per Capita
Percent of Adults Age 25-64 with Bachelor’s Degrees
Correlation = 0.76
West Virginia Higher Education Policy Commission
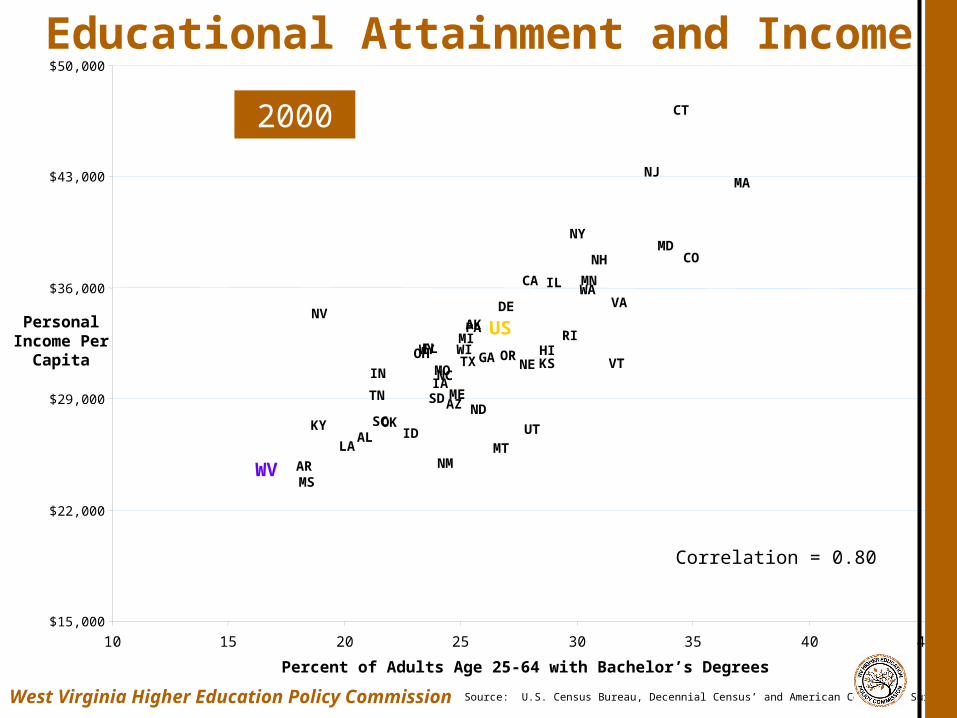
Source: U.S. Census Bureau, Decennial Census’ and American Community Survey
Educational Attainment and Income
AK
AR
DE
GA HI
IL
INIA
KS
LA
ME
MD
MA
MT
NE
NV
NJ
NY
NC
ND
OH
OK
OR
PARI
SC
SD
VT
VAWA
US
AL
CA
CO
CT
FL
IDKY
MI
MN
MS
MO
NH
NM
TN
TX
UT
WV
WIWY
$15,000
$22,000
$29,000
$36,000
$43,000
$50,000
10 15 20 25 30 35 40 45
AZ
2000
Personal Income Per
Capita
Percent of Adults Age 25-64 with Bachelor’s Degrees
Correlation = 0.80
West Virginia Higher Education Policy Commission
Source: U.S. Census Bureau, Decennial Census’ and American Community Survey
Educational Attainment and Income
AK
AZ
AR
DE
GA
HI
IL
INIA
KS
LA
ME
MD
MA
MT
NE
NV
NJ
NY
NC NDOH
OK
OR
PA RI
SC
SD VT
VA
WA
US
AL
CACO
CT
FL
IDKY
MI
MN
MS
MO
NH
NM
TNTX
UT
WV
WI
WY
$15,000
$22,000
$29,000
$36,000
$43,000
$50,000
10 15 20 25 30 35 40 45
2005
Personal Income
Per Capita
Percent of Adults Age 25-64 with Bachelor’s Degrees
Correlation = 0.83
West Virginia Higher Education Policy Commission
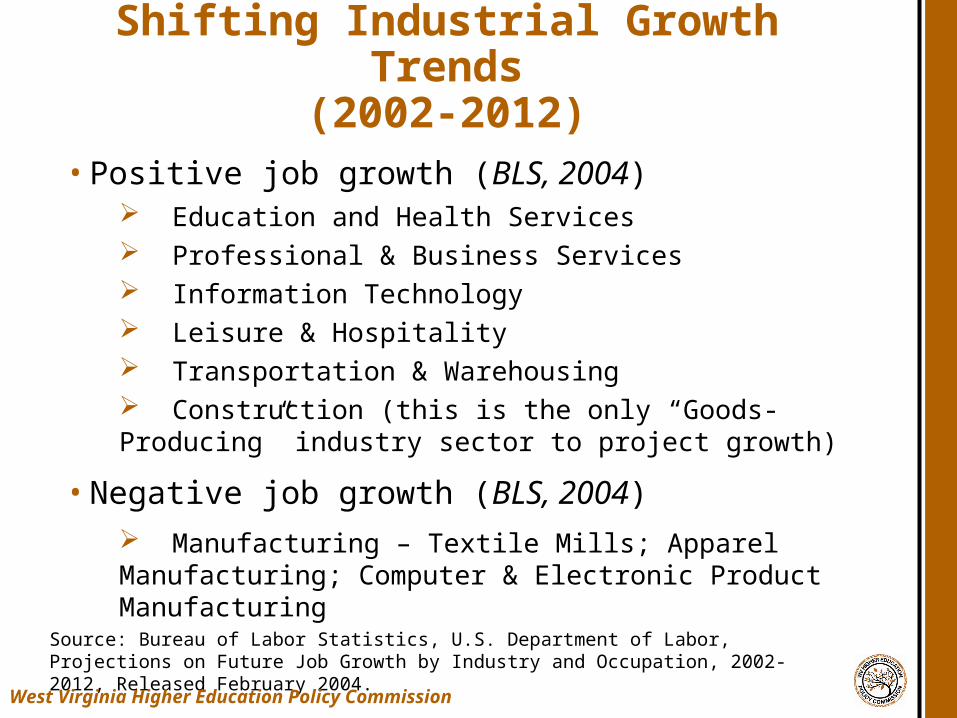
• Positive job growth (BLS, 2004) Education and Health Services Professional & Business Services Information Technology Leisure & Hospitality Transportation & Warehousing Construction (this is the only “Goods-Producing” industry sector to project growth)
• Negative job growth (BLS, 2004)
Manufacturing – Textile Mills; Apparel Manufacturing; Computer & Electronic Product Manufacturing
Shifting Industrial Growth Trends(2002-2012)
Source: Bureau of Labor Statistics, U.S. Department of Labor, Projections on Future Job Growth by Industry and Occupation, 2002-2012, Released February 2004.
West Virginia Higher Education Policy Commission
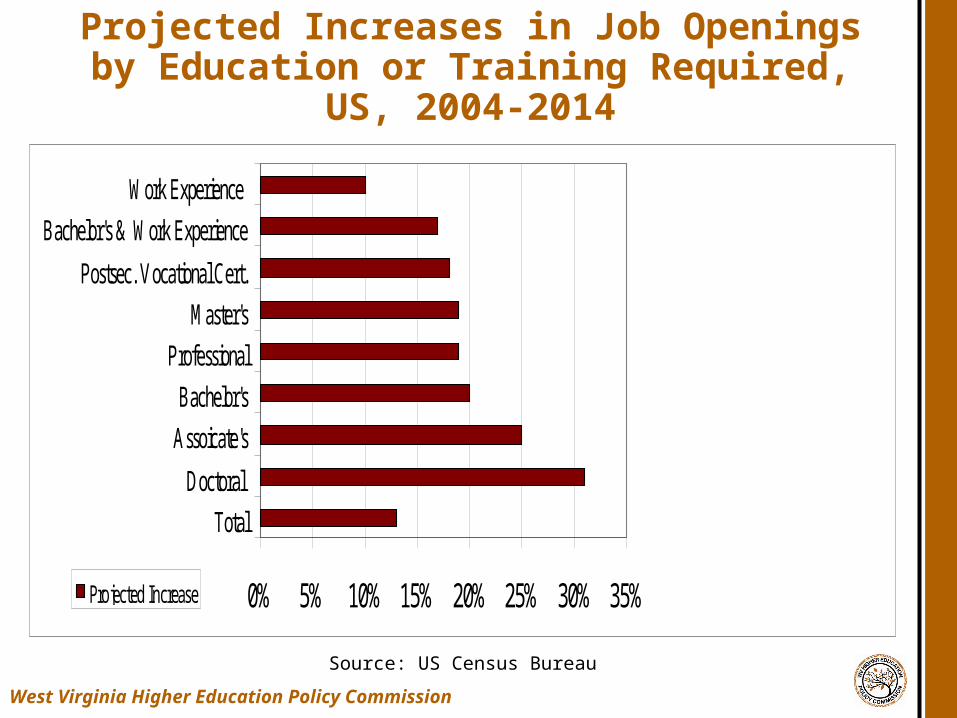
Projected Increases in Job Openings by Education or Training Required, US, 2004-2014
Source: US Census Bureau
West Virginia Higher Education Policy Commission
0% 5% 10% 15% 20% 25% 30% 35%
Total
Doctoral
Assoicate's
Bachelor's
Professional
Master's
Postsec. Vocational Cert.
Bachelor's & Work Experience
Work Experience
Projected Increase
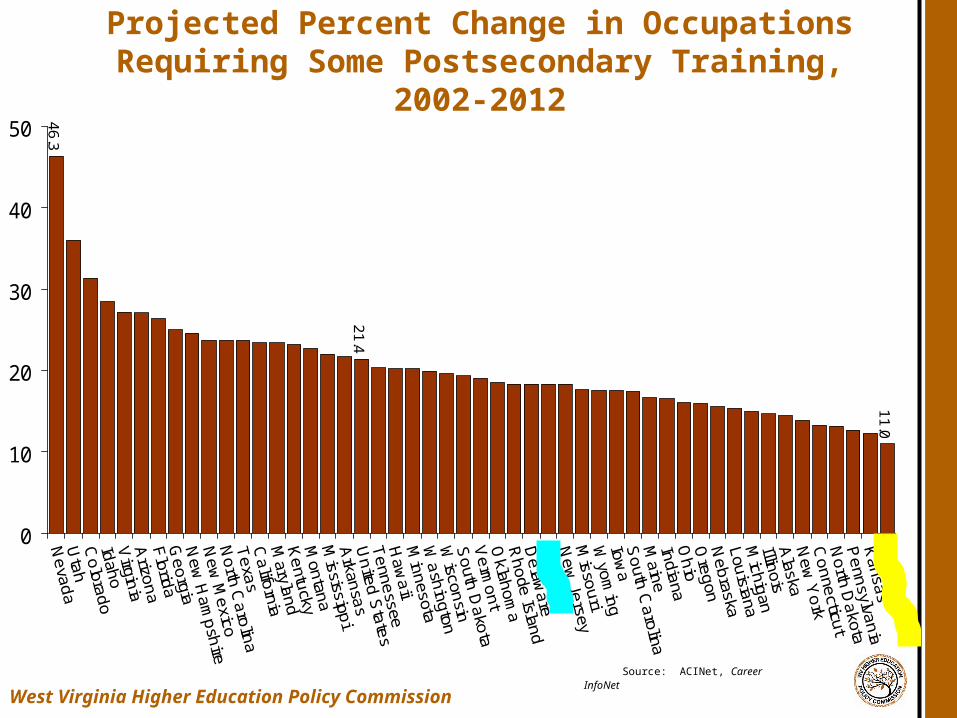
Projected Percent Change in Occupations Requiring Some Postsecondary Training, 2002-2012
11.0
21.4
46.3
0
10
20
30
40
50
Source: ACINet, Career InfoNet
West Virginia Higher Education Policy Commission
Issues for Consideration
• Changing expectations of college preparation
• Tensions across systems related to preparation
• Changing demands, 21st century skills, and the challenge of general education
• Projected access demands
• Increased focus on STEM
• Need to restructure state financial programs
• Ever increasing college costs and increased student debt burdens
• Appreciation of the complexity of the modern university
• Critical significance of a college degree in the global economy
West Virginia Higher Education Policy Commission

Public Policy Propositions
• More early assessment is needed in high school to make sure students are on track
• The ability to transfer credits among institutions needs to be made easier
• Financial Aid needs to be targeted to enhance access for those who otherwise would not go and the FAFSA should be simplified
• Attend to the financial needs of transfer and part-time students
• Consolidate grant programs in order to increase the purchasing power of the Pell Grant to 70 percent of public four-year tuition
• Unit level data needs to be collected and available at the federal level
• Student learning should be measured using tools such as the CLA
• Interstate comparisons should be encouraged on measures such as adult literacy and general skills tests outcomes
• Accreditation agencies should examining learning outcomes more closely and share findings among states
West Virginia Higher Education Policy Commission
Contact Information
Dr. Brian Noland, ChancellorWest Virginia Higher Education Policy Commission1018 Kanawha Boulevard East, Suite 700Charleston, WV 25301Phone: 304-558-0699Fax: 304-558-1011E-mail: [email protected]
West Virginia Higher Education Policy Commission