elementary science anxiety
TRANSCRIPT
ELEMENTARY SCIENCE ANXIETY:
IMPACT OF EXPERIENCE AND GENDER
Thesis Supervisor: ________________________________ Eleanor Close, Ed.D Department of Physics
Second Reader: __________________________________ Gail Dickinson, Ph.D Department of Curriculum and Instruction
Approved: _________________________________ Heather C. Galloway, Ph.D. Dean, Honors College
ELEMENTARY SCIENCE ANXIETY:
IMPACT OF EXPERIENCE AND GENDER
HONORS THESIS
Presented to the Honors Committee of Texas State University in Partial Fulfillment of the Requirements
for Graduation in the Honors College
by
Rebecca Lewis
San Marcos, Texas May 2015
Acknowledgements
I want to give thanks first to God, my loving husband and daughter, and my
parents for giving me strength, determination, and motivation during the extent of this
research project. Thank you all for always supporting me, listening to my trepidations,
and encouraging me to go further than I could have ever dreamed.
I want to take this opportunity to thank all of the individuals at Texas State
University who proved to be indispensable to the production of my thesis. One of those
individuals was my thesis supervisor, Dr. Eleanor Close, whose love for teaching science
has been contagious. She has always motivated me to make my best work look better
and has graciously taken me under her wing to mold me into a researcher. I also want to
also thank Dr. Gail Dickinson, my second reader, who helped me establish a research
study group and has always made time to help answer all of my questions.
I would also like to thank Ms. Diann McCabe and Dr. Heather C. Galloway for
contributing to the development of this project. These individuals demonstrated to me
that there has always been a place for non-traditional students in the Honor College with
their support, understanding, and enthusiasm.
I graciously give thanks to all of the students and teachers who contributed to the
development of my thesis by taking surveys, responding in forums, and especially to the
student who gave me the privilege of interviewing them.
Lastly, I would like to thank the Student Undergraduate Research Fund for
funding the purchase of the STAI instrument for the data collection of this project.
Table of Contents
Acknowledgements…………………………………………………………i
Abstract…………………………………………………………………….1
Elementary Teacher Science Anxiety……………………………………...2
Theoretical Framework…………………………………………….2
What is Science Anxiety…………………………………………...3
Causes of Science Anxiety in Pre-Service Teachers………………5
Causes of Science Anxiety in Practicing Teachers………………...6
Student- Teacher Relationship……………………………………..8
Motivation for Research .……………………………………….....8
Research Methodologies…………………………………………………..10
Pre-Service Teachers Population………………………………….10
In-Service Teacher Population……………………………………10
Data Collection…………………………………………………....11
Data Analysis………………………………………………….......15
Research Results…………………………………………………………..16
Pre-service STAI Results………………………………………….16
Figure 1……………………………………………………………17
Figure 2……………………………………………………………19
Figure 3……………………………………………………………19
Figure 4……………………………………………………………20
Figure 5……………………………………………………………20
Pre-Service Reflections………………………………………….21
Pre-service Interviews………………………………………......22
Practicing Teachers STAI Results………………………………23
Figure 6………………………………………………………….25
Conclusions……………………………………………………….…….27
A Call for Action………………………………………………..28
Appendix
STAI…………………………………………………………….29
IRB………………………………………………………….......29
Research Software……………………………………………...30
References………………………………………………………………31
1
Abstract
Our country has some of the finest educational institutions that produce some of
the world’s most innovative thinkers. However, our K-12 public school system science
achievement levels are far behind many of the other leading industrialized countries.
While mathematics education studies have found links between teacher math anxiety,
teacher gender, and student learning by gender, few such studies have been done in the
context of science education. In this study, we analyze pre-service and practicing
teachers’ responses to the State-Trait Anxiety Inventory (STAI) to determine their levels
of general anxiety and their level of anxiety specifically about teaching science. The goal
of this project was to see if pre-service and in-service teachers are experiencing anxiety
about teaching science. We hypothesized that both populations would present higher
levels of science anxiety than general populations. The participants in the pre-service
STAI overwhelmingly presented as science anxious. There were not enough participants
in the in-service teacher study to generate an interpretation representative of the
population. The pre-service teacher data contributes to the body of research addressing
the concern of how science anxiety, like math anxiety, is perpetuated possibly as early as
elementary schools, and the in-service teacher data lays the ground work for future
research.
2
Elementary Teacher Science Anxiety
Theoretical Framework
For the past couple of decades, school aged children and students in higher education
have been evaluated on their abilities and beliefs in science. Currently, it has been shown
that by eighth grade, boys begin to outperform girls in science with a significant margin
(Martin, Mullis, & Chrostowski 2004). These margins continue to increase as students
matriculate through high school and enroll in higher educational institutions. Before
research studies were aimed at uncovering these performance rates, there had been many
stereotypes that suggested that men were biologically more cognitively able to
understand science and advance into science-based careers. When under-represented
groups, such as women, are made aware of these stereotypes, and their gender is
highlighted, it can result in lower performance within science or other STEM content
areas (Bell, Spencer, Iserman, & Logel, 2003). In the 1980s, it was uncovered that
science anxiety had become an obstacle for women, and that it started becoming
prevalent in young girls as early as age nine (Chiarelott & Czerniak, 1985). When
students feel overwhelmed or anxious about a subject, they tend to close down, lose
interest, and can underperform in that subject, which in turn causes negative experiences.
These experiences in science can lead to science avoidance, which can produce
underrepresentation of females in science and non-science fields (Udo, Ramsay, &
Mallow, 2004). Currently, over 90% of elementary teachers are female (Beilock 2010.)
Elementary teachers are exposed to limited amounts of collegiate level science courses.
Looking at the teachers’ level of science content knowledge raises the question of how
prepared these teachers are when teaching science to our young students, especially
3
female students who look towards their female teachers as mentors. If females are less
likely to take science intensive courses, have internalized feelings of gender stereotypes,
possible unengaging lab experiences in secondary education, and have high levels of
science anxiety, then our science gender gaps within the public educational system will
continue to be a revolving cycle with widening margins. Something must be done to
transform this anxiety into efficacy.
Previously, there has been ample evidence to correlate that math anxiety affects both
teachers and students (Beilock, 2010). Such was the case in a study done by Sian L
Beilock (2010), at the University of Chicago, who studied the correlation between
teachers’ math anxiety and their students’ math achievement. She stated that “math
anxiety is not simply a proxy for poor math ability. Rather, the fears that math-anxious
individuals experience when they are called on to do math… [prevent] them from using
the math knowledge they possess to show what they know.” She suggested that students
may major in elementary education so that they avoid the more rigorous university
mathematics courses, which in turn fuels their math anxiety. We seek to find out if
science anxiety has the same effects on pre-service teachers and practicing teachers who
choose education as their major.
What is Science Anxiety?
In the 1950s, research on anxiety was first recognized and started to become a
household term. Sigmund Freud was the first to grapple with the concept of anxiety. He
speculated that anxiety was a psychosomatic disorder that was “something felt” (Freud,
1936). Since Freud, there have been numerous studies done across universities
4
throughout the world and within psychological clinics that look at human anxiety daily.
Currently, anxiety is a term that is used to designate an “unpleasant emotional state” or
can describe an individual’s personality trait (Spielberger, 1983). Psychologists have
moved beyond simply defining anxiety to identifying many different forms of anxiety
including but not limited to, anxiety disorders, phobias, panic disorders, post-traumatic
stress disorders, obsessive-compulsive disorder, and situational or state anxieties. In the
educational community, two psychological terms that have gained wide spread interest
are math anxiety and science anxiety. Mallow (1981) first defined science anxiety as
“feelings of tension and stress that interfere with the construction of science knowledge,
the development of science skills and abilities, and the use of science knowledge, skills,
and abilities in life and in academic situations.” (Mallow, 1981). In later research,
Mallow, along with his colleagues Udo and Ramsey concluded that science anxiety was
developed through many factors which included stereotyping of scientists in popular
media, bad experiences in science classes in both elementary and secondary schools,
racial and gender stereotyping, and contact with teachers whom themselves were science
anxious (Udo, Ramsay, & Mallow, 2004). This raises concerns for females, especially in
elementary school, because studies have shown that children are more likely to imitate
adults of the same gender than adults of the opposite sex (Perry & Bussey, 1979).
Therefore, young girls may be adopting these science anxieties without even being
consciously aware of the situation.
5
Causes of Science Anxiety in Pre-Service Teachers
It is not uncommon for a female pre-service teacher who is attending a university,
to have had prior negative experience in science, such as recurring tedious lectures or
monotonous amounts of book work. These negative experiences leave her feeling
completely science illiterate. In an effort to assist non-science majors to have a greater
understanding of science concepts and feel comfortable with science curriculum, many
universities have adopted core curriculum courses that cater to and are designed for non-
science students, such as business, education, humanities, and social science majors.
However, when studying whether or not these courses helped lower the science anxiety
level of these students, researchers have found that there were still drastic levels of
science anxiety, especially within the female populations, and that education majors had
the highest overall general anxiety (Udo, Ramsey, & Mallow, 2004).
So what may be the causes of continuing science anxiety of future teachers, or
pre-service teachers, who are studying to become educators? One possible source of
anxiety may be that pre-service teachers do not feel prepared to take science courses at
the collegiate level. To graduate high school in the state of Texas, currently, one only
needs a minimum of two science credits: biology, and integrated physics and chemistry
(Texas Education Agency, 2014). It is recommended that students take an additional
chemistry and/or physics course, but it is not required by the state for graduation. Most
students who are admitted into college take three or four science courses, but many times
the courses only include the biological sciences and not the physical sciences. Another
reason why pre-service teachers in Texas may be science anxious could be due to being
overwhelmed with having to be proficient in all science related Texas Essential
6
Knowledge and Skills or TEKS. The TEKS are the state standards that must be students
must demonstrate that they have mastered by the end of the year in the state of Texas. In
2001, the No Child Left Behind Act (NCLB) was passed, requiring standardized testing
on state standards (U.S. Department of Education, 2002). Most elementary teachers in
Texas are certified as generalists. This means they are required to pass a certification test
that will assess if they have the basic skills and educational attainment needed for
teaching language arts, mathematics, science, social studies, health, physical education,
art, music, and theater to children within the grades they aim to teach (Texas Education
Agency, 2014). This means that pre-service teachers are responsible for mastering over
300 TEKS in science alone (Texas Education Agency 2014.) The certification test is
theoretical and does not assess efficacy in teaching. Each state has differences, but
twenty-six states use the Next Generation Science Standards, and most of the other states
align their standards to match (Next Generation Science Standards, 2015). Currently,
there is research that demonstrates that teachers beliefs cause them to resist reform
(Czerniak, & Lumpe, 1996) and that the institutionalization of practice hinders teachers
to change (Bridwell-Mitchell, 2015). Meaning, that many teachers teach as they were
taught which is why it can be difficult and puzzling to implement change when educators
only know what they have experienced.
Causes of Science Anxiety in Practicing Teachers
One possible source is that the teacher may not have a completely proficient grasp
of the content that they are teaching. It has been shown that many elementary teachers do
7
not understand the science that they are teaching until after teaching the content for
several years (Carin, Bass & Contant, 2008). Anxiety can stem from not continuing
science professional development throughout one’s years of teaching. In the state of
Texas, practicing educators are required to obtain 150 continuing professional education
or CPE hours every five years which works out to 30 CPE hours a year to maintain their
certification (Texas Education Agency, 2014). However, they are able to choose what
areas they would like to further in their education, as long as it pertains to their content
area. Elementary teachers should associate themselves with all content areas, but most of
the time they do not. If teachers are avoiding science because of science anxiety, then
they may be less likely to choose science or related content areas to supplement their
understandings.
Another possible source of anxiety comes from the management of inquiry based
learning, which is a widely used approach for teaching science. Inquiry based learning is
a method of teaching that allows students to observe and experiment, collect and organize
data, construct models and theories, and formulate explanations and conclusions through
independent and small group based work, much like an actual scientist would work.
What can make this difficult for a teacher, is assessing if each student is obtaining the
knowledge necessary for mastery on their end of year standardized assessment, and also
keeping younger students on track academically. In a study done by Czerniak and
Chiarelott in 1990, teachers admitted to being flustered easily “by hands-on instruction,
open-ended instruction, or other less rigid teaching strategies” and felt a higher self-
efficacy in science when they had control over their classrooms and used more lecture
and book based whole class instruction (Czerniak & Chiarelott, 1990). Ironically, that is

8
what can lead to student disengagement and create uninteresting experiences for students
learning the science.
Student- Teacher Relationship
It is no question that many young students look up to their teachers as mentors. It
has been shown that children are more likely to imitate the actions of same-gender than
contrasting-gendered adults (Bussey & Bandura, 1984). Knowing that over 90% of
elementary teachers are female, one can suggest that young females are looking to see
how their teachers act during science instruction. Are the teachers bored? Are they
anxious? How do they manage their science classroom? In a study looking at
community-oriented classrooms, researchers found that positive student-teacher
relationships inspired risk-taking performances essential for learning (Baker, Dilley, &
Lacey, 2003). If a teacher is going to use inquiry-based learning when teaching science,
which requires students to plan and conduct experiments and to formulate their own
opinions, the teacher must first model positive risk-taking performances, and have
efficacy in the subject that they are teaching. This will allow students who are looking up
to teachers as mentors to have a more positive science classroom experience.
Motivation for Research
The main question that we wanted to ask was, where does science anxiety or
efficacy originate in pre-service elementary teachers, and have those feelings changed
9
since becoming practicing teachers? We wanted to first assess if current pre-service
teachers are presently still exhibiting anxiety about teaching science. Next, we wondered
if those pre-service teachers associate themselves with one main subject content area,
even though they are supposed to be generalists. Lastly, we wanted to examine if
practicing teachers are exhibiting anxiety about teaching science.
Based on the literature reviewed for this research study, we hypothesized that pre-
service teachers would still be science anxious and would identify themselves with
teaching language arts or related (humanities) subjects. We also hypothesized that
currently practicing elementary teachers would also identify as science anxious.
10
Research Methodologies
Pre-Service Teachers Population
We gathered data from pre-service teachers for this research from a large public
university in Texas. This university’s ethnicity is diverse with African-American
students accounting for 9%, Hispanic students accounting for 31%, White students
accounting for 52%, and all other ethnicities accounting for 2% or less. The College of
Education accounts for 16.2% of the university’s total enrollment. All study participants
were Interdisciplinary Studies majors seeking, certification to teach early childhood
through sixth grade. In this degree seeking and certification process, students must
complete a minimum of two elementary physics courses, an elementary physics lab, one
biology course, two general science courses, and a science methods course that focuses
on constructivist methods of science teaching. In this course, instructors model
constructivist science lessons for students and students teach two middle school lessons
using the 5E model (Baybee et al., 2006) before taking their last science pedagogy course
which focuses on science methods in elementary education. The students in the science
methods course are primarily seniors with a few juniors, and are majority female. It is
here, in the science methods course, that we gathered our pre-service teacher data.
In-Service Teacher Population
We chose second and fifth grade teachers to be in our in-service teacher
population. We decided to choose these two grade levels to determine if state testing had
an effect on anxiety levels: state-mandated standardized testing begins in third grade, and
11
the first state science test is given in fifth grade. We solicited responses from all teachers
at these grade levels in a medium-sized Central Texas school district (approximately
7500 k-12 students). In total, responses were requested from forty-three practicing
elementary teachers.
Data Collection
The State-Trait Anxiety Inventory (STAI) will be used to determine if a
participant has science anxiety. This instrument allows the researcher to gauge the
participants’ level of general anxiety and also an anxiety that is brought on by certain
stimuli (Spielberger, 1983) which in this case study will be teaching science. The
developer of this proprietary instrument, Charles D. Spielberger, has broken the
instrument into forty questions. Twenty questions measure trait anxiety (T-anxiety)
which refers to general anxiety proneness or the tendency to perceive a stressful situation
as intimidating or hazardous (Spielberger, 1983). State anxiety (S-anxiety), on the other
hand, accounts for the other twenty questions, and refers to the individuals’ reaction to a
particular situation at a given place and/or time (Spielberger, 1983). The STAI has been
used in numerous research studies since its development in 1979. It can be administered
to anyone with at least a sixth grade reading level, and has been adapted to be
administered in more than thirty languages (Spielberger, 1983). Therefore, using this
inventory allows for measurement of participants’ levels of anxiety through a well-
developed and validated test.
12
Since there is no standard inventory used to determine anxiety about teaching
science, we modified the STAI from its original version to specify science teaching as the
particular situation for which the S-anxiety scale measured participants’ anxiety levels.
This has been done previously, in a study that looked at science anxiety by Westerback in
1981. In Westerback’s study, the questions of the STAI that gauged the participants
levels of anxiety were not altered, only the headings of the T-anxiety scale, and S-anxiety
scale. The T-anxiety scale was kept from the original inventory and it read, “How Do
You Feel in General?” and the S-anxiety scale was adapted from, “How do you feel right
now, that is, at this moment?” to read, “How Do You Feel About Teaching Science?”
(Westerback, M. E., 1981).
This study used that adaption, along with several other demographic questions.
There was also written reflections collected from the pre-service teachers, followed up
with one student interview. Examples of some of the written questions for pre-service
teachers included: (a.) After taking the survey reflect on your level of anxiety about
teaching science to children. What experiences have fostered confidence or anxiety in
your teaching of science? (b.) After your teaching experience at Taylor (pseudonym)
Middle School, have your feelings about teaching science changed? If so, in what way,
and why? If not, why not? (c.) When you think of your future self in your own
elementary classroom, do you identify most with one subject area (math, science,
reading/writing, social studies)? Why or why not? Pre-service teachers also had the
option to discuss further science anxiety concerns in a follow up interview.
Next, twenty-nine pre-service teachers’ reflections about teaching science for the
first time were analyzed to identify patterns of anxiety. All of the students were in the
13
same science methods course. As part of their course, and during the duration of the
study, this particular group of students engaged in a micro-teaching field experience
where they taught a science lesson to sixth graders. This survey was distributed to these
students a week before their field experience and they were asked to respond to a written
reflection before and after this experience.
When this project was first established the goal was to have three different study
groups. One pre-service teacher study group and two different in-service teacher study
groups. The in-service teachers would be second and fifth grade teachers from a school
district in central Texas. Originally, the project was given IRB exemption, but because
the teachers worked for a school district there would have to be a second IRB approval
process from the district itself.
This consisted of gaining letters of support from principals at each school along
with completing Collaborative Institutional Training (CITI.) Once the project received
support from five out of the six elementary school principals, and CITI training was
completed, IRB was filed with the district. The original response took three weeks to
come in and it stated, “The project as described, did not sufficiently add value for
requests that would be made on our teachers.” Therefore, it was not approved.
We decided to file again, however, this time there would be an incentive for the
district. Trying to appeal to the district administrators, we articulated that, “The
researchers will share this information with the district’s instructional leadership in
whatever form is most useful to them: a presentation describing and explaining the study
results and sharing relevant prior research, a brief report, and/or a copy of the Honors
14
Senior Thesis based on this study… so that professional development and support for
teachers can be designed to be maximally effective.” After another week, the IRB was
approved, and the project was given support to start surveying the teachers right after the
district’s spring break.
The next obstacle that required to be overcome was getting the teachers contact
information, i.e. email addresses for each teacher. It was not until right before surveys
needed to be administered that we realized that the staff directory was not current or
accurate. Fortunately, after about a week, a science instructional leader was able to
supply a list a names for each of the second and fifth grade teachers. In the list it was
communicated that each teacher’s name was their email address. She explained that all
you needed to do was you firstname.lastname@domianname, and so the names were put
into the system.
Two weeks went by and no teachers were responding to the surveys. Principals
were encouraged to ask teachers to participate and incentives were given to boost
responses. Still no responses were coming into the system. One of the instructional
leaders informed the project team that it seemed as if none of the surveys were making it
into the teachers’ email inboxes. The next step was to try and troubleshoot the problem.
Maybe the district email system was rejecting a bulk email; maybe Mind Garden was not
set up correctly? It was opted to try and use the instructional leader’s email to see if she
would get the survey. To the surprise and frustration of the team, the problem was
identified that all of the email addresses had been put into the system as
[email protected] instead of [email protected].
15
With one week left to gain responses the issue was quickly resolved and email
solicitations went out each day for the remainder of the week. Of the forty-three solicited
teachers, only eight responded. Three were fifth grade teachers, and five were second
grade teachers. Since there were so few participants it is important to note that the results
may not be representative of the whole group, and also that the data has been merged
from two separate in-service groups to one main in-service group.
Data Analysis
Data for the STAI surveys were collected through the online tool Mind Garden
and analyzed through Mind Garden’s data analysis tool, Transform, to show participants’
average general anxiety and anxiety about teaching science. The data were compared to
the mean and standard deviation of the STAI developers’ norm groups to determine
whether the participant fell within various standard deviations of the mean scores
reported. The pre-service teacher reflections were also analyzed to find patterns and
outliers. This was done through reviewing written reflections and a follow-up interview
of one participant.
16
Research Results
Pre-service STAI Results
Twenty-nine students were solicited to take the STAI from the science methods
course. Of the twenty-nine students, twenty participated in the research. The STAI,
when it was designed, discouraged “black and white” labelling of a respondent as anxious
or not anxious. Spielberger (1983) encouraged administrators to identify a respondent or
group of respondents as “more anxious than the norm” or “less anxious than the norm”.
Within these categories the administrator can create categories that are more anxious or
less anxious (Spielberger, C. D., 1983). For this research, we identify participants as:
without the presence of anxiety, with the presence of anxiety, and with heightened
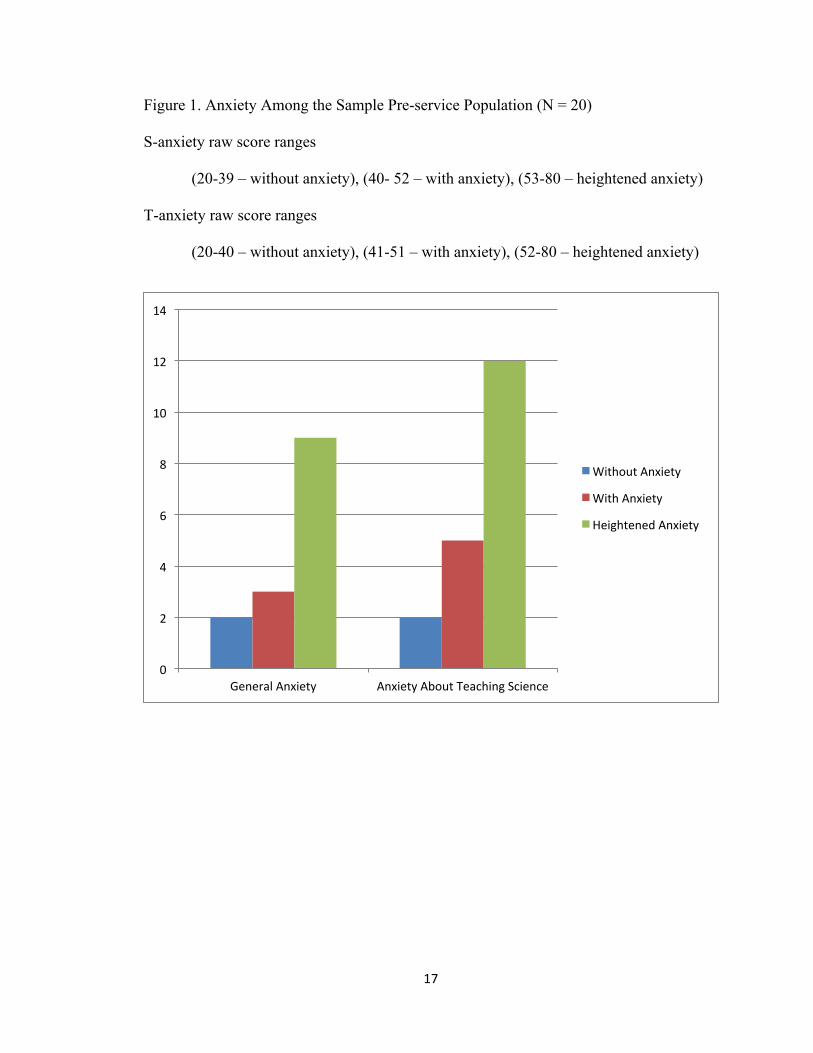
anxiety. The results established that almost all participants sampled had some anxiety.
There were only two participants that communicated an absence of both general anxiety
and science anxiety. Twelve of the participants fell into a category that flagged them for
having the presence of general anxiety. Within those students nine of them demonstrated
heightened general anxiety, or anxiety levels more than one full standard deviation above
the population mean. When it came to science anxiety the participants overall
demonstrated higher levels of anxiety. Seventeen students, or 85% of the participants,
scored above the mean and we identified them for having the presence of science anxiety.
Of those students, twelve also demonstrated heightened general anxiety, scoring a
standard deviation or more above the mean. There was only one student that had general
anxiety without demonstrating science anxiety. (See Figure 1)
17
Figure 1. Anxiety Among the Sample Pre-service Population (N = 20)
S-anxiety raw score ranges
(20-39 – without anxiety), (40- 52 – with anxiety), (53-80 – heightened anxiety)
T-anxiety raw score ranges
(20-40 – without anxiety), (41-51 – with anxiety), (52-80 – heightened anxiety)
0
2
4
6
8
10
12
14
General Anxiety Anxiety About Teaching Science
Without Anxiety
With Anxiety
Heightened Anxiety
18
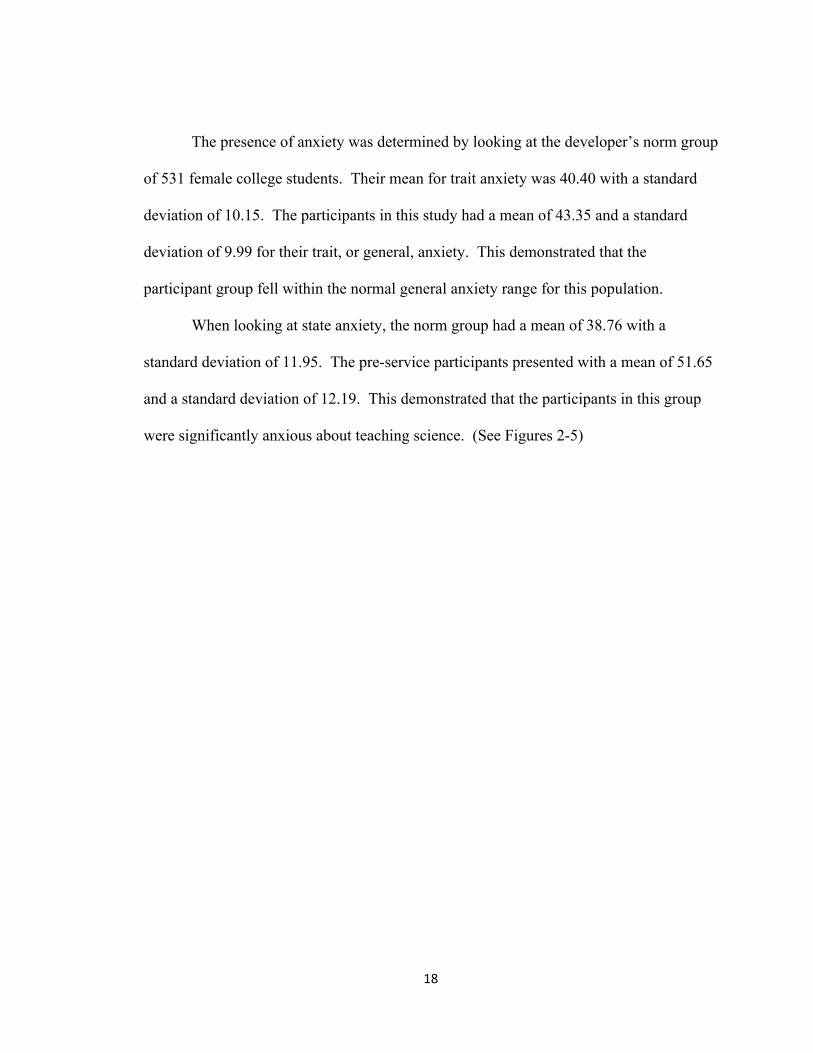
The presence of anxiety was determined by looking at the developer’s norm group
of 531 female college students. Their mean for trait anxiety was 40.40 with a standard
deviation of 10.15. The participants in this study had a mean of 43.35 and a standard
deviation of 9.99 for their trait, or general, anxiety. This demonstrated that the
participant group fell within the normal general anxiety range for this population.
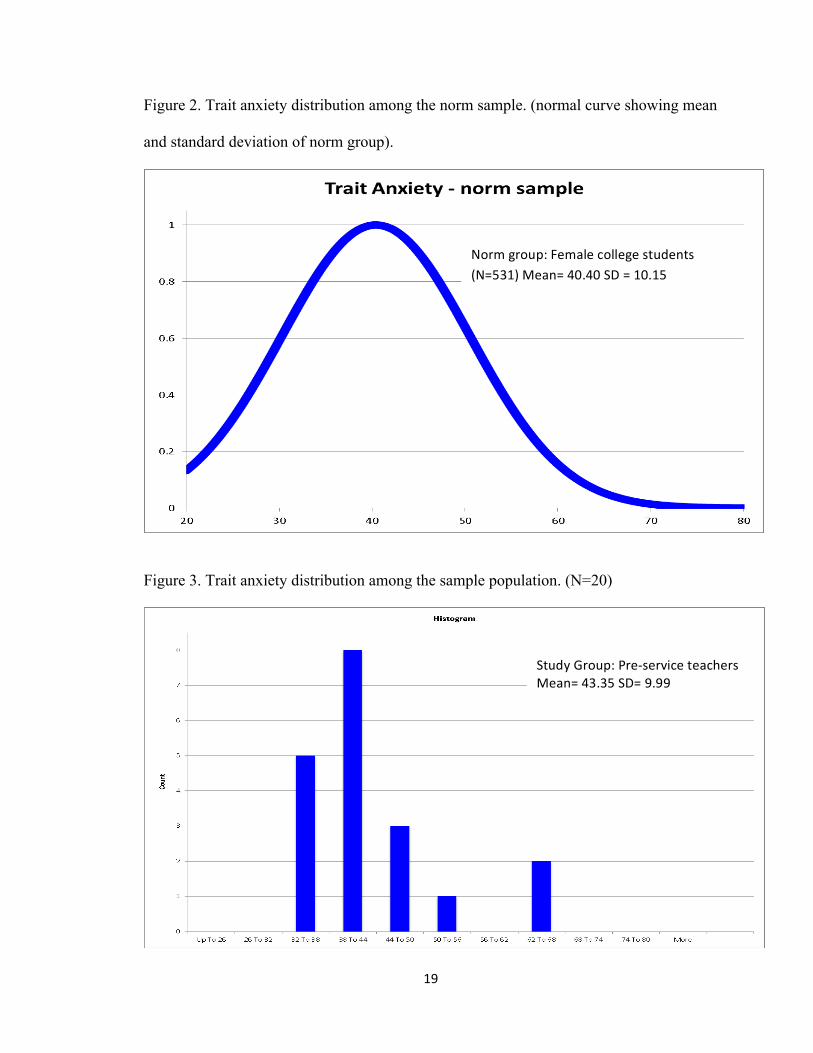
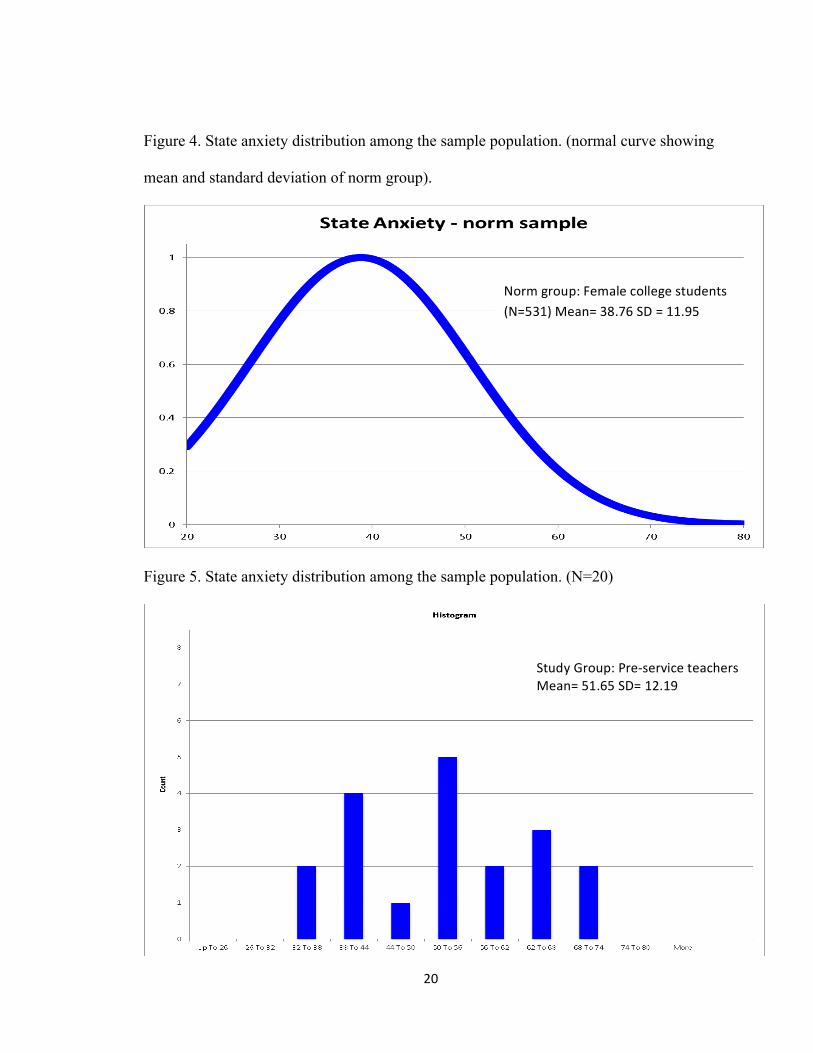
When looking at state anxiety, the norm group had a mean of 38.76 with a
standard deviation of 11.95. The pre-service participants presented with a mean of 51.65
and a standard deviation of 12.19. This demonstrated that the participants in this group
were significantly anxious about teaching science. (See Figures 2-5)
19
Figure 2. Trait anxiety distribution among the norm sample. (normal curve showing mean
and standard deviation of norm group).
Figure 3. Trait anxiety distribution among the sample population. (N=20)
Norm group: Female college students (N=531) Mean= 40.40 SD = 10.15
Study Group: Pre-‐service teachers Mean= 43.35 SD= 9.99
20
Figure 4. State anxiety distribution among the sample population. (normal curve showing
mean and standard deviation of norm group).
Figure 5. State anxiety distribution among the sample population. (N=20)
Norm group: Female college students (N=531) Mean= 38.76 SD = 11.95
Study Group: Pre-‐service teachers Mean= 51.65 SD= 12.19
21
Pre-Service Reflections
As part of their regular science methods course, students were asked to reflect
before and after their teaching experience. Twenty-two participants gave responses that
were collected on various questions. The first reflection question, administered before
the micro-teaching experience, pertained to participants that volunteered to take the
STAI. It asked, “After taking the survey reflect on your level of anxiety about teaching
science to children. What experiences have fostered confidence or anxiety in your
teaching of science?” Eighteen participants responded. There was an overarching theme
of anxiety throughout the responses. Several of the participants stated that they were
scared of science. Many expressed concern that they were underprepared to teach, and
were worried that the students that they would end up teaching would have greater
science knowledge base than they themselves had. One-third of the participant pool
expressed that science was their worst subject, with two participants saying that they
“hated” science.
To gauge their levels of anxiety after their micro-teaching experience, a second
reflection question was administered. It asked, “After your teaching experience at
[Named] Middle School, have your feelings about teaching science changed? If so, in
what way, and why? If not, why not?” Fourteen participants responded. The predominant
theme expressed in these responses was a greater sense of confidence, with one
contributor stating she felt “joy”, though most articulated some remaining level of
anxiety. Three participants voiced no change in feelings and conveyed still having a
heightened level of anxiety towards teaching science.
22
The last question, aimed at seeing how many of the participants would identify
themselves as a generalist, with not being partial to one academic discipline, and how
many, if any, would identify mostly with science. The reflection question was, “When
you think of your future self in your own elementary classroom, do you identify most
with one subject area (math, science, reading/writing, social studies)? Why or why not?”
Fourteen participants responded. Six of the students claimed to identify with math, six
identified with reading/writing, one with social studies, and one with science.
Pre-service Interviews
After the written reflections were collected and analyzed, six respondents were
asked to participate in an interview to gain further insight into why they were anxious
about teaching science. Only one student opted to do an interview. The first question
asked was, “Is there a particular grade that you want to teach?” Her response was second
grade. The question that followed was, “Do you feel anxious about teaching second
grade science?” She expressed that she did not feel anxious about teaching science at
that grade level. This prompted the next question, “At which grade level would you feel
that you would have anxiety about teaching science?” Her response was fourth grade.
She explained that she “didn’t understand science” very well and that she felt that she
would “need more experience” before teaching science at that grade level or any grade
higher.
The course of questioning that followed these first few questions was chosen to
find out if the participant really wanted more experience so that she would feel less
anxious in teaching science, or if she, as research before had suggested, would avoid
23
teaching science because she was anxious. The next question prompted was, “You
recently went into a middle school and taught a science lesson to sixth graders. Did you
feel that this experience helped you become less anxious about teaching science?” She
explained that she was still very anxious but “liked teaching the lesson.” The next
question inquired, “Did you know that the particular section of science methods, in which
you are enrolled, is the only section that does a classroom teaching experience?” She
seemed to almost be flustered and upset, and responded, “No, but I wish I did know that
before I enrolled.” I questioned further, “So, if you had the chance to re-enroll into
another section, and not gain the experience of teaching science, you would have
switched?” She answered, “I would have switched. I liked teaching the science, but I
don’t want to teach it, if I don’t have to.”
This demonstrates that even though the student benefitted from the teaching
experience, she would have avoided the subject if given the choice, which suggests that
later in her career she might also avoid science-related professional development if she
had a choice in the matter. This also demonstrates that anxiety about teaching science
can lead to science avoidance.
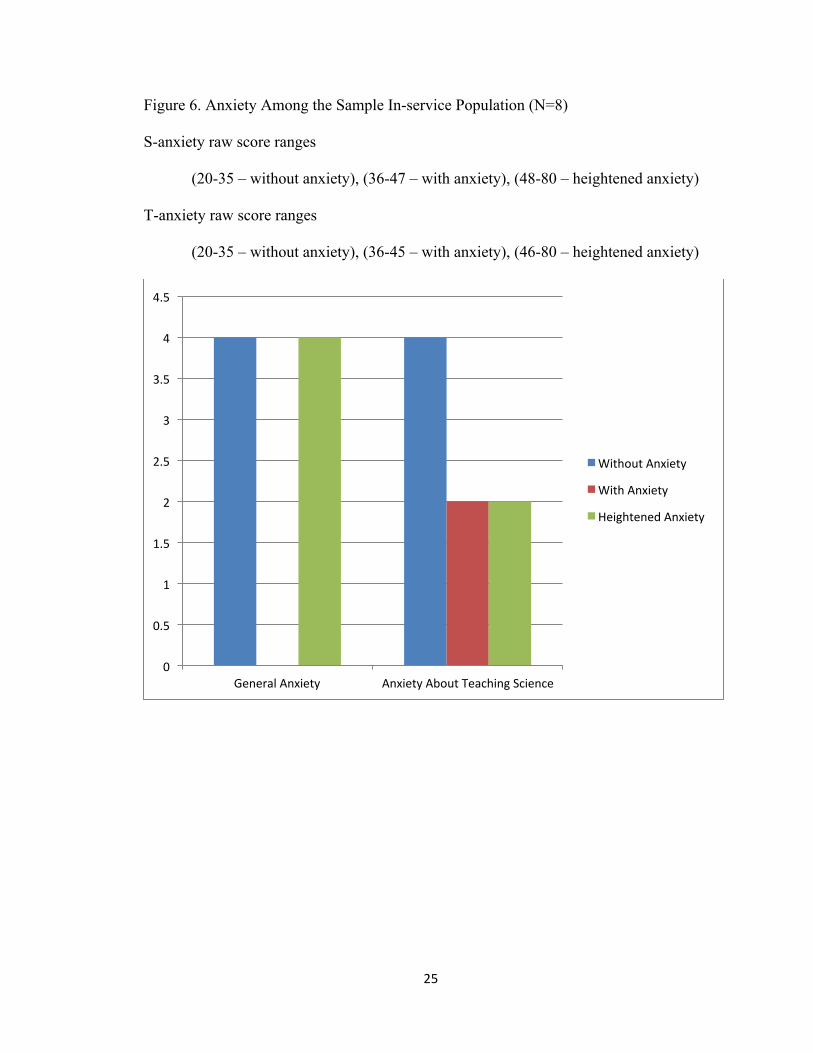
Practicing Teachers STAI Results
Forty-three participants were solicited to take the STAI from the central Texas
school district. Eight teachers submitted completed surveys. The results established that
half or four of the participants sampled had some presence of anxiety. There were four
participants that communicated an absence of both general anxiety and science anxiety.
Of the eight participants, one was male and he presented with a heightened level of
24
general anxiety. Within the other three teachers that had the presence of general anxiety,
all of them demonstrated heightened general anxiety. When it came to anxiety about
teaching science, all the participants who had general anxiety also demonstrated anxiety
about teaching science. Of those teachers, two of them demonstrated heightened anxiety
about teaching science. (See Figure 6)
25
Figure 6. Anxiety Among the Sample In-service Population (N=8)
S-anxiety raw score ranges
(20-35 – without anxiety), (36-47 – with anxiety), (48-80 – heightened anxiety)
T-anxiety raw score ranges
(20-35 – without anxiety), (36-45 – with anxiety), (46-80 – heightened anxiety)
0
0.5
1
1.5
2
2.5
3
3.5
4
4.5
General Anxiety Anxiety About Teaching Science
Without Anxiety
With Anxiety
Heightened Anxiety
26
The presence of anxiety was determined by comparing study participants to the
developer’s norm group of working females (N=451). Their mean for trait anxiety was
34.79 with a standard deviation of 9.22. The female in-service study group had a mean
of 33.57 and a standard deviation of 11.33. This indicated that the participants of this
group fell within the normal general anxiety range. For the single male participant, the
presence of anxiety was determined by looking at the developers norm group of working
males (N=1387). Their mean for trait anxiety was 34.89 with a standard deviation of
9.19. The male participant of this study group had a score of 41 for his trait (general)
anxiety.
When looking at state anxiety, the female norm group had a mean score of 35.20
with a standard deviation of 10.61. The males had a mean of 35.72 with a standard
deviation of 10.40. The female in-service participants presented with a mean of 36.57
with a standard deviation of 12.74. The difference between the norm group and the study
group was slight, and too small to be meaningful given the number of responses. The
male presented with a score of 43, which indicated the presence of anxiety about teaching
science. Since there were only eight participants this data cannot illustrate the whole
groups’ levels of anxiety both in general, and about teaching science.
27
Conclusions
The goal of this project was to see if pre-service and in-service teachers have
anxiety about teaching science. We hypothesized that both populations would present as
science anxious. Having the pre-service teachers participate in the STAI survey and
having the ability to collect qualitative data from their own experiences allowed us to get
a sense of how anxious they were compared to the STAI norms gathered from the STAI
developers. The participants in the pre-service STAI overwhelmingly presented as
science anxious. Their written reflections drew more cause for concern given that
students, especially those of the same gender as their teacher, are likely to imitate the
actions of same-gender adults (Bussey & Bandura, 1984) Alarming statements that were
expressed were, “I am very nervous about teaching science to children. It has always
been my worst subject and I worry I won’t know enough to teach them what they need to
know.” Based on our current evidence, there is a significant amount of data that points to
anxiety about teaching science amongst pre-service teachers. Unfortunately, there was
not enough in-service teacher data to provide representative sample of the in-service
teacher population; therefore we cannot draw conclusions at this time about levels of
science anxiety in this population.
The results of our study generate the following questions for further
investigations: (a.) Are practicing teachers also presenting as anxious about teaching
science? (b.) How does a teacher’s level of anxiety effect their students’ science
achievement? (c.) Is there a gender effect? E.g., are female students of female teachers at
a higher risk of developing science anxiety? (d.) Why do so many of the pre-service
teachers identify as math teachers, which is a related STEM discipline, but not science?
28
A Call for Action
As suggested in previous research, this study shows that science anxiety is real
and present. It has been shown that science anxiety discourages its victims from wanting
to study science and can hinder the learning process. This research study adds to the
body of research that demonstrates these points. The problem is that these points have
been stressed since the early 80s, and yet, few gains have been made in promoting
efficacy in this subject, especially amongst females. This study was intended to shed
more light upon this issue and encourages educators and curriculum writers to help find
ways to address this issue. Since doing these observations, and reflecting upon this
experience, I believe universities should make it mandatory for pre-service teachers to
have more science internship experience. The data in this study, from the pre-service
teacher responses indicated that the students had lower levels of anxiety about teaching
science when they were required to teach science lessons. If this is not done soon, our
pre-service teachers will continue to avoid science, and the children they will soon teach
will be the ones who suffer. However, if universities mandate this training we open the
door for many pre-service teachers to alleviate some of their science anxiety before
entering the classroom.
29
Appendix
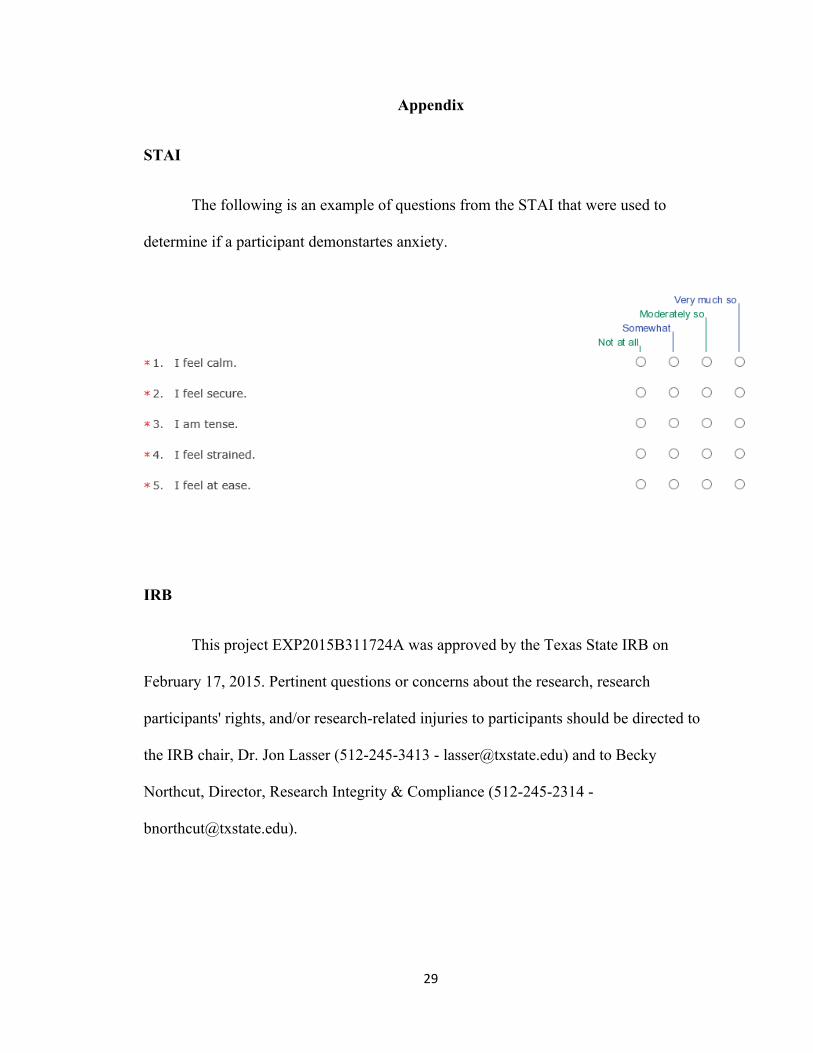
STAI
The following is an example of questions from the STAI that were used to
determine if a participant demonstartes anxiety.
IRB
This project EXP2015B311724A was approved by the Texas State IRB on
February 17, 2015. Pertinent questions or concerns about the research, research
participants' rights, and/or research-related injuries to participants should be directed to
the IRB chair, Dr. Jon Lasser (512-245-3413 - [email protected]) and to Becky
Northcut, Director, Research Integrity & Compliance (512-245-2314 -
30
Research software
Mind Garden is an independent publisher of psychological assessments and
instruments, and a professional research data collection website (Mind Garden 2015.) It
serves academic and research communities along with consulting professionals. The
STAI survey was administered through Mind Garden and data was collected through
Mind Garden’s data analysis tool, Transform.
31
References
Anxiety. 2014. In Merriam-Webster.com. Retrieved November 5, 2014, from
<http://www.merriam-webster.com/dictionary/anxiety>
Baker, J. A., Dilly, L. J., & Lacey, C. L. (2003). Creating community-oriented
classrooms. In C. Howes (Ed.), Teaching 4-to 8-year-olds (pp. 1-24). Baltimore,
MD: Paul Brookes Publishing.
Bybee, R. W., Taylor, J. A., Gardner, A., Van Scotter, P., Carlson Powell, J., Westbrook,
A., & Landes, N. (2006). The BSCS 5E instructional model. Origins, effectiveness
and applications.
Beilock, S. L., Gunderson, E. A., Ramirez, G., & Levine, S. C. (2010). "Female
teachers’ math anxiety affects girls’ math achievement." Proceedings of the
National Academy of Sciences 107.5 1860-1863.
Bell, A.E., Spencer, S.J., Iserman, E., Logel. C. E. R. (2003) Stereotype threat and
women's performance in engineering. J Engin Ed (92). 307–312.
Bridwell-Mitchell, E. N. (2015). Theorizing teacher agency and reform: How
institutionalized instructional practices change and persist. Sociology Of
Education, 88(2), 140-159. doi:10.1177/0038040715575559
Bussey, K., & Bandura, A. (1984) Influence of gender constancy and social power on
sex-linked modeling. Journal of Personality and Social Psychology 47 (6), 1292–
1302.
Carin, A. A., Bass, J. E., & Contant, T. L. (2008). Teaching Science as Inquiry: With
MyEducationLab. Pearson Education.
32
Chiarelott, L., and Czerniak, C. (1985). Science anxiety among elementary school
students: an equity issue. Journal Education Equity and Leadership. 5, 291–308.
Czerniak, C., & Chiarelott, L. (1990). Teacher education for effective science
instruction—A social cognitive perspective. Journal of Teacher Education, 41(1),
49-58.
Czerniak, C. M., & Lumpe, A. T. (1996). Relationship between teacher beliefs and
science education reform. Journal of Science Teacher Education, 7(4), 247-266.
Freud, S. (1936) The Problem of Anxiety. New York: W.W. Norton.
Mallow, J. V. (1981). Science Anxiety: Fear of Science and How to Overcome It. New
York, NY: Van Nortrand Reinhold.
Martin, M. O., Mullis, I. V. S., & Chrostowski, S. J. (eds) (2004) TIMSS 2003 Technical
Report Chestnut Hill, MA: Boston College.
Mind Garden. (2015) Welcome to Mind Garden, Inc! Accessed on 18, Feb. 2015. <
http://www.mindgarden.com/>
Next Generation Science Standards. (2015). The Next Generation Science Standards.
Accessed on 27, April. 2015 <http://www.nextgenscience.org/next-generation-
science-standards>
Perry, D. G., Bussey, K. (1979). The social learning theory of sex differences: Imitation
is alive and well. Journal of Personality and Social Psychology, 37 (10) 1699–
1712.
Spielberger, C. D. (1983). STAI - Adult Manual. Mindgarden.
33
Texas Education Agency. (2014). Becoming a Certified Texas Educator Through a
University Program. Assessed on 9, Nov. 2014.
<http://tea.texas.gov/Texas_Educators>
Texas Education Agency. (2014). Renewing My Standard Certificate. Accessed on 1,
Nov. 2014. <http://tea.texas.gov/Texas_Educators/>
Texas Education Agency. (2014). Texas Essential Knowledge and Skills. Accessed on 1,
Nov. 2014. <http://tea.texas.gov/curriculum/teks/>
Texas State University. (2015). Early Childhood – 6th Grade ESL Generalist
Certification (E6EG). Accessed on 22, March. 2015 < http://gato-
docs.its.txstate.edu/center-for-student-and-professional-services/advising-
worksheets/2014-CI/E6EG_2014/E6EG_S2015.pdf>
Texas State University. (2014) Enrollment Highlights 2014. San Marcos: Texas State
University
Udo, M. K., Ramsey, G. P., & Mallow, J. V. (2004). Science anxiety and gender in
students taking general education science courses. Journal of Science Education
and Technology, 13(4), 435-446.
U.S. Department of Education (2002). No Child Left Behind Act (Public law print of PL
107-110). Washington, DC: U.S. Government Printing Office.
Westerback, M. E. (1981). The Use of the State-Trait Anxiety Inventory in Science
Education.