electroporation and electrofusion of membranesdutcher/download/handbook of biological... ·...
TRANSCRIPT

CHAPTER 18
Electroporation andElectrofusion of Membranes
D.S. DIMITROV
Section on Membrane Structure and Function, National Cancer Institute,National Institutes of Health, Bethesda, Maryland 20892, USA
Central Laboratory of Biophysics,Bulgarian Academy of Sciences, Sofia 1113, Bulgaria
1995 Elsevier Science B.V. Handbook of Biological PhysicsAll rights reserved Volume 1, edited by R. Lipowsky and E. Sackmann
851

Contents
1. Introductory remarks . . . . . . . . . . . . . . . . . . . . . . . . . . . . . . . . . . . . . . . . . . . . . . . . . . . . . . . . . . 854
1.1. Membrane fusion ensures specific, controlled transfer of molecules in life processes and
is important for biotechnology and biomedical research . . . . . . . . . . . . . . . . . . . . . . . . . . 8541.2. Manifestations of cell fusion were observed nearly two centuries ago, while
electrofusion was discovered in the late 1970’s . . . . . . . . . . . . . . . . . . . . . . . . . . . . . . . . . 854
1.3. Electric fields can induce fusion of a wide variety of membranes . . . . . . . . . . . . . . . . . . 855
2. Polarization of membranes underlies their destabilization, adhesion and fusion . . . . . . . . . . . 855
2.1. Polarization is due to restricted motion of charges . . . . . . . . . . . . . . . . . . . . . . . . . . . . . . 855
2.2. Interaction of electric fields with polarized membranes induces mechanical stresses . . . 856
2.3. Forces exerted on polarized membranes can induce structural rearrangements, approach
of membranes and their fusion . . . . . . . . . . . . . . . . . . . . . . . . . . . . . . . . . . . . . . . . . . . . . . 856
3. High voltage pulses electroporate membranes . . . . . . . . . . . . . . . . . . . . . . . . . . . . . . . . . . . . . . 857
3.1. High voltage pulses can permeabilize membranes . . . . . . . . . . . . . . . . . . . . . . . . . . . . . . . 857
3.2. The devices for electroporation are conceptually simple . . . . . . . . . . . . . . . . . . . . . . . . . . 858
3.3. The transmembrane voltage induced by the external electric fields is accurately
described by a simple formula . . . . . . . . . . . . . . . . . . . . . . . . . . . . . . . . . . . . . . . . . . . . . . 8593.4. Intramembrane field strength is much higher than the strength of the applied electric
field . . . . . . . . . . . . . . . . . . . . . . . . . . . . . . . . . . . . . . . . . . . . . . . . . . . . . . . . . . . . . . . . . . . . 8603.5. Membranes are electroporated when the transmembrane voltage exceeds a threshold
value . . . . . . . . . . . . . . . . . . . . . . . . . . . . . . . . . . . . . . . . . . . . . . . . . . . . . . . . . . . . . . . . . . . 861
3.6. Transfer of molecules by electroporation is asymmetric . . . . . . . . . . . . . . . . . . . . . . . . . . 861
3.7. The threshold voltage of electroporation decreases with an increase in intramembrane
mechanical stresses (membrane tension) . . . . . . . . . . . . . . . . . . . . . . . . . . . . . . . . . . . . . . . 8613.8. The electromechanical models of electroporation describe membrane rupture as
mediated by intramembrane stresses induced by the field . . . . . . . . . . . . . . . . . . . . . . . . . 8643.9. The energy-based approaches describe formation and expansion of pores as overcoming
energy barriers . . . . . . . . . . . . . . . . . . . . . . . . . . . . . . . . . . . . . . . . . . . . . . . . . . . . . . . . . . . 866
4. Mutual attraction and adhesion of the cells in AC fields is due to dielectrophoresis . . . . . . . 867
4.1. Formation of ‘pearl chains’ of cells in AC fields is due to dielectrophoresis . . . . . . . . . 867
4.2. The dielectrophoretic force exerted on individual cells can be accurately measured . . . . 868
4.3. The intercellular attraction force increases with decreasing the intermembrane separation
and is proportional to the square of the field intensity . . . . . . . . . . . . . . . . . . . . . . . . . . . 870
4.4. The attraction of cells induced by AC fields can affect fusion efficiency . . . . . . . . . . . . 871
852

Electrofusion and electroporation 853
5. Electroporative pulses induce fusion of adhered membranes . . . . . . . . . . . . . . . . . . . . . . . . . . 872
5.1. Electrofusion is induced at the same threshold voltages as electroporation . . . . . . . . . . . 872
5.2. Devices for electrofusion are very similar to those for electroporation . . . . . . . . . . . . . . 874
5.3. Long-lived fusogenic states exist after membrane electroporation . . . . . . . . . . . . . . . . . . 874
5.4. Fusion is localized and results in formation of intracellular vesicles . . . . . . . . . . . . . . . . 875
5.5. The cell cytoskeleton is reorganized during electrofusion . . . . . . . . . . . . . . . . . . . . . . . . . 877
5.6. Assays based on fluorescence dyes allow accurate measurement of fusion kinetics . . . . 879
5.7. Fusion occurs after a lag time (delay) following the application of the fusogenic trigger 879
5.8. Delays in electrofusion decrease with an increase in the field strength and are
proportional to the solution viscosity . . . . . . . . . . . . . . . . . . . . . . . . . . . . . . . . . . . . . . . . . 8805.9. Rates of fusion can provide information for the time coarse of membrane merging and
fusion pore expansion . . . . . . . . . . . . . . . . . . . . . . . . . . . . . . . . . . . . . . . . . . . . . . . . . . . . . 8805.10.Fusion yields and delays are related but may reflect different properties of the fusing
membranes . . . . . . . . . . . . . . . . . . . . . . . . . . . . . . . . . . . . . . . . . . . . . . . . . . . . . . . . . . . . . . 883
6. Kinetic pathways of membrane fusion resemble coalescence in colloid systems . . . . . . . . . . . 884
6.1. ‘Fusion’ of lipid monolayers on liquid surfaces is by diffusion or intermixing driven by
surface pressure gradients . . . . . . . . . . . . . . . . . . . . . . . . . . . . . . . . . . . . . . . . . . . . . . . . . . 884
6.2. Fusion of bilayers requires overcoming the intramembrane attraction . . . . . . . . . . . . . . . 886
6.3. The molecular mechanism of bilayer fusion is unknown . . . . . . . . . . . . . . . . . . . . . . . . . 890
6.4. Fusion of cell membranes can be qualitatively described but the molecular
rearrangements remain unclear . . . . . . . . . . . . . . . . . . . . . . . . . . . . . . . . . . . . . . . . . . . . . . 8907. Fusion in life processes involves specialized proteins but kinetically can be similar to
electrofusion . . . . . . . . . . . . . . . . . . . . . . . . . . . . . . . . . . . . . . . . . . . . . . . . . . . . . . . . . . . . . . . . . 892
8. New approaches are needed to understand molecular mechanisms of fusion . . . . . . . . . . . . . . 893
Acknowledgement . . . . . . . . . . . . . . . . . . . . . . . . . . . . . . . . . . . . . . . . . . . . . . . . . . . . . . . . . . . . 893
List of symbols . . . . . . . . . . . . . . . . . . . . . . . . . . . . . . . . . . . . . . . . . . . . . . . . . . . . . . . . . . . . . . . 893
References . . . . . . . . . . . . . . . . . . . . . . . . . . . . . . . . . . . . . . . . . . . . . . . . . . . . . . . . . . . . . . . . . . . . . 895

1. Introductory remarks
1.1. Membrane fusion ensures specific, controlled transfer of molecules in lifeprocesses and is important for biotechnology and biomedical research
Fusion of membranes is a physical process which was of critical importance forthe rapid evolution of life on earth and is involved in a variety of life processestoday. One could imagine that billions of years ago the mechanical and/or electricalinteractions in the ancient ocean mediated close apposition and destabilization ofmembranes which resulted in their fusion. Fusion of parts of the same membraneled to cell division and fusion of different membranes resulted in cell fusion. Bothphenomena led to transfer and exchange of molecules which contributed to the rapidacceleration of the evolution of life on earth. One could further speculate that the‘first’ fusion reactions were non-specific and any membranes could fuse providedappropriate conditions, including molecular contact, membrane destabilization andproper composition. Subsequently, specialized proteins appeared which led to thespecific fusion of membranes and to controlled transfer of molecules. Today, thespecific fusion of membranes seems to be the predominant mode of fusion in bio-logical systems; however, the ability of membranes to fuse non-specifically, e.g., byexternal electric fields, provides information about the fundamental mechanisms offusion and is important for biotechnology, medicine and research in biology.
1.2. Manifestations of cell fusion were observed nearly two centuries ago, whileelectrofusion was discovered in the late 1970’s
The first manifestations of a fusion phenomenon were observed almost two centuriesago by the German biologist Johannes Muller (see [1]). He discovered multinucleatedgiant cells in histological specimen while studying pathological conditions. By theturn of the nineteenth century, the medical literature contained several reports of‘polykaryocytosis’ as symptomatic of a variety of diseases, including tuberculosis,variola, varicella, and rubeola. This raised the question whether these giant cellsoriginated from successive mitoses or from fusion of mononucleated cells [2]. Laterfusion was clearly established [3] as a mode of their formation, but it was not untilthe 1960’s, when the studies of fusion ‘exploded’. During a relatively short period oftime a number of interesting fusion phenomena were discovered and characterized byusing light microscopy (for history see [1]): (i) viruses can induce formation of giantmultinucleated cells (syncytia) [4–6], (ii) during fertilization the acrosomal membraneinterdigitates and then coalesces with the egg membranes [7], (iii) mononucleatedmyoblasts fuse to form myotubes, at least in vitro [8, 9], and (iv) cell hybrids can beformed in vitro by spontaneous cell fusion [10, 11]. The interest in studying fusion
854

Electrofusion and electroporation 855
grew in the next decades mainly because of its importance for production of hybridcells. In the early 1970’s polyethylene glycol was introduced as a fusion agent forplant protoplasts [12, 13] and animal cells [14] (see also the chapter of K. Arnoldin this book). In the late 1970’s groups from Japan and Germany reported that cellfusion can be also induced by external electric fields (electrofusion) [15–18].
1.3. Electric fields can induce fusion of a wide variety of membranes
During the last decade numerous studies have shown that external electric fieldscan induce fusion of a wide variety of cell and artificial membranes (for review see[19–23]. This experimental observation is a demonstration of an inherent ability ofmembranes to fuse if appropriate conditions are provided and indicates the existenceof properties of membrane systems, related to fusion, which are largely independentof the type of membranes. These properties include membrane stability and adhesion.Membranes are designed by nature to be stable and resist external constraints. Theymust be destabilized, i.e. they must be forced to change their structure to molecularconformations appropriate for fusion. The destabilized membranes must be at closeapposition to allow merging of their lipid matrix. Therefore, understanding of fusionmechanisms requires understanding mechanisms of membrane destabilization andestablishment of contact. External direct current (DC) fields can destabilize mem-branes and induce formation of pores (electroporation) (for recent review see [23]).External alternating current (AC) fields can induce membrane approach and contactpredominantly by a process termed dielectrophoresis [24]. In the following chap-ter, I will focus on membrane fusion induced by electric fields (electrofusion) but Iwill also discuss electroporation and dielectrophoresis which are closely related toelectrofusion.
I first briefly discuss polarization as one of the basic mechanisms of interactions ofmembranes with electric fields, leading to electroporation, dielectrophoresis and elec-trofusion, and then summarize observations on electroporation and dielectrophoresisrelated to electrofusion. In the rest of the chapter, I focus on observations of elec-trofusion and on the current concepts of its mechanisms. Why electrofusion may beimportant for understanding biological fusion is also briefly discussed.
2. Polarization of membranes underlies their destabilization, adhesion andfusion
2.1. Polarization is due to restricted motion of charges
External electric fields can induce formation of pores in membranes, move cells bydielectrophoresis and fuse membranes. All these phenomena are based on the samephysical process: the polarization of material in electric fields. The polarization ofmembranes or any other material results from the fundamental interaction of electricfields with charges. Electric fields exert forces on charges which can either moveif they are free to do so or accumulate if they are limited in their motion. Thefree motion of charges depends on the conductivity of the material while the charge

856 D.S. Dimitrov
Fig. 1. Membranes restrict motion of charges and lead to cell polarization by external electricfields. The induced transmembrane voltage is maximal at the cell poles and minimal at the equator.
Adapted from [37].
redistribution in a limited space is characterized by its polarizibility. Figure 1 illus-trates schematically how cells can be polarized due to the restricted motion of ionsimposed by the plasma membranes.
2.2. Interaction of electric fields with polarized membranes induces mechanicalstresses
The interaction of the external electric fields with the polarized material results inforces which can then induce motions inside particles or motion of the particles aswhole. The motions inside the material can result in structural rearrangements oreven mechanical fracture in the material, which for membranes can subsequently leadto their electroporation and electrofusion. The motion of the particles as a whole canoccur even in the absence of a net charge, but only in non-uniform electric fields. Itis a consequence of the interaction of the redistributed charges which have zero netcharge but locally interact with electric fields of different strength, which leads to anet force exerted on the particle. This phenomenon, termed dielectrophoresis [24],can also occur in homogeneous external fields if there are other particles yieldinglocal non-uniformities of the electric field. This leads to mutual attraction of theparticles, to their approach and eventually to adhesion.

Electrofusion and electroporation 857
2.3. Forces exerted on polarized membranes can induce structuralrearrangements, approach of membranes and their fusion
The magnitude and the type of motion depends on the electric field, the natureand geometry of the material. Membranes have low polarizibility (relative dielec-tric constant about 2) and low conductivity (specific membrane conductance about1 mS/cm2, which corresponds to a ‘bulk’ conductivity of about 1 nS/cm), surroundedby a medium of high dielectric constant (about 80) and high conductivity (about0.1 S/cm). Application of external fields to membrane systems leads to motion ofions in the medium surrounding the membranes, accumulation of charges at the mem-brane surfaces and membrane polarization. The charges at the membrane surfacescreate electric field inside the membrane which is commonly of much higher strengththan the field in the surrounding medium. The electric field inside the membraneinteracts with the polarized membrane material which results in intramembrane mo-tions and structural rearrangements. At sufficiently high field strengths these eventscan lead to formation of pores and discharge of the membrane surfaces by ionic cur-rents through the pores. If another membrane is at close apposition, the molecularrearrangements can also result in fusion by mutual diffusion of the lipid moleculeswhich leads to their intermixing and membrane merging. The molecular contactneeded for fusion can be enhanced by the mutual attraction of the two polarizedmembranes. While this qualitative description of the interactions of membranes withelectric fields leading to electroporation, mutual approach and fusion probably reflectsbasic features of those phenomena, the quantitative modeling and understanding oftheir molecular mechanisms are very complicated and far from clear. In the nexttwo sections I describe basic experimental approaches and observations, as well asattempts for theoretical modeling of electroporation and dielectrophoresis.
3. High voltage pulses electroporate membranes
3.1. High voltage pulses can permeabilize membranes
In the late 1960’s and the early 1970’s it was found that application of high volt-age direct current (DC) pulses to cell suspensions leads to killing of bacteria andyeasts [25], lysis of erythrocytes and protoplasts [26], release of catecholamines andATP from chromaffin granules [27] and transcellular ion flow in bacteria [28] (forearly electroporation data see [22]). This was originally attributed to electric break-down of the cell membrane, which implies irreversible rupture of the membrane[26]. Later it was shown that the membrane permeability changes can be transient innature [27] and that they can be analyzed in terms of reversible dielectric breakdown[29]. The first electroporative gene transfer into living cells with the subsequent ac-tual expression of the foreign gene [30] led to explosive development of the studieson interactions of membranes with high voltage pulses. The term electroporationwas introduced by Neumann [30] and presently generally accepted to refer not onlyto the phenomenon of formation of pores but also to all pore related events causedby exposure of membranes to high field strengths [31]. How actually electroporesmay look like is shown in fig. 2.

858 D.S. Dimitrov
Fig. 2. Left panel: external (E) membrane face of an electropermeabilized human red blood cell frozenat 40 ms after the application of a high voltage pulse. Right panel: protoplasmic (P) membrane face of
an electroporated erythrocyte frozen at 220 ms after the pulse. 60,000×. Borrowed from [157].

Electrofusion and electroporation 859
3.2. The devices for electroporation are conceptually simple
One of the reasons for the success of the electroporation as a method of choice forgene transfer and studies of membrane behavior in electric fields is the conceptualsimplicity of the experimental devices used to induce electroporation. They consistof two electrodes embedded in the cell suspension (see, e.g., fig. 1, where only onecell is shown). The electrodes are connected to a high voltage pulse generator whichallows to control the voltage and duration of the electric pulse. The gene DNA orany other water soluble substance, which should be transferred into cells, is in themedium. The pulse application results in formation of pores in the cell membrane.This leads to exchange of molecules between the medium and the cytoplasm bydiffusion, electroosmosis or other mechanisms. The membranes resealed after thepulse and the substance of interest is entrapped inside the cells.
3.3. The transmembrane voltage induced by the external electric fields isaccurately described by a simple formula
Presently there are a wide variety of protocols, electrode configurations, media com-position and pulse generators which can be used to electroporate a number of cells(for recent review see [23]). Let us consider a membrane which forms a sphericalshell as shown in fig. 1. The application of an external electric field leads to currentsof ions, which accumulate at the membrane surfaces and give rise to induced surfacepotentials on both sides of the membrane. This results in creation of a voltage Vacross the membrane. The basic relationship which is mostly used to estimate thistransmembrane voltage induced by a rectangular pulse of field strength E is
V = Vm[(1− exp(−τ/tp)
], (1)
where Vm is the maximal value of the transmembrane voltage, τ is the duration ofthe pulse and tp is the characteristic polarization time. For spherical membranes ofradius R, Vm and the charging time constant tp are given by [32, 33]
Vm = 1.5ER cos δ, (2)
tp = RCm(ri + 0.5r0), (3)
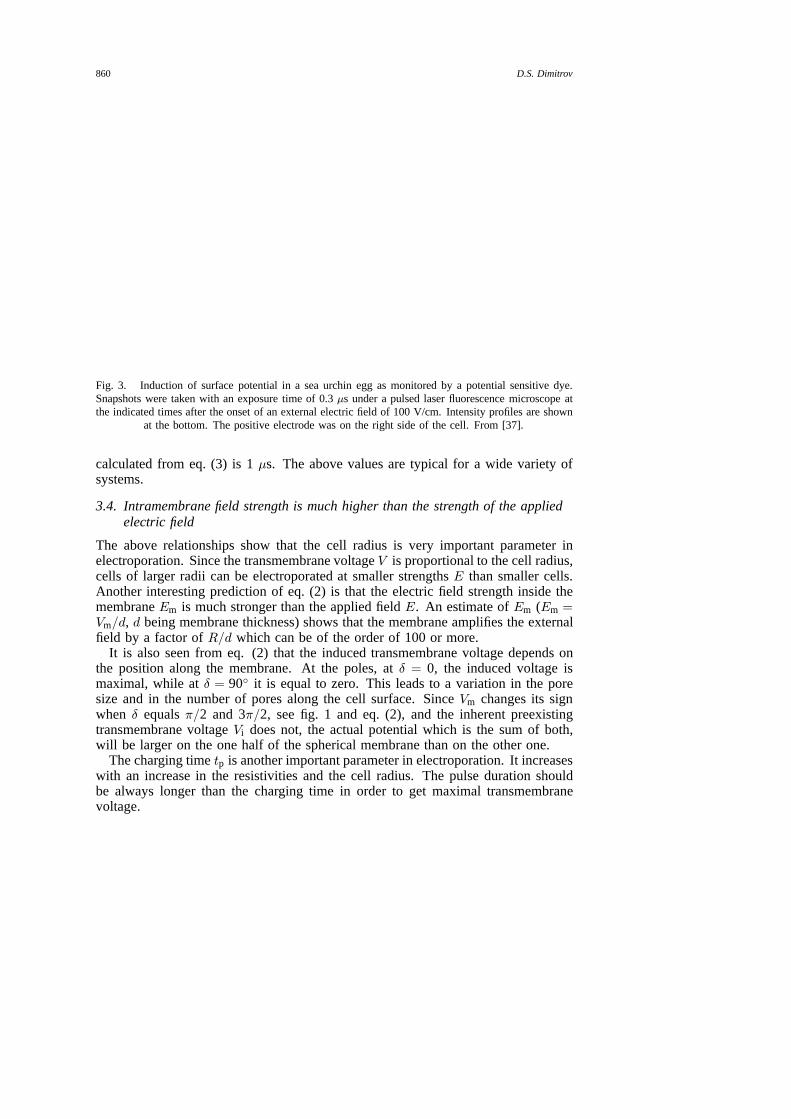
where δ is the angle between E and the radius vector, see fig. 1, Cm is the membranecapacitance, ri and r0 are resistivities inside and outside the cell, and the membraneconductance was neglected (see also [34]). Applicability of eq. (2) to membranesystems was confirmed by using voltage sensitive dyes [35–37], see fig. 3. For thesystem, used by Kinosita and his collaborators [37], the radius of the sea urchin eggsis 5×10⁻³ cm, a typical electric field strength E is 100 V/cm, the membrane capac-itance Cm is 1 µF/cm2, the resistivity of the Ca2+-free sea water r0 is 20 ohm·cm,and the intracellular resistivity ri is 200 ohm·cm. The maximal induced transmem-brane voltage Vm as calculated by using eq. (2) is 0.75 V and the charging time tp
860 D.S. Dimitrov
Fig. 3. Induction of surface potential in a sea urchin egg as monitored by a potential sensitive dye.Snapshots were taken with an exposure time of 0.3 µs under a pulsed laser fluorescence microscope atthe indicated times after the onset of an external electric field of 100 V/cm. Intensity profiles are shown
at the bottom. The positive electrode was on the right side of the cell. From [37].
calculated from eq. (3) is 1 µs. The above values are typical for a wide variety ofsystems.
3.4. Intramembrane field strength is much higher than the strength of the appliedelectric field
The above relationships show that the cell radius is very important parameter inelectroporation. Since the transmembrane voltage V is proportional to the cell radius,cells of larger radii can be electroporated at smaller strengths E than smaller cells.Another interesting prediction of eq. (2) is that the electric field strength inside themembrane Em is much stronger than the applied field E. An estimate of Em (Em =Vm/d, d being membrane thickness) shows that the membrane amplifies the externalfield by a factor of R/d which can be of the order of 100 or more.
It is also seen from eq. (2) that the induced transmembrane voltage depends onthe position along the membrane. At the poles, at δ = 0, the induced voltage ismaximal, while at δ = 90◦ it is equal to zero. This leads to a variation in the poresize and in the number of pores along the cell surface. Since Vm changes its signwhen δ equals π/2 and 3π/2, see fig. 1 and eq. (2), and the inherent preexistingtransmembrane voltage Vi does not, the actual potential which is the sum of both,will be larger on the one half of the spherical membrane than on the other one.
The charging time tp is another important parameter in electroporation. It increaseswith an increase in the resistivities and the cell radius. The pulse duration shouldbe always longer than the charging time in order to get maximal transmembranevoltage.

Electrofusion and electroporation 861
Fig. 4. (a) The duration of the electric pulse τ needed to disrupt lipid bilayer membranes decreases withincreasing the transmembrane voltage V . Empty circles indicate bilayers of phosphatidylcholine, solid cir-cles show the data for the same bilayers but in the presence of 4×10⁻⁴ g/l lysophosphatidylethanolamine,and the empty triangles correspond to bilayers from phosphatidylethanolamine. The continuous lines area theoretical prediction from an energy-based stochastic approach for electroporation [41]. From [65].(b) The pulse duration τ needed for electroporation decreases with the increasing temperature T . The
transmembrane voltage applied across the pea protoplast membranes was 1.7 V. From [40].

862 D.S. Dimitrov
Fig. 5. (a) Restoration of membrane permeability occurs within minutes to hours. (Lower curve)Erythrocytes became leaky to Rb+, but not to sucrose, after a treatment with a 4 kV/cm pulse for2 µs. Restoration of the membrane permeability took more than 30 min. (Upper curve) Red blood cellsbecame transiently permeable to sucrose after treatment with high voltage pulses (3.7 kV/cm) for longerperiods of time (20 µs). Restoration of the membrane permeability against Rb+ took more than 20 hr.From [45]. (b) The rate of pore resealing increases with an increase in temperature. Human erythrocyteswere subjected to electrical pulse (E = 6 kV/cm, t = 40 µs) and their permeabilities were measured atdifferent times after the pulse. Then the rate constants of resealing, kR, were calculated and plotted asfunction of the temperature. From the slope of the Arrenius plot a mean value of 28.1± 1.8 kcal/mole
was calculated for the activation energy. From [44].

Electrofusion and electroporation 863
3.5. Membranes are electroporated when the transmembrane voltage exceeds athreshold value
Electroporation is a threshold phenomenon. Substances can be exchanged throughelectroporated membranes only if the transmembrane voltage exceeds a certain crit-ical value which for cells is in the range from several hundreds mV to 1–2 V [22,37–40]. The threshold voltage depends on the pulse duration [39–41]. An increase inthe pulse duration needed for electroporation leads to a decrease in the critical voltage(fig. 4a). The pulse duration needed for electroporation at constant transmembranevoltage decreases with an increase in temperature (fig. 4b). The activation energy forthe data shown in fig. 4b is 15 kcal/mol. Once the transmembrane voltage reachesits critical value, the poration takes place within microseconds [37, 38, 42]. Longerelectric pulses produce larger pores [43]. The fast recovery of cell membranes afterporation occurs within milliseconds while the complete recovery may lasts for sec-onds, minutes [35, 37, 44] or even hours [45] (fig. 5a). The reseal of electropores inlipid domains also may take seconds [36, 46]. The rate of pore reseal increases withincreasing temperature (fig. 5b). The activation energy for the reseal (28 kcal/mol[44]) is somewhat higher than that for the formation of pores. Pulses of very longduration or/and high voltage can lead to irreversible membrane destabilization withsubsequent membrane fragmentation. Loading of cells with water soluble moleculesvary widely within the cell population (fig. 6), which may indicate variations ofmembrane properties and/or size between individual cells.
3.6. Transfer of molecules by electroporation is asymmetric
Permeation of ions and fluorescence dyes through the porated membranes have oftenbe found to be asymmetric [47–50]. In some cases, e.g., in sea urchin eggs the dyeand Ca2+ permeation was much higher on the negative-electrode side, whereas thedye burst was seen mainly on the positive side in liposomes [37]. It was suggestedthat the inherent physiological potential is added to the induced transmembrane po-tential and this is the cause of the asymmetric formation of pores [48]. This expla-nation, however, can not be applied to the sea urchin eggs where the higher potentialis on the positive side. The electroosmotic flow can also cause asymmetric transferof molecules due to the negative surface charge of the plasma membranes [49, 50].This explains the motion of molecules from the negative toward the positive elec-trode but can not explain the observations that molecule transfer was observed longafter the removal of the electric field. Further studies are needed for elucidation ofthe mechanisms of the asymmetric electroporation.
3.7. The threshold voltage of electroporation decreases with an increase inintramembrane mechanical stresses (membrane tension)
An interesting observation which can provide clues for the mechanism of electro-poration is that the critical voltage needed for poration of cell membranes decreaseswith an increase in the membrane tension controlled by osmotic forces [51, 52].Needham and Hochmuth [53] developed a new experimental approach based on mi-cropipette technique which allows to set precisely the membrane tension and measure

864 D.S. Dimitrov
Fig. 6. Population distribution of the number of FITC-dextran molecules taken up by cells subjectedto a single 50 µs pulse of 8 kV/cm strength. The average of this distribution corresponds to 1.4 ×10⁵ molecules of FITC-dextran. The wide distribution around this mean value is clearly indicated by
the graphical display. From [158].
the critical voltage of membrane permeabilization. They found that for lipid vesiclesthe square of the critical transmembrane voltage is linearly related to the membranetension (fig. 7). At zero membrane tension, the critical membrane voltage increasedfrom 1.1 to 1.8 V with an increase in cholesterol content. These results indicate thatthe electric fields induce stresses in the membranes, which are equivalent to stressesinduced by external mechanical pressures as those in the micropipettes and that thosestresses depend on the lipid composition, especially on the presence of cholesterol.How stresses lead to formation of pores in membranes, however, is a question whichremains to be answered.
3.8. The electromechanical models of electroporation describe membrane ruptureas mediated by intramembrane stresses induced by the field
Two main theoretical approaches were developed to describe electroporation – elec-tromechanical and energetic. They originated from theories in the physics of con-densed matter and physical chemistry of thin liquid films. The electromechanicalapproach considers membranes as elastic [51, 53–55] or viscoelastic bodies [56, 57]and applies the principles of elasticity and of physical chemistry of thin liquid films.The basic conclusion from this approach is the existence of a critical transmembranevoltage above which the membrane is unstable and eventually ruptures. The de-rived value for the critical voltage is in good agreement with the experimental data.One problem with the initial development of this approach [51, 54] was that at thecritical voltage the membrane thickness should be reduced by about 40%. For an in-compressible membrane this implies that the membrane surface area is capable of anextraordinary expansion which is not confirmed by data [53]. Two different solutions

Electrofusion and electroporation 865
Fig. 7. Critical voltages for membrane permeabilization Vc as function of applied membrane tension Σ.(a) vesicles composed of a mixture of stearoylphosphatidylcholine (SOPC) and cholesterol (1 : 1)containing small amounts (5%) of charged lipid, dioleoylphosphatidylglycerol (DOPG), in conductingsolutions (10 mM NaCl plus sucrose/glucose) (filled symbols); vesicles from SOPC:cholesterol (1 : 1) insolutions of low conductivity (1 mM NaCl plus glucose) (open symbols), (b) vesicles from erythrocytelipids in conducting solutions, (c) vesicles from SOPC containing small amounts of DOPG in conductivesolutions (filled symbols); vesicles from SOPC in solutions of low conductivity (open symbols). Thesolid curves are plots of an equation based on the electromechanical model of membrane rupture.
From [53].
to this problem were suggested. In one of them the surface tension of the two sur-

866 D.S. Dimitrov
faces of the membrane was explicitly taken into account [56] and the rupture of themembrane was considered to be due to the instability of thermal fluctuations of themembrane surface shape represented as a superposition of surface waves. This led tothe prediction that the average membrane thickness may not be changed significantlybut the membrane can be ruptured locally by the growing surface shape instabilities.Another solution of the problem of large membrane thicknesses change was the fol-lowing. The membrane tension [53] or the mechanical stresses in the membrane [55]induced by the external electric field were calculated and it was postulated that themembrane ruptures at certain critical tension which corresponds to small membranearea changes. This approach does not predict theoretically the critical voltage butrather postulates its existence as an inherent property of the membrane which canbe measured accurately. In principle this property could be calculated by using thetheories of fracture mechanics or other theories of material failure.
While ingenious and inherently correct the later approach does not allow to the-oretically predict the dependence of the critical voltage on the pulse duration. Anapproach based on the viscoelastic behavior of the membranes was suggested toexplain this dependence [56]. According to the viscoelastic model of membraneelectroporation, the external electric field leads to growth of unstable undulationsof the membrane surface with a rate proportional to the membrane viscosity. Themembrane ruptures when the amplitude of the fastest growing perturbation becomesequal to the membrane thickness. The predictions of the viscoelastic model and itsgeneralizations [58] are in good agreement with data for cell membranes [39, 40]and bilayer lipid membranes [41]. The calculated concentration of pores is also closeto that observed for erythrocyte membranes by Chang, which is 8/µm2 [59]. It mustbe pointed out that models based on surface shape instabilities could describe onlyinitial stages of pore formation. Whether those pores expand and rupture irreversiblythe membranes cannot be predicted by these models, at least at this stage of theirdevelopment.
3.9. The energy-based approaches describe formation and expansion of pores asovercoming energy barriers
A conceptually different approach for describing the formation and expansion ofpores induced by electric fields is based on energy considerations [41, 60–66]. Itwas assumed that the free energy of the pores is a sum of two components – oneis due to the surface energy and the other one is due to the pore edge energy (linetension). While the surface energy component tends to expand the pores, the edgeenergy component tends to close them. When the pore radius exceeds a criticalvalue equal to the ratio of the surface energy density to the pore edge energy, thepore expands spontaneously until the membrane ruptures. Pores with radii smallerthan the critical one have to overcome an energy barrier in order to increase theirradii above the critical one. This takes time which is inversely proportional tothe Boltzmann’s factor exp(−Ea/kT ), where Ea is the height of the energy barrier,k is Boltzmann’s constant and T is the absolute temperature. The application ofexternal electric fields leads to a decrease in the pore energy due to the polarizationof water in the pore which is higher than that of the membrane material. This

Electrofusion and electroporation 867
decreases the energy barrier with a factor which is proportional to the square of thetransmembrane voltage. The decrease of the energy barrier leads to shorter periodsof time needed to overcome that barrier and reach the critical pore radius. Thestochastic mechanism of pore expansion by overcoming energy barriers can describea number of experimental data for bilayer lipid membranes (for review see [64–66]).However, like the electromechanical model it is phenomenological and does notallow to distinguish between hydrophobic and hydrophilic pores or other structures.It is assumed that the pores allowing transfer of molecules are hydrophilic pores,which originate from hydrophobic pores. The details of the mechanism of conversionto hydrophilic pores is unknown.
It seems reasonable to assume that the formation of hydrophilic pores results fromthe growth of unstable shape undulations of the membrane surfaces and partiallyby conversion of hydrophobic pores. The creation of pores by the electric fielddoes not preclude the possibility that preexisting pores can serve as ‘nucleation’sites for formation of larger pores [67]. The relative contribution of each of thesetwo mechanisms of initial formation of pores depends on the phase state of themembranes and the pulse strength.
Several other approaches for describing the formation of pores and the kinetics ofelectroporation were suggested [34, 62, 63, 68]. While some of these models suggestplausible molecular rearrangements during electroporation, rigorous experimentalprove is lacking.
The above considerations mainly apply to the formation and expansion of pores inlipid membranes. This does not exclude the possibility for pore formation throughintegral proteins or at the lipid-protein interface [44, 68] (fig. 8). How actually thepores are formed is not clear yet.
Fig. 8. Schematic view of the various types of membrane alterations and defects following electropo-ration. The scheme illustrates the concept that the field pulse might perturb integral and/or peripheral(membrane skeletal) proteins and thereby affect the organization of the lipid domains. Leakes (l) andflip sites ( ) ) could be located in (A) hydrophobic pores, (B) hydrophilic pores, (C) nonlamellar phases,or (D) areas of a mismatch between lipid and integral proteins. Leaks could also be formed between
aggregated proteins (E). From [44].

868 D.S. Dimitrov
4. Mutual attraction and adhesion of the cells in AC fields is due todielectrophoresis
4.1. Formation of ‘pearl chains’ of cells in AC fields is due to dielectrophoresis
Nearly one century ago, Kerr observed electric field-mediated formation of ‘pearlchains’ linking many suspended particles (mentioned by O’Konski [69]). Liebensyobserved the same phenomenon with erythrocytes [70]. Figure 9 shows an exampleof aligned cells in electric fields. Pearl chain formation can be considered as a specialcase of the movement of particles in non-homogeneous fields because one particledistorts the field acting on the other and vice versa. Movement of cells will take placeif the gradient of the square of the electric field strength does not vanish (fig. 10)and if the force is strong enough to overcome the thermal motion. The motionof particles in non-homogeneous fields was termed dielectrophoresis [24]. Krasny-Ergen [71] applied the principal of minimal potential energy to study theoreticallythe pearl chain formation. Later this effect was investigated thoroughly by Schwanand coworkers [72, 73] and Pohl [24].
Fig. 9. Formation of pearl chains by dielectrophoresis of mouse leukemic lymphoblasts as observed byphase contrast. The applied AC field was of 0.8 kV/cm strength and 100 kHz frequency. From [117].

Electrofusion and electroporation 869
Fig. 10. Charge separation and force on a cell in (a) a homogeneous and (b) an inhomogeneous electricfield. From [159].
4.2. The dielectrophoretic force exerted on individual cells can be accuratelymeasured
The dielectrophoretic force F acting on a spherical particle of radius R in an inho-mogeneous field of strength E can be represented as
−→F = 2πR3ε0Ke∇E
2 (4)
where ε0 is the permettivity of free space and Ke is an effective net polarizabilityof the cell.
The cell polarizability Ke was measured for a wide variety of cells by using sev-eral different approaches [24, 74–77]. The dynamic method for measuring Ke isbased on measuring the rate of motion of single cells in a cylindrically symmetri-cal system and calculating the force F by using the Stokes formula [74, 78]. Thebasic advantage of this method is that it allows accurate measurement of Ke forindividual cells. It was found that Ke depends on the solution conductivity [24, 79],the frequency of the electric field [24, 77, 80], calcium ions [79], the type of cells[24, 76, 77] and surface charge [81]. A typical value for pea protoplasts (radius15 µm) at solution conductivity 0.47 mS/m and frequency 1 MHz is Ke = 110.One of the basic conclusions is that in the radio frequency range most of the livingcells behave as highly conductive spheres and the dielectrophoretic force can beestimated by assuming that the cell polarizability Ke is of the order of the relativepermettivity of the surrounding medium (for water solutions of the order of 10 to100).
4.3. The intercellular attraction force increases with decreasing the intermembraneseparation and is proportional to the square of the field intensity
Similar considerations are valid for the interaction of two cells in AC fields. Theinteraction force in the radio frequency range can be estimated by assuming that thecells behave as highly conductive spheres. The calculations are, however, very com-plicated and can be evaluated only numerically [82]. Their evaluation showed verygood agreement with the experimental data [82] (fig. 11). The data for the force ofattraction in the low frequency (60 Hz) [83] and the radio-frequency (0.1–10 MHz)

870 D.S. Dimitrov
Fig. 11. (a) Dependence of the intermembrane separation h on time ti = tc − t during mutualdielectrophoresis of cells, tc is the time required to make contact (t = tc at h = 0); (b) Force F ofmutual attraction as a function of the dimensionless separation L/R = 1 + h/2R calculated from theexperimental data in the range of 1 to 10 MHz (points) and theoretical prediction for highly conductive
spheres (continuous line). F0 = ε0εrE2R2, εr is the relative permettivity. From [82].
range [82] was obtained from the measured rates of approach of the cells. It wasfound that i) the force of mutual attraction increases strongly with decreasing theseparation distance, ii) the membranes deform at close apposition to form almostplane-parallel surfaces, and iii) the force of attraction is proportional to the squareof the electric field strength (fig. 12).

Electrofusion and electroporation 871
Fig. 12. (a) Dependence of separation h on time t for erythrocyte ghosts in 60 Hz AC fields fortwo different field strengths, 8 V/mm and 16 V/mm; (b) Calculated force of attraction F as function of
separation. From [83].
4.4. The attraction of cells induced by AC fields can affect fusion efficiency
The equilibrium separation between the membranes is determined by the balanceof the dielectrophoretic force and the repulsive intermembrane forces (hydration,electrostatic, steric). Therefore any increase in the AC field strength leads to a de-crease in the intermembrane separation. Another important parameter is the contactarea between the membranes. Any increase in the contact area leads to a higherprobability of fusion. The increase in the force of attraction induced by the exter-nal AC field results in an increase of the contact area and the membrane tension.Therefore, increasing the intensity of the AC fields can enhance fusion by increasingthe probability for fusion. Very high AC field strengths, however, may result in

872 D.S. Dimitrov
heat generation and turbulent flows, which decrease the fusion efficiency. Hence, anoptimal AC field strength exists at which the fusion efficiency is maximal.
After removing the AC field, the cells commonly separate, driven by Brownianmotion. This indicates that AC fields lead to reversible cell aggregation and arenot sufficient to overcome the energy barriers preventing adhesion and fusion ofmembranes. In several instances, however, it was observed that AC fields caninduce permanent adhesion of red blood cells [74, 78, 84]. This was originallyattributed to fusion, but later was found to be tight adhesion or in the best caseprobably semi-fusion. Therefore, electric fields of higher intensity should be appliedto induce real fusion. They should, however, be applied for short periods of timeto avoid heat generation and turbulent flows, which can disrupt the cell aggregates.How membranes can be fused by such high voltage pulses is discussed next.
5. Electroporative pulses induce fusion of adhered membranes
5.1. Electrofusion is induced at the same threshold voltages as electroporation
In 1979 Senda et al. published a paper describing an interesting observation [15].When an electric field was applied by microelectrodes to two plant protoplasts,brought at close contact by using a micromanipulator, the cells underwent mor-phological changes until they formed a single fusion product as observed by lightmicroscopy. At about the same time three other research groups fused cells byhigh voltage electric pulses but using different approaches to bring the cells at closecontact. The Berg’s group used polyethylene glycol (PEG) to aggregate cells andthen stimulated yeast protoplast fusion by electric field [17]. The evidence for fu-sion was genetic because the pulses led to formation of viable hybrids which grewon minimal media to form prototrophic colonies. Neumann et al. [16] achievedcell agglutination by rolling the cell suspension in plastic tubes, while Zimmermannand Scheurich [18] used AC fields to bring plant protoplasts at close approach bydielectrophoresis. Figure 13 shows an example of electrofusion as observed by afluorescent dye redistribution assay [85].
The common and striking feature of these observations of electrofusion was thatthe magnitude of the transmembrane voltage needed for fusion was about the same(of the order of 1 V) as that for electroporation, while electrofusion was insensitiveto the way the cells were brought into contact. Later it was demonstrated that notonly the absolute value of the transmembrane voltage correlates with that neededfor electroporation, but also the entire functional dependence of the pulse voltageon its duration is the same (fig. 14) [40]. These observations led to conclusionsimportant both for the design of protocols for efficient fusion and for understandingits mechanisms.
5.2. Devices for electrofusion are very similar to those for electroporation
Since electrofusion is so similar to electroporation with respect to the characteristicsof the electric pulses, the devices used for electrofusion are very similar to those

Electrofusion and electroporation 873
Fig. 13. Electrofusion of erythrocyte ghosts as demonstrated by a fluorescence dye redistribution assay[85]. One cell, originally labeled with DiI, is surrounded by two originally unlabeled cells which arenot visible under fluorescence. The labeled cell does not show any indication of dye transfer before thepulse (79 : 24 : 74). The high-voltage electric pulse (strength 0.3 kV/mm, duration 0.9 ms) is applied at79 : 25 : 44. The first appearance of fluorescence as small ‘horns’ on the originally unlabeled cells canbe seen about 4 sec later (at 79 : 29 : 04). The horns increase in length (79 : 32 : 89) until reaching theend of the originally unlabeled membranes (79 : 40 : 56) and the state of uniform fluorescence brightness
at 80 : 05 : 15. The width of the alphanumerics is 50 µm. From [85].
used for electroporation. The main difference is in the way the cells are brought atclose contact. A wide variety of approaches has been used to induce cell contact,including mechanical by utilizing micromanipulators and centrifugation; chemical,by utilizing PEG and other agglutinating substances, and electric, by using AC fields.The cells can also make contact spontaneously or the contact can be achieved byincreasing the cell concentration. One of the most used and convenient way to inducecell adhesion is by dielectrophoresis [24, 86]. In the rest of this chapter I discuss

874 D.S. Dimitrov
Fig. 14. Correlation between the threshold transmembrane voltage V of electrofusion (triangles), ofelectroporation (circles) and of cell destruction (squares) as function of the pulse duration τ . The squareof the threshold voltage is inversely proportional to the pulse duration in agreement with the fluctuation
wave mechanism of electroporation. From [40].
predominantly electrofusion of cells brought at close approach by dielectrophoresisnot only because it is widely used but also because it allows fine regulation of theseparation between membranes.
An electrofusion device consists of a generator and a chamber. The generatortypically has three main components: 1) high voltage generator for DC pulses ofshort duration, 2) AC generator for inducing dielectrophoresis, and 3) electronicswitch which switches the DC and AC fields. The DC pulses can be either exponen-tially decaying, squared or radio frequency modulated. The AC field is commonlyin the MHz range, but low frequency electric fields (60 Hz) were also used. Thegenerator output is connected to the working chamber which has two electrodes,commonly made from platinum. The size and configuration of the electrodes varywidely. The simplest configuration consists of two plane-parallel electrodes embed-ded in the cell suspension. In this case the cell concentration should be relativelyhigh. The separation between the cells should be of the order of their diameters orless to allow for efficient mutual dielectrophoresis to occur. For diluted cell suspen-sions cylindrical or spherical electrodes may be more appropriate. Those electrodescreate non-homogeneous fields which move the cells leading to an increase of thecell concentration near the electrodes (if the dielectrophoresis is positive which isthe common case for biological cells). Excellent reviews for different electrodeconfigurations and generators can be found in the book of Chang et al. [23].
5.3. Long-lived fusogenic states exist after membrane electroporation
The classic protocol for inducing fusion is to bring the cells at close approach (e.g., bydielectrophoresis) first and then to apply the high voltage DC pulse. It was, however,occasionally observed that cells still can be fused if the pulse is applied first and thenthe cells are brought at contact [87, 88]. In 1986 Sowers’ and Teissie’s groups studiedthoroughly this phenomenon and found that erythrocyte ghosts [89] and Chinese

Electrofusion and electroporation 875
hamster ovary cells [90] can be fused by the pulse-first protocol. The efficiencyof fusion is, however, somewhat lower than that for the contact-first protocol [91]and multiple pulses must be applied [92]. These observations led to the concept ofexistence of long-lived fusogenic states [89] or transient permeant structures [90].The life-time of these states is in the range of seconds to minutes and therefore poressurrounded solely by lipid molecules in liquid-crystalline state are unlikely candidatesfor such states because their life-time is much shorter. In cell membranes, however,proteins could be involved or lipid domains in solid state or both. In support ofthis hypothesis are the observations that the long-lived fusogenic state is laterallyimmobile within the time scale of the experiments which is of the order of minutes[90, 92]. A 31NMR study of the membrane phospholipid organization in Chinesehamster ovary cells following electroporation suggests that the organization of thepolar heads is altered [93]. This can lead to an increase in the surface hydrophobicity,which was observed experimentally for plant protoplasts [94]. The increase in thesurface hydrophobicity can result in a decrease of the repulsive hydration forces,enhanced membrane contact and fusion [95, 96].
5.4. Fusion is localized and results in formation of intracellular vesicles
While the nature of the long-lived fusogenic state remains unclear, morphological andkinetic studies revealed other important characteristics of the electrofusion process.It was frequently observed that fusion of large cells was accompanied by formationof intracellular vesicles [97]. Probably intracellular vesicles are also formed during
Fig. 16. An ultrastructural model of electrofusion. (a) Within 100 ms of pulse application, the aqueouslayer between the membranes is perturbed and localized membrane contacts are formed. The membranesare also perturbed. (b) By about 2 sec membrane continuity is established. (c) Within 10 sec following
pulse application, permanent lumina are formed. From [98].

876 D.S. Dimitrov
Fig. 15. Formation of intracellular vesicles after electrofusion of erythrocyte ghosts induced with asingle pulse (E = 0.4 kV/cm, decay half-time = 1.2 ms) as revealed by thin section electron microscopy.Left panel: two stable diaphragm fusion zones shared between three erythrocyte ghosts in a pearlchain (oriented left-right); Middle and right panels: two other representative examples of stable planardiaphragm fusion zones indicating periodicity and heterogeneity in fusion pore diameters. From [100].
fusion of smaller cells but the limit of resolution of the light microscopy does notallow to identify them when their diameters is smaller than 0.2–1 µm. Electronmicroscopy studies provided further evidence that fusion is initiated locally [98, 99]and involves small areas (probably nm or tens of nms). The initial fusion sites thencan expand resulting in formation of intracellular vesicles or other structures with

Electrofusion and electroporation 877
a characteristic periodic pattern [100] (fig. 15). This led to the proposition of anultrastructural model of electrofusion by Stenger and Hui [98] (fig. 16). Accordingto this model, the membranes are at close apposition (about 15 nm) before the pulseapplication. The DC pulse leads to their local destabilization. The destabilizedareas make local contact and fuse. It is interesting to note that periodic structuresleading to local contacts were observed when erythrocytes were adhered by polyionicmacromolecules [101, 102]. Therefore one might speculate that local contacts are duenot only to the existence of local perturbation (destabilization) of the membranes butthey can arise during the subsequent approach of the membranes. A mechanism basedon the instability and growth of membrane undulations, represented as a superpositionof waves, was suggested to explain these and other observations [57, 103]. Thismechanism is discussed in more details later.
It should also be noted that the observation of intracellular vesicles following fusionsuggests an explanation how the excess membrane is removed after fusion if thetotal volume of the fused cells is kept constant. Probably fusion initiates at differentpoints in the intermembrane contact area including its perimeter. The expansion ofthe locally fused membranes then leads to formation of vesicles inside the cell whichremoves the constraint imposed by the incompressibility of the membranes.
5.5. The cell cytoskeleton is reorganized during electrofusion
One might think that not only the incompressibility of the membranes but also theintracellular filamentous proteins, known as cytoskeleton, can impose constraintsimpeding the morphological changes leading to rounding of the cells and formationof single fusion products consisting of two or more cells. By utilizing immunoflu-orescence microscopy it was shown that in Chinese hamster ovary cells the mi-crofilaments were not affected by the DC pulses, but the microtubules disappearedduring the first minutes after the pulse and then reformed during the subsequentincubation [104]. In another type of cells (CV-1), however, all three componentsof the cytoskeleton, microtubules, microfilaments and intermediate filaments under-went significant reorganization during electrofusion [105]. The microtubules playedan active role in the nuclear movement during cell fusion [105] (fig. 17). Anotherobservation supports the notion for the role of the cytoskeleton in fusion and raisesthe question for the limits of light microscopy in detection of fusion. I found thatwhile at room temperature fusion of erythrocyte ghosts, as indicated by a fluorescentdye redistribution assay, commonly does not lead to rounding of the fused cells andformation of giant cells, the exposure of the ghosts at 37◦C and higher tempera-tures leads to formation of significant number of giant cells (unpublished). A moreextensive study [100] indicated that the disrupture of the spectrin network, whichcan be considered as a rudimentary cytoskeleton, leads to formation of giant cells.The occurrence of fusion and lack of morphological changes observable under thelight microscope for erythrocyte ghosts with intact spectrin network shows that inmany cases fusion may not be detected by utilizing only light microscopy. Whethercytoskeleton affects the very act of membrane fusion remains to be elucidated.

878 D.S. Dimitrov
Fig. 17. Distribution of microtubules in cells at various stages of electrofusion. (a) Before electrictreatment, (b) after 5 min, (c) 15 min, (d, e) 30 min, (f) 2 h, (g, h) 3 h. Scale bar = 25 µm. From
[105].

Electrofusion and electroporation 879
5.6. Assays based on fluorescence dyes allow accurate measurement of fusionkinetics
The development of fusion assays based on fluorescence dyes provided more ac-curate monitoring of fusion than the light microscopy and led to the possibility tomeasure the kinetics of membrane electrofusion in real time. There are two differentapproaches utilizing fluorescent dyes. The first one is based on the redistributionof the dye from a labeled membrane to an originally unlabeled membrane observedby fluorescence microscopy. The second one relies on formation of fluorescencecomplexes upon mixing of the fusing membranes. The dye redistribution assay wasused both with membrane soluble (commonly DiI) and water soluble (commonlyFITC-dextran) dyes [85, 87], while the fluorescent complex formation assay wasused utilizing the water soluble terbium (Tb) ions and dipicolinic acid (DPA) whichupon mixing form the fluorescent Tb-DPA complex [99, 106]. The Tb/DPA assayallows continuous monitoring of fusion in cell suspensions by a spectrofluorometer,while the dye redistribution assay monitors fusion of single cells. By combining thedye redistribution assay with a videomicroscope the spatial and temporal develop-ment of the fluorescence in the originally unlabeled cells can be precisely monitored.This allowed to find and extensively characterized the lag times (delays) followingthe application of the fusogenic pulse. Because the delays are an important source ofinformation about the life-time of intermediates in fusion leading to understandingits kinetic mechanisms I next discuss delays in fusion in more details.
5.7. Fusion occurs after a lag time (delay) following the application of thefusogenic trigger
The delay is the time period between the triggering of fusion and the membranecoalescence [107]. From an experimental point of view the delay is the lag timebetween the application of the trigger of fusion and the first indication of fusion.Measuring delays requires answering several questions. When is exactly the triggerapplied? What is the response time of the measuring system? What is the minimalincrease in the signal which should be assumed as an indication of fusion? Inelectrofusion the moment of trigger application can be precisely located in time. Thetime resolution of videomicroscopy systems is of the order of tens of milliseconds.For assays based on fluorescent dyes redistribution the first indication of fusion is theincrease in the fluorescence in the originally unlabeled membrane near the membranecontact due to the diffusion of the dye. This time is also of the order of tens ofmilliseconds. Therefore, delays in electrofusion can be measured by assays, basedon fluorescent dyes redistribution monitored by videomicroscopy, with an accuracyof the order of tens of milliseconds.
Delays in fusion vary widely for different systems. They can be less than 5 ms forthe neurotransmitter release [108] or minutes and hours for cell fusion induced bythe HIV-1 envelope proteins [109–112]. For planar-planar bilayer fusion [113] thelifetimes of the events leading to fusion (‘waiting time’ for fusion) are in the rangeof seconds to minutes. Even for the same system, but for different experimentalconditions, the delays can vary by orders of magnitude. For instance, delays in viralfusion are in the range of milliseconds to minutes [114–116].

880 D.S. Dimitrov
5.8. Delays in electrofusion decrease with an increase in the field strength and areproportional to the solution viscosity
A systematic study of delays in electrofusion of erythrocyte ghosts [85] showedthat they decreased from 4 to 0.3 s with an increase in (i) the pulse strength from0.25 to 1 kV/mm (fig. 18a), (ii) the pulse duration in the range 0.073–1.8 ms,and (iii) the dielectrophoretic force which brings the membranes at close appositionbefore triggering fusion. They increased proportionally to the increase in the solutionviscosity (fig. 18b). The delays decreased 2–3 times with an increase in temperaturefrom 21 to 37◦C. The Arrhenius plot yielded straight lines. The calculated activationenergy, 17 kcal/mol, does not depend on the pulse strength [85] and is similar to thatfound for the fusion yield of mouse lymphoma cells [117] and electroporation [40].
The data for delays in electrofusion of erythrocyte ghosts [85] can be describedby an empirical formula [107]
Delay = Cµ exp(Ea/RgT ), (5)
where C is a constant which does not depend on the activation energy Ea and thesolution viscosity µ,Rg is the gas constant and T the absolute temperature. Theconstant C is inversely proportional to the driving force of the fusion reaction andproportional to the system resistance to fusion. Therefore, it depends on all thefactors which determine the driving force and the fusion resistance. The activationenergy does not depend on the strength of the fusogen. Typical values of C are inthe range 10–1000 Pa−1 and of the activation energy Ea is 10–30 kcal/mol. A morerefined theoretical analysis of the delays in fusion is presented elsewhere [118].
Fig. 18(a). The delay in electrofusion of erythrocyte ghosts decreases with increasing the pulse strength.From [85].

Electrofusion and electroporation 881
Fig. 18(b). The delay in electrofusion is proportional to the solution viscosity. From [85].
5.9. Rates of fusion can provide information for the time coarse of membranemerging and fusion pore expansion
While the delays reflect the life-time of the intermediates before the actual intermix-ing of the membrane components, the rates of fusion provide information for thesubsequent stages of the fusion process. Rates of fusion are commonly measuredby taking the derivatives of the fluorescence changes with respect to time. For indi-vidual cells they reflect the rate of diffusion of the dye through the intermembranejunction after membrane merging. There are two limiting cases: 1) the dye trans-fer through the intermembrane junction is fast compared to the lateral diffusion inthe originally unlabeled membrane and 2) the transfer through the intermembranejunction is slower than the diffusion.
In the first case the rate of dye transfer is entirely determined by the diffusioncoefficient of the dye in the originally unlabeled membrane and the membrane ge-ometry. This is the case, e.g., shown in fig. 19, borrowed from the study ofelectrofusion of erythrocyte ghosts (see also fig. 13) [85]. The plot of the squareof the distance between the diffusion front and the membrane contact zone versustime is linear. The slope gives 4D, D being the diffusion coefficient, which forthis particular case is equal to 0.55× 10⁻⁸ cm2/s. This is one method of measuringthe lateral diffusion of fluorescent dyes. Therefore in this case the increase in flu-orescence in the initial stage of the membrane transfer is not a measure of rate offusion. It only shows that the rate of dye transfer through intermembrane junctionsis faster than the rate of diffusion. After the diffusion front reaches the far end ofthe cell, the fluorescence intensity continues to increase until reaching the final equi-librium state. This stage also depends on the diffusion. The case of fast dye transferthrough intermembrane junctions occurs when the total length of membrane contactby junctions is larger than the contact perimeter. For example, if the intermembrane

882 D.S. Dimitrov
Fig. 19. An example of kinetics of dye redistribution to an originally unlabeled membrane followingapplication of a high voltage pulse. The space locations of the points of measurement are shown in theinset. The distances from the contact with the labeled membrane are (in µm) A, 0 (the contact); B,1.7; C, 3.3 (the center of the erythrocyte ghost); D, 5; and E, 6.6 (the far end of the membrane). Thefluorescence intensity is normalized to that at the center of the labeled membrane (point O in the inset).The fluorescence intensity at the membrane contact (point A in the inset) is higher than zero even beforethe pulse because of the close proximity of the labeled membrane. The increase in fluorescence beginsafter a delay at a point in time that coincides with a characteristic appearance of the fluorescence as‘horns’ (see fig. 13). The dye diffuses until reaching the far ends of the membranes (after time te) and
an almost uniform redistribution (after time tu). From [85].
junctions are channels, fast dye transfer occurs when the product of the number ofchannels and their average perimeter is larger than the perimeter of the membranecontact.
When the rate of dye transfer through the fusion junction is lower than the dif-fusion rate, the increase of fluorescence is uniform. It depends only on the timeand the properties of the fusion junctions. The rate of increase reflects the numberand size of the fusion junctions and their change with time. When the number andsize of the fusion junctions are constant, the fluorescence increase should be linearwith time in the beginning of the dye transfer. Any differences from the linearrelationship could be attributed to changes of the size and number of the fusionjunctions, including creation of new or closing of ‘old’ junctions. Therefore, fluo-rescence changes after delays may contain important information about intermediatesin fusion and their evolution with time. Unfortunately, this important process hasnot been quantitated yet.
For a population of cells, the rate of fusion can be defined in at least two ways.Either it is the number of cells fused per unit time or it is the total fluorescencechange per unit time. In the first case fusion rates can be measured simply bycounting the number of cells fused as a function of time. Evidently, in this casethe rate of fusion is given by the individual differences in the lag times (delays). Itwill be equal to the number of fused cells which have delays within a time intervaldivided by that time interval.

Electrofusion and electroporation 883
The spectrofluorimetric assays measure rates of fusion by monitoring the fluo-rescence increase over time [106]. In this case, in addition to the contribution ofvariations in delays, there will be also an effect of the rate of dye transfer to theunlabeled cells. For instance, the water soluble dye can be transferred through poresby electroosmosis within ms [50]. Therefore, when using contents mixing assays themeasured rates of fluorescence increase can be higher than the actual rates of fusion.This can be the reason for the high rates and lack of delays in the kinetic curvesobtained by using water soluble dyes [99, 106].
5.10. Fusion yields and delays are related but may reflect different properties ofthe fusing membranes
Fusion yields are commonly defined as the maximal number of fused labeled cellsnormalized to the total number of labeled cells [87]. At that time the fusion rate iszero. Sometimes, for convenience fusion yield can be considered as a function oftime. Then it reflects the number of cells so far fused until a given time. The rate offusion at that time is the derivative of the fusion yield with respect to time. FurtherI discuss only the maximal fusion yield.
For a population of cells, the change of the parameters of the system, whichlead to decrease of the delay, cause commonly an increase in fusion yields. Forexample, in electrofusion of erythrocyte ghosts, the increase in pulse strength andduration, decreases the delay and increases the fusion yield [85]. This means thatunder stronger pulses more cells acquire the property to fuse. Those which wouldhave fused anyway do it faster. Several experimental results, however, indicatethat while fusion yields and delays are related they may reflect different physicalparameters [85]:
1) Under strong pulses practically all cells fuse, i.e. the fusion yield is near100% and further increase in the pulse strength does not lead to an increasein the fusion yield. The delay can be increased, however, several fold with afurther increase of the pulse strength.
2) For weak pulses, the delay does not change significantly. The fusion yield,however, increases several fold with the increase of the pulse strength.
3) The fusion yield changes significantly, while the delay does not, in buffers ofdifferent ionic strength.
With respect to the effect of ionic strength on fusion yield, there are inconsistenciesbetween several reports. Fibroblasts fused with higher yield in solutions of higherionic strength [119], erythrocyte ghosts show a maximum at 20–30 mM phosphatebuffer saline, while chinese chamster ovary cells showed lower fusion yields in highionic strength solutions [120, 121]. Similar inconsistencies exist for the effect ofcalcium ions. Mouse leukemic lymphoblasts (L5178Y) required Ca2+ for their fusion[117], while chinese hamster ovary cells electrofusion was reduced by increasingcalcium ion concentration in the range from 0 to 1 mM [120]. The important role ofcalcium ions in biological systems, for fusion and the phase state of membranes hasbeen known for years, but what is the molecular mechanism of its action on fusionis still unknown [122]. More refined studies of the effect of Ca2+ on electrofusionmay provide critical information needed for understanding its role in fusion.

884 D.S. Dimitrov
6. Kinetic pathways of membrane fusion resemble coalescence in colloidsystems
In what follows I present a current understanding of the kinetic mechanisms ofelectrofusion. I begin with a brief description of very simple systems – fusion ofmonolayers; then consider fusion of lipid bilayers, and finally I present a plausiblequalitative description how cell membranes may fuse.
6.1. ‘Fusion’ of lipid monolayers on liquid surfaces is by diffusion or intermixingdriven by surface pressure gradients
Bubbles (or drops) in foams (or emulsions) are inherently unstable and tend tocoalesce (‘fuse’). The driving force for the fusion reaction is the higher free energyof the individual bubbles than the fused bubbles. Assuming that the final volume oftwo fused bubbles of equal radii, R, and surface tensions, σ, is equal to the sum of thevolumes of the individual bubbles, the surface free energy is (2− 22/3)4πσR2 timeslarger than that after fusion. The large excess in free energy leads to rapid fusion ofthe bubbles. The fusion rate, however, decreases with increasing the initial separationbetween the bubbles, the viscosity of the liquid and the density of the monolayersfrom surface active substances, particularly lipids, which cover the bubble surfaces.At high monolayer densities fusion may never occur in spite of the gain in freeenergy. Numerous experimental and theoretical studies have shown that there aretwo major types of resistance to coagulation and coalescence (in particular, fusion)in colloid systems – hydrodynamic and energetic (for review see, e.g., the books ofScheludko [123], and Dukhin, Rulev and Dimitrov [124]) .
The hydrodynamic resistance is due predominantly to the viscosity of the liquidbetween the bubble surfaces and determines the rate of the so-called ‘fast coales-cence’. In the case of ‘pure’ (without energy barriers) fast coalescence, e.g., bubblesin the absence of surfactants, the driving force of the fusion reaction F = −dG/dh(G being the free energy and h being the reaction coordinate, e.g., separation betweenthe bubbles) is always positive. The overall rate of fusion is solely determined bythe balance of the driving force and the viscous resistance of the liquid layer betweenthe bubbles. The fusion rate decreases with an increase in viscosity and a decreasein surface tension.
The energy barriers are due to repulsive forces between the bubble surfaces and/orto structural reorganizations of the lipid molecules during the very act of fusion. Theylead to the so-called ‘slow coalescence’. The fusion rate in this case is proportionalto the probability of overcoming the energy barriers by thermal fluctuations. Anexample are bubbles with surfaces covered by lipid monolayers of high density.External factors, e.g., electric fields, can be needed to decrease the energy barriers inorder to induce fusion. After overcoming the energy barriers, the system can reachthe final equilibrium state by a kinetic pathway determined by its hydrodynamicresistance.
To understand kinetic mechanisms of fusion one needs to know how the interplaybetween the fusion driving force and the system resistance determines the kineticpathways leading to fusion. It is reasonable to assume that the system utilizes the

Electrofusion and electroporation 885
fastest pathway to reach equilibrium. Thirty years ago, Scheludko (see in [123])suggested that the most rapid kinetic pathway leading to fast coalescence is thegrowth of thermal fluctuations of the shape of the interacting surfaces, representedas a superposition of surface fluctuation waves. The fluctuation wave mechanism ofbubble and drop coalescence was further developed by Ivanov, Scheludko and theircollaborators [125, 126] to include the viscous resistance of the liquid film as a wholeand the physical properties of the surfactants. Ivanov and Dimitrov [126] found thatthe viscosity of the monolayer and the surface diffusion of its molecules [127] arecritical for the rate of growth of the fluctuation waves and succeeded to explain whythe critical separation at which the bubbles fuse is affected by the monolayer density,a phenomenon which was observed in a variety of foam and emulsion systems.
Further studies of the dynamic properties of lipid monolayers have shown thatin addition to the surface diffusion, there is another process by which the lipidmolecules can move very rapidly under the action of differences in surface pressuresarising from differences in the monolayer densities; this is the so-called Marangonieffect (see, e.g., [128]). The Marangoni effect leads to much faster lateral motionof the lipid molecules than the surface diffusion and is strongly affected by the typeof lipid molecules, their escape into the bulk of the liquid, the liquid viscosity andthe presence of protein molecules [128–130]. For example, for dipalmitoyllecithinmonolayers the Marangoni ‘diffusion’ coefficient was measured to be in the rangeof 350 to 3400 cm2/s [128], which is about 9 orders of magnitude higher than therespective surface diffusion coefficient. However, since the Marangoni effect dependson the thickness of the liquid support, for approaching bubbles at separations of about10 nm it can result in ‘only’ 103-fold faster rate of lipid molecules motion than thediffusion. Another interesting phenomenon is the monolayer collapse. It was shownthat the kinetics of monolayer collapse can be described by a Maxwell type ofviscoelastic body [131]. The escape of the lipid molecules in the third dimensionunder high pressures may lead to fusion with another monolayers if they are at closeapproach.
For very high monolayer densities, the energy barriers determine the life-time ofthe film separating the bubbles. The process of rupture of this film, consisting oftwo adhered monolayers, was elegantly described by Derjaguin and his collaborators[132–134], who calculated the energy barriers by using the concept of linear tension(edge energy). It must be emphasized that Derjaguin [134] considered bilayer mem-branes which are metastable because they are under tension, and that the tension isthe driving force for their rupture. Therefore, liposomes may not be described bythis approach, because in most cases they are not under tension. For the currentconcepts of thin film dynamics and instability see [135, 136].
The lessons to be learned from the studies of these ‘simple’ systems are: 1) thereare two major kinetic mechanisms for the fusion process to develop – (i) growth ofsurface shape instabilities and (ii) overcoming energy barriers, 2) in both cases theproperties of the thin liquid layer between the surfaces, and those of the monolayersare critical for the kinetics of fusion, and 3) the fusion per se is diffusion of the lipidmolecules and Marangoni effect, and therefore is determined by the type of the lipidmolecules and the interactions with their environment.

886 D.S. Dimitrov
6.2. Fusion of bilayers requires overcoming the intramembrane attraction
While fusion of lipid monolayers is ‘simply’ intermixing of their molecules driven byconcentration and surface pressure gradients, i.e. by lateral diffusion and Marangonieffect, fusion of lipid bilayers could be more complicated because of their three-dimensional structure (for a current view on the structure, dynamics and conforma-tions of bilayers see the reviews of Sackmann [137] and Lipowsky [138]). The strongmutual attraction of the two leaflets in the bilayer leads to restrictions in the abilityof the outer leaflets to intermix. Therefore formation of intermediate structures maybe needed to overcome the energy barrier due to the internal bilayer interactions[139]. While this fundamental difference between monolayers and bilayers couldlead to different molecular mechanisms, the major kinetic pathways of fusion ofmonolayers and bilayers may be similar. The liquid layer between the approachingsurfaces and the surface properties of monolayers and bilayers are essentially thesame. Even the Van der Waals forces and the bending rigidity, which depend onthe thickness of the bilayer, may not differ significantly, provided that the physico-chemical environment is the same. These similarities indicate that the kinetics of theintermembrane interactions leading to fusion might be qualitatively the same as formonolayers covering bubble (or drop) surfaces. The fusion per se ultimately requiresintermixing of the lipid molecules and therefore should involve ‘monolayer type’ oflateral diffusion and Marangoni effect. Based on these arguments and the similarityof the phenomenological equations which describe the mechanics of monolayers andbilayers, I proposed that fusion of bilayer membranes may follow similar kineticpathways as fusion of monolayers in colloid systems, and that the knowledge gainedin colloid and surface chemistry should be used to describe some features of fusionof bilayer and cell membranes [57, 103, 140–142].
The overall fusion process could be divided into two major processes. The firstone is the ‘adhesion’ step. It leads to establishment of close molecular contact.The second one is the ‘destabilization’ step. It results in overcoming the internalresistance of the bilayers to fuse due to their intramembrane interactions. Whilethe adhesion step is commonly followed by the destabilization step, fusion couldalso occur if the membranes are first destabilized and then adhered, albeit at lowerefficiency.
There are two major kinetic pathways which can lead to ultimate molecular contact(fig. 20) [142]. The first one is by a continuous, gradual, approach of the twomembranes (fig. 20; 1). It commonly occurs when the attractive intermembraneforces are not very strong and the system reaches equilibrium without developmentof instabilities of the liquid layer between the membranes. This pathway can lead toformation of a single bilayer by ‘semi-fusion’ of the outer leaflets of the interactingbilayers (fig. 20; 1a) [113, 143], formation of a flat liquid layer between the twobilayers (fig. 20; 1b) or initiate an expansion of the liquid layer between the bilayers(fig. 20; 1, 2). The second major kinetic pathway is by a ‘discontinuous’ decrease ofthe separation between the two bilayers due to the growth of unstable fluctuations ofthe membrane shape (fig. 20; 2). It occurs when the driving force is large, e.g., afterapplication of high voltage electric pulses. While the average thickness of the liquid
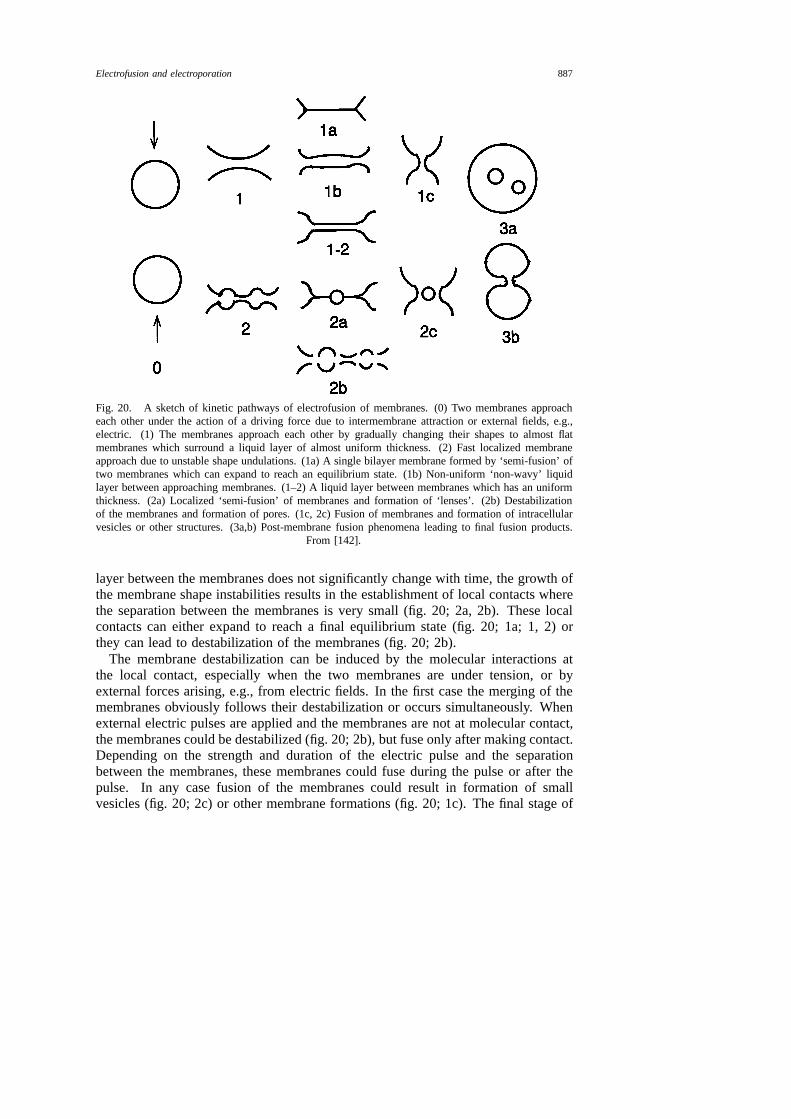
Electrofusion and electroporation 887
Fig. 20. A sketch of kinetic pathways of electrofusion of membranes. (0) Two membranes approacheach other under the action of a driving force due to intermembrane attraction or external fields, e.g.,electric. (1) The membranes approach each other by gradually changing their shapes to almost flatmembranes which surround a liquid layer of almost uniform thickness. (2) Fast localized membraneapproach due to unstable shape undulations. (1a) A single bilayer membrane formed by ‘semi-fusion’ oftwo membranes which can expand to reach an equilibrium state. (1b) Non-uniform ‘non-wavy’ liquidlayer between approaching membranes. (1–2) A liquid layer between membranes which has an uniformthickness. (2a) Localized ‘semi-fusion’ of membranes and formation of ‘lenses’. (2b) Destabilizationof the membranes and formation of pores. (1c, 2c) Fusion of membranes and formation of intracellularvesicles or other structures. (3a,b) Post-membrane fusion phenomena leading to final fusion products.
From [142].
layer between the membranes does not significantly change with time, the growth ofthe membrane shape instabilities results in the establishment of local contacts wherethe separation between the membranes is very small (fig. 20; 2a, 2b). These localcontacts can either expand to reach a final equilibrium state (fig. 20; 1a; 1, 2) orthey can lead to destabilization of the membranes (fig. 20; 2b).
The membrane destabilization can be induced by the molecular interactions atthe local contact, especially when the two membranes are under tension, or byexternal forces arising, e.g., from electric fields. In the first case the merging of themembranes obviously follows their destabilization or occurs simultaneously. Whenexternal electric pulses are applied and the membranes are not at molecular contact,the membranes could be destabilized (fig. 20; 2b), but fuse only after making contact.Depending on the strength and duration of the electric pulse and the separationbetween the membranes, these membranes could fuse during the pulse or after thepulse. In any case fusion of the membranes could result in formation of smallvesicles (fig. 20; 2c) or other membrane formations (fig. 20; 1c). The final stage of

888 D.S. Dimitrov
the fusion process is the expansion of the fusion pore (fig. 20; 1c; 2c), commonlydriven by the membrane tension, until reaching the final equilibrium shape of thefused membranes. The fused membranes can surround a rounded cell (fig. 20; 3a)or the fusion product can preserve the overall morphology of the cells before fusion(fig. 20; 3b).
Theoretical formulas were derived to describe the kinetics of each of these kineticpathways [57, 141]. Without going into mathematical details, I will discuss severalestimates which allow to predict the conditions under which each of the stages couldoccur and estimate its rate. The time to reach contact by a continuous approachof the membranes (fig. 20; 1) increases with increasing the liquid viscosity andthe total area of contact, and with decreasing the driving force and the separationbetween the membranes. The same is valid for the discontinuous membrane approach(fig. 20; 2), except that the contact area in this case should be substituted by the areaof the fastest growing undulation (wave), which is of the order of the square of itscharacteristic length (wave length). Because of the dependence of that area on theintermembrane forces and other physical parameters and the non-linear character ofthe functional relationships between those parameters, the characteristic time of thewave growth could be much shorter than the rate of approach of the membranes asa whole. An estimate of the ratio of the two characteristic times (of continuous anddiscontinuous membrane approach) leads to the formula F/hΣ, where F is the forcewhich drives the membrane approach, h the intermembrane separation and Σ themembrane tension. For F = 10−6 dyn, h = 10 nm and Σ = 1 mdyn/cm, this ratio isof the order of 1000. This means that under those conditions it is 1000-fold faster toestablish local contact by unstable fluctuational waves than to gradually approach themembranes. Therefore, in this case the kinetic pathway is by discontinuous approach(fig. 20; 2). For liquid viscosity equal to 0.01 P the time of this type of approach forthe above example is 10 s. Similar considerations apply for tension free membraneswhere the time of localized approach is determined by the bending rigidity. In thiscase (Σ = 0) another formula is valid where Σ should be replaced by a dimensionalfactor proportional to the bending rigidity K.
The local membrane contact could expand by a rate which is determined by theliquid viscosity, membrane tension, contact angle and the thickness of the liquidlayer between the membranes [140, 141, 144]. This rate can be very low whichcould lead to very long times of establishment of uniform liquid layer betweenthe adhering membranes. Similar theoretical considerations and formulas apply forexpansion of membranes consisting of one bilayer surrounded by two monolayersof bilayers (fig. 20; 1a, 2a) [140]. The rate of expansion in all these cases, U ,can be estimated by the formula: U = hΣ/4µl, where h is the thickness of themobile layer between the two monolayers (or bilayers), e.g., the solvent in the caseof supported bilayer lipid membranes, µ is its viscosity, Σ is the tension of the twointeracting monolayers (or bilayers), which drives the expansion, and l is the lengthof the perimeter of contacting monolayers (or bilayers) along which the tensionis applied. This formula predicts times of expansion of the order of seconds forsupported bilayer lipid membranes. More sophisticated formulas are presented in

Electrofusion and electroporation 889
[140, 144]. For solvent free membranes, where h is zero or very small, expansionmay not occur or may be very slow.
The destabilization of the membranes may occur either by the fluctuation wavemechanism or by overcoming energy barriers or by both mechanisms as discussed be-fore (sections 3.8 and 3.9). It leads to formation of pores, defects or other structures.The shape of the lipid molecules can affect the stability of those structures [113].
The interaction of two pores or a pore and a membrane may lead to intermixing ofthe lipid molecules and to their fusion. The interaction between the two membranescan contribute to their destabilization due to an increase in the intramembrane electricfield strength. External electric fields can destabilize the membrane-membrane con-tact much faster than the liquid layer between the membranes because of the greatertransmembrane voltage across the membranes [58]. Therefore one might expect that,depending on the electric field strength, the adhered membranes can be either firstdestabilized and then they interact to fuse, or they may form a close (molecularcontact) and then fuse. Probably in most cases the membranes are first destabilizedand then they fuse. This is supported by theoretical considerations indicating thatafter formation of pores the rate of local membrane approach may increase signif-icantly due to their permeabilization [145] and the increase in the force of localattraction due to electric currents [146]. Direct experimental evidence supportingthis conclusion is, however, lacking.
The intermixing of the membranes, i.e. the very act of fusion, is very fast. Anestimate, based on the lateral diffusion of lipids leads to times τf = l2D/4D of theorder of microseconds if the characteristic distance lD is about 5 nm and the diffusioncoefficient D is of the order of 10−8 cm2/s. Surface pressure differences betweenthe two bilayers (Marangoni effect) can lead to even shorter times of intermixing.
The intermixing of lipids from the two interacting membranes leads to forma-tion of fusion junctions, which can transform into fusion pores. The fusion porescan either expand (fig. 20; 2c), stabilize (fig. 20; 3b) or in rare cases close. Forliquid crystalline membranes under tension the expansion of the fusion pores canbe relatively fast process with a rate proportional to the membrane tension Σ andinversely proportional to the liquid viscosity µ and the radius of curvature of themembranes Rc [142]. The rate of expansion could be also affected by the membraneviscosity. Numerical estimates of the characteristic time of expansion τe, based onthe formula τe = µRc/Σ 142], give a reasonable value of 10 ms when µ = 0.01 P,Σ = 0.01 dyn/cm and Rc = 0.1 mm. When the membranes are not under tension,the driving force for the fusion pore expansion is zero or very small. The time of ex-pansion therefore could be very long. High membrane viscosities may also increasethe expansion times. Under conditions favoring very long times of expansion, thefusion pores may stabilize or even close thus returning the system back to the initialstage of two separate membranes.
The duration of the fusion process as a whole is a sum of the durations of eachstage. While the times for membrane destabilization and intermixing are very short,the initial (adhesion) and latest (expansion) stages can be very long and thereforerate determining. This indicates one of the fundamental problems for studying mech-anisms of fusion. Fusion itself is very rapid and localized while the ‘background’processes (adhesion and expansion) are slow and involve large parts of the mem-branes.

890 D.S. Dimitrov
6.3. The molecular mechanism of bilayer fusion is unknown
Because of the very small amount of membrane lipid involved in fusion pores andtheir very short life-times direct measurement of the intermediate structures in fu-sion of lipid bilayers is very difficult if not impossible. Some progress was madeby using NMR for fusion of membranes in lipid suspensions [147–149]. Whetherthis is relevant to fusion of lipid bilayers remains to be seen. The lack of directexperimental measurements of lipid bilayer fusion hinders the understanding of themolecular mechanisms of fusion. In contrast, there are several theoretical modelswhich try to calculate intermediate structures requiring minimal activation energyfor their formation [139, 150, 151]. These models are helpful in the design of newexperiments for better understanding of the molecular rearrangements during fusion.
6.4. Fusion of cell membranes can be qualitatively described but the molecularrearrangements remain unclear
Unlike lipid bilayers, cell membranes are highly heterogeneous, contain significantamounts of proteins, glycoproteins and glycolipids, are surrounded by surface layersof adsorbed molecules, and are attached to the cytoskeleton (for a current view onthe structure and dynamics of cell membranes and nice cartoons, see the reviewof Sackmann [137]). The high level of complexity of cell membranes leads todifficulties in modeling fusion. Nevertheless, phenomenological models could bestill helpful for understanding certain aspects of electrofusion.
The following picture for the kinetic pathways of cell electrofusion emerges fromthe comparison of the experimental data with the theoretical models. The cells,held at close apposition by dielectrophoresis or other interactions, are unable to fusebecause of the inherent stability of the membranes and the repulsive forces betweenthem. The application of high voltage pulses leads to at least two effects: 1) furtherapproach of the membranes [152, 153] and 2) their destabilization. The membranedestabilization and formation of pores or other structures enhances the local approachof the membranes by (i) providing the driving force due to the high free energy state,which can reduce or eliminate the repulsive intermembrane forces and (ii) decreasingthe local hydrodynamic resistance which increases the rate of local approach. Theexcess free energy of the pores (or defects, or unknown structures) can be eitherdissipated as thermal motion without formation of fusion junction or can be utilizedin the rearrangements of the lipid molecules leading to fusion. Efficient fusion occurswhen the membranes are at close approach or brought rapidly at close approachafter the pulse before the free energy of the (activated) ‘fusogenic state’ has beendissipated. On the one hand, membrane proteins can enhance the fusion reactionif they stabilize the state of high free energy by not allowing rapid dissipation ofenergy, increase membrane binding and/or provide an appropriate environment forthe structural rearrangements of the lipid molecules. On the other hand, they candecrease the efficiency of the fusion reaction by creating additional (mainly steric)resistance to local membrane approach. Which effect will dominate depends on thespecific lipid and protein composition and on the phase state of the membranes.
The high free energy of the activated membranes is probably localized in elec-tropores. Two pores apposing each other are the most efficient kinetic pathway of

Electrofusion and electroporation 891
fusion because the driving force is high and the hydrodynamic resistance is small.Such pores are also predominantly formed when the membranes are at close ap-position. This does not exclude the possibility, however, that pores in one of themembranes can destabilize locally the opposing membrane albeit at low efficiency.This is probably the case when the two membranes are brought in contact after thepulse, because the geometric probability for two pores being apposing each other isvery low due to the low pore concentration in the membranes. This may be one ofthe causes for the low efficiency of fusion in this case.
Because of the high free energy of the membranes after the pulse the liquid filmbetween them can be destabilized, which can lead to a rapid localized approach untilreaching molecular contact. Thus the molecular contact may occur during the pulseif the duration of the pulse is longer than the time needed to make contact. If theapproach is slow, the membrane contact may occur after the pulse. The occurrenceof molecular contacts does not necessarily lead to merging of the two membranes.Energy barriers for the molecular rearrangements of the lipid molecules from a pore(or another) configuration to a fusion junction should be overcome to initiate fusion.The height of these barriers is of the same magnitude as that for lateral mobilityof lipid molecules and therefore one might speculate that the lipid rearrangementskinetically resemble the lateral lipid diffusion in membranes. Energy barriers mayalso exist before the occurrence of molecular contact if the free energy of the poresis not sufficient to overcome the repulsive intermembrane forces.
Fusion of membranes occurs after overcoming those energy barriers and leads tolocal continuity of the membranes, i.e. to fusion junctions. The formation of fusionjunctions may lead or may not lead to continuity of the cell cytoplasm, i.e. to theformation of a fusion pore. Depending on the structure of the fusion intermediates,fusion pores may form simultaneously with formation of fusion junctions, may formlater or may never form. Since for cell membranes the molecular structure of theintermediates is not known and it is difficult, if not impossible, to describe thisstructure theoretically, one might only speculate how and when formation of fusionpores occurs.
The fusion pores can stabilize, reverse to the initial prefusion state (‘flickering’)or expand. The expansion of fusion pores may lead to ‘fusion’ with other pores,rounding of the fused cells and eventually formation of giant cells (syncytia), whenmany cells fuse. Alternatively, the cells may retain their shape if the fusion poresdo not expand, because of constraints arising, e.g., from the cytoskeleton or otherfactors which remain to be elucidated.
7. Fusion in life processes involves specialized proteins but kinetically can besimilar to electrofusion
Electrofusion provides a convenient way to study fundamental mechanisms of mem-brane fusion, which may help to understand the fusion mechanisms in biologicalsystems. While the major requirements for electrofusion and biological fusion (closecontact, destabilization, overcoming energy barriers and appropriate structural rear-rangements) are the same, fusion in biological systems is tightly controlled by specific

892 D.S. Dimitrov
protein interactions and full understanding of its mechanisms requires understandingthe structure and conformational changes of the fusion proteins.
The biological fusion process which is best understood in terms of molecular struc-ture and conformational changes of fusion proteins is viral fusion [154, 155]. Viralfusion is caused by proteins which undergo conformational changes to expose hy-drophobic peptides after activation by low pH or interaction with receptor molecules.The exposure of the hydrophobic fusion peptide to the water environment results inan increase in the free energy of the peptide and its immediate environment possiblyincluding the surfaces of the interacting membranes. This leads to a high free en-ergy state which could be similar to that of a fusogenic electropore in electrofusion.Therefore, the kinetic pathways of viral fusion after activation of the viral proteinscould be similar to those of electrofusion. The existence of a high energy stateof the viral fusion protein leads to local mutual approach of the lipid bilayers anddestabilization of the membranes and of the liquid layer between them. The lipidmatrix of the membrane then undergoes localized structural rearrangements resultingin lipid intermixing. An indication that this stage of viral fusion is also similar tothat in electrofusion is the magnitude of the activation energy which in both casesis of the order of the activation energy of the lateral mobility of the lipid molecules(15–25 kcal/mol) [85, 156]. After the formation of fusion junctions and pores, theycan either expand and lead to formation of giant cells or stabilize and preserve themorphology of aggregated cells [85, 100].
The comparison between electrofusion and virus fusion may lead to the discoveryof new important parameters affecting the kinetics of viral fusion. For example,by analogy with electrofusion one might predict that delays in viral fusion shouldincrease with increasing the viscosity of the liquid between the membranes. This wasconfirmed experimentally for fusion of Sendai virus [118]. A detailed comparisonbetween electrofusion and viral fusion is made elsewhere [107].
The above considerations could be applied to a wide variety of biological pro-cesses involving fusion, including exo- and endocytosis, fertilization, cell division,intracellular transport and myoblast formation.
8. New approaches are needed to understand molecular mechanisms of fusion
Electrofusion is a multistep process, which requires close apposition of the mem-branes, their destabilization and appropriate structural rearrangements of the lipidmatrix. While the kinetic mechanisms of fusion could be understood in terms of phe-nomenological models, the molecular mechanisms are unknown and new approachesare needed for their elucidation. Understanding mechanisms of electrofusion is notonly of practical importance for its optimization but also may help in understandingfundamental mechanisms of fusion in biological systems.
Acknowledgement
I would like to thank I. Ivanov, who taught me in science and how to think abouttheory, instability of liquid films and dynamics of interfacial systems; A. Scheludko

Electrofusion and electroporation 893
and R. Jain for the many exciting discussions of fluctuation waves and membraneinstability; D. Zhelev, who shaped my way of thinking about electrofusion by a crit-ical evaluation of the experimental data and theories; N. Stoicheva, R. Mutafchieva,M. Angelova, P. Doinov and G. Sharkov for interesting discussions; A. Sowers forhis original suggestions and R. Blumenthal for the intellectual environment and in-spiration to measure and analyze delays in fusion. I am grateful to M. Apostolovafor critique and logic. I appreciate the helpful comments of R. Lipowsky.
List of symbolsAC alternating currentC proportionality constant in eq. (5)Cm membrane capacitanced membrane thicknessD diffusion coefficient
DC direct currentDiI 1,1′-dihexadecyl-3,3,3′,3′-tetramethylindocarbocyanine perchlorateE electric field strengthEa activation energyF driving forceF0 = ε0ErE
2R2
FITC fluorescein isothiocyanateG free energy of intermembrane interactionh separation between surfaces including membrane surfacesk Boltzmann’s constantkR rate constant of pore resealingK membrane rigidityKe effective net cell polarizabilityl length of perimeter of contacting monolayers or bilayerslD characteristic diffusion length in fusion
L = h/2 +Rri intracellular electric resistivityr0 extracellular electric resistivityR radius of cells or other spherical particlesRc curvature radius of membranesRg gas constantt timetc time required to make membrane contactte time needed for a fluorescence dye to diffuse to the far ends of originally
unlabeled membranes after fusiontp charging timetu time needed to reach an uniform redistribution of fluorescence dyes after
membrane fusionT absolute temperatureU rate of expansion of membrane contactV transmembrane voltage

894 D.S. Dimitrov
Vc critical transmembrane voltage needed for electroporationVi inherent transmembrane voltage (at E = 0)Vm maximal transmembrane voltageδ angle between radius vector and electric field vectorε0 permettivity of free spaceEr relative permettivityµ liquid viscosityΣ membrane tensionσ surface tensionτ pulse durationτe characteristic time of fusion pore expansionτf characteristic fusion time
References1. Ringertz, N.R. and R.E. Savage, 1976, Cell Hybrids (Academic Press, New York).2. Langhans, T., 1868, Uber Resenzellen mit wandstandigen Kernen in Tuberkelen und die fibrose
Form des Tuberkels, Arch. Pathol. Anat. Physiol. Klin. Med. 42, 382–404.3. Lewis, W.H., 1927, The formation of giant cells in tissue culture and their similarity to those in
tuberculous lesions, Am. Rev. Tuberc. 15, 616–628.4. Okada, Y., 1958, The fusion of Ehrlich’s tumor cells caused by HVJ virus in vitro, Biken’s J. 1,
103–110.5. Hoggan, M.D. and B. Roizman, 1959, The isolation and properties of a variant of herpes simplex
virus producing multinucleate giant cells in monolayer cultures in the presence of antibody, Am.J. Hyg. 70, 208–219.
6. Okada, Y., 1962, Analysis of giant polynuclear cell formation caused by HVJ virus from Ehrlich’sascites tumor cells, I. Microscopic observation of giant polynuclear cell formation, Exp. Cell Res.26, 98–107.
7. Colwin, L.H. and A.L. Colwin, 1960, Formation of sperm entry holes in the vitelline membrane ofHydroides hexagonus (Annelida) and evidence of their lytic origin, J. Biophys. Biochem. Cytol.7, 315–320.
8. Holtzer, H., J. Abbott and J. Lash, 1958, The formation of multi-nucleate myotubes, Anat. Rec.131, 567.
9. Capers, C.R., 1960, Multinucleation of skeletal muscle in vitro, J. Biophys. Biochem. Cytol. 7,559–566.
10. Barski, G., S. Sorieul and F. Cornefert, 1961, “Hybrid” type cells in combined cultures of twodifferent mammalian cell strains, J. Nat. Cancer Inst. 26, 1269–1291.
11. Sorieul, S. and R. Ephrussi, 1961, Karyological demonstration of hybridization of mammalian cellsin vitro, Nature 190, 653–654.
12. Bonnett, H.T. and T. Eriksson, 1974, Transfer of algal chloroplasts into protoplasts of higher plants,Planta 120, 71–79.
13. Kao, K.N. and M.R. Michayluk, 1974, A method for high-frequency intergeneric fusion of plantprotoplasts, Planta 115, 355–367.
14. Pontecorvo, G., 1975, Production of indefinitely pultiplying mammalian somatic cell hybrids bypolyethylene glycol (PEG) treatment, Somatic Cell Genet. 1, 397–400.
15. Senda, M., J. Takeda, S. Abe and T. Nakamura, 1979, Induction of cell fusion of plant protoplastsby electrical stimulation, Plant Cell Physiol. 20, 1441–1443.
16. Neumann, E., G. Gerisch and K. Opatz, 1980, Cell fusion induced by high electric impulses appliedto Dictyostelium, Naturwissenschaften 67, 414–415.
17. Weber, H., W. Forster, H.-E. Jacob and H. Berg, 1981, Microbiological implications of electricfield effects, Z. Allg. Microbiol. 21, 555–562.

Electrofusion and electroporation 895
18. Zimmermann, U. and P. Scheurich, 1981, High frequency fusion of plant protoplasts by electricfields, Planta 151, 26–32.
19. Berg, H., W. Forster and J. Hans-Egon, 1987, Electric field effects on biological membranes:Electroincorporation and electrofusion, in: Bioelectrochemistry II. Membrane Phenomena, edsG. Milazzo and M. Blank (Plenum Press, New York) pp. 135–166.
20. Sowers, A.E., 1987, Cell Fusion (Plenum Press, New York).21. Zimmermann, U., W.M. Arnold and W. Mehrle, 1988, Biophysics of electroinjection and electro-
fusion, J. Electrostatics 21, 309–345.22. Neumann, E., A.E. Sowers and C.A. Jordan, 1989, Electroporation and Electrofusion in Cell
Biology (Plenum Press, New York).23. Chang, D.C., B.M. Chassy, J.A. Saunders and A.E. Sowers, 1992, Guide to Electroporation and
Electrofusion (Academic Press, San Diego).24. Pohl, H.A., 1978, Dielectrophoresis (Cambridge Univ. Press, London).25. Sale, A.J.H. and W.A. Hamilton, 1967, Effects of high electric fields on microorganisms, I. Killing
of bacteria and yeasts, Biochim. Biophys. Acta 148, 781–788.26. Sale, A.J.H. and W.A. Hamilton, 1968, Effects of high electric fields on microorganisms, III. Lysis
of erythrocytes and protoplasts, Biochim. Biophys. Acta 163, 37–43.27. Neumann, E. and K. Rosenheck, 1972, Permeability changes induced by electric pulses in vesicular
membranes, J. Membr. Biol. 10, 279–290.28. Zimmermann, U., J. Schulz and G. Pilwat, 1973, Transcellularion flow in Escherichia coli B and
electrical sizing of bacterias, Biophys. J. 13, 1005–1013.29. Zimmermann, U., G. Pilwat and F. Rienmann, 1974, Reversibler dielektrischer Durchbruch von
Zellmembranen in electrostatischen Feldern, Z. Naturforsch. 29c, 304–305.30. Neumann, E., M. Schaefer-Ridder, Y. Wang and P.H. Hofschneider, 1982, Gene transfer into mouse
lyoma cells by electroporation in high electric fields, EMBO J. 1, 841–845.31. Weaver, J.C. and K.T. Powell, 1989, Theory of electroporation, in: Electroporation and Electrofu-
sion in Cell Biology, eds E. Neumann, A.E. Sowers and C.A. Jordan (Plenum Press, New York)pp. 111–126.
32. Schwan, H.P., 1957, Electrical properties of tissue and cell suspensions, Adv. Biol. Med. Phys.5, 147–209.
33. Schwan, H.P., 1989, Dielectrophoresis and rotation of cells, in: Electroporation and Electrofusion inCell Biology, eds E. Neumann, A.E. Sowers and C.A. Jordan (Plenum Press, New York) pp. 3–21.
34. Neumann, E., 1989, The relaxation hysteresis of membrane electroporation, in: Electroporationand Electrofusion in Cell Biology, eds E. Neumann, A.E. Sowers and C.A. Jordan (Plenum Press,New York) pp. 61–82.
35. Kinosita, K.Jr., I. Ashikawa, N. Saita, H. Yoshimura, H. Itoh, K. Nagayama and A. Ikegami,1988, Electroporation of cell membrane visualized under a pulsed-laser fluorescence microscope,Biophys. J. 53, 1015–1019.
36. Hibino, M., M. Shigemori, H. Itoh, K. Nagayama and K. Kinosita, 1991, Membrane conductanceof an electroporated cell analyzed by submicrosecond imaging of transmembrane conductance,Biophys. J. 59, 209–220.
37. Kinosita, K., M. Hibino, H. Itoh, M. Shigemori, K. Hirano, Y. Kirino and T. Hayakawa, 1992,Events of membrane electroporation visualized on a time scale from microsecond to seconds, in:Guide to Electroporation and Electrofusion, eds D.C. Chang, B.M. Chassy, J.A. Saunders andA.E. Sowers (Academic Press, Orlando) pp. 29–46.
38. Kinosita, K.Jr. and T.Y. Tsong, 1977, Voltage-induced pore formation and hemolysis of humanerythrocytes, Biochim. Biophys. Acta 471, 479–497.
39. Benz, R. and U. Zimmermann, 1980, Relaxation studies on cell membranes and lipid bilayers inthe high electric field range, Bioelectrochem. Bioenerg. 7, 723–739.
40. Zhelev, D.V., D.S. Dimitrov and P. Doinov, 1988, Correlation between physical parameters inelectrofusion and electroporation of protoplasts, Bioelectrochem. Bioenerg. 20, 155–167.
41. Abidor, I.G., V.B. Arakelyan, L.V. Chernomordik, Yu.A. Chizmadzhev, V.F. Pastushenko andM.R. Tarnsevich, 1979, Electrical breakdown of bilayer lipid membranes, I. The main experimentalfacts and their qualitative discussion, Bioelectrochem. Bioenerg. 6, 37–52.

896 D.S. Dimitrov
42. Tsong, T.Y., 1989, Electroporation of cell membranes: Mechanisms and applications, in: Electro-poration and Electrofusion in Cell Biology, eds E. Neumann, A.E. Sowers and C.A. Jordan (PlenumPress, New York) pp. 149–163.
43. Kinosita, K.Jr. and T.Y. Tsong, 1977, Formation and resealing of pores of controlled sizes inhuman erythrocyte membrane, Nature 268, 438–441.
44. Deuticke, B. and K. Schwister, 1989, Leaks induced by electrical breakdown in the erythrocytemembrane, in: Electroporation and Electrofusion in Cell Biology, eds E. Neumann, A.E. Sowersand C.A. Jordan (Plenum Press, New York) pp. 127–148.
45. Serpersu, E.H., Jr.K. Kinosita and T.Y. Tsong, 1985, Reversible and irreversible modification oferythrocyte membrane permeability by electric field, Biochim. Biophys. Acta 812, 779–785.
46. Teissie, J. and T.Y. Tsong, 1981, Electric field induced transient pores in phospholipid bilayervesicles, Biochemistry 20, 1548–1554.
47. Rossignol, D.P., G.L. Decker, W.J. Lennarz, T.Y. Tsong and J. Teissie, 1983, Induction of calcium-dependent, localized cortical granule breakdown in sea-urchin eggs by voltage pulsation, Biochim.Biophys. Acta 763, 346–355.
48. Mehrle, W., U. Zimmermann and R. Hampp, 1985, Evidence for asymmetrical uptake of fluorescentdyes through electropermeabilized membranes of Avena mesophyll protoplasts, FEBS Lett. 185,89–94.
49. Sowers, A.E., 1988, Fusion events and nonfusion contents mixing events induced in erythrocyteghosts by an electric pulse, Biophys. J. 54, 619–626.
50. Dimitrov, D.S. and A.E. Sowers, 1990, Membrane electroporation – fast molecular exchange byelectroosmosis, Biochim. Biophys. Acta 1022, 381–392.
51. Zimmermann, U., G. Pilwat, A. Pequeux and R. Gilles, 1980, Electromechanical properties ofhuman erythrocyte membranes: the pressure dependence of potassium permeability, J. Membr.Biol. 54, 103–113.
52. Zhelev, D.V., D.S. Dimitrov and I. Tsoneva, 1988, Electrical breakdown of protoplasts membranesunder different osmotic pressures, Bioelectrochem. Bioenerg. 19, 217–225.
53. Needham, D. and R.M. Hochmuth, 1989, Electro-mechanical permeabilization of lipid vesicles:Role of membrane tension and compressibility, Biophys. J. 55, 1001–1009.
54. Crowley, J.M., 1973, Electrical breakdown of bimolecular lipid membranes as an electromechanicalinstability, Biophys. J. 13, 711–724.
55. Bryant, G. and J. Wolfe, 1987, Electromechanical stresses produced in the plasma membranes ofsuspended cells by applied electric fields, J. Membr. Biol. 96, 129–139.
56. Dimitrov, D.S., 1984, Electrical breakdown of lipid bilayers and cell membranes – a thin viscoelas-tic film model, J. Membr. Biol. 78, 53–60.
57. Dimitrov, D.S. and R.K. Jain, 1984, Membrane stability, Biochim. Biophys. Acta 779, 437–468.58. Dimitrov, D.S., D.V. Zhelev and R.K. Jain, 1985, Stability of viscoelastic membrane systems
modeled as multilayered thin films, J. Theoret. Biol. 113, 353–377.59. Chang, D.C., 1992, Structure and dynamics of electric-field-induced membrane pores as revealed by
rapid-freezing electron microscopy, in: Guide to Electroporation and Electrofusion, eds D.C. Chang,J.A. Saunders, B.M. Chassy and A. E. Sowers (Academic Press, Orlando) pp. 9–27.
60. Derzhanski, A., A.G. Petrov and M.D. Mitov, 1979, Electric field induced pores in erythrocytemembrane – a discussion, in: Proceedings of the Fifth School on Biophysics of Membrane Transport(Wroclaw, Poland) pp. 285–286.
61. Weaver, J.C. and R.A. Mintzer, 1981, Decreased membrane stability due to transmembrane poten-tials, Phys. Lett. 86A, 57–59.
62. Sugar, I.P., 1981, The effects of external fields on the structure of lipid bilayers, J. Physiol. (Paris)77, 1035–1042.
63. Sugar, I.P. and E. Neumann, 1984, Stochastic model for electric field-induced membrane pores:Electroporation, Electroporation Biophys. Chem. 19, 211–225.
64. Sugar, I.P., 1989, Stochastic model of electric field-induced membrane pores, in: Electroporationand Electrofusion in Cell Biology, eds E. Neumann, A.E. Sowers and C.A. Jordan (Plenum Press,New York) pp. 97–110.

Electrofusion and electroporation 897
65. Chernomordik, L.V. and Y.A. Chizmadzhev, 1989, Electrical breakdown of lipid bilayer mem-branes: phenomenology and mechanism, in: Electroporation and Electrofusion in Cell Biology,eds E. Neumann, A.E. Sowers and C.A. Jordan (Plenum Press, New York) pp. 83–95.
66. Weaver, J.C. and A. Barnett, 1992, Progress toward a theoretical model for electroporation mech-anism: membrane electrical behavior and molecular transport, in: Guide to Electroporation andElectrofusion, eds D.C. Chang, B.M. Chassy, J.A. Saunders and A.E. Sowers (Academic Press,Orlando) pp. 91–117.
67. Kashchiev, D. and D. Exerova, 1983, Bilayer lipid membrane permeation and rupture due to holeformation, Biochim. Biophys. Acta 732, 133–145.
68. Tsong, T.Y., 1992, Time sequence of molecular events in electroporation, in: Guide to Electropora-tion and Electrofusion, eds D.C. Chang, B.M. Chassy, J.A. Saunders and A.E. Sowers (AcademicPress, Orlando) pp. 47–61.
69. O’Konski, C.T., 1981, A history of electro-optics, in: Molecular Electro-Optics, ed. S. Krause(Plenum Press, New York) pp. 1–25.
70. Liebesny, P., 1938, Athermic short-wave therapy, Arch. Phys. Ther. (Leipzig) 19, 736.71. Krasny-Ergen, W., 1936, Nicht-thermische Wirkungen elektrischer Schwingungen auf Koloide,
Hochfreguenztech. Elektroakust. 48, 126–133.72. Schwan, H.P. and L.D. Sher, 1969, Alternating-current field-induced forces and their biological
implications, J. Electrochem. Soc. 116, 170–174.73. Takashima, S. and H.P. Schwan, 1985, Alignment of microscopic particles in electric fields and its
biological implications, Biophys. J. 467, 513–518.74. Dimitrov, D.S., I. Tsoneva, N. Stoicheva and D. Zhelev, 1984, An assay for dielectrophoresis:
Applications to electromagnetically induced membrane adhesion and fusion, J. Biol. Phys. 12,26–30.
75. Stoicheva, N., I. Tsoneva and D.S. Dimitrov, 1985, Protoplast dielectrophoresis in axisymmetricfields, Z. Naturforsch. 40c, 735–739.
76. Dimitrov, D.S. and D.V. Zhelev, 1987, Dielectrophoresis of individual cells. Experimental methodsand results, Bioelectrochem. Bioenerg. 17, 549–557.
77. Iglesias, F.J., C. Santamaria, M.C. Lopez and A. Dominguez, 1989, Dielectrophoresis: Behaviorof microorganisms and effect of electric fields on orientation phenomena, in: Electroporation andElectrofusion in Cell Biology, eds E. Neumann, A.E. Sowers and C.A. Jordan (Plenum Press, NewYork) pp. 37–57.
78. Tsoneva, I., D.V. Zhelev and D.S. Dimitrov, 1986, Red blood cell dielectrophoresis is axisymmetricfields, Cell Biophys. 8, 89–101.
79. Stoicheva, N. and D.S. Dimitrov, 1986, Dielectrophoresis of single protoplasts: Effects of increasedconductivity caused by calciumions, Stud. Biophys. 111, 17–21.
80. Stoicheva, N. and D.S. Dimitrov, 1986, Frequency effects in protoplasts dielectrophoresis, Elec-trophoresis 7, 339–341.
81. Stoicheva, N., D.S. Dimitrov and A. Ivanov, 1987, Chloroplast dielectrophoresis: Effects of fre-quency and surface charge, Eur. Biophys. J. 14, 253–256.
82. Zhelev, D.V., P. Kuzmin and D.S. Dimitrov, 1991, Mutual dielectrophoresis of cells, Bioelec-trochem. Bioenerg. 26, 193–203.
83. Dimitrov, D.S., M.A. Apostolova and A.E. Sowers, 1990, Attraction, deformation and contact oferythrocyte membranes induced by low frequency electric fields, Biochim. Biophys. Acta 1023,389–397.
84. Scheurich, P., U. Zimmermann, M. Mischel and I. Lamprecht, 1980, Membrane fusion and defor-mation of red blood cells by electric fields, Z. Naturforsch. 35c, 1081–1085.
85. Dimitrov, D.S. and A.E. Sowers, 1990, A delay in membrane fusion: Lag times observed byfluorescence microscopy of individual fusion events induced by an electric field pulse, Biochemistry29, 8337–8344.
86. Zimmermann, U., 1982, Electric field-mediated fusion and related electrical phenomena, Biochim.Biophys. Acta 694, 227–277.
87. Sowers, A.E., 1984, Characterization of electric field-induced fusion in erythrocyte ghost mem-branes, J. Cell Biol. 99, 1989–1996.

898 D.S. Dimitrov
88. Zimmermann, U., K.-H. Buchner and W.M. Arnold, 1984, Electrofusion of cells: Recent devel-opments and relevance for evolution, in: Charge and Field Effects in Biosystems, eds M.J. Allenand P.N.R. Usherwood (Abacus Press, Normal, Ill) pp. 293–318.
89. Sowers, A.E., 1986, A long-lived fusogenic state is induced in erythrocyte ghosts by electric pulses,J. Cell Biol. 102, 1358–1362.
90. Teissie, I. and M.P. Rols, 1986, Fusion of mammalian cells in culture is obtained by creating thecontact between cells after their electropermeabilization, Biochem. Biophys. Res. Commun. 140,258–266.
91. Wu, Y., J.G. Montes and R.A. Sjodin, 1992, Determination of electric field threshold for electro-fusion of erythrocyte ghosts. Comparison of pulse-first and contact-first protocols, Biophys. J. 61,810–815.
92. Sowers, A.E., 1989, The mechanism of electroporation and electrofusion in erythrocyte mem-branes, in: Electroporation and Electrofusion in Cell Biology, eds E. Neumann A.E. Sowers andC.A. Jordan (Plenum Press, New York) pp. 229–256.
93. Lopez, A., M.P. Rols and J. Teissie, 1988, 31-P NMR analysis of membrane phospholipid orga-nization in viable reversibly electropermeabilized Chinese Hamster Ovary cells, Biochemistry 27,1222–1228.
94. Hahn-Hagerdal, B., K. Hosono, A. Zachrisson and C.H. Bornman, 1986, Polyethylene glycol andelectric field treatment of plant protoplasts: characterization of some membrane properties, Physiol.Plants 67, 359–364.
95. Ohki, S., 1987, Physicochemical factors underlying lipid membrane fusion, in: Cell Fusion, ed.A.E. Sowers (Plenum Press, New York) pp. 331–352.
96. Ohki, S. and K. Arnold, 1990, Surface dielectric contstants, surface hydrophobicity and membranefusion, J. Membr. Biol. 114, 195–203.
97. Vienken, J., U. Zimmermann, R. Ganser and H. Hampp, 1983, Vesicle formation during electrofu-sion of mesophyll protoplasts of Kalanchoe daigremontiana, Planta 157, 331–335.
98. Stenger, D.A. and S.W. Hui, 1986, Kinetics of ultrastructural changes during electrically-inducedfusion of human erythrocytes, J. Membr. Biol. 93, 43–53
99. Stenger, D.A. and S.A. Hui, 1989, Electrofusion Kinetics: Studies using electron microscopy andfluorescence contents mixing, in: Electroporation and Electrofusion in Cell Biology, eds E. Neu-mann, A.E. Sowers and C.A. Jordan (Plenum Press, New York) pp. 167–180.
100. Chernomordik, L.V. and A.E. Sowers, 1991, Evidence that the spectrin network and a nonosmoticforce control the fusion product morphology in electrofused erythrocyte ghosts, Biophys. J. 60,1026–1037.
101. Coakley, W.T. and D. Gallez, 1989, Membrane-membrane contact: Involvement of interfacialinstability in the generation of discrete contacts, Biosci. Rep. 9, 675–691.
102. Coakley, T.W., H. Darmani and A.J. Baker, 1991, Membrane contact induced between erythrocytesby polycations, lectins and dextran, in: Cell and Model Membrane Interactions, ed. S. Ohki (PlenumPress, New York) pp. 25–45.
103. Dimitrov, D.S., 1982, Instability of thin liquid films between membranes, Colloid Polym. Sci. 260,1137–1144.
104. Blangero, C., M.P. Rols and J. Teissie, 1989, Cytoskeletal reorganizations during electric field-induced fusion of Chinese hamster ovary cells grown in monolayers, Biochim. Biophys. Acta 981,295–302.
105. Zheng, Q. and D.C. Chang, 1992, Dynamics of cytoskeletal reorganization in CV-1 cells duringelectrofusion, in: Guide to Electroporation and Electrofusion, eds D.C. Chang, B.M. Chassy,J.A. Saunders and A.E. Sowers (Academic Press, Orlando) pp. 179–198.
106. Stenger, D.A. and S.W. Hui, 1988, Human erythrocyte electrofusion kinetics monitored by aqueouscontents mixing, Biophys. J. 53, 833–838.
107. Dimitrov, D.S., 1992, Membrane fusion kinetics, in: Guide to Electroporation and Electrofusion,eds D.C. Chang, B.M. Chassy, J.A. Saunders and A.E. Sowers (Academic Press, Orlando) pp. 155–166.
108. Heuser, J.E., T.S. Reese, M.J. Dennis, Y. Jan, L. Jan and L. Evans, 1979, Synaptic vesicle exocytosiscaptured by quick freezing and correlated with quantal transmitter release, J. Cell Biol. 81, 275–300.

Electrofusion and electroporation 899
109. Dimitrov, D.S., H. Golding and R. Blumenthal, 1991, Initial steps in HIV-1 envelope glycoproteinmediated cell fusion monitored by a new assay based on redistribution of fluorescence markers,AIDS Res. Human Retrovir. 7, 799–805.
110. Dimitrov, D.S., K. Hillman, J. Manischewitz, R. Blumenthal and H. Golding, 1992, Kinetics ofinteraction of sCD4 with cells expressing HIV-1 envelope and inhibition of syncytia formation,AIDS 60, 249–256.
111. Dimitrov, D.S., R. Willey, M. Martin and R. Blumenthal, 1992, Kinetics of HIV-1 interactionswith sCD4 and CD4+ cells: Implications for inhibition of virus infection and initial steps of virusentry into cells, Virology 187, 398–4060.
112. Sato, H., J. Ornstein, D. Dimitrov and M. Martin, 1992, Cell-to-cell spread of HIV-1 occurs withinminutes and may not involve the participation of virus particles, Virology 186, 712–724.
113. Chernomordik, L.V., G.B. Melikyan and Yu.A. Chizmadzhev, 1987, Biomembrane fusion: A newconcept derived from model studies using two interacting planar lipid bilayers, Biochim. Biophys.Acta 906, 309–352.
114. Morris, S.J., D.P. Sarkar, J.M. White and R. Blumenthal, 1989, Kinetics of pH-dependent fusionbetween 3T3 fibroblasts expressing influenza hemagglutinin and red blood cells, J. Biol. Chem.264, 3972–3978.
115. Hoekstra, D. and J.W. Kok, 1989, Entry mechanisms of enveloped viruses. Implications for fusionof intracellular membranes, Biosci. Rep. 9, 273–305.
116. Spruce, A.E., A. Iwata, J.M. White and W. Almers, 1989, Patch clamp studies of single cell-fusionevents mediated by a viral fusion protein, Nature 342, 555–558.
117. Ohno-Shosaku, T. and Y. Okada, 1985, Electric pulse-induced fusion of mouse lymphoma cells:roles of divalent cations and membrane lipid domains, J. Membr. Biol. 85, 269–280.
118. Dimitrov, D.S. and R. Blumenthal, 1991, Kinetics of intermembrane interactions leading to fusion,in: Cell and Model Membrane Interactions, ed. S. Ohki (Plenum Press, New York) pp. 115–133.
119. Sukharev, S.I., I.N. Bandrina, A.I. Barbul, L.I. Fedorova, I.G. Abidor and A.V. Zelenin, 1990,Electrofusion of fibroblasts on the porous membrane, Biochim. Biophys. Acta 1034, 125–131.
120. Blangero, C. and J. Teissie, 1985, Ionic modulation of electrically-induced fusion of mammaliancells, J. Membr. Biol. 86, 247–253.
121. Rols, M.-P. and J. Teissie, 1989, Ionic-strength modulation of electrically induced permeabilizationand associated fusion of mammalian cells, Eur. J. Biochem. 179, 109–115.
122. Papahadjopoulos, D., S. Nir and N. Duzgunes, 1990, Molecular mechanisms of calcium-inducedmembrane fusion, J. Bioenerg. Biomembr. 22, 157–179.
123. Scheludko, A., 1967, Colloid Chemistry (North Holland, Amsterdam).124. Dukhin, S.S., N.N. Rulyov and D.S. Dimitrov, 1986, Coagulation and Dynamics of Thin Layers
(Naukova Dumka, Kiev).125. Ivanov, I.B., B.P. Radoev, E. Manev and A. Scheludko, 1970, Trans. Faraday Soc. 66, 1262–1273.126. Ivanov, I.B. and D.S. Dimitrov, 1974, Hydrodynamics of thin liquid films. Effects of surface
viscosity on thinning and rupture of foam films, Colloid Polym. Sci. 252, 982–990.127. Radoev, B.P., D.S. Dimitrov and I.B. Ivanov, 1974, Hydrodynamics of thin liquid films. Effects
of surfactants on the rate of thinning, Colloid Polym. Sci. 252, 50–55.128. Dimitrov, D.S., I. Panaiotov, P. Richmond and L. Ter-Minassian-Saraga, 1978, Dynamics of in-
soluble monolayers, I. Dilational or elastic modulus, friction coefficient and Marangoni effect fordipalmitoyllecithin, J. Colloid Interface Sci. 65, 483–494.
129. Panaiotov, I., D.S. Dimitrov and L. Ter-Minassian-Saraga, 1979, Dynamics of insoluble monolay-ers, II. Viscoelastic behavior and Marangoni effect for mixed protein phospholipid films, J. ColloidInterface Sci. 72, 49–53.
130. Panaiotov, I., D.S. Dimitrov and M. Ivanova, 1979, Influence of bulk-to-surface diffusion inter-change on dynamic surface tension excess at uniformly compressed interface, J. Colloid InterfaceSci. 69, 318–325.
131. Dimitrov, D.S., I. Panaiotov, Ts. Ivanova and G. Georgiev, 1977, Surface pressure relaxation ofdipalmitoyllecithin monolayers, Ann. Univ. Sofia Fac. Chem. 72, 119–130.
132. Derjaguin, B.V. and Yu.V. Gutop, 1962, Colloid J. 24, 431–437.133. Derjaguin, B.V. and A.V. Prokhorov, 1981, J. Colloid Interface Sci. 81, 108–115.

900 D.S. Dimitrov
134. Derjaguin, B.V., 1986, Stability Theory of Colloids and Thin Films (Nauka, Moscow).135. Ivanov, I.B., 1988, Thin Liquid Films (Marcel Dekker, New York).136. Ivanov, I.B. and D.S. Dimitrov, 1988, Thin film drainage, in: Thin Liquid Films, ed. I.B. Ivanov
(Marcel Dekker, New York).137. Sackmann, E., 1990, Molecular and global structure and dynamics of membranes and lipid bilayers,
Can. J. Phys. 68, 999–1012.138. Lipowsky, R., 1991, The conformation of membranes, Nature 349, 475–481.139. Siegel, D.P., 1993, Modeling protein-induced fusion mechanisms: insights from the relative stability
of lipidic structures, in: Viral Fusion Mechanisms, ed. J. Bentz (CRC Press, Boca Raton, Florida).140. Dimitrov, D.S., 1981, A hydrodynamic theory of the bilayer membrane formation, Biophys. J. 36,
21–25.141. Dimitrov, D.S., 1983, Dynamic interactions between approaching surfaces of biological interest,
Prog. Surf. Sci. 14, 295–424.142. Dimitrov, D.S., 1986, Approach and instability of membranes: Physicochemical mechanisms and
applications to adhesion, fusion, dielectrophoresis, electroporation and liposome formation, in:Proc. 8th School Bioph. Membrane Transport. Mierki. Polland, Vol. 1, pp. 51–82.
143. Song, L., Q.F. Ahkong, G. Georgescauld and J.A. Lucy, 1991, Membrane fusion without cyto-plasmic fusion (hemi-fusion) in erythrocytes that are subjected to electrical breakdown, Biochim.Biophys. Acta 1065, 54–62.
144. Ivanov, I.B., D.S. Dimitrov and B.P. Radoev, 1978, Hydrodynamics of thin liquid films. Rate ofexpansion of the perimeter of the three-phase contact line, J. Colloid Interface Sci. 63, 166–168.
145. Dimitrov, D.S., I.B. Ivanov and T.T. Traykov, 1984, Influence of permeability on the rate of mutualapproach of membranes, J. Membr. Sci. 17, 79–87.
146. Kuzmin, P.I., V.F. Pastushenko, I.G. Abidor, S.I. Sukharev, A.I. Barbul and Y.A. Chizmadzhev,1988, Theoretical analysis of a cell electrofusion mechanism, Biol. Membrany 5, 600–612.
147. Laggner, P., 1988, X-Ray studies on biological membranes using synchrotron radiation, Top. Cur-rent Chem. 145, 173–202.
148. Laggner, P. and M. Kriechbaum, 1991, Phospholipid phase transitions: Kinetics and structuralmechanisms, Chem. Phys. Lipids 57, 121–145.
149. Tate, M.W., E. Shyamsunder and S.M. Gruner, 1992, Kinetics of the lamellar-inverse hexagonalphase transition determined by time-resolved X-ray diffraction, Biochemistry 31, 1081–1092.
150. Sugar, I.P., W. Forster and E. Neumann, 1987, Model of cell electrofusion: Membrane electropo-ration, pore coalescence and percolation, Biophys. Chem. 26, 321–335.
151. Kozlov, M.M. and V.S. Markin, 1983, Possible mechanism of membrane fusion, Biophysics 28,255–261.
152. Dimitrov, D.S. and D.V. Zhelev, 1988, Fluctuation wave mechanism of membrane electrofusion,Colloid Polym. Sci. 76, 26–31.
153. Hui, S.W. and D.A. Stenger, 1992, Effects of intercellular forces on electrofusion, in: Guide toElectroporation and Electrofusion, eds D.C. Chang, B.M. Chassy, J.A. Saunders and A.E. Sowers(Academic Press, Orlando) pp. 167–178.
154. Blumenthal, R., 1987, Membrane fusion, Curr. Top. Membr. Transp. 29, 203–254.155. Blumenthal, R. and D.S. Dimitrov, 1995, Membrane fusion, in: Handbook of Physiology Section
on Cell Physiology, eds J. F. Hoffman and J. C. Jamieson (Oxford University Press, New York).156. Sarkar, D.P., S.J. Morris, O. Eidelman, J. Zimmerberg and R. Blumenthal, 1989, Initial stages of
influenza hemagglutinin-induced cell fusion monitored simultaneously by two fluorescent events:Cytoplasmic continuity and lipid mixing, J. Cell Biol. 109, 113–122.
157. Chang, D.C. and T.S. Reese, 1990, Changes in membrane structure induced by electroporation asrevealed by rapid-freezing electron microscopy, Biophys. J. 58, 1–12.
158. Bartoletti, D.C., G.I. Harrison and J.C. Weaver, 1989, The number of molecules taken up byelectroporated cells: quantitative determination, FEBS Lett. 256, 4–10.
159. Hofmann, G.A., 1989, Cells in electric fields. Physical and practical electronic aspects of electrocell fusion and electroporation, in: Guide to Electroporation and Electrofusion, eds D.C. Chang,B.M. Chassy, J.A. Saunders and A.E. Sowers (Academic Press, Orlando, FL) pp. 389–407.