electronics for imaging, inc. (efii) harbors parallel ties ... · 1 | p a g e glasshouse research...
TRANSCRIPT

1 | P a g e
GlassHouse Research
10/13/16
Electronics for Imaging, Inc. (EFII) harbors parallel ties to Tyco’s previous
accounting irregularities, including a literal tie on its Auditing Board
Who is GlassHouse Research? GlassHouse Research (GHR) is made up of former forensic
accountants/analysts who have worked for prominent hedge funds on Wall Street, as well as
boutique forensic accounting firms. Our purpose is to expose public companies that have
been taking advantage of US GAAP as well as IFRS accounting for their benefit. We seek to
find companies where GAAP (or even worse, non-GAAP) earnings are deviating from true
economic earnings of the target firm.
Overall, we search for evidence of a “culture of fraud” within public companies.
Disclaimer: As of the publication date of this report, GlassHouse, LLC and others that contributed research to this report and
others that we have shared our research with (collectively, the “Authors”) have short positions in, and own put option positions
on, the stock of Electronics for Imaging, Inc. (EFII), and stand to realize gains in the event that the price of the stock decreases.
Following publication of the report, the Authors may transact in the securities of the company covered herein. All content in
this report represent the opinions of GlassHouse. The Authors have obtained all information herein from sources they believe
to be accurate and reliable. However, such information is presented “as is,” without warranty of any kind – whether express or
implied. The Authors make no representation, express or implied, as to the accuracy, timeliness, or completeness of any such
information or with regard to the results obtained from its use. All expressions of opinion are subject to change without notice,
and the Authors do not undertake to update or supplement this report or any information contained herein. Please read our
full legal disclaimer at the end of the report.
2 | P a g e
Initiation of Electronics for Imaging (EFII) with a target price of $13.50
GlassHouse Research focuses on the terminally ill roll-up Electronics for Imaging, Inc. (AKA
EFI), which uses every accounting gimmick in the book to mask true economic earnings.
The roll-up EFI’s continued use of acquisitions concurrent with plummeting free-cash-flow
is a long-term recipe for disaster: While the company touts its double-digit top-line growth,
based on free-cash-flow trends (or lack thereof, at –$52.6 million TTM) and no organic
growth, we believe the firm will run into cash flow issues and generate future diminishing
returns in upcoming periods.
Accounting irregularities litter EFI’s weak balance sheet and add a time catalyst to EFI’s
share-price demise:
o Inventory diagnostics provide evidence of channel stuffing at EFI with
inventories up near 50% YOY, dwarfing revenue growth.
o Management misclassifies long-term receivables into “other assets” on the balance
sheet and misleadingly excludes them from their reported DSO calculation.
o In our view, EFI has underfunded its warranty reserve liability, especially in light
of its recently disclosed extended warranty terms. We calculate this under-expense
benefited the firm by 12% of earnings over the TTM.
Sell-side analysts are fooled by phony non-GAAP exclusions that GHR will expose as
neither non-recurring nor non-cash expenses: EFI is the benefactor from one of the worst
uses of non-GAAP exclusions GHR has seen in our long-tenured history. TTM non-GAAP
income ($2.22) now stands 290% above GAAP income of $0.57, representing the highest
difference in EFI’s history. Persistent material exclusions of intangible amortization
expenses, stock-based compensation, restructuring/other and acquisition-related costs
obfuscate EFI’s sustainable earnings.
EFI uses highly questionable judgement with its executives in key positions: With an
auditing board member with ties to Tyco, a recently appointed CFO who nearly ran his
previous business into bankruptcy, subjective short-term bonus incentives for the CEO &
CFO, and no CPAs anywhere in sight in key executive positions, GHR believes
management is creating a culture of “hitting the numbers” at EFI.
Premium valuation erroneously based on “adjusted” earnings is unwarranted given the
material long-term structural issues and near-term accounting risk: Using a sustainable
earnings figure detailed in this report, GHR will show why we believe an approximate
71.0% downside to EFI’s current share price is in its future.

3 | P a g e
Key Similarities Between EFI and Tyco
Key Characteristic Tyco International Electronics for Imaging
Business Strategy
Platform electronics company
that spread into fragmented
industries through acquisitions
Platform industrial printing
company that is primarily
growing through acquisitions
Corporate Culture
CEO, who lives a highly
extravagant lifestyle along with
his key executives, who only care
about growing the top line
CEO leads race to $1 billion goal
in revenue to appear “more
attractive” to investors
Key Executive Role of
Richard Kashnow
Served as President of “Tyco
Ventures” after his firm,
Raychem, was acquired by Tyco
in 1999
Served as a “consultant” since
2003 and current Board of
Directors and Auditing Board
Member
Years of Accounting/Auditing
Experience Combined
of CEO, CFO & Auditing Board
0 Years 0 Years
Auditor PricewaterhouseCoopers LLP
PricewaterhouseCoopers LLP
through 2014 (dismissed);
Deloitte & Touche LLP
Accounting Concerns
Improper accounting practices to
inflate operating income, spring-
loading, undervaluing acquired
assets and overvaluing liabilities,
among other issues
Concerns with acquisition
accounting, spring-loading,
channel-stuffing, misclassifying
AR, and adequacy of warranty
reserve
End Result
CEO Dennis Kozlowski and CFO
Mark Swartz sentenced to jail on
charges they reaped $600mm
through racketeering among
other levied fines to Tyco
???????

4 | P a g e
Company Background
Electronics For Imaging, Inc. (EFI) provides digital inkjet printers, business process
automation solutions, and color digital front ends (DFE) in the United States and
internationally.
The company’s Industrial Inkjet segment (50.7% of sales as of 2015) offers ink for use in
commercial photo labs, sign shops, graphic screen printers, specialty commercial printers,
and digital and billboard graphics providers.
Its Productivity Software segment (15.3% of sales) provides software suite that enables end-
to-end business and production workflows for the print and packaging industry. This
segment offers business process automation software; Pace, a cloud-based business process
automation software; Metrix, a solution for estimating, planning, and integration into
prepress and post-press solutions; and cloud-based order entry and order management
systems, as well as cross-media marketing systems.
The company’s Fiery segment (33.9% of sales) offers stand-alone DFEs connected to digital
printers, copiers, and other peripheral devices; embedded DFEs and design-licensed solutions
used in digital copiers and multi-functional devices; optional software integrated into its
DFEs, such as Fiery Central and Command WorkStation; Fiery Self-Serve, a self-service and
payment solution; PrintMe mobile printing application; and stand-alone software-based
solutions, such as proofing and scanning solutions.
Electronics For Imaging, Inc. was founded in 1988 and is headquartered in Fremont,
California.

5 | P a g e
Roll-Up Model Distorts True Economic Earnings at EFI
Haven’t we seen how this story ends multiple times before? Roll-ups such as Valeant, Endo
Pharma, Enron, and relevant to this particular company, Tyco. In fact, this strategy has
been discussed by one of the most famed investors of all-time Peter Lynch, who coined the
term “diworseification” – the idea that acquiring company after company for growth will
lead to the demise of the original firm.
Let us point out why we believe management is obsessed with acquiring companies and how
management could not stop even if they wanted to:
1) The acquiring of companies inorganically boosts EFI’s revenue in order to hit
their arbitrary $1 billion revenue goal set in 2013.
2) Management’s lack of disclosures regarding organic revenue makes it extremely
easy for them to mask organic revenue trends from complacent sell-side analysts.
3) Management has an added incentive to increase sales and non-GAAP operating
earnings, as discussed later, to hit target and accelerator bonuses.
4) The use of purchasing assets through acquisitions allows management to tout a
reported aesthetic Cash-Flow-from-Operations figure that does not take into
account cash spent on acquisitions.
5) This allows management to exclude amortization expenses (where real cash was
spent during the acquisition) from non-GAAP earnings because they are
incorrectly deemed as “non-cash”.
6) Management is then able to exclude very-much recurring restructuring and
acquisition expenses from non-GAAP earnings because management considers
them to be “non-recurring” in nature, even though they have been used in 32
consecutive periods.
When will analysts and investors stop rewarding firms
with premium multiples because they are on a
spending-spree acquiring companies for growth?

6 | P a g e
7) This may allow management to hide actual normal operating expenses into the
restructuring and acquisitions charges on the income statement, which are
excluded from non-GAAP earnings, similar to hedge fund manager John
Hempton’s thesis on Valeant.
Can we now see why management has continued motivation to use its acquisition growth
strategy? Here is the excerpt management gives in its 10-K filings with regards to its growth
strategy:
The growth and expansion of our revenue will be derived from (i) product innovation through internal development efforts or business acquisition, (ii) increasing market coverage through internal efforts or business acquisition, (iii) expanding the addressable market, and (iv) establishing enterprise coherence and leveraging industry standardization.
And here is CEO Guy Gecht responding to future acquisitions in a recent EFI earnings call:
Shannon Siemsen Cross Okay. And then my last question is just, how should we be thinking about acquisitions, given you've got Nozomi coming, you're ramping Reggiani, you made the software acquisition, but what's kind of your feeling in terms of acquisitions and what do you see in the pipeline? Guy Gecht So our business development team continues to evaluate, remain very active. Our goal at this point is not to enter a new market by acquisition. It's just to make the markets we are in a lot stronger. So to the extent we make our offering to packaging stronger, we'll act on this. To the extent we can make our offering in textiles stronger like we did with Optitex, we'll act on this. To the extent we can make any other segments stronger, we can act on this. We think between the – excuse me, between the multiple segments, there's such a tremendous future opportunity that all we want right now is to double down on what we do.
Corroborating our statements above, management has no plans to cease, in fact they will
“double-down” on acquiring companies no matter what impact it has on free-cash-flow or
GAAP earnings. From EFI’s 2015 10-K filings, listed below are EFI’s recent acquisitions:

7 | P a g e
*The company also closed the acquisitions of Optitex Ltd., Rialco Limited in 2016 with Nozomi planning to be closed in Q3 2016.
GHR ultimately believes that organic growth of the company is being deliberately withheld
from analysts in order to mask its abysmal growth rate. Time and time again, GHR found
issues with EFI’s disclosures regarding its acquisitions in its filings. To illustrate this, we will
again list out everything wrong with EFI’s disclosures, or lack thereof:
1) Nowhere in any of EFI’s press releases does management point out how much
revenue growth was attributable to acquisitions. This is a very common excerpt in
most acquisitive companies as the earnings release is the first thing analysts look at
when a company reports its quarter.
2) Nowhere in any of EFI’s 10-Q filings does management quantify its revenue growth
from acquisitions. Instead they choose to use vague statements such as “post-
acquisition synergies”. Again, it is highly irregular to not disclose this in a 10-Q filing.
3) The company only mentions ONCE in any of its filings the revenue impact from
acquisitions. In the 2015 10-K, it states “post-acquisitions revenue was $88.4 million
related to these four acquisitions.” This equates to a 0% organic growth rate in 2015.
Worse off, this is the ONLY mention of post-acquisition in this filing and is nowhere
to be found in any previous 10-K filings in the same paragraph or anywhere else in the
annual report.
4) Management does speak to organic growth sporadically throughout their earnings
calls, however we note that these calls are not audited by an accounting firm and
mostly use qualitative ballpark figures instead of actual results.

8 | P a g e
5) The company encourages analysts to focus on its Cash-Flow-from-Operations that is
positive instead of the declining and negative Free-Cash-Flow numbers, including
cash spent on acquisitions.
6) The company does an amazingly poor job of disclosing acquisition figures for each
purchase that every other company on the street is able to perform. There is no
information whatsoever regarding working capital figures, making it almost
impossible to analyze these acquisitions. Management will no doubt blame this on
each acquisition not being material enough to disclose. However, GHR begs to differ.
GHR points out that there are no hard figures anywhere else in the calls relating to organic
revenue growth. As a matter of fact, the only decent disclosures on the earnings calls relating
to organic growth stems from the Q&A on the Q2 call:
Ananda Baruah Got it. And -- okay, we can do that math. And then I guess really just 2 more for me. Going to kind of the organic growth expectations, back half of the year and then actually heading into '17, if we sort of do [indiscernible], based on my organic growth math, you sort of have flat organic growth. Rev dollars for Inkjet, kind of December, March, June -- I probably have to tune up my June, but December, March, June. And then the growth rates that you're -- kind of like the mid-teens plus growth rates that you're guiding to for September, seem like they would have carried through, quite frankly, into next year. So is that an accurate way to think about organically, now that Reggiani and Matan are going organic, the next kind of 12 months organic growth rate on the Inkjet side could look like -- I know you guys have other stuff going on like Creta, ink is ramping and Nozomi is coming on, that's going to be organic, et cetera. But sort of ex that stuff, is that an appropriate way to think about it? And if not, how would you like us to think about it? And then I have one more follow-up. Marc D. Olin Yes. So the guidance we gave for Q3, as you know, is pretty much a straight organic growth rate at this point in time for the Inkjet group. And so I don't -- we're not giving guidance for Q4 and beyond yet to say that that's going to be the sustained growth rate for the group. But I think we have talked about long term that we expect Inkjet to be in the 10% to 13% organic growth. So in terms of looking at how you average the back half of the year and beyond, that's -- we haven't changed that long-term guidance for the Industrial Inkjet segment. And -- but again, I don't think -- Q4, we're on a much tougher compare year-over-year if you look at what we did in 2015. So I definitely would not expect Inkjet to grow at the same rate organically in Q4 as we're forecasting in Q3.
GHR believes that many of the same “spring-loading” tactics Tyco
used to overstate earnings through its acquisitions may be
currently being used by EFI today. However, with no disclosures
provided whatsoever into the acquired companies working capital
accounts (which every other company provides), this is
unfortunately impossible to track.

9 | P a g e
Overall, GHR believes that EFI’s organic growth rate is much worse than the flat growth
that was reported at the end of 2015. While the acquisitions of 2015 and before are now close
to annualizing, adding to the (not disclosed) organic growth rate, we believe the core
company is suffering greatly in stealth. The lack of consistency and disclosures, based on our
experience, can only mean that the core company is suffering without the help of
acquisitions. But as we at GHR know so dearly, this game cannot be played forever.
Eventually, the money for new acquisitions runs out and the carousel stops. Is that close to
happening soon with EFI? Take a look at EFI’s cash position in the chart below and you be
the judge.
Annual Profitability Figures for EFI
-80.0
-60.0
-40.0
-20.0
0.0
20.0
40.0
60.0
80.0
100.0
120.0
Q2 201620152014201320122011
Free-Cash-Flow (includes cash acquisitions) GAAP Net Income Non-GAAP Net Income
We think a billion company can generate a lot more
profits. It can be a lot more attractive to investors.
We want to become a billion plus company, and we
do it organically eventually, but we can accelerate
with good acquisitions. – CEO Guy Gecht in 2013

10 | P a g e
Evidence of Channel Stuffing at EFI
Diving into EFI’s inventory figures, GHR finds a plethora of accounting concerns that all
point to the fact that EFI is currently stuffing its channel to increase sales. Basically, EFI is
able to push its overbuilt inventory onto its customers for a short period of time to increase
sales before a shortfall occurs. GHR can track this by analyzing certain inventory diagnostics
of EFI and its customers.
What does this ultimately mean for EFI? With two bleak possible outcomes for EFI
discussed later, we believe our inventory analysis puts a time catalyst of EFI’s share price
decline (within one-to-three quarters). The two segments where we believe EFI has an
overbuilt inventory position are mostly in the Industrial Inkjet segment and to a lesser
amount, the Fiery digital-front-end segments.
With respect to the former, the Inkjet segment’s customer base consists of commercial
photo labs, graphic screen printers, large sign shops, specialty commercial printers and
digital and billboard graphic providers. While it would be impossible to track the channel
with these small non-public companies, we can track EFI’s own overall inventory trends.
Below we can see EFI’s rapid inventory growth on the balance sheet in days-sales-
inventory, which has spiked to 88 days in the most recent period; the highest amount
reported in Q2 since 2009 during the recession. This is compared to a Q2 average of 73
days over that time period.
55
60
65
70
75
80
85
90
95
3M DSI 12M DSI

11 | P a g e
While the recent rise in DSIs would cause even the most novice sell-side analyst to take
note, management has been less then forthcoming with the reason for the overall recent
increase.
In the Q4 2015 earnings call management stated, “Our net inventory balance was $105
million, down $7 million sequentially as a result of strong fourth quarter sales, which resulted
in inventory turns of 4.8 down 0.5 turns year-over-year as a result of the larger portion of
revenue coming from Inkjet, which requires much higher raw material and finished goods
inventory than Fiery or Productivity Software.”
Again this sentiment was repeated in the Q1 call, “Our net inventory balance was $122
million, up $15 million sequentially, as a result of high inventory for Industrial Inkjet as we
prepared for the product launches of our new packaging platform at drupa1and the new M4
Cretaprint printer, driving turns of 3.8, down 0.6 turns year-over-year, with a larger portion of
the revenue coming from inkjet which requires much higher raw material and finished goods
inventory than Fiery or Productivity” Great. So GHR would expect DSIs to normalize back
to the 75 day DSI levels after the drupa conference, correct?
Of course the drupa conference passed, and yes, while we do concede that inventories
came down slightly sequentially, GHR calculates only a two day decline in DSIs! What
does management have to say about this in Q2? “Our net inventory balance was $111
million, down $11 million sequentially as a result of our efforts to improve inventory levels
that we discussed last quarter. This drove inventory turns to 4.3, down 0.7 turns year-over-
year, but up 0.6 turns sequentially.”
So now we are trying to “improve inventory” instead of build for future sales? The
convoluted explanations from management leave us dumbfounded as EFI’s overbuilt
inventory has been building for the past five years! In fact, DSI’s are up 31.9% (not
inventory), from a value of only 67 days at Q2 2011 to 88 days currently with very little
explanations as the reasons to why.
Using Occam’s Razor here, a better explanation for the continued rise in inventory on the
balance sheet is that EFI has stuffed its retail channel with so much product that it is
now building on the balance sheet because they cannot sell it. As aforementioned, there
1 The drupa conference was held on June 23rd through July 3rd 2016. This conference is the largest printing equipment exhibition in the world, held every four years by Messe Dusseldorf in Germany. http://www.drupa.com

12 | P a g e
are only two possible outcomes in this scenario based on our experience 1) EFI will
attempt to maintain its price points on its products resulting in decreased sales and future
impairment risk of its inventory and/or 2) the company will need to discount its products
significantly in order to move inventory and avoid warehousing & transporting costs.
Further corroborating our hypothesis, GHR took a look at inventory relative to forward
sales estimates to test management’s “build for future sales” comment. Here we actually
found the opposite of CFO Olin’s expectations where inventory was 44.8% and 21.1% of
3M and 6M forward sales, respectively. These figures are both near their respective five
year high for EFI. In laymen’s terms, if the dominator (future sales) was expected to be
much larger, then this ratio would be more in-line with historical norms for the company.
However this is not the case, in fact, it’s the opposite.
Finally, another “tell” that points to management’s comments being disingenuous is the
accounts payable-to-inventory ratio being at a five year low for Q2s at 93.7%. This tells
us that management has been actually decreasing its inventory purchases over the last
year, but inventory continues to build due to decreased sales. Again, these accounting
metrics point to GHR’s own channel-stuffing hypothesis rather than management’s
explanations as discussed above.

13 | P a g e
While Accounts Receivable are Problematic, There Is Even More Hidden Risk on the Balance
Sheet
In combination with EFI’s added risk of a stuffed inventory channel, their accounts
receivable (AR) on the balance is in no better position. In our experience, the rapid increase
in both these balance sheet accounts points to future share price degradation in upcoming
periods as the firm works to normalize these line-items.
The worst part of the prolonged AR increase is that management admits in its 10-K filing to
extending payment terms to its customers, which effectively have artificially increased sales
in the period. Again, while management can entice customers to buy its products with
extended credit terms for a short period of time, this is not sustainable in the long-term and
points to a decreased demand for its products. So what happens next year when these periods
with one-time revenue gains from extended credit annualize? Well, in GHR’s view, most
investors can expect a large drop off in revenue increases as those non-recurring revenue
gains disappear.
Even with the extension of credit terms, after plowing through the footnotes, GHR actually
dug-up additional at-risk receivables that are not being included in management’s DSO
calculations. These at-risk receivables extend beyond a one year collection timeframe and are
actually being hidden in other current assets and other long-term assets on the balance sheet.
Currently, EFI’s days-sales-outstanding levels have reached either near or at five year
highs at 77 days and 73 days of 3M DSO and 12M DSO, respectively. The increase of
these ratios has been persistent going back, where these figures stood at just 58 days and
56 days, respectively, in Q2 2011.
Recently, as of Q4 2015, EFI reported a DSO value of 69 days for the fiscal year.
According to the 10-K filing footnotes, the rise in AR and thus DSO values was due to
the following, “DSOs increased during the year ended December 31, 2015, compared with
December 31, 2014, primarily due to sales with extended payment terms and a non-linear
sales cycle resulting in significant billings at the end of the year.” The extension of payment
terms was not discussed in the firm’s earnings call that period.
In Q1 2016, we can see that management added on further explanations for the spike in
DSOs in the period to 80 days. From the Q1 earnings call, “While Q1 is usually a seasonally
back-end loaded quarter, this year's results were exaggerated as the FESPA Exhibition
occurred during the first half of March. This delayed a lot of decisions until the last week of
the quarter and, therefore, reduced our cash collections and increased our AR. This factor,
14 | P a g e
combined with the increase in our direct sales percentage due to the acquisitions and the
related payment terms, caused AR to increase in the quarter to $205 million. DSO was 79.9
days, up 1 day from Q1 2015”
Again on the Q2 earnings call, CFO Marc Olin gives yet another explanation to why
DSOs have not yet normalized in the period, “DSO was 78.3 days, up 1.8 days from Q2 '15.
As we indicated at the beginning of the quarter, we expected to see some late activity in the
quarter due to the drupa trade show, which took place during the first 2 weeks of June. This
is one of the reasons why we're not able to improve our DSOs as much as we would have
liked, however, we did still show positive progress from Q1 with a sequential improvement of
1.6 days.”
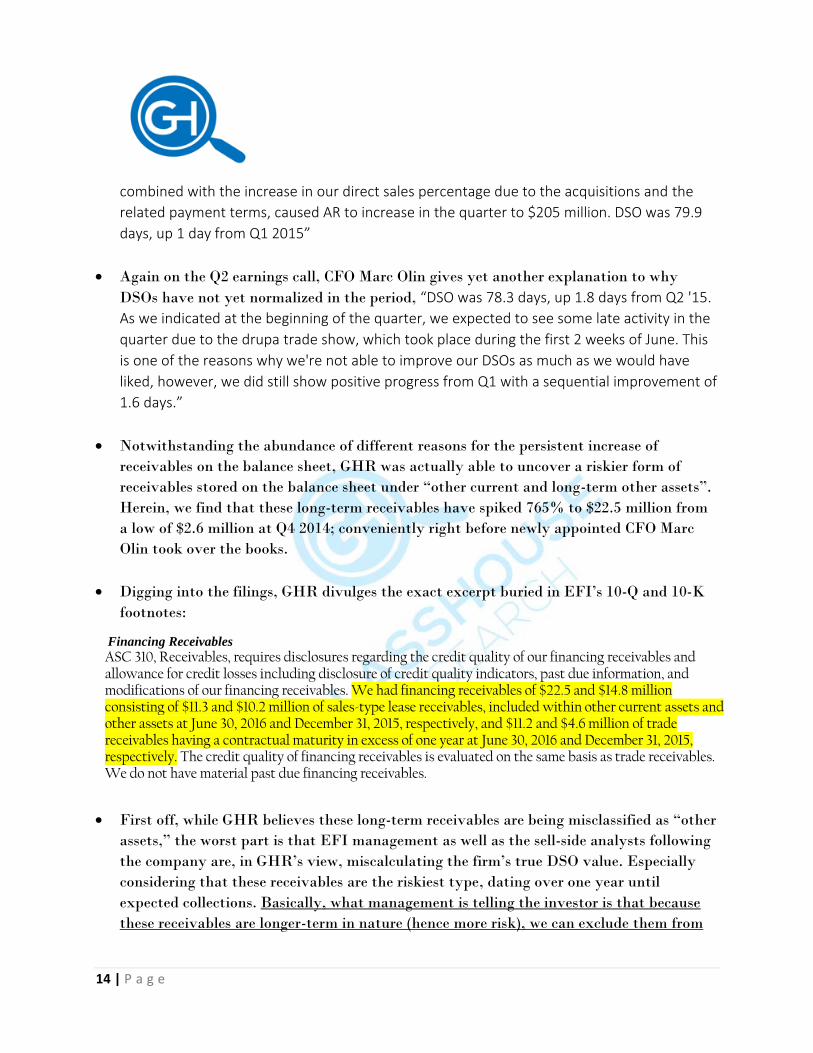
Notwithstanding the abundance of different reasons for the persistent increase of
receivables on the balance sheet, GHR was actually able to uncover a riskier form of
receivables stored on the balance sheet under “other current and long-term other assets”.
Herein, we find that these long-term receivables have spiked 765% to $22.5 million from
a low of $2.6 million at Q4 2014; conveniently right before newly appointed CFO Marc
Olin took over the books.
Digging into the filings, GHR divulges the exact excerpt buried in EFI’s 10-Q and 10-K
footnotes:
Financing Receivables ASC 310, Receivables, requires disclosures regarding the credit quality of our financing receivables and allowance for credit losses including disclosure of credit quality indicators, past due information, and modifications of our financing receivables. We had financing receivables of $22.5 and $14.8 million consisting of $11.3 and $10.2 million of sales-type lease receivables, included within other current assets and other assets at June 30, 2016 and December 31, 2015, respectively, and $11.2 and $4.6 million of trade receivables having a contractual maturity in excess of one year at June 30, 2016 and December 31, 2015, respectively. The credit quality of financing receivables is evaluated on the same basis as trade receivables. We do not have material past due financing receivables.
First off, while GHR believes these long-term receivables are being misclassified as “other
assets,” the worst part is that EFI management as well as the sell-side analysts following
the company are, in GHR’s view, miscalculating the firm’s true DSO value. Especially
considering that these receivables are the riskiest type, dating over one year until
expected collections. Basically, what management is telling the investor is that because
these receivables are longer-term in nature (hence more risk), we can exclude them from

15 | P a g e
the rest of our normal accounts receivable line-item on the balance sheet and thus our
DSO calculation.
Below, GHR recalculates what we believe are EFI’s true DSO values adding in both the
firm’s disclosed sales-type lease receivables and long-term trade receivables to the total
AR balance. Here we can conclude that the firm’s receivables are in much worse shape
than originally thought at 86 days and 79 days of 3M DSO and 12M DSO, respectively.
50
55
60
65
70
75
80
85
90
3M DSO 12M DSO

16 | P a g e
EFI Extends its Warranty Terms for its Customers, But Does Not Accurately Account for this
in its Reserve
In combination with EFI’s added risk of a stuffed inventory channel and an extension of
unstainable credit terms to customers, EFI’s balance sheet woes continue as GHR believes its
warranty reserve is insufficiently funded. Listed in the company’s risk factor section in its 10-
K, EFI discloses how inadequately or miscalculating its warranty reserve can impact its
company:
Our products may contain defects, which are not discovered until after shipping, which could
subject us to warranty claims in excess of our warranty reserves.
Our products consist of hardware and software developed by ourselves and others, which may contain
undetected defects. We have in the past discovered software and hardware defects in certain of our
products after their introduction, resulting in warranty expense and other expenses incurred in
connection with rectifying such defects or, in certain circumstances, replacing the defective product,
which may damage our relationships with our customers. Defects could be found in new versions of
our products after commencement of commercial shipment and any such defects could result in a loss
or delay in market acceptance of such products and thus harm our reputation and revenue. Defects in
our products (including defects in licensed third party software) detected prior to new product releases
could result in delays in the introduction of new products and the incurrence of additional expense,
which could harm our operating results. We generally provide a twelve month hardware limited
warranty from date of shipment for certain Industrial Inkjet printer and Fiery DFE products, which
may cover both parts and labor.
Our standard warranties contain limits on damages and exclusions, including but not limited to
alteration, modification, misuse, mishandling, and storage or operation in improper environments.
While we recorded an accrual of $9.6 million at December 31, 2015, for estimated warranty costs that
are estimable and probable, based on historical experience, we may incur additional costs of revenue
and operating expenses if our warranty provision does not reflect adequately the cost to resolve or
repair defects in our products or if our liability limitations are declared enforceable, which could harm
our business, financial condition, and operating results.
In GHR’s view, management has been under-reserving its warranty reserve in recent
periods which has cosmetically enhanced margins. Specifically, as EFI has been growing
the top-line through acquisition growth and reporting increased warranty settlements
over the past five years, we find that EFI’s provisioning for its warranty reserve
(warranty expense) has been underfunded based on our calculations.

17 | P a g e
To illustrate this, GHR calculates a 2.2% YOY decline of EFI’s warranty reserve to
$9.63 million as of Q2 2016. However, more importantly, the warranty reserve fell by
18.3% YOY to 1.0% relative to TTM sales. This is important to understand because as
EFI increases its sales (mostly through acquisitions), the firm will naturally need a higher
reserve to account for those extra sales, hence the ratio with TTM sales.
Looking at historical norms for EFI, the company’s five year average reserve-to-12M
sales ratio stands at 1.4%. While this may not appear to be material relative to the
current value of 1.0%, if we use the 1.4% average as a baseline, GHR calculates a 7 cent
benefit to the bottom line for EFI over the TTM.2 Or in other words, 11.8% of GAAP
EPS over the TTM (57 cents) was based on this unsustainable warranty reserve benefit
alone.
Exacerbating this unsustainable boost to earnings over the TTM, we found that EFI has
changed the language in its warranty reserve section in its annual filing:
Warranty Reserves (2014 10-K)
Our Industrial Inkjet printer and Fiery DFE products are generally accompanied by a 12-month
limited warranty from date of shipment, which covers both parts and labor. Estimated future hardware
and software warranty costs are recorded as a cost of product revenues when the related revenue is
recognized, based on historical and projected warranty claim rates, historical and projected cost-per-
claim, and knowledge of specific product failures that are outside our typical experience.
Warranty reserves were $9.7 and $11.0 million as of December 31, 2014 and 2013, respectively.
Warranty Reserves (2015 10-K)
Our Industrial Inkjet printer and Fiery DFE products are generally accompanied by a 12 to 15-month
limited warranty from date of shipment, which covers both parts and labor.
Warranty reserves were $9.6 and $9.7 million as of December 31, 2015 and 2014, respectively.
So where clearly management was trying to entice sales with an extension of its limited
warranty of its products (another unsustainable form of revenue), GHR has found no
evidence of accounting for this change in its warranty reserve. This puts the company at
risk of heightened write-offs and subsequently warranty expenses as aforementioned
above. In our view, we see an acceleration of margin degradation in future periods (within
the next three quarters) based on the firm’s inadequate warranty reserve alone.
2 This is based on a 12.4% TTM tax rate.

18 | P a g e
Non-GAAP Exclusions Masks EFI’s True Economic Earnings
As evident by reviewing our previous Annual Profitability Chart (page 9), we believe that
EFI has a significant cash flow problem that will continue to hinder the firm as they acquire
more companies. The reader can see below how CFO Marc Olin will try and steer analysts to
their suggested cash flow metric of “CFOA relative to non-GAAP income”.
Cash flow of $68 million for the last 12 months represented 64% of non-GAAP net income. We're very
pleased to see the progress made towards our targeted rate of 90% of non-GAAP net income and cash from
operations considering the more capital-intensive structure of our business this year in Q2 versus last year
due to the increased manufacturing presence of Reggiani and Matan.
In our prolonged combined years of analyst experience, we at GHR have NEVER seen this
metric used by any other public company for good reason. IT MAKES NO SENSE. Let us
show the reader why.
You cannot pay your bills with non-GAAP earnings

19 | P a g e
Management is aggressively trying to steer the sell-side to focus on the top arrow number of
$31.9 million of 6M cash-from-operating activities, however due to EFI’s acquisitive nature
we should also be focusing on cash spent on CapEx as well as acquisitions (the 2nd and 3rd
arrows). Let GHR put this another way, is it fair that EFI can exclude the cash spent on
acquisitions that have inventory, AR, other current liabilities and other working capital
items on the acquired company’s balance sheet from “Cash Flow” just because it was
acquired? If that’s the case, why spend any cash on inventory at all? Let’s just buy
companies that have inventory and then we will be able to say we spent no “cash” on
products at all!
But aside from the cash flow issues that are plaguing EFI. Let’s go through one-by-one and
debunk every reason why EFI’s current non-GAAP exclusions have no business being
excluded from income. Below is an excerpt that shows EFI’s non-GAAP exclusions for Q2
2016 and what do you know? Magically, $5.2 million in earnings is translated to $26.7 million
instantly!

20 | P a g e
To quantify how large EFI’s recent bifurcation between GAAP and non-GAAP income has
become, we tracked the difference over the last two years and found it to have grown by
114% since Q1 2014. Not only that, GHR calculates that TTM non-GAAP income of $2.22 is
now 290% higher than reported GAAP figures of $0.57.
GAAP vs. non-GAAP Earnings Surprises
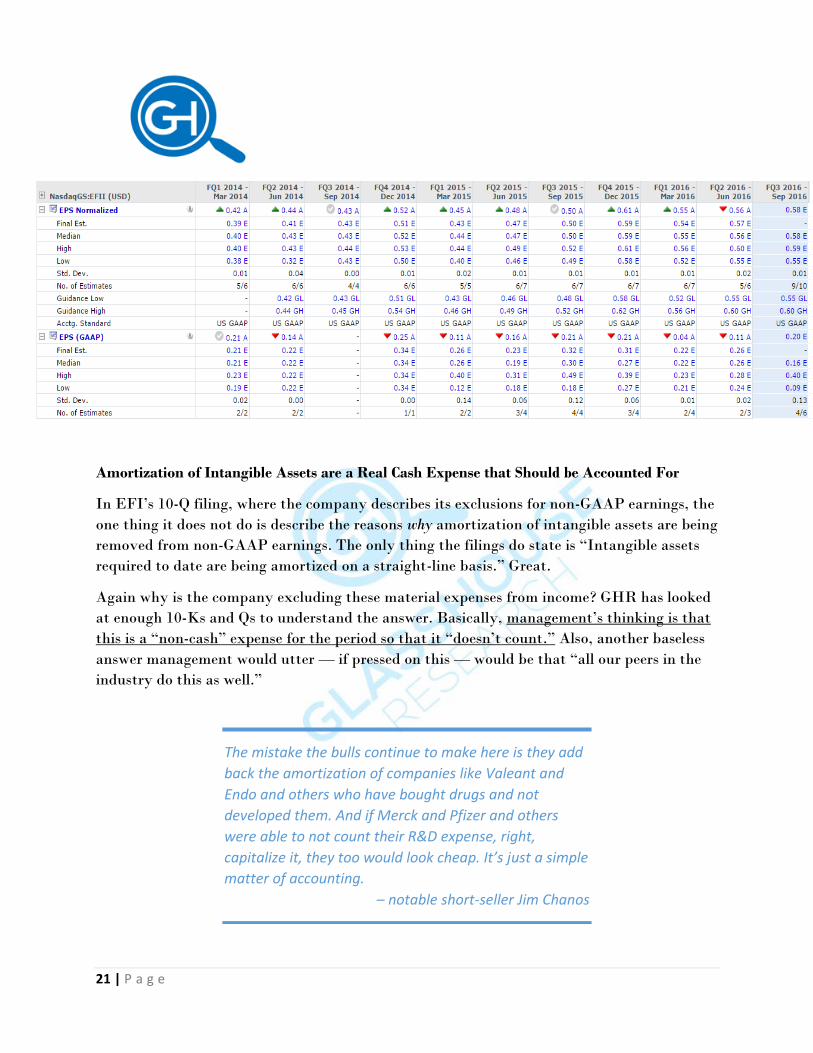
What we find quite concerning when analyzing EFI’s recent earnings surprises (below) are
twofold. First, when looking at the firm’s recent positive non-GAAP earnings surprises, we
observed that EFI was not able to beat by more than 2 cents dating back to Q2 2014.
Quantifying this, we find that since Q1 2014, the firm has only averaged to beat its estimate
by 2.7% every quarter. With the amount of subjectivity involved with non-GAAP
exclusions, as discussed below, we at GHR believe it would be quite easy for management to
either pay out more in SBC or report heightened restructuring charges to just beat out non-
GAAP estimates every period.
Furthermore, where EFI was able to either meet or beat in 9 of the last 10 periods pertaining
to non-GAAP earnings, the firm has pathetically missed GAAP earnings estimates in 8 of the
last 10 periods, without beating GAAP estimates once. We at GHR do not believe this is a
coincidence. Again, where the company was able to beat non-GAAP figures by 2.7% every
period, the firm pitifully missed GAAP earnings by an average of 43.4% every quarter since
Q1 2014.
$0.00
$0.10
$0.20
$0.30
$0.40
$0.50
$0.60
Q 2 2 0 1 6
Q 1 2 0 1 6
Q 4 2 0 1 5
Q 3 2 0 1 5
Q 2 2 0 1 5
Q 1 2 0 1 5
Q 4 2 0 1 4
Q 3 2 0 1 4
Q 2 2 0 1 4
Q 1 2 0 1 4
3M GAAP to non-GAAP Difference
21 | P a g e
Amortization of Intangible Assets are a Real Cash Expense that Should be Accounted For
In EFI’s 10-Q filing, where the company describes its exclusions for non-GAAP earnings, the
one thing it does not do is describe the reasons why amortization of intangible assets are being
removed from non-GAAP earnings. The only thing the filings do state is “Intangible assets
required to date are being amortized on a straight-line basis.” Great.
Again why is the company excluding these material expenses from income? GHR has looked
at enough 10-Ks and Qs to understand the answer. Basically, management’s thinking is that
this is a “non-cash” expense for the period so that it “doesn’t count.” Also, another baseless
answer management would utter — if pressed on this — would be that “all our peers in the
industry do this as well.”
The mistake the bulls continue to make here is they add
back the amortization of companies like Valeant and
Endo and others who have bought drugs and not
developed them. And if Merck and Pfizer and others
were able to not count their R&D expense, right,
capitalize it, they too would look cheap. It’s just a simple
matter of accounting.
– notable short-seller Jim Chanos

22 | P a g e
So why doesn’t this explanation hold water? Well, amortization is without a doubt a cash
item, it just shifts when the cash is paid out. Specifically, if you refer back to the Cash Flow
Statement of EFI on Page 18, on the line item “Businesses Purchased, net of cash acquired”,
that is exactly where EFI pays out in CASH for those intangible assets. Does the company
remove that expense on the income statement at that time because it’s a cash item? No, but
GHR indicates that the company cannot have it both ways, (a) cry that something is a “non-
cash” item when it amortizes, and (b) state that doesn’t matter when you pay for the
acquisition in cash.
The ONLY way analysts could feel comfortable with a company that excludes its
amortization from non-GAAP earnings would be if the life of those intangible assets were
long-term or near indefinite. Is that the case here with EFI? Are they buying long-term
intangible assets (that consist of customer relationships, trade names, existing technology,
backlog and in-process R&D) that will hold their value over time?
As you can see from EFI’s own filings, they themselves believe ALL of their intangibles only
have an expected life of 3 to 6 years (and in the case of backlog, under one year)! GHR’s own
internal calculations estimated the average useful life of its intangibles a 3.3 years based on
the disclosed intangible assets and amortization expenses at Q2 2016. Because of this, we
here at GHR believe in no way shape or form these substantial expenses relative to earnings
should be excluded from adjusted earnings.
These are a very real form of expenses that should be accounted for by the company and not
just discarded by the sell-side community. From the chart below we can see how material
these expenses have become throughout the last five years. Looking at 12M amortization
expenses versus non-GAAP earnings, this metric currently stands at its five year high of
33.9%; 800 bps above the five year average of 25.9%. Frankly speaking, if no one cares about

23 | P a g e
these very real expenses that EFI is removing from earnings, it incentivizes management to
increase acquisitions as much as possible even at the detriment of the overall company.
Stock-Based Compensation Grows to their Highest Levels in 2015
Yes, we at GHR understand that everyone removes stock-based compensation (SBC) from
adjusted earnings. But, we would like to point out two issues with the company’s SBC that
makes it unique to this situation.
Where the firm’s SBC relative to non-GAAP earnings stayed relatively consistent at 35%
throughout 2011 through 2014, this ratio shot up to levels near 45% (see chart below). Why
do we believe this happened? Well as the reader will come to find out, Mr. Gecht and Mr.
Olin have certain non-GAAP operating figures that they need to hit in order to reach their
accelerator goals. Frankly speaking, how easy would it be for them for the firm to allocate
more salary to SBC instead of cash wage expenses to hit their goal? With everything else
going on at this firm, can we really not be skeptical of management’s intentions?
10.0%
15.0%
20.0%
25.0%
30.0%
35.0%
40.0%
TTM AMORTIZATION EXPENSE / NON-GAAP EARNINGS

24 | P a g e
Our second point, lies with EFI’s dilution of its shares (or lack thereof) with the continued
issuance of shares to employees. GHR was surprised to find out that throughout the last five
years EFI’s weighted shares outstanding stood relatively constant at 48 million shares. How
is this possible when the company is handing out SBC like crazy? Well, the Board of
Directors enacted a buy-back of its shares. Below is the exact excerpt from EFI’s 10-K filing:
Note 9: Common Stock Repurchase Programs
On November 6, 2013, the board of directors approved the repurchase of $200 million of outstanding
common stock. Under this publicly announced plan, we repurchased 1.5 and 1.8 million shares for an
aggregate purchase price of $65.7 and $76.8 million during the years ended December 31, 2015 and
2014, respectively.
On November 9, 2015, the board of directors cancelled $54.9 million remaining for repurchase under
the 2013 authorization and approved a new authorization to repurchase $150 million of outstanding
common stock commencing January 1, 2016. This authorization expires December 31, 2018.
Our employees have the option to surrender shares of common stock to satisfy their tax withholding
obligations that arise on the vesting of RSUs. In connection with stock option exercises, certain
employees can surrender shares to satisfy the exercise price of certain stock options and any tax
withholding obligations incurred in connection with such exercises. Employees surrendered 0.2 and
0.6 million shares for an aggregate purchase price of $10.7 and $24.3 million for the years ended
December 31, 2015 and 2014, respectively.
25.0%
30.0%
35.0%
40.0%
45.0%
50.0%
TTM SBC / NON-GAAP EARNINGS

25 | P a g e
These repurchased shares reduce shares outstanding and are recorded as treasury stock under the cost
method thereby reducing stockholders’ equity by the cost of the repurchased shares. Our buyback
program is limited by SEC regulations and is subject to compliance with our insider trading policy.
On November 6, 2013, as shown in our Consolidated Statement of Stockholders’ Equity, the board of
directors approved the retirement of 34.0 million shares of treasury stock. These retired shares are
now classified as authorized, but unissued, shares. The retired shares had a carrying value, at cost, of
$592.4 million. Under the cost method, the par value of formally retired treasury stock is deducted
from common stock, a pro rata share is deducted from additional paid-in capital, and any remaining
excess of cost over the par value and the pro rata share of additional paid-in capital is deducted from
retained earnings.
So while on one hand we applaud EFI for not diluting its shares though the repurchase
program. Overall, it has us scratching our head to a circular transaction where the company
is able to exclude partial wages from non-GAAP income through SBC and subsequently
perform buybacks to keep the weighted shares from being diluted.
Restructuring and Acquisition Expenses go back 32 Quarters and Counting
As detailed above, management clearly has no plans to cease any of its acquisition or
restructuring efforts in the near future. Based on the aforementioned Q&A answer pertaining
to future growth strategies answered by Mr. Gecht. Our explanation for analysts and
investors to ignore the exclusion from non-GAAP earnings is a simple one.
We understand 100%, management will never agree to stop excluding these costs from non-
GAAP earnings. However, as the astute investors our readers are, we can easily come to the
conclusion that both these restructuring and acquisition costs are not “one-offs” as
management would want you to believe. But rather, we need to look at the facts and ask
ourselves: Will either of these expenses cease in the near future? And that answer is a
resounding “no.” Based on history, the company has taken these charges in the past 32
periods; that is anything but “one-off” or non-recurring in nature.
On top of that, both these aggregated charges come out to a material amount of non-GAAP
earnings. And as the reader can see below, these charges are rising drastically ever since CFO
Marc Olin took over in 2014.

26 | P a g e
5.0%
6.0%
7.0%
8.0%
9.0%
10.0%
11.0%
12.0%
13.0%
14.0%
TTM RESTRUCTURING + ACQUISITION COSTS / NON-GAAP EARNINGS

27 | P a g e
Lack of Accounting Experience in Key Positions Leaves GHR Scratching our Heads
On December 22, 2014, EFI’s previous CFO, David Reeder (who possessed no accounting
experience that we know of) resigned in order to relocate closer to his family. Enter Marc
Olin, who previously served as the interim CFO of EFI for a brief period from September
2013 through January 2014, and curiously was serving as the firm’s COO as well. As the
reader will come to understand, GHR believes many of the accounting issues detailed below
stemmed throughout Marc Olin’s recent tenure as CFO of the company. First off, we
question the promoting of an executive to the CFO position with no apparent accounting
experience or training whatsoever in his life. Specifically, Mr. Olin received his Bachelors of
Science degree in Graphic Communications Management and Applied Mathematics from
Carnegie Mellon University. As the reader will observe going forward, the lack of qualified
experience in key positions appears to be a key theme for EFI’s working environment, which
rewards performance over experience.
Prior to Mr. Olin’s tenure at EFI, he served as CEO and co-founder of his firm Printcafe
Software (previous ticker: PCAF), a public company that EFI acquired in 2003 as a part of
its growth strategy (according to EFI’s 12/22/14 8-K). Unfortunately, the acquisition story of
Printcafe was not as neatly tied in a bow as the 8-K filing would have you believe.
At its peak, Printcafe tallied more than 4,000 clients in over 8,000 facilities worldwide,
including 24 of the 25 largest printing companies in North American and more than 50
Fortune 1000 firms. However, even with being one of the fastest-growing tech firms in the
country, Printcafe ended up as the second worst-performing IPO of 2002 with its stock
selling 90% to the downside (down to 91 cents at its low) of its IPO price of $10. So what
happened here? How did the company go from one of the hottest IPO stocks in 2002 to being
acquired for $2.60 in less than nine months?
Well, dating back to 2002, GHR found that a group of shareholders of Printcafe sued the
firm over claims that the company made misleading statements during the run-up to its
initial public offering in 2002. Specifically, under the leadership of CEO Marc Olin, investors
made a complaint that alleges Printcafe’s S-1 filing and prospectus for the IPO were “false
and misleading” because they failed to disclose several risk factors at the company.
Furthermore, the complaint charges that PCAF did not tell potential investors that its
performance was below internal expectations and that a restructuring effort to reverse that
trend was being planned.

28 | P a g e
Specifically located in PCAF’s S-1 filing on 02/13/2002, GHR points out the following
statement made under CEO Marc Olin’s leadership:
We expect to fund future operations and capital expenditures from revenue generated through the sale
of our products, public or private financings, and the net proceeds of this offering. We currently
anticipate that the net proceeds from this offering, together with our current cash, cash equivalents,
and cash from operations will be sufficient to meet our anticipated cash needs for working capital,
capital expenditures, and debt service, for at least the next 12 months.
This obviously was not the case for Printcafe as their debt overwhelmed the firm and weak
operating performance decimated the share price all under CEO Marc Olin’s leadership.
Finally, Printcafe ultimately accepted the $2.60 per share offer from Electronics for Imaging,
Inc., who also conveniently brought on Mr. Olin as a VP for the firm. Making his way
throughout the ranks at EFI, he now serves as the firm’s CFO, but if he could not
“anticipate cash needs” of his previous firm PCAF as CEO, how do investors expect him to
perform at the CFO level with no experience?
Short-Term Performance Incentives Drive Motivation to “Manage” Earnings:
Digging into the company’s proxy statements, EFI discloses its “Short-Term Incentive
Compensation” program, which we believe drives a high motivation to manage earnings
to the upside to hit targets.
Below is EFI’s annual incentive excerpt from its 2015 Proxy:
Annual incentive compensation program is based entirely on objective, financial criteria—
Our executive annual performance-based incentive compensation program is intended to encourage
our named executive officers to focus on specific short-term goals that are important to our success,
and which correlate to the long-term goals and strategy of the Company. Our executives’ annual
awards are determined based on objective, financial performance criteria. The performance measures
used to determine the payment of awards were Company-wide revenue (as determined under
generally accepted accounting principles, or “GAAP”) and non-GAAP operating income. These
measures were chosen because they align with our annual operating plan and encourage our
executives to make decisions that are in the best long-term interests of the Company and our
stockholders. The awards payable under our annual incentive compensation program are subject to a
maximum payout.
GHR vehemently disagrees with the Board of Directors’ assessment that its
compensation is based on “objective” financial criteria. In fact, as described in the

29 | P a g e
previous sections, “non-GAAP operating income” (through the use of faux non-GAAP
exclusions) and even revenue (through extension of credit terms that EFI management
admitted to) can be subjectively adjusted based on management’s discretion.
The firm also discloses in its 04/04/16 Proxy Statement its short-term bonus incentives for
CEO Guy Gecht and CFO Marc Olin that represent 105% and 70% of their base salary,
respectively.
Below are the 2015 and 2014 thresholds and targets for the base program and accelerator
for Mr. Gecht and Mr. Olin:
2015
2014
Taking a look at fiscal year 2014 first, the company disclosed annual revenue of $790.4
million. This number surpassed the RSU target and Accelerator Threshold of $779.0
million. We also find it convenient that management reported its “objective” non-GAAP
income of $115.2 million in 2014, surpassing both the RSU and even Accelerator targets
(by only $200K).
In 2015, the firm reported annual revenue and non-GAAP operating income of $882.5
million and $128.0 million, respectively. Here, management was able to hit both
thresholds of their base program, but only was able to surpass the revenue accelerator
threshold.
Again, while the compensation committee may believe that Mr. Gecht and Mr. Olin were
able to surpass these targets based on performance, GHR’s research shows accounting

30 | P a g e
gimmicks were used to reach these goals rather than operating performance. Based on our
accounting analysis described above, the reader should understand out how easy it is for
the top managers to financial engineer its earnings. The fact that the company offers such
short-term performance goals leads to the cutting of many corners and is counter-
intuitive to the long-term health of the firm based on our experience.
We also believe that the corporate culture of “hitting the numbers” at all costs does not
stop at management, but decays throughout the whole corporation from the top down.
As a matter a fact, GHR points out the CEO Guy Gecht’s near obsession with becoming a
$1 billion revenue company that dates back to a Barclays Global Technology Conference
given on 05/22/13:
We think a $1 billion company can generate a lot more profits. It can be a lot more
attractive to investors. We want to become a $1 billion plus company, and we do it
organically eventually, but we can accelerate with good acquisitions.
Again, at the Citi Global Technology Conference in September 2013, Mr. Gecht detailed
his plan:
We’d like to grow double-digit kind of low double-digit combination of organic and
inorganic. Again last quarter we delivered 10% growth almost entirely organic. We’re
very pleased with that guidance with double digit growth this quarter organic,
especially organic. So our goal is to continue to do whatever we can organically as
fine things move faster. We’d like to be a billion dollar in a few years company. With
scale we could generate a lot more profit when we grow. So even in that we
definitely like to continue this cycle.
Finally, Mr. Gecht put a timeframe on his $1 billion revenue target in the Q1 2014
earnings call:
So that's still largely intact, and that was kind of the base to the theory of -- that
mostly organically and with M&A, we can reach and bypass the $1 billion target in
2016. And you know, if I look at where Q1 is, and what I know about the fallback and
what we feel like now, I have to say that we feel even more confident about
achieving the targets than we felt back in October.
And yes, GHR admits that EFI is very close to its $1 billion revenue goal (TTM sales of
$965 million), but at what cost did this goal come with? As also detailed in this report, we

31 | P a g e
believe that most of the growth is in fact coming from acquisitions and not organically as
once hoped.
Furthermore, going against CEO Guy Gecht’s assertion than $1 billion in sales will lead
to increased profitability, the reality is far from his previous beliefs. To illustrate this, we
look at EFI’s reported GAAP earnings which have declined every year since his $1 billion
proclamation in 2013 (net income of $33.7 million, $33.5 million and $27.9 million in
2014, 2015 and TTM, respectively). Again, reference the profitability chart on Page 9 in
the non-GAAP section to see how exactly this $1 billion goal has affected profitability.
Also, how do employees feel about this goal being aggressively driven from the top? Well,
here are quotes detailing the corporate culture at EFI from Glassdoor.com (no relation):

32 | P a g e
As skeptic short-sellers, we understand to take these reviews of EFI with a grain of salt,
but we also invite our readers to research for themselves and believe us when we say we
did not post the surfeit of negative reviews due to time constraints.
Former Tyco Executive Richard Kashnow on the Auditing Board is a Reckless and Stupid Act
How could anyone believe that adding a former key executive at Tyco with no apparent
accounting or auditing experience to its auditing board would be a good idea? There is no
other way to describe what management of EFI was thinking besides being aggressively
reckless. Enter Richard Kashnow who, while appointed to EFI’s Board of Directors in 2008,
has been a “consultant” to the firm ever since the Tyco fiasco in 2003. Let us at GlassHouse
Research list everything wrong with hiring Mr. Kashnow and appointing him to the Board of
EFI:
Richard Kashnow as CEO of his previous firm Raychem, worked closely with the
former CEO of Tyco and now noted fraudster, Dennis Kozlowski throughout the
courting of his acquired business in 1999.
Mr. Kashnow was a key executive serving as President of Tyco Ventures right at
the same time that the highly acquisitive firm goes down for improper acquisition
accounting, undervaluing acquired assets, overvaulting acquired liabilities and
misusing accounting rules concerning the establishment and utilization of
33 | P a g e
purchase accounting reserves. And after all this, EFI, a highly acquisitive firm
itself, hires Mr. Kashnow as a “consultant” upon Tyco’s demise.
Mr. Kashnow, a man who has no CPA credentials, no accounting or auditing
training that we know of, no Big 4 experience, but rather has a PhD and BS in
Physics, is somehow appointed to the Auditing Board in 2008.
His name is literally “KASH NOW”3
Well, what about the rest of EFI’s Audit Board? They have all served as partners at Big 4
accounting firms, right? Unfortunately, this is not the case at EFI, with its other two Audit
Board members, Thomas Georgens (MBA from Babson College and BS in Computer Systems
Engineering) and Eric Brown (MBA from MIT Sloan School of Management and BS in
Chemistry) having no accounting or auditing experience whatsoever in their professional
resumes. Similar to Tyco, GHR finds it highly concerning that neither the CEO or CFO of
EFI, nor any of its Audit Board members, are CPA’s or even have accounting degrees.
Here is an excerpt from an article that detailed the Tyco fraud at the time:
It would have been possible for the board of directors to see the adjustments taking place in programs at Tyco. This would have been so if the board of directors had appropriate mindsets and activity. Tyco’s programs were a weakness in the organization. These programs provided benefits to officers and other employees. The financial programs were opportunities for Kozlowski’s illegal financial transactions and unethical business practices.
The board of directors should have examined these programs to evaluate their
appropriateness. The directors should have identified the programs’ weaknesses and
loopholes, which Kozlowski and other officers exploited for their own personal
benefit for years. Thus, the ineffectiveness of the board of directors in examining
Tyco’s programs enabled Kozlowski’s unethical business practices.4
Does this sound familiar to a particular company’s ineffective and complacent Board?
3 This is intended to be humorous in nature and not an actual reason for our list. 4 www.panmore.com/tyco-corporate-scandal-2002-case-analysis

34 | P a g e
Lack of Insider Buys Brings High Conviction to our Thesis
Going through EFI’s previous insider purchases/selling, we at GHR were astonished to find
that the last insider buying of EFI’s stock dated back to 07/28/10. Here, CEO Guy Gecht
only purchased a minuscule 15,000 shares for $158,313. This is over 6 years where no director
or officer at the firm has purchase shares once. We find the lack of insider buying of a CEO
deemed “attractive $1 billion company to investors” to be a harbinger for operational
weakness at the firm.
Moreover, when studying to firm’s material insider selling at the firm, we find that both the
CEO and CFO have made sales at opportune times as shown below. Specifically, within the
last two months, the CEO and CFO have combined to sell 43,523 shares with a market value
of $2,010,260. While management will no doubt rebut these sales as part of a structured
10b5-1 plan. We at GHR understand and have witnessed how easily these plans can be
altered and set to sell at the most opportune times for the directors/officers.

35 | P a g e
EFI’s Share Price is at Risk for Severe Deterioration Due to Misunderstood Premium Valuation
While the sell-side community continues to value EFI by the company’s given measure of
“adjusted earnings,” we at GHR believes the company’s true economic earnings can be better
estimated using sincerer metrics such as GAAP earnings and/or free-cash-flow, including
acquisitions. If analysts do not adjust for the obviously recurring and true expenses such as
amortization, stock-based compensation and restructuring/acquisition-related costs, it is almost
laughable that the market is valuing this company with a GAAP P/E multiple of over 80x.
Exacerbating the issue, the plethora of accounting irregularities detailed throughout this report
makes EFI’s current multiples appear to be even more outrageous. It is obvious to analysts
even covering this stock that EFI is not a high flying tech company with new technology to
revolutionize the industry. This is an industrial printing company that is betting on the
industry to switch to digital with software and digital-front-end offerings. Basing our valuation
on our sustainable forward EPS of $0.84, we believe a fair share-price for the firm stands
currently at $13.50, which represents a 71.0% downside to the share-price. This uses an industry
multiple of 16.1x as shown below.
TTM P/E NTM P/E
TSE:6448 (Brother) 12.03 12.58
TSE:7751 (Canon) 16.36 18.14
DOV 19.53 20.48
HPQ 6.03 9.95
KRNT 79.33 26.15
ORCL 18.08 14.14
Median 17.22 16.14
% Diff w/EFII 366.10% 10.53%
In light of our concerns regarding questionable key executives and corporate culture, lackluster
free-cash-flow generation, channel-stuffing concerns, bloated AR on the balance sheet and an
insufficient warranty reserve, GHR finds the current stock price to be highly egregious.
Furthermore, we see added risk regarding the company’s limited disclosure regarding
acquisitions including spring-loading concerns. Accordingly, we are initiating coverage on
Electronics for Imaging, Inc. (EFII) with a target price of $13.50.
36 | P a g e
Full Legal Disclaimer: As of the publication date of this report, GlassHouse, LLC and others that
contributed research to this report and others that we have shared our research with (collectively, the
“Authors”) have short positions in, and own put option positions on, the stock of Electronics for Imaging
(EFII), and stand to realize gains in the event that the price of the stock decreases. Following publication
of the report, the Authors may transact in the securities of the company covered herein. All content in
this report represent the opinions of GlassHouse. The Authors have obtained all information herein from
sources they believe to be accurate and reliable. However, such information is presented “as is,”
without warranty of any kind – whether express or implied. The Authors make no representation,
express or implied, as to the accuracy, timeliness, or completeness of any such information or with
regard to the results obtained from its use. All expressions of opinion are subject to change without
notice, and the Authors do not undertake to update or supplement this report or any information
contained herein. This document is for informational purposes only and it is not intended as an official
confirmation of any transaction. All market prices, data and other information are not warranted as to
completeness or accuracy and are subject to change without notice. The information included in this
document is based upon selected public market data and reflects prevailing conditions and the Authors’
views as of this date, all of which are accordingly subject to change.
This is not investment advice nor should it be construed as such. Use of GlassHouse LLC’s research is at
your own risk. You should do your own research and due diligence before making any investment
decision with respect to securities covered herein. Following publication of any report or letter, we
intend to continue transacting in the securities covered therein, and we may be long, short, or neutral at
any time hereafter regardless of our initial recommendation. This is not an offer to sell or a solicitation
of an offer to buy any security, nor shall any security be offered or sold to any person, in any jurisdiction
in which such offer would be unlawful under the securities laws of such jurisdiction. GlassHouse LLC is
not registered as an investment advisor. To the best of our knowledge, information and belief, as of the
date hereof, (a) all information contained herein is accurate and reliable and does not omit to state
material facts necessary to make the statements herein not misleading, and all information has been
obtained from public sources we believe to be accurate and reliable, and (b) who are not insiders or
connected persons of the stock covered herein or who may otherwise owe any fiduciary duty or duty of
confidentiality to the issuer, or to any other person or entity whose fiduciary duty was breached by the
transmission of information to GlassHouse LLC. However, GlassHouse LLC recognizes that there may be
non-public information in the possession EFII that has not been publicly disclosed by the company.
Therefore, such information contained herein is presented “as is,” without warranty of any kind –
whether express or implied. GlassHouse LLC makes no other representations, express or implied, as to
the accuracy, timeliness, or completeness of any such information or with regard to the results to be
obtained from its use.