electronic supplementary information (esi) for a ... · electronic supplementary information (esi)...
TRANSCRIPT

S1
Electronic Supplementary Information (ESI)
for
A colorimetric and near-infrared fluorescent probe for
biothiols and its application in living cells
Dehuan Yu, Qiong Zhang, ShuangShuang Ding and Guoqiang Feng*
Key Laboratory of Pesticide and Chemical Biology of Ministry of Education, College of Chemistry,
Central China Normal University,152 Luoyu Road, Wuhan 430079, P. R. China.
E-mail: [email protected]
Contents
1. Structure characterizations of compound 2 and probe 1…………….…Page S2-S5
2. Additional spectra………………………….……………………………….………….………Page S5-S11
Electronic Supplementary Material (ESI) for RSC Advances.This journal is © The Royal Society of Chemistry 2014

S2
1. Structure characterizations of compound 2 and probe 1
0.01.02.03.04.05.06.07.08.09.010.52.0
7.27.88.4
1H-NMR spectrum of compound 2 in d6-DMSO
13C-NMR spectrum of compound 2 in d6-DMSO
O
NC CN
OH2
O
NC CN
OH2

S3
MS (EI) spectrum of compound 2
4x10
0.25
0.5
0.75
1
1.25+ESI Scan (15.539 min) Frag=160.0V WorklistData8.d
313.0956
647.1601 921.9993
Counts vs. Mass-to-Charge (m/ z)100 150 200 250 300 350 400 450 500 550 600 650 700 750 800 850 900 950 1000 1050 1100 1150 1200 1250 1300 1350 1400
HR-MS spectrum of compound 2
0.01.02.03.04.05.06.07.08.09.010.52.0
6.16.46.77.07.37.67.9
1H-NMR spectrum of probe 1 in CDCl3
O
NC CN
OO
probe 1
O
NC CN
OH2Chemical Formula: C20H12N2O2
Molecular Weight: 312.32
CDCl3
H2O
O
NC CN
OH2
H+
(2 + H+): C20H13N2O2+
Exact Mass: 313.0972

S4
020406080100120140160180200220
0.0
63
.1
76
.77
7.0
77
.31
07
.01
15
.61
16
.71
18
.91
22
.41
27
.61
29
.11
32
.41
33
.21
37
.7
15
2.2
15
2.3
15
2.8
15
7.2
16
4.2
13C-NMR spectrum of probe 1 in d6-DMSO
MS (EI) spectrum of probe 1
O
NC CN
OO
probe 1
Chemical Formula: C23H14N2O3Molecular Weight: 366.37
O
NC CN
OO
probe 1
M+
(M - CH2=CHCO)+

S5
HR-MS spectrum of probe 1
2. Additional spectra
300 400 500 600 700 800
0.0
0.2
0.4
0.6
0.8
1.0
Ab
s
Wavelength(nm)
(a)
probe 1 (0-50 M)
0 10 20 30 40 50 60
0.0
0.2
0.4
0.6
0.8
1.0
[1] M)
Ab
s (
38
0 n
m)
Equation y = a + b*x
Weight No Weightin
Residual Sum of Squares
0.00251
Pearson's r 0.99835
Adj. R-Squar 0.99634
Value Standard Err
?$OP:A=1 Intercept 0.0231 0.00942
?$OP:A=1 Slope 0.0166 3.18421E-4
(b)
300 400 500 600 700 800
0.0
0.3
0.6
0.9
1.2
1.5
Ab
s
Wavelength(nm)
(c)Compound 2 (0-50 M)
0 10 20 30 40 50 60
0.0
0.3
0.6
0.9
1.2
1.5
[2] (M)
Ab
s (
56
0 n
m)
(d)
Equation y = a + b*x
Weight No Weighting
Residual Sum of Squares
3.35918E-4
Pearson's r 0.99992
Adj. R-Square 0.99983
Value Standard Error
?$OP:A=1 Intercept -0.00535 0.00345
?$OP:A=1 Slope 0.02795 1.16501E-4
600 650 700 750 800 850 9000
30
60
90
120
150
180(e)
Flu
ore
scen
t In
ten
sity
Wavelength(nm)
Compound 2 (0-50 M)
0 10 20 30 40 500
30
60
90
120
150
180(f)
[2] (M)
Inte
nsi
ty (
706
nm
)
Fig. S1 (a) Absorption spectra of probe 1 at different concentrations. (b) Absorbance intensity
changes at 380 nm of probe 1 as a function of its concentration from 0-50 M. (c) Absorption
O
NC CN
OO
probe 1
H+
(M + H+): C23H15N2O3+
Exact Mass: 367.10772
S6
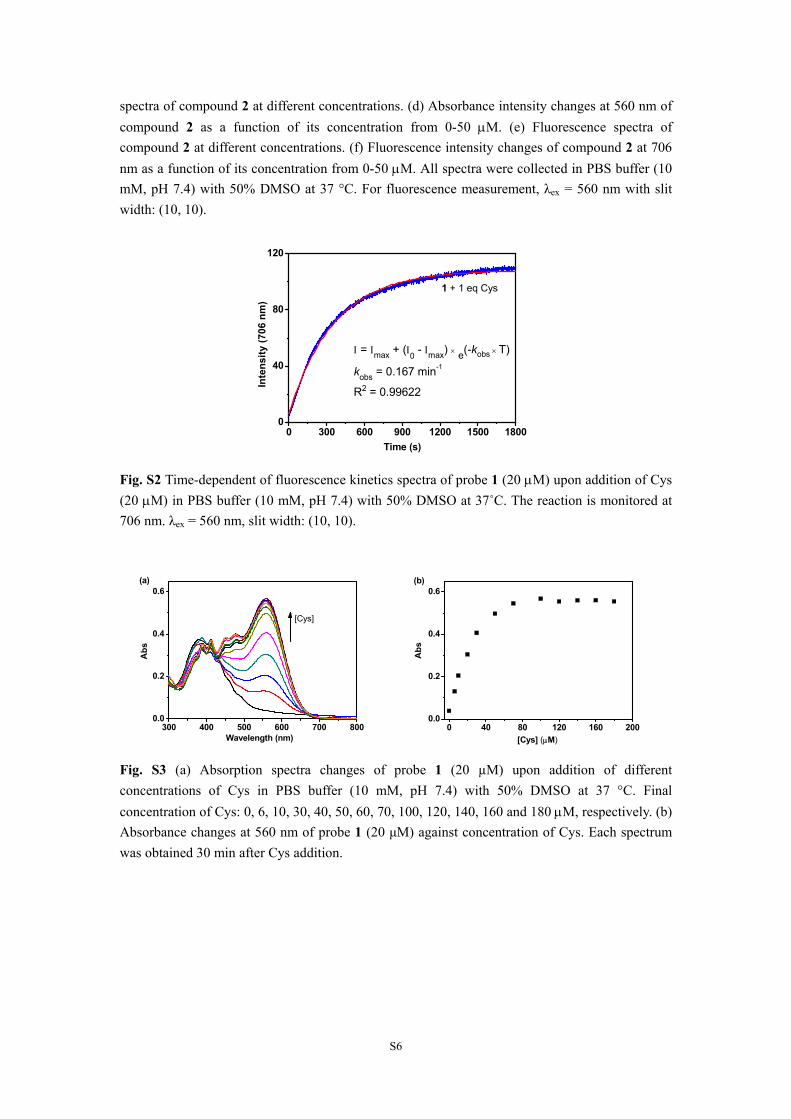
spectra of compound 2 at different concentrations. (d) Absorbance intensity changes at 560 nm of
compound 2 as a function of its concentration from 0-50 M. (e) Fluorescence spectra of
compound 2 at different concentrations. (f) Fluorescence intensity changes of compound 2 at 706
nm as a function of its concentration from 0-50 M. All spectra were collected in PBS buffer (10
mM, pH 7.4) with 50% DMSO at 37 °C. For fluorescence measurement, λex = 560 nm with slit
width: (10, 10).
0 300 600 900 1200 1500 18000
40
80
120
= max + (0 - max) e(-kobsT)
kobs = 0.167 min-1
R2 = 0.99622
Inte
nsi
ty (
706
nm
)
Time (s)
1 + 1 eq Cys
Fig. S2 Time-dependent of fluorescence kinetics spectra of probe 1 (20 M) upon addition of Cys
(20 M) in PBS buffer (10 mM, pH 7.4) with 50% DMSO at 37˚C. The reaction is monitored at
706 nm. λex = 560 nm, slit width: (10, 10).
300 400 500 600 700 8000.0
0.2
0.4
0.6
Ab
s
Wavelength (nm)
(a)
[Cys]
0 40 80 120 160 2000.0
0.2
0.4
0.6
[Cys] (M)
Ab
s
(b)
Fig. S3 (a) Absorption spectra changes of probe 1 (20 µM) upon addition of different
concentrations of Cys in PBS buffer (10 mM, pH 7.4) with 50% DMSO at 37 °C. Final
concentration of Cys: 0, 6, 10, 30, 40, 50, 60, 70, 100, 120, 140, 160 and 180 M, respectively. (b)
Absorbance changes at 560 nm of probe 1 (20 μM) against concentration of Cys. Each spectrum
was obtained 30 min after Cys addition.

S7
600 650 700 750 800 850 9000
40
80
120
160
Flu
ore
scen
t In
ten
sity
Wavelength (nm)
(a)
[Cys]
0 50 100 150 2000
40
80
120
160
[Cys] (M)
Inte
nsi
ty
(b)
Fig. S4 (a) Fluorescence spectra changes of probe 1 (20 µM) upon addition of different
concentrations of Cys in PBS buffer (10 mM, pH 7.4) with 50% DMSO at 37 °C. Final
concentration of Cys: 0, 2, 6, 10, 20, 40, 60, 80, 100, 120, 140, 160 and 180 M, respectively. (b)
Fluorescence intensity changes at 706 nm of probe 1 (20 μM) against concentration of Cys. Each
spectrum was obtained 30 min after Cys addition. λex = 560 nm, slit width: (10, 10).
5 6 7 8 9 100.0
0.2
0.4
0.6
0.8
1.0
Ab
s
pH
Cys
none
(a)
5 6 7 8 9 100
40
80
120
160
200
Flu
ore
scen
t In
ten
sity
pH
Cys
none
(b)
Fig. S5 (a) Absorbance responses of probe 1 (20 M) at 560 nm in the presence and absence of Cys (5
eq) under different pHs. (b) Fluorescence intensity responses of probe 1 (20 M) at 706 nm in the
presence and absence of Cys (5 eq) under different pHs. All experiment was performed in PBS buffer
(10 mM) with 50% DMSO at 37 °C and each data was obtained 30 min after addition of Cys. For
fluorescence measurements, λex = 560 nm, slit width: (10, 10).
Data for investigation of the sensing mechanism
This experiment was performed according to a reported procedure (see Ref: X. Yang, Y. Guo and
R. Strongin, Angew. Chem., Int. Ed., 2011, 50, 10690–10693). To a 100 mL flask, probe 1 (50 mg,
0.14 mmol) and Cys (21 mg, 1.25 eq) were combined in 30 mL of MeOH: H2O (90: 10, v/v)
solution, and the mixture stirred at room temperature for 1 h. Then, Et3N (30 μL) was added and
the solution stirred overnight. The solvents was removed under reduced pressure and the crude
S8
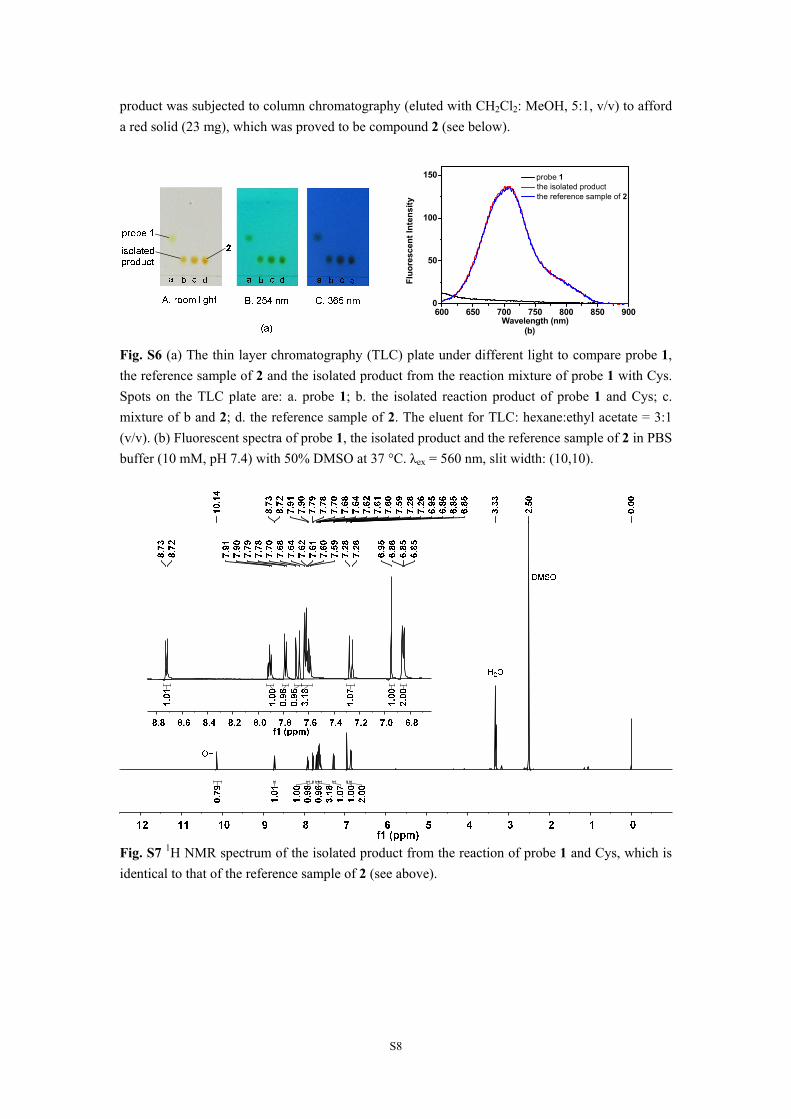
product was subjected to column chromatography (eluted with CH2Cl2: MeOH, 5:1, v/v) to afford
a red solid (23 mg), which was proved to be compound 2 (see below).
600 650 700 750 800 850 9000
50
100
150
Flu
ore
scen
t In
ten
sity
Wavelength (nm)
probe 1 the isolated product the reference sample of 2
(b)
Fig. S6 (a) The thin layer chromatography (TLC) plate under different light to compare probe 1,
the reference sample of 2 and the isolated product from the reaction mixture of probe 1 with Cys.
Spots on the TLC plate are: a. probe 1; b. the isolated reaction product of probe 1 and Cys; c.
mixture of b and 2; d. the reference sample of 2. The eluent for TLC: hexane:ethyl acetate = 3:1
(v/v). (b) Fluorescent spectra of probe 1, the isolated product and the reference sample of 2 in PBS
buffer (10 mM, pH 7.4) with 50% DMSO at 37 °C. λex = 560 nm, slit width: (10,10).
Fig. S7 1H NMR spectrum of the isolated product from the reaction of probe 1 and Cys, which is
identical to that of the reference sample of 2 (see above).

S9
YUDH010-1 #622 RT: 2.90 AV: 1 SB: 837 0.04-3.07 , 3.45-4.27 NL: 1.47E4T: + c Full ms [40.00-500.00]
50 100 150 200 250 300 350 400 450 500m/z
0
5
10
15
20
25
30
35
40
45
50
55
60
65
70
75
80
85
90
95
100
Rela
tive A
bundance
312.30
148.08
113.14 193.29 283.29233.07 330.1593.0563.12
Fig. S8 MS spectrum of the isolated product from the reaction of probe 1 and Cys, which showed
the expected mass of 2.
300 400 500 600 700 8000.0
0.2
0.4
0.6(a)
Cys
other anions
Ab
s
Wavelength(nm)
0.0
0.2
0.4
0.6
(b)
Ab
s (5
60 n
m)
OH
H2 O
2
ClO -
O2 -
S 2-
HS -
Cys
CN -
SO3 2-
SO4 2-
CO
3 2-
SC
N -
AcO -
NO
2 -
NO
3 -
S2 O
3 2-
I -Br -
Cl -
F -blank
Fig. S9 (a) Absorption spectral responses of probe 1 (20 μM) upon addition of 100 μM various
anions and Cys. Anions are F−, Cl−, Br−, I−, NO3−, NO2
−, AcO−, SCN−, CO32−, SO4
2−, SO32−,
S2O32−, HS−, S2−, CN−, O2•
−, ClO−, H2O2 and OH•. (b) A comparison of absorbance intensity
changes of probe 1 (20 μM) at 560 nm upon addition of 100 μM various anions and Cys. All
experiment was performed in PBS buffer (10 mM, pH 7.4) with 50% DMSO at 37 °C and each
spectrum was obtained 30 min after addition of various anions.
600 650 700 750 800 850 9000
40
80
120
160(a)
Cys
other anions
F
luo
resc
ent
Inte
nsi
ty
Wavelength(nm)
0
40
80
120
160(b)
Inte
nsi
ty (
706
nm
)
OH
H2 O
2
ClO -
O2 -
S 2-
HS -
Cys
CN -
SO3 2-
SO4 2-
CO
3 2-
SCN -
AcO -
NO
2 -
NO
3 -
S2 O
3 2-
I -Br -
Cl -
F -blank
Fig. S10 (a) Fluorescent spectral responses of probe 1 (20 μM) upon addition of 100 μM various
anions and Cys. Anions are F−, Cl−, Br−, I−, NO3−, NO2
−, AcO−, SCN−, CO32−, SO4
2−, SO32−,
O
NC CN
OH2Chemical Formula: C20H12N2O2
Molecular Weight: 312.32

S10
S2O32−, HS−, S2−, CN−, O2•
−, ClO−, H2O2 and OH•. (b) A comparison of fluorescence intensity
changes of probe 1 (20 μM) at 706 nm upon addition of 100 μM various anions and Cys. All
experiment was performed in PBS buffer (10 mM, pH 7.4) with 50% DMSO at 37 °C and each
spectrum was obtained 30 min after addition of various anions. λex = 560 nm , slit width: (10, 10).
300 400 500 600 700 8000.0
0.2
0.4
0.6
Ab
s
Wavelength (nm)
0-30 min
Cys
(a)
300 400 500 600 700 8000.0
0.2
0.4
0.6
0-30 min
Ab
s
Wavelength (nm)
Hcy
(b)
300 400 500 600 700 8000.0
0.2
0.4
0.6
0-30 min
Ab
s
Wavelength (nm)
(c)
GSH
0 5 10 15 20 25 300.0
0.2
0.4
0.6
A
bs
at 5
60
nm
Time (min)
Cys
Hcy
GSH
none
(d)
Fig. S11 (a)-(c): Scanning kinetics of the UV-vis spectra changes of probe 1 (20 µM) against time
in the presence of 5 equiv of Cys (a), Hcy (b) and GSH (c), respectively. All spectra were
measured in PBS buffer (10 mM, pH 7.4) with 50% DMSO at 37 °C. (d) The corresponding
absorbance changes of probe 1 at 560 nm against time for Cys, Hcy and GSH.
0 300 600 900 1200 1500 18000
40
80
120
160
Inte
nsi
ty (
706
nm
)
Time (s)
Cys
Hcy
GSH
none
Fig. S12 Fluorescence kinetics of probe 1 (20 µM) at 706 nm in the absence and presence of
biothiols (Cys, Hcy and GSH, 100 µM each). All spectra were measured in PBS buffer (10 mM,
pH 7.4) with 50% DMSO at 37 °C. λex= 560 nm, slit width (10,10).

S11
Generation of reactive oxygen species (ROS)
ClO−
The NaOCl solution was added to the probe 1 testing solution at 25 °C.
H2O2
H2O2 was added and the mixtures were stirred for 1 hour at 25 °C.
OH•
Hydroxyl radicals were generated by the addition of Fe2+ and H2O2 at room temperature in PBS
buffer (pH 7.4) and the mixture was then stirred for 30 min. (Ref. Y. Zhou, J.-Y. Li, K.-H. Chu, K.
Liu, C. Yao, J.-Y. Li, Chem Commun. 2012, 48, 4677–4679.)
O2•−
O2•− was generated by an improved pyrogallol autoxidation method reported recently (Ref. X. Li,
J. Agric. Food Chem., 2012, 60, 6418−6424).