electronic supplementary data to accompany 2,2' … · sarti,b josé m. junquera-hernández,b...
TRANSCRIPT

Electronic supplementary data to accompany
Luminescent Cu(I) complexes with bisphosphane and halogen-substituted 2,2'-bipyridine ligands
Sarah Keller,a Alessandro Prescimone,a Henk Bolink,b Michele Sessolo,b Giulia Longo,b Laura Martínez-Sarti,b José M. Junquera-Hernández,b Edwin C. Constable,a Enrique Ortí*b and Catherine E. Housecroft*a
aDepartment of Chemistry, University of Basel, BPR 1096, Mattenstrasse 24a, CH-4058 Basel, Switzerland; email: [email protected] de Ciencia Molecular, Universidad de Valencia, 46980 Paterna (Valencia), Spain; email: [email protected]
Fig. S1 Structure of the [Cu(POP)(6,6'-Cl2bpy)]+ cation in [Cu(POP)(6,6'-Cl2bpy)][PF6]. The POP ligand is disordered over two sites (50:50 occupancies) and only one site is shown; four disordered aromatic rings were refined as rigid bodies. Ellipsoids plotted at 50% probability level, H atoms omitted.
1
Electronic Supplementary Material (ESI) for Dalton Transactions.This journal is © The Royal Society of Chemistry 2018

Fig. S2 Structure of the [Cu(xantphos)(6,6'-Cl2bpy)]+ cation in [Cu(xantphos)(6,6'-Cl2bpy)][PF6]∙CH2Cl2. The xantphos ligand is disordered over two sites (50:50 occupancies). Ellipsoids plotted at 50% probability level, H atoms omitted.
Fig. S3 Structure of the [Cu(POP)(6-Brbpy)]+ cation in [Cu(POP)(6-Brbpy)][PF6] under increasing pressure (0.16 to 4.5 GPa). Colour change from violet to light blue with increasing pressure. H atoms omitted, and ellipsoids are plotted at 50% probability level except for the highest pressure (4.5 GPa) structure which was refined anisotropically. The Cu–N and Cu–P bond distances decrease slightly as the pressure increases; e.g. Cu1–P1 changes from 2.250(6) Å at 0.16 GPa to 2.170(3) Å at 4.5 GPa, and Cu1–N2 from 2.110(14) to 2.017(4) Å, and the angle between the planes of the CuP2 and CuN2 units decreases from 83.63° to 86.09°.
2

Table S1 Experimental details for ambient and high pressure single crystal X-ray diffraction measurements
performed on [Cu(POP)(6-Brbpy)][PF6].
For all the structures: C46H35BrCuF6N2OP3, Mr = 982.16, monoclinic, P21/c, Z = 4.
P0
CCDC code 1535141 1584757 1584754 1584752
Crystal data
Temperature (K) 123 293 293 293
Pressure (GPa) ambient 0.16 1.30 1.80
a, b, c (Å)15.3402 (6), 14.2344 (5), 19.2659 (7)
15.459 (10), 14.2430 (12), 19.413 (8)
15.123 (8), 13.6502 (10), 18.868 (7)
14.960 (8), 13.2757 (8), 18.724 (6)
β (°) 90.9159 (12) 90.03 (6) 91.32 (5) 92.23 (5)
V (Å3) 4206.34 (15) 4274 (3) 3894 (2) 3716 (2)
Dx (Mg m‒3) 1.551 1.526 1.675 1.755
Radiation type Cu Ka Synchrotron, l = 0.48590 Å
Synchrotron, l = 0.48590 Å
Synchrotron, l = 0.48590 Å
m (mm‒1) 3.49 1.62 1.78 1.87
Crystal size (mm) 0.12 × 0.10 × 0.08 0.04 × 0.02 × 0.02 0.04 × 0.02 × 0.02 0.04 × 0.02 × 0.02
Data collection
Diffractometer Bruker Kappa Apex2 Pilatus 300K Pilatus 300K Pilatus 300K
Radiation source Cu KaDiamond Light Source Beamline I19
Diamond Light Source Beamline I19
Diamond Light Source Beamline I19
Monochromator Graphite Double crystal Silicon 111
Double crystal Silicon 111
Double crystal Silicon 111
Absorption correction
Multi-scan SADABS (Siemens, 1996)
Multi-scan CrysAlis PRO 1.171.38.41 (Rigaku Oxford Diffraction, 2015) Empirical absorption correction using spherical harmonics, implemented in
Multi-scan CrysAlis PRO 1.171.38.41 (Rigaku Oxford Diffraction, 2015) Empirical absorption correction using spherical harmonics, implemented in
Multi-scan CrysAlis PRO 1.171.38.41 (Rigaku Oxford Diffraction, 2015) Empirical absorption correction using spherical harmonics, implemented in
3

SCALE3 ABSPACK scaling algorithm.
SCALE3 ABSPACK scaling algorithm.
SCALE3 ABSPACK scaling algorithm.
Tmin, Tmax 0.65, 0.76 0.033, 1.000 0.079, 1.000 0.074, 1.000
No. of measured, independent and observed [I > 2.0σ (I)] reflections
35307, 7329, 7293 26697, 6179, 2242 24175, 5560, 2847 22897, 5151, 2851
Rint 0.022 0.157 0.119 0.115
(sin θ/λ)max (Å‒1) 0.595 0.799 0.797 0.797
Refinement
R[F2 > 2σ (F2)], wR(F2), S
0.028, 0.067, 0.89
0.095, 0.364, 1.08
0.071, 0.238, 1.01
0.067, 0.102, 1.13
No. of reflections 7329 6128 5534 5126
No. of parameters 541 541 445 445
No. of restraints 0 584 584 598
H-atom treatmentH-atom parameters constrained
H-atom parameters constrained
H-atom parameters not refined
H-atom parameters not refined
max, min (e Å‒3) 0.88, ‒0.39 1.19, ‒1.46 0.73, ‒0.72 0.74, ‒0.96
CCDC code 1584753 1584755 1584756
Crystal data
Temperature (K) 293 293 293
Pressure (GPa) 3.50 4.20 4.50
a, b, c (Å) 14.765 (8), 12.9897 (9), 18.629 (6)
14.652 (7), 12.7677 (9), 18.624 (6)
14.622 (6), 12.6860 (8), 18.613 (6)
β (°) 92.14 (5) 91.96 (5) 92.10 (4)
V (Å3) 3570 (2) 3482 (2) 3450.3 (19)
Dx (Mg m‒3) 1.827 1.873 1.891
Radiation type Synchrotron, l = 0.48590 Å
Synchrotron, l = 0.48590 Å
Synchrotron, l = 0.48590 Å
m (mm‒1) 1.94 1.99 2.01
Crystal size (mm) 0.04 × 0.02 × 0.02 0.04 × 0.02 × 0.02 0.04 × 0.02 × 0.02
4

Data collection
Diffractometer Pilatus 300K Pilatus 300K Pilatus 300K
Radiation source Diamond Light Source Beamline I19
Diamond Light Source Beamline I19
Diamond Light Source Beamline I19
Monochromator Double crystal Silicon 111
Double crystal Silicon 111
Double crystal Silicon 111
Absorption correction
Multi-scan CrysAlis PRO 1.171.38.41 (Rigaku Oxford Diffraction, 2015) Empirical absorption correction using spherical harmonics, implemented in SCALE3 ABSPACK scaling algorithm.
Multi-scan CrysAlis PRO 1.171.38.41 (Rigaku Oxford Diffraction, 2015) Empirical absorption correction using spherical harmonics, implemented in SCALE3 ABSPACK scaling algorithm.
Multi-scan CrysAlis PRO 1.171.38.41 (Rigaku Oxford Diffraction, 2015) Empirical absorption correction using spherical harmonics, implemented in SCALE3 ABSPACK scaling algorithm.
Tmin, Tmax 0.3168, 1.000 0.169, 1.000 0.225, 1.000
No. of measured, independent and observed [I > 2.0 (I)] reflections
22406, 4883, 2802 19321, 4281, 2817 20918, 4800, 3064
Rint 0.106 0.094 0.103
(sin /)max (Å‒1) 0.797 0.795 0.796
Refinement
R[F2 > 2 (F2)], wR(F2), S 0.066, 0.092, 1.15 0.059, 0.088, 1.10 0.063, 0.097, 1.11
No. of reflections 4859 4276 4784
No. of parameters 445 445 415
No. of restraints 613 613 542
H-atom treatment H-atom parameters not refined
H-atom parameters not refined
H-atom parameters not refined
max, min (e Å‒3) 0.88, ‒1.00 0.77, ‒0.72 0.97, ‒0.84
Computer programs: Apex2 (Bruker AXS, 2006), CrysAlis PRO 1.171.38.41k (Rigaku OD, 2015), SUPERFLIP
(Palatinus & Chapuis, 2007), CRYSTALS (P. W. Betteridge, J. R. Carruthers, R. I. Cooper, K. Prout and D. J. Watkin,
J. Appl. Cryst., 2003, 36, 1487), CAMERON (D. J. Watkin, C. K. Prout & L. J. Pearce. Oxford, UK, 1996).
5

6

Table S2 Selected structural parameters calculated at the B3LYP-D3/(def2svp + def2tzvp) level in CH2Cl2 solution for the [Cu(P^P)(N^N)]+ complexes in their electronic ground state S0 and in their first triplet excited state T1.
a, b Two different conformations were optimized for the [Cu(xantphos)(6-Brbpy)]+ complex that mainly differ in the orientation of the phenyl rings of the xantphos ligand (Fig. S3). The structure labeled with “a“ is more similar to the reported X-Ray structure and is depicted in Fig. S3a, whereas the structure labeled with “b” corresponds to that displayed in Fig. S3b and appears at slightly lower energies. See the main text for details.
7
Complex cation
Cu–P distance / Å
(Cu1–P1; Cu1–P2)
Cu–N distance / Å
(Cu1–N1; Cu1–N2)
P–Cu–P chelating
angle / deg
N–Cu–N chelating
angle / deg
Angle between P–Cu–P and N–Cu–N planes /
deg
N–C–C–N torsion angle /deg
Ground State (S0)
[Cu(POP)(bpy)]+ 2.246; 2.284 2.096; 2.069 113.84 80.09 80.37 14.29[Cu(xantphos)(bpy)]+ 2.269; 2.270 2.104; 2.068 114.40 79.75 86.94 3.23[Cu(POP)(6,6'-Cl2bpy)]+ 2.273; 2.291 2.160; 2.135 113.45 78.17 77.32 21.35[Cu(xantphos)(6,6'-Cl2bpy)]+
2.271; 2.305 2.141; 2.145 119.27 77.38 86.72 6.76
[Cu(POP)(6-Brbpy)]+ 2.259; 2.288 2.110; 2.107 114.88 79.19 79.32 15.50[Cu(xantphos)(6-Brbpy)]+ a 2.280; 2.282 2.123; 2.096 113.74 78.71 87.38 3.30[Cu(xantphos)(6-Brbpy)]+ b 2.249; 2.299 2.112; 2.104 119.25 78.26 87.62 7.60[Cu(POP)(6,6'-Br2bpy)]+ 2.308; 2.281 2.153; 2.152 113.04 77.25 81.45 5.92[Cu(xantphos)(6,6'-Br2bpy)]+
2.308; 2.282 2.160; 2.159 120.14 77.18 86.44 8.21
Triplet Excited State (T1)
[Cu(POP)(bpy)]+ 2.365; 2.334 1.982; 1.981 102.90 83.46 59.69 2.83[Cu(xantphos)(bpy)]+ 2.350; 2.399 1.997; 1.981 105.92 83.06 57.53 1.99[Cu(POP)(6,6'-Cl2bpy)]+ 2.359; 2.330 2.068; 1.985 104.84 82.11 69.97 2.38[Cu(xantphos)(6,6'-Cl2bpy)]+
2.360; 2.336 2.095; 1.989 105.69 81.40 77.17 5.42
[Cu(POP)(6-Brbpy)]+ 2.407; 2.341 2.000; 1.979 106.06 83.31 68.25 2.89[Cu(xantphos)(6-Brbpy)]+ 2.384; 2.335 2.007; 1.973 106.76 82.58 67.93 3.24[Cu(POP)(6,6'-Br2bpy)]+ 2.381; 2.334 2.112; 1.982 104.69 81.50 73.21 5.38[Cu(xantphos)(6,6'-Br2bpy)]+
2.370; 2.351 2.123; 1.994 105.43 81.18 78.88 7.20

Fig. S4 Minimum-energy conformations calculated at the B3LYP-D3/(def2svp + def2tzvp) level in CH2Cl2 solution for [Cu(xantphos)(6-Brbpy)]+. The conformation on the left (a) reproduces closely the X-ray structure reported for this complex. The conformation on the right (b) features a slightly lower energy. Hydrogen atoms are omitted for simplicity.
Fig. S5 Zoom into the low-energy MLCT region of the solution absorption spectra of the [Cu(P^P)(bpy)][PF6] complexes (CH2Cl2, 2.5 × 10⁻⁵ mol dm−3).
8

Table S3 Vertical excitation energies (E) calculated at the TD-DFT B3LYP/(def2svp+def2tzvp) level for the lowest singlet (S1) and triplet (T1) excited states of complexes [Cu(P^P)(N^N)]+ in CH2Cl2 solution. S0→S1 oscillator strengths (f) are given within parentheses. The energy of the T1 state at its fully optimized TD-DFT geometry is given in the last column.
Complex cation S1 T1 T1 (relaxed)
E (eV/nm) (f) E (eV) E (eV)
[Cu(POP)(bpy)]+ 2.800 / 443 (0.08) 2.544 1.220
[Cu(xantphos)(bpy)]+ 2.816 / 440 (0.10) 2.569 1.254
[Cu(POP)(6,6'-Cl2bpy)]+ 2.618 / 474 (0.06) 2.407 1.423
[Cu(xantphos)(6,6'-Cl2bpy)]+ 2.652 / 467 (0.07) 2.418 1.427
[Cu(POP)(6-Brbpy)]+ 2.724 / 455 (0.06) 2.486 1.410
[Cu(xantphos)(6-Brbpy)]+ 2.730 / 454 (0.07) 2.495 1.423
[Cu(POP)(6,6'-Br2bpy)]+ 2.521 / 492 (0.04) 2.355 1.435
[Cu(xantphos)(6,6'-Br2bpy)]+ 2.668 / 465 (0.06) 2.447 1.440
Fig. S6 TD-DFT simulations of the absorption spectra calculated at the B3LYP/(6-31G**+LANL2DZ) level of theory in CH2Cl2 for [Cu(POP)(6,6'-Cl2bpy)]+ and [Cu(xantphos)(6,6'-Cl2bpy)]+. The spectra were generated by convoluting each electronic transition with a Gaussian function of full-width-at-half-maximum FWHM = 30 nm.
9
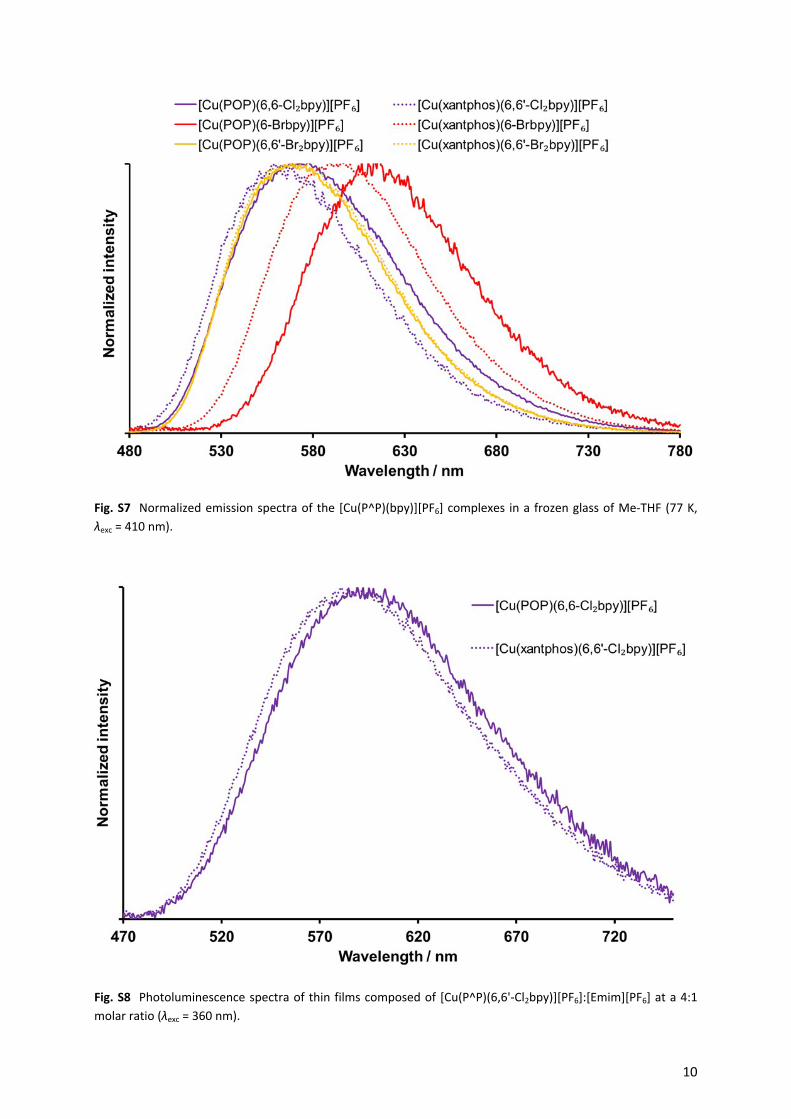
Fig. S7 Normalized emission spectra of the [Cu(P^P)(bpy)][PF6] complexes in a frozen glass of Me-THF (77 K, λexc = 410 nm).
Fig. S8 Photoluminescence spectra of thin films composed of [Cu(P^P)(6,6'-Cl2bpy)][PF6]:[Emim][PF6] at a 4:1 molar ratio (λexc = 360 nm).
10

Fig. S9 Average voltage versus time characteristics measured for ITO/PEDOT:PSS/[Cu(P^P)(N^N)][PF6]:[Emim][PF6] 4:1/Al LECs operated at pulsed current (average density current 50 A m−2, 1 kHz, 50% duty cycle, block wave).
Fig. S10 Average Voltage versus time characteristics measured for ITO/PEDOT:PSS/[Cu(P^P)^N^N)][PF6]:[Emim][PF6] 4:1/Al LECs operated at pulsed current (average density current 100 A m−2, 1 kHz, 50% duty cycle, block wave).
11