electronic state dependence in dissociation of core
TRANSCRIPT

Electronic state dependence indissociation of core-excited water
Christian Stråhlman
June 1, 2011
Degree project (Master of Science), 30 hp
Supervisor: Anna Sankari
Division of Synchrotron Radiation ResearchDepartment of Physics

AbstractWater (H2O) is the most studied molecule in the history of science. Yet many thingsremain unknown about its nuclear motion and decay. In recent years some studieshave been made on the behavior of core-excited water molecules and its subsequentAuger decay and dissociation. Particular attention has been drawn to the ultra-fastdissociation channel H2O∗→H+O∗H, which occurs on a femtosecond time-scalein the H2O∗(O1s−14a1
1) core-excited state.This study concerns the outcome of an electron energy resolved electron–ion co-
incidence (PEPICO) measurement on core-excited H2O. The experiments were car-ried out at the I411 beamline at the MAX II synchrotron in Lund. A setup consistingof a time-of-flight ion spectrometer and an electron energy analyser was used to mea-sure the energy of Auger electrons in coincidence with the resulting ion fragmentsfrom the decay. Although this method implies intriguing features, issues concerningfalse coincidences and detector resolution leave room for improvement. The reportdiscusses possible improvements of the experimental method and data analysis.
We verify that ultra-fast dissociation channels exist, and we are able to directly ob-serve the associated Auger decay O∗H→OH++e− in coincidence with the OH+ionicfragments. In the same Auger electron energy region we study the spectator Augerdecay to anti-bonding H2O+ electronic states. We find a state-specific effect wherethe intermediate state H2O∗(O1s−12b1
2) has a strong preference for decay to statesdissociating to OH + H+, whereas H2O∗(O1s−14a1
1) predominantly dissociates toOH+ +H.
1

AcknowledgmentsTo write a master thesis is a process. It starts in a stable ground state where you areconfident in your present knowledge and skills; transforms to an intermediate excitedstate governed by great confusion and chaos; and ends in a final state of even greaterknowledge and understanding. I am very grateful to those who have contributed tothis project and this report, in all of its states, both practically and spiritually.
First and foremost I wish to sincerely thank my supervisor Anna Sankari. Yourinterest in my project, your firm and clear guidance and your willingness to discussboth scientific and practical matters regularly has been absolutely essential to thefinalization of this report. Especially I thank you for contributing with the computercalculations presented in this report.
I would like to express my gratitude to all the other members of my researchgroup; Stacey Sorensen, Matheiu Gisselbrecht, Joakim Laksman and Erik Månsson,for your support in this project, for a good scientific discussion and for letting meparticipate in your experiments and in daily work of the group.
I am grateful to Anna Sankari, Joakim Laksman, Stacey Sorensen, Rami Sankari(MAX-lab), Leena Partanen and Antti Kettunen (both from University of Oulu) whoperformed the experiments presented in this report. A special thanks to Edwin Kukk(Universty of Turku) who introduced me to the experimental setup and providedthe data analysis tools needed for PEPICO, and to Rami Sankari who has providedadditional information about the spectrometer resolution.
My thanks to the staff and diploma workers at the Division for SynchrotronRadiation Research who have been the best of colleagues and have created a creativeatmosphere at the Division.
Finally, thanks to those who gave me a helping hand reading and proof-readingthis report, especially Sara Andersson. Also I would like to mention my friends atthe Lund Social Sciences Student Union and the Student Union for Humanities andTheology who gave of their time to discuss physics with me. Your contributions tothe popular summary were very helpful.
2

Contents1 Introduction 4
2 Theory 52.1 The molecule . . . . . . . . . . . . . . . . . . . . . . . . . . . . . . . . . . . . . 5
2.1.1 The quantum description of molecules . . . . . . . . . . . . . . . . 52.1.2 Symmetry . . . . . . . . . . . . . . . . . . . . . . . . . . . . . . . . . . 72.1.3 Construction of molecular orbitals . . . . . . . . . . . . . . . . . . 9
2.2 Decay and dissociation . . . . . . . . . . . . . . . . . . . . . . . . . . . . . . . 122.2.1 Interaction of light with the molecule . . . . . . . . . . . . . . . . 122.2.2 The Franck–Condon principle . . . . . . . . . . . . . . . . . . . . . 132.2.3 Auger decay . . . . . . . . . . . . . . . . . . . . . . . . . . . . . . . . . 132.2.4 Fragmentation patterns for the core-excited water molecule . . 15
3 Methods 18
4 Results and Analysis 234.1 Evaluation of PEPICO maps . . . . . . . . . . . . . . . . . . . . . . . . . . . 234.2 Calculation of potential curves . . . . . . . . . . . . . . . . . . . . . . . . . . 27
5 Discussion 305.1 Observations . . . . . . . . . . . . . . . . . . . . . . . . . . . . . . . . . . . . . 305.2 Enhancement of experiment and analysis . . . . . . . . . . . . . . . . . . . 31
A Appendix: Symmetry effects in photon induced core-excitations 33
B Appendix: An outlook on synchrotron light and the beamline technicaldetails 34B.1 Synchrotron light . . . . . . . . . . . . . . . . . . . . . . . . . . . . . . . . . . 34B.2 The I411 beamline at MAX-lab . . . . . . . . . . . . . . . . . . . . . . . . . . 36
C Appendix: An outlook on the PEPICO spectrometer technical details 37
D Populärvetenskaplig sammanfattning (in Swedish) 41
3

1 IntroductionWater is perhaps the most studied substance in the history of science. Its importancefor life on Earth cannot be over–emphasized. All chemical processes important forlife take place in aqueous solution. The importance of water was stressed alreadyby the ancient Greek natural philosophers. Starting with Empedocles (492-432 BC.)water was suggested to be one of the four fundamental elements in nature [1]. Thetheory of the four elements was the standard dogma for nearly two thousand years.During the 19th century it became evident that water was a substance made up bysmall molecules consisting of even smaller atoms. The discovery of quantum me-chanics in the early 20th century provided a theory which could explain molecularbonding and the interaction between molecules. To this day molecular physicistsand physical chemists are exploring what quantum mechanics can tell us about thestructure of all matter around us.
The interaction between light and the H2O molecule is of particular interest. Ithas been suggested that bio-molecules on Earth might have originated from photo-induced chemical reactions in water solution. Besides these obvious biological im-plications we know that interactions of light with molecules in the atmosphere hasgreat significance, and gives rise to both the ozone layer and the greenhouse effect. Ithas been suggested that photo–induced reactions with water might be a future sourceof hydrogen gas [2]. For these reasons it is of great interest to study the dissociationprocesses in water.
This report describes and discusses a study on a special case of fragmentation,namely dissociation of the H2O molecule after irradiation by X-rays with specificenergies. This approach allows us to study the behavior of the molecule when it is incertain electronic states. Energetic X-rays induce an energy surplus to the molecule,known as a core–hole state. Methods to evaluate the structure and dynamics of suchstates have been developed during the last two decades, especially connected to therapid development of synchrotron radiation instrumentation [3]. Studies of nuclearmotion and dissociation patterns in core–excited small molecules have been plentiful.Also studies of gas-phase water (vapour) have been published. Of particular interesthas been extremely rapid dissociation channels where fragmentation of the moleculetakes place within a few femtoseconds, the same time-scale as molecular vibrations.Also, how vibrational motion in core–excited molecules affects the final states hasgained interest [3]. These studies provide us with increasing knowledge of the exoticintermediate core–excited state, and give us growing insight to the very nature of thechemical bonds that keeps our world together.
The purpose of this study is, in particular, to investigate how excitation to differ-ent core–excited states affects the outcome of the de-excitation. We wish to clarify theprobable and possible decay channels of the water molecule. This will be done by ap-plying an electron–ion coincidence mechanism where we combine a measurement ofthe energy of emitted electrons, with a count of the resulting ionic fragments. Ourhopes are that these methods combined are more powerful than they would be bythemselves.
4

2 Theory
2.1 The moleculeA molecule is held together by molecular bonds which can be described by electronicwave functions. For a stable molecular bond it is necessary that it is energeticallyfavorable for two atoms to be close to each other. To understand why moleculesbreak their bonds and dissociate one must explore the nature of these bonds and whythey are formed.
2.1.1 The quantum description of molecules
If one wishes to gain a complete understanding of a molecule, one would have tosolve the time-independent electronic Schrödinger equation,
HeΦ(r) = EΦ(r), (1)
with the electronic HamiltonianHe taking into account the movement of n electronsin the electric field created by N nuclei and the interaction of all the electrons andnuclei with each other. Such a Hamiltonian has the form (in atomic units1)
He =n∑
i=1
−∇2i
2+
n∑
i
N∑
A
−ZA
riA+
n∑
i
n∑
j>i
1
ri j+
N∑
a
N∑
B>A
ZAZB
RAB. (2)
Solving the time-independent Schrödinger equation analytically is impossible for eachmolecule with more than three constituent particles2. A molecule has both a com-plicated electric field created by the nuclei, and many intrinsic degrees of freedomsince the nuclei can move in respect to each other. From a mechanical perspectivethe fundamental addition of complexity arises from the possibility for the moleculeto change its intrinsic framework due to nuclear motion. In a stable molecule thiscan be treated as two types of periodic motion: Rotation — where the whole nuclearframework is rotating — and vibration — where the nuclear framework is changingshape. Rotation and vibration, in addition to electronic transitions, makes the molec-ular quantum mechanical system far more complex than the atomic case [4, p. 383f].
A great simplification to the understanding of molecular structure is the Born–Oppenheimer approximation. It relies on the fact that nuclei are heavier than electronsby at least a factor of thousand, and the electric forces governing their motion are thesame order [4, p. 383]. Nuclei are thus much slower than electrons. As a conse-quence, it is reasonable to consider nuclei to be fixed during electronic transitions.Also, we can rely on the electrons to adapt to a change in the nuclear framework al-most instantaneously [5, p. 258]. During a vibrating motion of the nuclei, where theinternuclear distance may change, the electronic wave functions will adapt instanta-neously.
Rotational, vibrational and electronic transitions are not independent. However,when considering the associated energy, rotational transitions often require the leastenergy. Vibrational transitions require more energy than rotational transitions. Elec-tronic transitions require more energy than vibrational transitions [5, p. 338]. The
1Atomic units is a system of units suitable for atomic calculations. It arises when four fundamentalconstants of nature is defined to unity. These constants are the electron mass, the elementary charge, thereduced Planck’s constant and Coulomb’s constant.
2The only molecule with three constituent particles is the hydrogen molecular ion H+2
5

pure rotational spectrum of the water molecule is observed in far infra-red [6][7].The fundamental vibrational frequencies are observed in near infra-red and extendup into the visible spectrum [8]. The electronic transitions considered in this reportrange from a few electron volts (visible spectrum) to hundreds of electron volts. Therotational motion leads to a second-order splitting in a molecular spectrum, whereasthe vibrational motion itself leads to a first order splitting [4, p. 385f]. The rotationallevels are energetically too close to each other to have any measurable effect on theresult of the dissociation process, thus they will not be further discussed. Vibrationalsplitting is however visible in some electron spectra found in this report.
The Born–Oppenheimer approximation implies that for a given arrangement ofatomic nuclei, the solutions of the Schrödinger equation will be a set of wave func-tions
Φ1(r),Φ2(r),Φ3(r), . . .
associated with a set of discrete energies
E1, E2, E3, . . .
Movement of a nucleus will result in an immediate change of these functions. Thus,if one has two nuclei in free space constituting a diatomic molecule, one can plotthe energy eigenvalues as a function of the internuclear distance R, thus one willhave the functions E1(R), E2(R), . . .. The Born–Oppenheimer approximation allowsus to present the results as a function of nuclear distance. These functions are calledpotential curves. Potential curves are illustrated in figure 1. All potential curves havethe common characteristic that En(R) → ∞ when r → 0, because the nuclei willrepel each other if they get closer. Also, En(R) → E∞ when r → ∞, which is theenergy of the two separated atoms [5, p. 260]. The potential curves of moleculeswill be of much importance when determining the possible electronic transitions inmolecules.
ener
gy
nuclear distance
bonding
anti-bonding
FIGURE 1 – Potential curves corresponding to bonding and anti-bonding states.
The minimum of the lower potential curve in figure 1 explains the existence ofmolecular bonds. Undisturbed nuclei will arrange themselves in a state with min-imum energy. If the potential curve has a minimum there exists an equilibrium
6

distance where the molecular system has the lowest possible energy. Such a stateis known as bonding. States without minima can be either anti–bonding or non–bonding. For evaluation of dissociation these states are important to distinguish, sincemolecules put in anti–bonding or non-bonding states will dissociate.
2.1.2 Symmetry
Of fundamental importance for the molecular orbital theory are the concepts in themathematical framework of group theory. In particular, group theory well explainsthe mathematics behind symmetric properties of objects. Symmetry is very impor-tant in everyday life. Even if one may not notice, very many man-made objects carryat least one symmetric property. An object is said to hold a symmetry when we candefine a transformation of the object which, when executed, leaves the object seem-ingly unchanged [9, p. 2]. These properties can also be applied to molecules likeH2O.
FIGURE 2 – The symmetric species of the H2O molecule, including one C2 rota-tional axis and two mirror planes. (Picture: Martin Chaplin)
A molecule is a quantum mechanical system described by wave functions in spaceand time. These wave functions must be expressed within a defined coordinate sys-tem. If the molecule carries a symmetry property it is useful to define the origin ata point coinciding with an inversion point, a rotational axis or a mirror plane. Thecenter of mass is always a suitable choice. In H2O one can place it almost in thecenter of the oxygen atom, due to the large difference in mass of oxygen and hydro-gen. As illustrated in figure 2 the water molecule has a rotational axis (label: z-axis)with 2-fold rotational symmetry, which means that one can rotate it 180◦ around theaxis an abritrary number of times and still leave it unchanged. It has also two mirrorplanes - the x z-plane and the y z-plane. A water molecule can thus be defined as apoint group with well defined symmetric properties. The H2O molecule belongs toa point group called C2v . Here C2 denotes rotational symmetry without inversionsymmetry. v should be interpreted as symmetry through mirror planes vertical tothe xy-plane. It should be noted that the bent ”Mickey Mouse”-shape of H2O makesit different from linear tri-atomic molecules, e.g. CO2 , with D∞ symmetry. If H2Ohad been linear it would have completely different properties due to symmetry ef-fects, including non-polarity and different vibrational modes.
Symmetry considerations must be undertaken when constructing molecular or-
7

bitals. The symmetry properties of a point group are contained in the irreduciblerepresentations in a character table. The character table for the C2v is presented intable 1. Each irreducible representation corresponds to a symmetry species. For C2vthere exist four symmetry species — A1,A2,B1,B2. The character table for C2v canbe used to find the symmetric properties of H2O.
C2v E C2 σv (x z) σ ′v (y z)A1 1 1 1 1 z, z2, x2, y2
A2 1 1 -1 -1 xyB1 1 -1 1 -1 x, x zB2 1 -1 -1 1 y, y z
TABLE 1 – The character table for the C2v point group. Each row corresponds to asymmetry species arising from a irreducible representation. The charachters decribethe behavour of a symmetry species under a symmetry operation. E.g. one can seethat the identity symmetry operation E (the act of doing nothing) has the result 1for each symmetry species. The object remains unchanged. However for the rotationsymmetry operation C2 only the A symmetry species remain intact while B sym-metry species are inverted. The σv (x z) and σ ′v (y z) are reflections in the respectiveplanes. The functions to the right describe which functions that are associated to theirreducible representation. If e.g. an object transforms like x z it can be representedby B1.
A note should be made on the labelling system. The labels, called Mulliken sym-bols [10], describe the behavior of the symmetry species under symmetry operations.Some wave functions in symmetric molecules will stay intact under symmetry oper-ations (symmetric) while others change sign (anti-symmetric). These are labeled asfollows:
A1 is symmetric with respect to rotation around the principal rotational axis andsymmetric with respect to a vertical mirror plane perpendicular to the princi-pal axis.
A2 is symmetric with respect to rotation around the principal rotational axis andanti-symmetric with respect to a vertical mirror plane perpendicular to theprincipal axis.
B1 is anti-symmetric with respect to rotation around the principal rotational axisand symmetric with respect to a vertical mirror plane perpendicular to theprincipal axis.
B2 is anti-symmetric with respect to rotation around the principal rotational axisand anti-symmetric with respect to a vertical mirror plane perpendicular tothe principal axis.
This notation will be used for the H2O molecule. For OH in point group C∞v thestory is a bit different. Because of its infinite number of possible rotations aroundthe principal axis (which is directed along the molecular bond) it makes no senseto talk about an anti-symmetric rotation. Instead one must define an infinite setof degenerate B-states and denote them En where n ∈ N. Because the C∞v pointgroup has a strong connection to the full rotation group R3 of free atoms, there is
8

also a strong connection to LS-notation. In analogy a ΛΣ-notation has been adoptedfor linear molecules. here A1 = Σ
+, A2 = Σ−. Non-rotationally-symmetric states
(degenerate E-states) are labeled Π,∆,Φ, . . . in analogy with P, D , F , . . . in atoms.
2.1.3 Construction of molecular orbitals
Just as electronic wave functions in atoms form atomic orbitals, electronic wave func-tions in molecules form molecular orbitals. To evaluate these from the molecu-lar electronic Hamiltonian in eqn. 2 is a tedious task which cannot be carried outthe same way as it can for atoms. Within the Born–Oppenheimer approximationthis will be mathematically complex even for small molecules. One can, however,simulate molecular orbitals as a linear combinations of constituent atomic orbitals.This technique is known as molecular orbitals as linear combinations of atomic orbitals(LCAO) [4, p. 400]. The molecular orbitals φ are written as
φ=∑
rcrχr
where χr are atomic orbitals and cr are numerical factors. The atomic orbitals usedconstitute a basis set for the calculation [5, p.262]. In principle one can find the solu-tions by applying variational theory. Essentially one will find molecular orbitals byapplying some constraints arising from energy and symmetry considerations. First,the binding energies of the atomic orbitals must be similar to contribute to molecu-lar orbitals [5, p. 269]. Hence, for the bonds between O and H atoms one will onlyfind molecular orbitals combing H1s with O2s, O2px,y,z . Secondly, the orbitals musthave a constructive overlap3.
The O1s orbital is too compact and located too close to the nucleus to overlap.An overlap can only be constructive if the orbitals have the same symmetry [14, p.5]. With these considerations one can construct molecular orbitals for H2O and OH.
The hydroxide molecule OH belongs to the C∞v symmetry. The basis set is theO and H atomic orbitals.
φ= c1χ (H1s)+ c2χ (O1s)+ c3χ (O2s)+ c4χ (O2px )+ c5χ (O2py )+ c6χ (O2pz ) (3)
The principal nuclear axis, by convention, is z. Hence H1s, O1s, O2s and O2pzbelong to the Σ symmetry species. The O1s is left undisturbed. The remainingorbitals combine to three σ–orbitals. O2px and O2py belong to Π symmetry speciesand cannot overlap with H1s. Thus they form undisturbed π–orbitals. The orbitaloccupation of OH in its ground state is
1σ22σ23σ21π3.
This suggests that the molecular orbitals will be constructed as follows:
φ(1σ) = χ (O1s)φ(nσ) = c1χ (H1s)+ c3χ (O2s)+ c6χ (O2pz)φ(1π) = c4χ (O2px)+ c5χ (O2py)
Since all electrons except one are paired in doubly occupied orbitals the unpairedelectron makes an overall 2Π state.
3An overlap is where two wave functions partly occupy the same region in space. When they do, theyboth contribute to the overlap integral. If the overlap integral is positive, the overlap is constructive.
9

The water molecule is trickier due to its bent shape. It belongs to the C2v sym-metry. The basis set is the same as for OH with the addition of one more H1s.
φ=c1χ (H1sA)+ c2χ (H1sB)+ c3χ (O1s)+ · · ·· · ·+ c4χ (O2s)+ c5χ (Opx)+ c6χ (Opy)+ c7χ (Opz).
(4)
Now the z–axis is directed along the C2 rotational axis as in figure 2. One can assignthe O orbitals to the four symmetry species of the group (a1, a2, b1, b2), but the H1sorbitals (H1sA and H1sB ) do not by themselves belong to a symmetry species (theyare not symmetrical with regard to the rotational axis). It is therefore necessary toform symmetry–adapted linear combinations to get at suitable basis set. Since the H1sorbitals are equvivalent, one can construct two virtual orbitals as linear combinationsof the H1s orbitals.
cAχ (A1) = c1χ (H1sA)+ c2χ (H1sB)cBχ (B2) = c1χ (H1sA)− c2χ (H1sB)
FIGURE 3 – SALC-orbitals for H2O. Assigments has been made to the symmetryspecies. (Picture: Jeremy Harvey)
It is obvious from the graphical representation in figure 3 that χ (A1) and χ (B2)belong to the A1 and B2 symmetry species. As before the O1s is left undisturbed.The remaining orbitals are characterized according to their symmetry species, whichsuggests that the molecular orbitals will be constructed as follows [5, p. 274]:
φ(1a1) = χ (O1s)φ(na1) = cAχ (A1)+ c4χ (O2s)+ c7χ (O2pz)φ(1b1) = χ (O2px)φ(nb2) = cBχ (B2)+ c6χ (O2py)
10

FIGURE 4 – The resulting molecular orbitals from a LCAO calculation on H2O.HOMO denotes the highest occupied molecular orbital 1b1 and LUMO the lowestunoccupied molecular orbital 4a1. Note that the graphical representation of 3a1 and1b1 is rotated 90◦. (Picture: Martin Chaplin)
11

To find the order of the orbitals one has to solve a secular equation for each of thesymmetry species [5, p. 275]. The result is seen in figure 4. The 10 electrons of H2Oin its ground state occupy orbitals
1a212a2
11b 22 3a2
11b 21 .
Since all electrons are paired in doubly occupied orbitals the state is 1A1. Above theoccupied orbitals one finds the un-occupied orbitals 4a1 and 2b2.
2.2 Decay and dissociationThe aim of this report is to study the dissociation processes of core-excited H2O. Thisrequires an understanding of how a core-excitation can be induced, how the moleculemay decay from its excited state, and under what conditions molecular bonds maybreak.
2.2.1 Interaction of light with the molecule
Our knowledge of how light induces excitations in molecules arises from their ab-sorption spectra. An absorption spectrum of H2O acquired by Hjelte et al [2] isshown in figure 5.
When a molecule is irradiated with light it may absorb a photon and its energy.The energy of the molecule is then increased from the initial state energy Ei to thefinal state energy E f . If no ionization is induced, as will happen when the photonenergy is higher than the ionization energy, the energies must fulfill the energy con-servation relation
hν = E f − Ei (5)
where hν is the photon energy. In practice this means that a photon can only beabsorbed if there exists a final state with a suitable energy. The absorption peaks thusindicate photon energies which are probable to induce excitations.
4000
3000
2000
1000Inte
nsity
(ar
b. u
nits
)
540539538537536535534533532Photon energy (eV)
4a1
2b2
2b1
FIGURE 5 – Absorption spectrum of H2O indicating the transitions. E.g. 4a1 hereindicates the transition O1s→ 4a1 explained in the text. The classification of thethree most prominent peaks is well known [2][12][13]. (Data obtained by theHjelte et al [2] during the experiment described in the publication.)
12

On absorption of a photon an electron is promoted from a filled molecular orbitalto an unoccupied orbital. Such a state is often unstable and short-lived. The moleculeis in an excited state, denoted by a star e.g. H2O∗. A special case is when an electronin a deep orbital is promoted to an unoccupied orbital. Such a state is called core-excited. The H2O molecule has only one core-orbital, namely O1s. The photonenergy region shown is well known to include the photon energies which inducetransitions from O1s to unoccupied molecular orbitals [2][12][13]. To decide on theclassification of states one must apply calculations of the molecular orbital structureand use symmetry arguments.
Apart from atomic-like core orbitals, the orbitals in molecules are of two types,valence and Rydberg. In the valence case the promoted electron is described to oc-cupy one molecular orbital where there is a strong correlation between the ionic coreand the electron. In the Rydberg type of states the electron is treated as it sees thenucleus and all other electrons as one single charged particle [14, p. 8]. This meansthat they are atomic-like in their structure.
For the experiment this implies that we can choose to excite the molecule to aspecific final state if we have a light source with well defined monochromatic light.Such light can be obtained at synchrotron light sources. The required light is in theX-ray regime.
The mathematical treatment of photo-induced transitions is further elaborated inappendix A. It can be shown that the symmetry species of the final orbitals restrictswhich orbitals can be populated by core-excitation of O1s electrons. Figure 5 showthat transitions to the three first unoccupied orbitals are possible.
2.2.2 The Franck–Condon principle
The implementation of the Born–Oppenheimer approximation also has an effect onthe theory of transitions. The Franck–Condon principle states that ”because nuclearmasses are so much larger than the mass of an electron, an electronic transition occurswithin a stationary nuclear framework" [5, p. 388]. Its implication is that eachelectronic transition will correspond to a vertical movement between two potentialcurves, as depicted in figure 6. The range of nuclear coordinates where a transitioncan happen is called a Franck–Condon region. Its width is determined mainly by thedepth of the potential well of the initial electronic state. A deep well corresponds toa narrow Franck–Condon region
The Franck–Condon principle couples the electronic and vibrational states, sincea transition between electronic states determines also which vibrational states arepossible to occupy. Vibrational states are only an issue when the excited state isbonding. Excitation to other states leads to dissociation.
2.2.3 Auger decay
An excited state must eventually decay. In light core-excited atoms and moleculesthe dominant de-excitation channel is Auger decay [11, p. 6], the radiationless analogto X-ray emission. A vacancy in the core orbital is filled by a electron in a higherorbital. The released energy is transferred to another electron in a higher orbitalwhich is ejected from the molecule. The molecule thus becomes ionized, so calledautoionization. The kinetic energy of the ejected electron equals the energy differenceof the excited state and the relaxed state. The energy of the ejected electron, calledan Auger electron, is thus a signature of the energy of the relaxed state in the ionized
13

FIGURE 6 – A transition between an initial state with energy E0 to a final stateE1 corresponds to a vertical movement between potential curves according to theFranck–Condon principle. A molecule in a certain electronic and vibrational statecan thus only be excited within the Franck–Condon region. (Picture: Mark M. So-moza)
molecule. The energy of the Auger electron is thus not directly dependent on theinitial photon energy hν . If the energy of the excited state is known and the kineticenergy of the ejected electron is measured, the energy of the relaxed state can becalculated. The spectrum of Auger electrons is a measure of the possible electronicstates in the ionic molecule.
Figure 7 shows a normal Auger spectrum of H2O published by Siegbahn et al[15]. Their sample was irradiated by Mg Kα rays (hν =1253 eV). The characteris-tic of a normal Auger electron spectrum is that the process is induced by an inner-shell photoionization of the molecule. This is different from resonant Auger electronspectrum where the initial excitation is to a specific intermediate state. The spectrumshould illustrate the multitude of possible Auger electron energies that originate froma core-excited molecule.
One can make a distinction between two types of resonant Auger decay — partic-ipator decay and spectator decay — differing in the orbitals involved in the process.
Consider the excitation of one O1s electron to the 4a1 orbital.
hν +H2O→H2O∗(O1s−14a11)
One electron fills the vacancy. This could e.g. be one 1b2–electron. The energy istransferred to the 4a1–electron which is ejected.
H2O∗(O1s−14a11)→H2O+∗(1b−1
2 )+ e−
This is the participator decay, since the originally promoted electron participates inthe Auger decay. The result is an ion with a valence vacancy. (Note that the ion still
14

FIGURE 7 – Normal Auger spectrum following excitation by Mg Kα X-rays. The fullline indicate the measured spectrum. The dotted lines and bars indicate an attemptto classify the Auger transitions. The spectrum shows that there is a multitude ofAuger processes following excitation by X-rays, most of them with Auger electronenergies far lower than 500 eV. (Spectrum from Siegbahn et al [15])
is excited and can decay further.) The other case would be if the excess energy insteadis transferred to another electron e.g. the 1b1–electron.
H2O∗(O1s−14a11)→H2O+∗(1b−1
2 1b−11 4a1
1)+ e−
This is the spectator decay, since the originally excited electron does not participatein the Auger decay. The result is an ion with one promoted electron and two valencevacancies.
Each of these H2O+ states is associated to a potential curve. The energy of theAuger electron will correspond to the vertical distance between the excited and re-laxed state. For that reason a combination of Auger spectra and potential curvesallow for a classification of Auger decay channels. This report will further explorethese possibilities for H2O.
2.2.4 Fragmentation patterns for the core-excited water molecule
In the most straightforward case the core-excited H2O molecule decays to a stableH2O+ fragment without more effort than the ejection of an Auger electron. How-ever, the decay pattern shows much greater complexity than that, as can be seen infigure 8.
The core-excited H2O molecule will eventually undergo Auger decay. In the1990s there was an ongoing discussion about the possible occurance of ultrafast dis-sociation of the core-excited water molecule [3]. Auger decay of core-excited H2Otakes place on the femtosecond timescale. The ultrafast dissociation is characterized
15

FIGURE 8 – Fragmentation patterns for core-excited H2O. The complexity arisesfrom a combination of Auger decay and dissociation. Here only singly charged frag-ments are presented, but neutral and doubly charged species may also occur. (Picturefrom [12])
FIGURE 9 – Schematic and simplified illustration of the early and late dissociationprocess. The x-axis shows the distance along one O–H distance, whereas the other iskept fixed. (Picture taken from [3].)
16

by a dissociation on the same time-scale as Auger decay. We call this ”late” Augerdecay. The process is illustrated in figure 9. It had been shown for other moleculesthat this type of dissociation could occur in strongly dissociative core-excited states.Hjelte et al [2] showed in 2001 that such ultrafast dissociation existed in water.
In early Auger decay the core-excitation is immediately followed by Auger decay.
hν +H2O→H2O∗→H2O+(∗)+ e−
The H2O+∗ state can decay by further Auger decay (further ionization) or fragmen-tation into charged and neutral fragments. In late Auger decay the core-excitation isimmediately followed by a pre-Auger fragmentation. The Auger decay takes placewithin the fragment.
hν +H2O→H2O∗→OH∗+H→OH+(∗)+H+ e−
Hjelte et al [2] used a very elegant method to find the ultrafast dissociation fromhigh resolution Auger spectra. By a slight detuning of the incident photon beam theycould observe an equal detuning in the Auger spectra. This detuning is observed forall early Auger decays where the potential curves in the Franck–Condon region arenot parallel (see figure 9). A slightly lower photon energy will excite the moleculeat a slightly longer O–H distance, and thus the Auger decay will have slightly lowerenergy. Late Auger decay will occur in a Franck–Condon region where the curvesare parallel and thus no detuning will be observed. This method, with pure Augerspectrum analysis, is powerful by its own means. But it has only limited possibilitiesto give a qualitative and quantitative analysis of the final states reached after decay.
Following the logic of figure 8, one can argue that quantitative and qualitativeanalysis of the decay products can be done by ion detection. An extensive study ofthis kind has been done by Piancastelli et al [16]. They used a synchrotron lightsource to scan a sample of water vapour in the same energy region as the absorptionspectrum in figure 5. They detected the ion yield for each possible outcome ion.Such an experiment can identify the outcome fragments of a core-excitation process.However, it cannot say anything about the actual final states of the fragments andhow the electronic configurations play a role in the process.
In a study analogous to their measurements on water, Hjelte et al showed theexistence of ultra-fast dissociation in ammonia (NH3) [17]. In addition to the analy-sis of Auger spectra they also compared their findings with electron energy resolvedelectron-ion coincidence measurements. They could show that the N1s→ 4a1 reso-nance in NH3 mainly gave rise to NH+2 -ions arriving in coincidence with electronsof the kinetic energy of the late Auger process. This was a strong argument since itimplied the proposed decay pattern.
hν +NH3→NH∗3→NH∗2+H→NH+(∗)2 +H+ e−
Coincidence measurements can thus prove to be a useful tool to connect the pow-ers of both normal/resonant Auger electron spectroscopy and ion yield measure-ments. It gives a stronger possibility for identification of individual states. Since incoincidence measurements one can assign fragmentation to certain Auger electronenergies, one can thus hopefully determine the fragmentation patterns giving themassignments to final states.
17

3 MethodsThis section describes in brief the method we have used to acquire our data and toanalyse it. A more extensive description of the synchrotron radiation and beamlineI411 can be found in appendix B. A more detailed description of the PEPICO spec-trometer can be found in appendix C.
The strength of electron energy resolved photoelectron photoion coincidence spec-troscopy (PEPICO) is the ability to simultaneously measure the electron energy ofphotoelectrons (or other energetic electrons such as Auger electrons) and ions pro-duced by ionization or dissociation. An experimental setup for PEPICO must thusconsist of two interconnected parts, one electron spectrometer and one ion detector.There must also be an electronic steering system making sure that the two measure-ments are connected and stored together.
FIGURE 10 – General composition of the setup viewed along the photon beam. Theelectron analyser is to the left and the TOF spectrometer to the right. The gas isinjected in the chamber through a needle. (Picture from [18])
The data presented in this report were measured at beamline I411 at MAX-lab(see appendix B) in June 2010 by a joint group from University of Oulu and LundUniversity4. They were acquired using a PEPICO setup designed and described byKukk et al [18]. It consists of a Scienta SES-100 hemispherical electron analyserand a ion time-of-flight (TOF) spectrometer. Its general features are shown in figure10. A detailed description is given in appendix C. The electron analyser gives, aftercalibration, the energy of the electron. The ion TOF spectrometer gives the mass-to-charge ratio of the ion. These two parameters are stored together. A measurementis called an event. An event where one or more ions are detected with an electron isnamed a coincidence.
The components are mounted perpendicular to the propagation direction of thesynchrotron light, as illustrated in figure 10. After ionization of a molecule, the emit-ted electron might be detected in the electron analyser. The electron detection willtrigger a pulse leading to the creation of an electric field extracting all cation5 species
4The author did not participate in these measurements. See Acknowledgments for the full list of par-ticipants.
5A cation is an ion with a positive net charge, i.e. less electrons than protons in the nucleus. A photo-electron or Auger ionization i a free neutral molecule will always produce cations.
18

FIGURE 11 – The left panel shows the possible outcomes of an event in pulsed ex-traction field mode. We detect the electron coming from ionization A1. At the sametime there is a ionization A2 which is not detected. We have a true coincidence if theresulting fragment(s) from A1 are detected and not resulting fragment(s) from A2.In many events we will however detect false coincidences or no coincidences, eitherbecause we do not succeed to extract the right ions, or we do not succeed to extractany ions at all. The right panel shows the possible outcomes of a random coincidence.These are not triggered by an electron detection, and thus necessarily false. (Picture:Edwin Kukk)
19

from the extraction region to the TOF-spectrometer. The cations are accelerated byan electric field in the direction of the TOF spectrometer axis. Heavy fragments willarrive at the detector later than light fragments, thus allowing for a separation ofdifferent ion species.
If the detected photoelectron and the detected photo-ion were created in the sameionization process it is a true coincidence; otherwise it is a false coincidence. It shouldbe well noted that only a fraction of the coincidences will actually be true. Figure 11shows the possible true and false coincidences. To get the best possible data we mustdeal with the false coincidences that will inevitably occur. In the pulsed extractionfield mode we cannot directly separate true and false coincidences. It is simply notpossible to deduce if one electron and one ion originate from the same process. There-fore we have to rely on an indirect measure of random coincidences. The randomcoincidences, shown in figure 11 are artificially generated events where no electronis triggering the detection. The random triggers are governed by a time pulse. Allevents measured after a random trigger event are necessarily false coincidences. Theevents after an electron trigger are a mix of true and false coincidences. However, onaverage, the electron triggered events contain the same ions as the necessarily false,random triggered coincidences plus the true coincidences. Therefore, if we considerthe average number of ions N̄co in electron triggered events, and the average numberof ions N̄r nd in random events. Then the number of true events will be
N̄t r ue = N̄co − N̄r nd . (6)
This average random subtraction method can be applied to each bin of TOF events.It can never deduce if a single event is true or false.
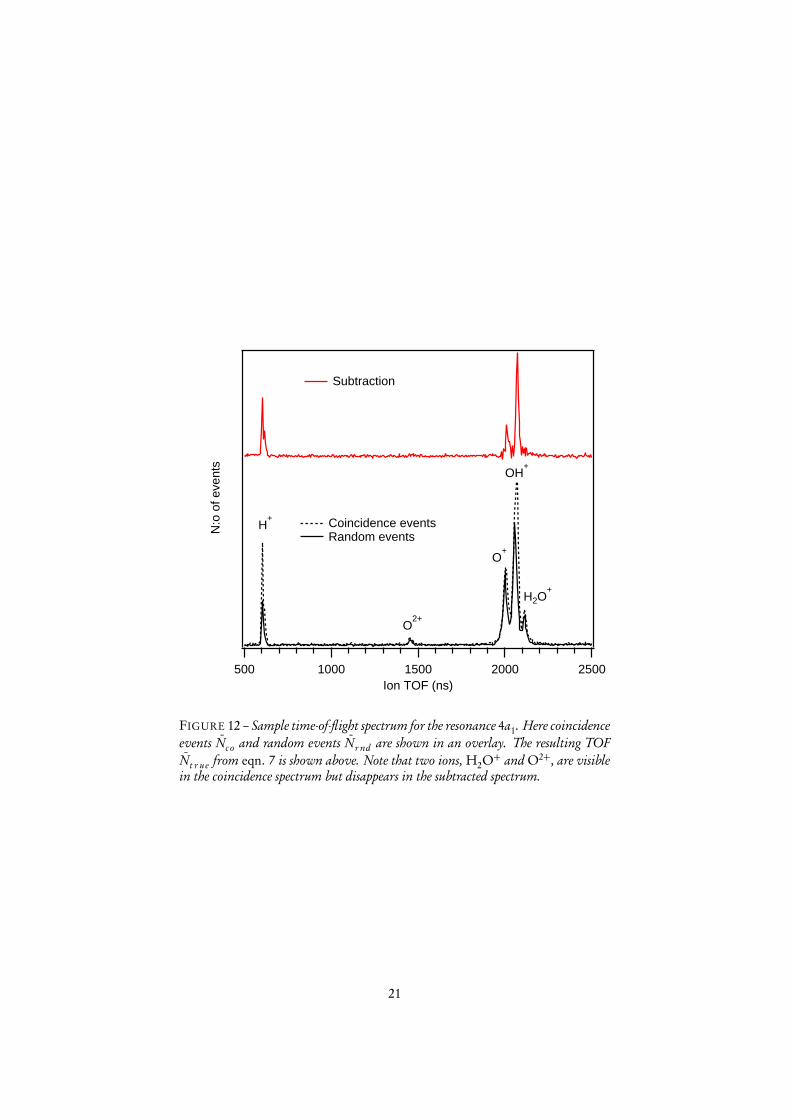
The data analysis has been done with a custom made macro in Igor Pro, developedby Edwin Kukk6. The datasets used here include some hundred thousand events perresonance. To give a view of the relative sizes of N̄co and N̄r nd the graph in figure12 shows the coincident and random TOF spectrum for the fragmentation processfollowing core excitation to the H2O∗(O1s−14a1
1) (hereafter denoted 4a1, the label ofthe intermediate state). It should be noted that a large majority of the coincidencesrecorded are false, in the sense that a large fraction of the events, statistically, do notoriginate from one single ionization process. The measure of the quality of data isknown as purity and is defined as
100 ·N̄co − N̄r nd
N̄co
(7)
The data presented here has a purity between 10 and 15. This implies that 85-90percent of all measured coincidence events are false.
Kukk et al [18] have performed tests on the validity of the statistical methodwith valence electron ion coincidence of rare gases. They note that the method wasproven to work effectively at detection rates up to 500 Hz [18]. In the following wehave thus stayed below this regime.
The high rate of false coincidences is however a drawback. Significant improve-ments to the quality of the data are required. The false coincidences appear becausewe cannot make sure that only one ionization event takes place during one extrac-tion. With reference to figure 11 this means that all coincidences would be true if
6University of Turku, Finland
20
N:o
of e
vent
s
2500200015001000500Ion TOF (ns)
Subtraction
Coincidence events Random events
H+
O2+
O+
H2O+
OH+
FIGURE 12 – Sample time-of-flight spectrum for the resonance 4a1. Here coincidenceevents N̄co and random events N̄r nd are shown in an overlay. The resulting TOFN̄t r ue from eqn. 7 is shown above. Note that two ions, H2O+ and O2+, are visiblein the coincidence spectrum but disappears in the subtracted spectrum.
21

A2 would be eliminated. As we have seen in figure 7 there is a large amount ofauto-ionization processes in H2O where the Auger electron is emitted with an en-ergy lower than our detectable energy region. All auto-ionization involving Augerelectrons with low energies will contribute to the false coincidences since unrelatedions will be present in the extraction region. One way around this problem is tolower the rate of events, by decreasing the light intensity or by reducing the num-ber of molecules in the extraction region (lowering the gas-pressure). Of course thisincreases the time needed for the experiment. To do the opposite, increase the gas-pressure, would probably increase the number of false coincidences, but also increasethe number of coincidences overall. This could itself increase the statistical signifi-cance of the subtraction.
An issue connected to the resolution of the experiment is the acceptance of theelectron analyser. The present setup requires that the electron itself hits the detector.Therefore the acceptance angle should be large to maximize the number of electrontriggered events recorded. The drawback here is that the energy resolution of the de-tector decreases with a high acceptance angle. The data presented here were acquiredwith a high acceptance. The resolution of the electron analyser under full illumina-tion is 1.6 eV. In practice we cannot get a full illumination, and thus the resolutionis estimated to 1.2-1.3 eV. The photon energy resolution of the beamline is 1.1 eV[19]. This could be compared to the resolution of the Auger spectrum of Hjelte etal, which was obtained with 90 meV photon energy resolution and 140 meV electronanalyser resolution [2].
Both TOF and electron energy must be calibrated. When it comes to TOF oneshall convert TOF into mass-to-charge ratio. One must make use of the relation
t = t0+CÈ
m
q(8)
where t0 and C are constants to be determined. It takes only two known points todo this, and thus we have chosen to normalize to H+ and H2O+. Identification ofeach peak is listed in table 2.
Fragment TOF intervalH+ 580 – 640 nsO2+ 1430 – 1490 nsO+ 1970 – 2030 nsOH+ 2030 – 2090 nsH2O+ 2090 – 2150 ns
TABLE 2 – Time-of-flight intervals found for each fragments.
The energy calibration of the electron detector results in a condition that convertsdistance on the detector plate to energy. We have used two well known photoelectronpeaks in Xe 4d spectrum to calibrate [20]. This allows us to calibrate the detector forthe energy region 502-512 eV. All data were acquired in this energy region.
22

4 Results and Analysis
4.1 Evaluation of PEPICO mapsTo evaluate the coincidence events one makes use of PEPICO maps. These are two-dimensional graphs with electron energy along one axis and TOF along the other.The map itself is a two-dimensional false-colour histogram. Figure 13 shows thePEPICO map of the fragmentation process following core excitation to 4a1. Themap shows the coincidence events marked in a two-dimensional array with Augerelectron kinetic energy on the x-axis and ion TOF on the y-axis. Random subtrac-tion has been made, both in the TOF and the false-color map. The map is square-root-scaled to allow for the display of weaker processes.
Three strong horizontal fragment lines are visible. With reference to table 2 theyare assigned to H+ (bottom), O+ (middle) and OH+ (top). Only a weak stroke ofH2O+ can be observed at 509 eV Auger electron energy. The OH+ signal dominatesthe map and shows two peaks at 505 eV and 508 eV. In the former case it is accom-panied by a maximum in the O+ abundance. H+ fragments are only observed in thelower energy end, with a peak value at 506 eV.
To compensate for the low electron energy resolution we make a comparison tothe high resolution Auger spectrum for this and the adjactent energy region. Thisspectrum is displayed in figure 14. The Auger spectrum for 4a1 were evaluated byHjelte et al [2]. They found, as noted above, evidence for early and late Auger decayin the lower energy region. Especially, they observed vibrationally resolved struc-tures at 508 eV and 511 eV which they concluded could only originate from an Augerdecay of the core-excited OH fragment, an evidence for late Auger decay. These struc-tures can be observed in figure 14. This observation allowed Hjelte et al to concludethat there would exist ultra-fast dissociation of the 4a1 state.
Our measurements show a large abundance of OH+ at 508 eV and above withonly small abundances of other fragments, suggesting that the dominating processreleases OH+ and H fragments. This is an observation in support of ultrafast dis-sociation connected to Auger energies in this region. No large abundances of othercharged fragments are observed in this region, suggesting that OH+ does not dissoci-ate further.
The Auger energies associated to ultrafast dissociation has been assigned by Hjelteet al [2] to 1Σ+ and 1∆ final states in OH+. They also made a calculation of thetransition rates7 to these states and noted that they would expect a larger rate for 1∆than for 1Σ+. They also predicted a transition to a 1Π state in OH+ with 508 eVAuger energy, but did not observe it.
In our experiment the largest OH+ peak is observed at 508 eV. This would insteadsuggest a higher transition rate for the 1Σ+ or 1Π final state, which cannot be resolved.
The H+ peak is largely unaccompanied at 506 eV, but both OH+ and O+ are seenin larger abundances at slightly lower energies. We cannot from the PEPICO map de-duce if these charged fragments are observed in coincidence with each other. It wouldrequire a photoion photoion coincidence analysis (PIPICO) with the coincidence oftwo fragments. Unfortunately there is not enough data in this measurement to drawany conclusions on this.
It can be seen from figure 14 that participator Auger decay from 4a1 to the threeprincipal bonding states in H2O+ cannot account for the Auger electrons observed
7The transition rate is a measure of the probability for a certain transition.
23

2500
2000
1500
1000
500
200
150
100
50
512510508506504502
Electron hit pos
2500
2000
1500
1000
500
TO
F (
ns)
512510508506504502Electron energy (eV)
FIGURE 13 – PEPICO map for the Auger decay from 4a1 resonance.
24

Ele
ctro
n yi
eld
(arb
. uni
ts)
524522520518516514512510508506504502500498496Electron energy (eV)
Decay to principal states
PEPICO region
4a1
2b2
FIGURE 14 – Auger spectrum with higher resolution measured by the authors of[2]. 4a1 is shown on top and 2b2 in bottom. There is no relation of their relativeintensity. The region where our PEPICO measurements have been performed ismarked. The participator Auger decay to the three principal states H2O+(1b−1
2 ),H2O+(3a−1
1 ) and H2O+(1b−11 ) are highlighted above the PEPICO region. The
general increase in electron energy for 2b2 corresponds to the increase in energy ofthe excited state.
in our energy region. The large number of ”false” H2O+ ions in the TOF spectrumare most likely associated to Auger electrons in the higher energy range. As a conse-quence all H2O+ ions dissappear from the subtracted spectrum.
As noted before, an extensive study of the photo-fragmentation of core-excitedH2O has been published by Piancastelli et al [16]. They measured the partial non-coincident ion yield following core-excitation from photon irradiation in the 531-541eV region. At 4a1 they observed also other fragments, in small abundances. Our ex-perimental conditions have not allowed us to record these ions. One should notethat our experiment does not show evidence for O2+ in this energy region. The dis-sociation patterns involving O2+ may therefore have other associated Auger electronenergies.
Figure 15 shows the PEPICO map of the fragmentation process following coreexcitation to 2b2. Because of the bonding character of 2b2, we are not expecting fastdissociation and no late Auger decay. The probable decay pattern is
H2O∗→H2O+(∗)+ e−
with later dissociation to smaller fragments. Figure 15 shows a strong H+ peak at 508eV. Weaker abundances of O+ and OH+ are observed over the whole energy region.
It should be noted that we do not observe any evidence for H+2 fragments in theTOF spectrum. Piancastelli et al observed that H+2 is weakly produced in 2b2 andnot in 4a1. This feature is often explained by the geometry of the core-excited states,where the 2b2 state has a high probability to have bending vibration, where the Hatoms may come close to each other [13].
25

2500
2000
1500
1000
500
400
300
200
100
512510508506504502
Electron hit pos
2500
2000
1500
1000
500
TO
F (
ns)
512510508506504502Electron energy (eV)
FIGURE 15 – PEPICO map for the Auger decay from 2b2 resonance.
26

4.2 Calculation of potential curvesTo be able to identify the Auger electron energies of the possible transitions we havemade calculations of the initial, intermediate and final states8. These calculationshave included H2O, H2O+ and (H + OH)+ 9. In figure 16 all calculated potentialcurves are presented. The H2O ground state is presented for reference and for thepossibility to identify the Franck–Condon region of the initial core-excitation. It iswell established [4] that the equilibrium O–H distance in the H2O molecule is 0.95Å. The core-excited H2O∗ states are 4a1 and 2b2. Note that they in figure 16 havean 500 eV offset to allow for good comparison with other curves. Curves for thecationic states H2O+ and (H +OH)+ are shown in red.
The calculation is based upon a few constraints. The overall nuclear frameworkdepends on the two O–H distances and the H–O–H angle. The one-dimensionalpotential surface shows the changing of one O–H distance. The other two parametersare kept to their H2O ground state equilibrium positions 0.95 Å and 105◦.
A calculation of the potential curves of OH+ has also been performed. In practicethe calculation has been made on the (H +OH)+ complex where one H is placed ata distance where it is considered to be dissociated (2.5 Å). The other distance is thenvaried as above. In figure 16 the (H +OH)+ fragment curves are plotted to the right.
One can view excitation followed by Auger decay relaxation as a set of move-ments in the potential curves, as we saw in figure 9. According to the Franck–Condonprinciple all electronic transitions are vertical. Following the absorption of a photon,we have a movement vertically in the graph from the H2O ground state to the core–excited state. The Franck-Condon region is considered to be 0.9-1.0 Å. Figure 16suggests that the 4a1 state is anti–bonding while 2b2 is bonding, which is in accor-dance with previous studies. The Auger decay will be a vertical transition from aneutral state (black line) to a cationic state (red line). The expected Auger electronenergy can be calculated from the difference of energy between an intermediate anda final state.
The three lowest states of the H2O+ ion are the principal bonding states, whilethe three upper calculated states are anti-bonding. A classification has been made onthe symmetry species of the states [13]. The distorted H2O+ ion is within the Cspoint group.
In table 3 some transition energies have been extracted from figure 16. To accountfor the dissociative character of 4a1 we can expect a transition at any separation. 0.9Å and 1.0 Å mark the borders of the Franck–Condon region. The fragments canbe viewed as totally separated at 2.5 Å, whereas any decay at higher separation mustbe considered to be a transition in a separated OH fragment. Energies for 1.5 Å aregiven to indicate a possible semi-late decay, i.e. decay during the dissociation.
A closer inspection of the energies associated to the Franck–Condon region showsthe different characters of the principal bonding states 1A′′, 1A′ and 2A′; compared tothe anti-bonding states 3A′, 2A′′ and 3A′′. The former have a well defined transitionenergy in the Franck–Condon region, while the latter have their transition energysmeared out over a wider energy range. The bonding curves are thus almost paral-lel to the 4a1 curve in the Franck–Condon region. In comparison with the Auger
8The computer calculations of the potential curves presented here have been provided by Anna Sankari.The graphical representations and identification of states have been performed by the author
9This notation indicates that we have H and OH separated, but its positive charge is not localized orwith unknown location.
27

40
30
20
10
0
Sta
te e
nerg
y [e
V]
3.53.02.52.01.51.00.5H-OH distance [Å]
O-H distance [Å]
1.0 1.5 2.0
H2O* (shifted -500 eV)
H2O+
OH+
H2O GS
FIGURE 16 – Calculated potential curves for H2O. The bottom line (black) marksthe H2O ground state and the two upper lines (black) mark H2O(O1s−14a1
1) andH2O(O1s−12b1
2). To allow for a better comparison the core-excited curves havebeen shifted downwards 500 eV. The six lowest H2O+ states are shown in red. Herefull lines denote A’ symmetry and dotted lines A” symmerty within the Cs pointgroup (classification from [13]). The box shows the ten lowest calculated states forthe (H + OH)+ combination with a free H. O-H distance in the OH fragment isshown along the added x-axis.
28

RH−OH = 0.9 Å 1.0 Å 1.5 Å 2.5 Å4a1→ 1A′′ 522,6 eV 522,7 eV 519,2 eV 515,1 eV4a1→ 1A′ 519,6 eV 519,7 eV 516,4 eV 512,6 eV4a1→ 2A′ 514,9 eV 515,3 eV 513,5 eV 510,9 eV4a1→ 3A′ 502,7 eV 505,3 eV 509,7 eV 510,2 eV4a1→ 2A′′ 499,9 eV 504,0 eV 510,4 eV 511,9 eV4a1→ 3A′′ 499,8 eV 503,1 eV 508,4 eV 510,0 eV
TABLE 3 – Expected Auger electron energies from the decay from 4a1 to the calcu-lated H2O+ states shown in figure 16. The energies are given for four possible sepa-rations of one O–H distance. The first two columns are within the Franck–Condonregion of the H2O ground state.
spectrum (figure 14) this would imply that the principal peaks are narrower than theassociated peaks in the lower energy range. The calculations implies an overlap ofFranck–Condon transitions in the energy region 500–505 eV, while semi-late Augerdecay will be associated to Auger electron energies in a slightly higher energy range.It should therefore not be possible to distinguish the outcomes of these anti-bondingorbitals. In the Auger spectrum and PEPICO maps we should observe a broad struc-ture.
The anti-bonding 3A′, 2A′′ and 3A′′ final states of H2O+ dissociate along the po-tential curve to (H+OH)+, with the charge located on one fragment. It is of interestwhether they will dissociate into OH+H+ or OH+ +H. To evaluate this additionalcalculations of the charge distribution in different states of the (OH+H)+ complex10
have been performed in MOLCAS [22]. We have found that 2A′′ has possibilities todecay into OH+H+ as well as OH+ +H. 3A′ and 3A′′ shows a preference for disso-ciation to OH+ +H. Since figure 13 shows a large peak for H+ at 506 eV the questionis whether 2A′′ can account for this. Its transitions shown in table 3 suggests that thisis possible and that 2A′′ could account for Auger electrons observed in this energyregion.
RH−OH = 0.9 Å 1.0 Å 1.1 Å2b2→ 1A′′ 524,5 eV 524,6 eV 524,5 eV2b2→ 1A′ 521,6 eV 521,6 eV 521,5 eV2b2→ 2A′ 516,8 eV 517,3 eV 517,5 eV2b2→ 3A′ 504,6 eV 507,2 eV 509,4 eV2b2→ 2A′′ 501,8 eV 505,9 eV 508,8 eV2b2→ 3A′′ 501,7 eV 505,0 eV 507.6 eV
TABLE 4 – Expected Auger electron energies from the decay from 2b2 to the calcu-lated H2O+ states shown in figure 16. Three separations of one O–H distance aregiven. The Franck–Condon region of the H2O ground state is 0.9-1.0 Å and for theintermediate 2b2 state it is 1.0-1.1 Å.
In table 4 some expected Auger energies for 2b2 have been drawn from figure 16.
10The calculation is based on a nuclear framework with one O-H distance at equilibrium 0.95 Å andone H separated from O with 2.5 Å distance.
29

We are not expecting ultrafast dissociation due to the bonding properties of 2b2. Table4 thus only give values within the Franck–Condon region. It should be noted how-ever that the 2b2 intermediate state has a higher equilibrium separation[13], whichcan be clearly seen in figure 16. Therefore, we consider the Franck–Condon region tobe approximately 1.0-1.1 Å.
We also know from earlier experimental and theoretical work [13] that the equi-librium bond angle for 2b2 is smaller than for 4a1. This implies nuclear movementwithout dissociation before Auger decay, both in terms of increasing separation andreducing bond angle.
Just as for 4a1 the principal bonding states are well defined, while the anti-bondingstates show broad energy ranges within the Franck–Condon region. Our calculationsshow that there is one H2O+ anti-bonding state, namely 2A′′, which has a possibilityto decay with a release of H+. Table 4 indicate Auger decay with energies 505,9 eVto 508,8 eV in the H2O+ Franck–Condon region. This is in good agreement withthe experimental H+ peak at 508 eV. It is very plausible that the abundance of H+
originates from this decay. The smaller abundances of OH+ can be accounted forwith reference to 3A′ and A′′, though no clear peaks can be observed.
One can note that all OH+ fragment curves in figure 16 are bonding. It is thusnot expected that these states will dissociate further. Instead one would expect amultitude of vibronic states covering Auger energies energies from 515 eV and down.It should be noted that the calculations suggest that OH+ has a larger equilibriumnuclear separation than H2O in its ground state. Our calculations show a possibilityfor the OH∗ fragment to decay to OH+ and release Auger electrons with energiesclose to 508,5 eV and 510,5 eV.
5 Discussion
5.1 ObservationsStudies of molecules with electron energy resolved photoelectron photoion coinci-dence spectroscopy can give much knowledge of fragmentation processes. In thisreport the fragmentation patterns of core-excited H2O molecules have been studied.With a combination of experimental data and theoretical calculations of potentialcurves we have been able to identify specific fragmentation processes associated withAuger electrons in the energy span 502-512 eV. Energy resolved PEPICO is a power-ful tool to combine the powers of pure Auger electron spectroscopy and ion detec-tion. Though powerful, it is also a method inclined to many difficulties, and there issignificant capacity for improvement in the methodology.
The Auger electron energy region has been shown to be associated with twoclasses of dissociation processes. First, we have seen that Auger decay in the Franck–Condon region of the core–excited molecule leads to dissociating H2O+states. Sec-ond, we have verified that there exists an ultra-fast dissociation channel in the 4a1state, with H +OH+ as its final state signature.
Ultra-fast dissociation of water has been known for some time. Its existence hasbeen proved through high resolution Auger electron spectroscopy. In our study,we have been able to directly observe the ultra-fast dissociation process of 4a1 core-excited H2O by its signature final state dissociation pattern H + OH+. Togetherwith the Auger spectrometric measurements done by Hjelte et al [2], we are therebyable to confirm that Auger electrons in the vicinity of 510 eV are associated to ultra-
30

fast dissociation. We can however not rule out that fragmentation processes otherthan ultra-fast dissociation also may be present.
The electron energy resolution in our measurement is low. We have seen fromcalculations that early and late Auger decay are qualitatively different. Decay fromOH∗ to bonding states in OH+ will show up as narrow peaks with vibrational struc-ture. Transitions H2O∗ to anti-bonding H2O+ are broader since the potential curvesare less parallel. With higher electron energy resolution there would be a possibilityto note quantitative differences in the processes. In the present situation, we cannotrule out that there are overlapping dissociation channels which cannot be resolved.Because of this deficiency, we have not been able to assign the Auger energies to spe-cific final states. There are indications that the relaxed OH+ fragments populate the1∆, 1Σ+ and 1Π states proposed by Hjelte et al [2], but the observed structure is toobroad to make a clear designation.
There are large differences when it comes to the decay products of 4a1 and 2b2.The proposed geometries of the intermediate core-excited states are different, wherethe bond angle of 2b2 is narrower. From 2b2 we have observed a strong preferencefor H+ fragments over other cations. Since we are expecting almost all 2b2 core-excited states to decay via H2O+, we thus expect these states to have a preference fordissociation into OH + H+. The calculations we have performed have verified thatthere is a possible fragmentation channel.
Other studies have reported traces in ion yield measurements of other fragmentsthan those we have observed. We note especially that weak channels such as H+2and O2+ in coincidence are not observed. TOF spectra of random triggered eventssuggests that O2+ fragments are produced in some decay channel(s) following core-excitation, but we cannot associate this to any Auger electron energy in the region ofinterest.
Measurements, particularly in 4a1, have shown a multitude of dissociation frag-ments at certain Auger energies. Regrettably, the data acquired has not been sufficientto make an ion–ion coincidence analysis. Such analysis could give further clues onfragmentation patterns with more than one charged fragment, if such channels exist.
5.2 Enhancement of experiment and analysisAs noted earlier this analysis is based on datasets with quite low purity, which mustlead to a discussion on the possible improvements of the experiment and data analysis.The present statistical errors are hard to disregard.
The electron detection resolution in the PEPICO setup is too low to allow us tomake clear designations of states in the present study. The low detection resolution isa consequence of the high acceptance we have used in the analyser. A high acceptancehas been a necessity to get an acceptable detection rate. To increase the resolutionit could be necessary to lower the detection rate and the number of events. Theelectron detector is run in a specific energy interval, and a narrower interval increasesthe resolution. However, this might cause a considerably lower amount of detectedelectrons and thus no real improvement of the detection resolution.
PEPICO studies combined with high resolution Auger electron spectroscopyhave been fruitful for this project. Although this is not a measure which will givethe full power of PEPICO, it gives important clues on possible decay channels.
One uncertainty connected to the dataset is that only the limited range 502-512eV has been evaluated. It would be expected that many false coincident ions orig-inate from processes connected to Auger electrons with higher and lower energies.
31

Transitions from core-excited states to bonding states in H2O+ are expected to giveH2O+ fragments. No H2O+ fragments have been observed in the 502-512 eV region,although random triggered events gave rise to these. A measurement in the 512-530eV region could verify this assumption and give further statistical certainty to themeasurements in the lower region.
The hope for improvement might lie in a more evolved statistical analysis includ-ing also other datasets than electron triggered coincidences in one energy region. Thefalse coincidences in figure 11 are of many kinds. Our drawback is that we have nodata on the relative weight of the different false channels. We also lack knowledgeof the relative weight of the channels which we are not detecting, i.e. where we cannot observe the electron. We can suspect that some events are not recorded since theAuger electrons are in the wrong energy region. Some electrons in the right energyregion are not recorded either. The statistical analysis could probably be improved ifsuch relative weights could be quantified.
One could, for reference, obtain a total electron yield spectrum in coincidencewith ions. This would give a general picture of which other real fragmentation pro-cesses occur after core-excitation. With a carefully constructed statistical methodthis could improve the analysis. The outcome of such manipulations will however bemuch dependent on the character of the false coincidences, and their relative weight.To further improve the statistics, analysis of the false coincidence channels must beperformed.
32

A Appendix: Symmetry effects in photon induced core-excitations
It is well known that there is a selectivity in the core excitation process. Linearlypolarized light will be preferably absorbed by those molecules having the excitedorbital aligned to the polarization axis. Thus, a core excitation tends to give an excitedmolecule with a definite symmetry and orientation [21].
In the mathematical framework a transition occurs when the molecule system un-dergoes a change from an initial state |i⟩ to a final state | f ⟩. The transition is describedby an interaction HamiltonianHI . The probability for a transition is expressed by amatrix element
Pi f ∝ |⟨ f |HI |i⟩|2 (9)
The matrix element is primarily a measure of the size of the overlap of the initialand final wavefunction. For photon-absorption the transition probability can be ex-pressed within the dipole approximation as
Pi f ∝ |e · ⟨ f |r|i⟩|2 (10)
where r is the electron position vector and e is the vector for the direction of thelight polarization. One can immediately deduce that the transition probability willbe strongly dependent on the direction of the photon polarization when the light islinearly polarized.
For a transition to be ”dipole allowed”, the matrix element in eqn. 10 must nec-essarily be non-zero. To explore the matrix element one can use symmetry consider-ations. The matrix element is an integral of the form
⟨ f |r|i⟩=∫
φ∗f rφi dτ. (11)
It can be shown mathematically [5, p. 156f] that if the integrand is not a basis forthe totally symmetric irreducible representation of the group, then the integral isnecessarily zero. For H2O in the C2v group this means that the integrand φ∗f rφi
must span A1.Since this report only concerns core-excited states the initial state is always the
ground state |A1⟩. The removed electron is a localized O1s electron in a a1 orbital. Acore hole does thus not affect the overall symmetry of the excited state. The positionvector r can be decomposed to its three components (x, y, z). Each component has asymmetry species according to the character table in table 1.
x→ B1 y→ B2 z→A1 (12)
It remains to determine the symmetry of the integrand of the final states |A1⟩, |A2⟩,
33

|B1⟩ and |B2⟩; for each direction in space. In total twelve matrix elements:
⟨A1|x|A1⟩ → A1×B1×A1 = B1
⟨A1|y|A1⟩ → A1×B2×A1 = B2
⟨A1|z |A1⟩ → A1×A1×A1 =A1
⟨A2|x|A1⟩ → A2×B1×A1 = B2
⟨A2|y|A1⟩ → A2×B2×A1 = B1
⟨A2|z |A1⟩ → A2×A1×A1 =A2
⟨B1|x|A1⟩ → B1×B1×A1 =A1
⟨B1|y|A1⟩ → B1×B2×A1 =A2
⟨B1|z |A1⟩ → B1×A1×A1 = B1
⟨B2|x|A1⟩ → B2×B1×A1 =A2
⟨B2|y|A1⟩ → B2×B2×A1 =A1
⟨B2|z |A1⟩ → B2×A1×A1 = B2
The matrix elements ⟨A1|z |A1⟩, ⟨B1|x|A1⟩ and ⟨B2|y|A1⟩ span A1 and are thereforedipole allowed. One can also observe that there exists no transition A1 → A2. Thisknowledge is helpful since it confirms that we can expect allowed transitions fromO1s to the two LUMO:s |O1s⟩ → |4a1⟩ and |O1s⟩ → |2b2⟩. Using these results andnow taking eqn. 10 into account
PO1s→4a1∝ |e · ⟨4a1|r|O1s⟩|2. (13)
The matrix element is only non-zero with r ‖ z and thus PO1s→4a1has its largest
amplitude with e ‖ z. By the same argument PO1s→2b2has its largest amplitude with
e ‖ y.One thus knows that there exist a number of possible excitations. Connecting
this knowledge to the absorption spectrum of H2O in the relevant energy regionhelps us make the classification of states in figure 5.
It should be noted that gas-phase molecules have no fixed direction in space. Eachmolecule will thus occasionally align in the preferable direction with the linearlypolarized light. The impact on the experiment is however that the momentum ofthe dissociation fragments will have a preferable direction for each excitation, whichmust be taken into account when constructing the setup.
B Appendix: An outlook on synchrotron light andthe beamline technical details
B.1 Synchrotron lightA core-excitation of H2O requires X-ray radiation on the order of 500 eV. The ra-diation needs to have a high photon flux and a well defined energy to allow onlyfor electronic transitions to specific states. This is in practice only achievable at syn-chrotron radiation facilities.
Synchrotron radiation is produced when a beam of electrons is forced to movein accelerated motion. From Maxwell’s equations one can deduce that a chargedparticle accelerated in any direction by an external force will emit light. Synchrotron
34

radiation was predicted 1898 by Alfred-Marie Liénard [28]. In theory, this was a wellknown phenomenon when the first electron accelerators were built. Nevertheless, itbecame a huge surprise for the technicians hwo first observed synchrotron radiationin 1947 [29]. For a device constructed to keep electrons at highest possible speedin circular motion this effect was a drawback, since the beam was drained of energy.However, the intense light produced as a by-product in these accelerators could itselfbe used for research. Today synchrotron radiation facilities are constructed only toachieve the best possible light for research.
Synchrotron radiation has some important properties. It is emitted in the direc-tion of propagation of the electron beam, and its energy distribution is dependent onexternal electromagnetic forces. With a careful setup the synchrotron radiation canbe made highly collimated (emitted in only one direction) and tuned (changing theenergy). With enough charged particles at high velocity the photon flux can be mademuch higher than any other light source.
FIGURE 17 – The working principle of an undulator. The incoming particle beamis forced to oscillate in a periodic magnetic field. The emitted light is defined by theundulator period length and the magnetic field between the magnetic arrays. Bychanging the distance of the arrays, the energy can be tuned. (Picture from Wikime-dia Commons)
A synchrotron radiation facility consists of a storage ring where electrons areforced to move in circular motion inside an evacuated tube. Ultra-high vacuum mustbe maintained within since otherwise the mean free path of the electrons would betoo short. The ring lattice is the setup of all devices in a storage ring. It involvesdevices to bend the beam into a circular path — the bending magnets — and to focusthe beam — the quadrupole magnets. Also the accelerating component — the radio-frequency cavity — and all insertion devices — undulators and wigglers — are included.These must be considered as a whole to make the structure work. They are notindependent. Though a carefully designed array of magnets provides the necessarybasis for good insertion devices.
A conventional undulator is a one-dimensional11 array of alternating magneticpoles which are placed above and below the beam, causing the particle beam to oscil-
11Today there exist also undulators with other magnet setups, such as elliptically polarized undulatorswith two-dimensional arrays.
35

late (see figure 17). The light is emitted in the line of motion, i.e. straight forward.One can thus create a narrow cone of light. Furthermore, by allowing the distance ofthe arrays to be changed, the energy of the photons can be tuned. Due to interferenceeffects, the emitted photon energies will be concentrated to emission peaks of certaincalculable wavelengths.
High photon flux in narrow cones with well defined energy is very suitable forX-ray experiments. But to use the full potential of the light, further modification ofthe light is necessary.
B.2 The I411 beamline at MAX-labThe experiments reported here have been performed at the I411 beam-line at MAX-lab in Lund [24]. The I411 beamline was originally situated at the MAX I storagering. It was then known as BL-51 or the ”Finnish beamline” [25]. Following the con-struction of MAX II the beamline was upgraded and moved to the new storage ring.The monochromator of BL-51 was kept on the ’new’ beamline. The I411 beamline isdesigned for spectroscopic studies of gases, clusters, liquids and solids. It operates inthe soft X-ray region, 50-1500 eV. It is permanently equipped with a Scienta SES-200electron spectrometer at the end-station [26]. This end-station has not been used inthese experiments. The spectrometer described in the following section were oper-ated at the ”one meter section” at the beamline. That means that the experiment isnot performed at optimal focusing conditions. The beamline is constructed to giveoptimal focused light to the permanent endstation. The conditions at the one metersection are however sufficient for gas-phase experiments of this kind. The resolu-tion deficiency of the un-focused light is smaller compared to other resolution limitsconnected to the experiment.
The beamline consists of the source and five optical elements. See illustration infigure 18. The optical data below and in the figure is drawn from Bässler et al [24]unless otherwise stated.12
Light source is an 2.65 m long undulator with 58.85 mm period, minimal gap 23mm and Kmax = 3.6.
M1 cylindrical premirror is the first mirror. It is focusing the beam horizontally onthe monochromator exit slit. It performs no focusing in vertical direction. M1takes on the biggest heat load and is thus water cooled. This and all followingmirrors are gold coated.
SX 700 monochromator is a two-element movable system including the M2 planemirror and grating. It is designed to enable monochromatization of light ofa wide range of energies, keeping the beam on the same path13. M2 is simplyreflecting the beam on the grating. The grating is blazed with 1221 lines permm. The system elements are horizontal elements, thus performing verticaldefocusing of the beam. The entrance arm is the full distance r = 15000 mmto the source (see figure 18). The angular magnification c 14 is fixed at 2.25, andthus the distance of the virtual source is 15000 · 2.252 = 76588 mm. The blazeangle is 1.35◦ [25].
12The text and calculations presented here are drawn upon a exercise made by the author during thecourse MAXM16 at MAX-lab, Lund University.
13So called fixfocus setting.14Defined as cosα/cosβ where α (β) is the incident (reflecting) angle.
36

FIGURE 18 – I411 beamline setup in side view (top) and top view (bottom). Theexperimental chamber is located at IM2. There is a possibitity to do experimentswith other setups at IM1. (Illustration in Aksela et al [25] has been a great helpproducing this drawing.)
M3 plane elliptical mirror performs the vertical focus on the exit slit. It takes thegrating virtual source distance as entrance arm and the distance to the slit asexit arm. No focusing is performed horizontally. Since the publication [24]the mirror has been replaced with a better quality one. Slope errors have beenreduced to 0.09” meriodinal and 0.19” sagital [19].
Slit takes a vertical slice of the beam. Note that the slit is in the foci of both direc-tions (M1 focus horizontally and M3 focus vertically on the slit).
M4 toroidal mirror focuses the beam in both directions on the experimental cham-ber (IM2 in figure 18). The entrance arms are however not equal due to a op-timization where the vertical and horizontal beam waist (the narrowest point)were used as focus points rather than the slit position. In vertical (meriodinal)direction the entrance arm was only extended by a few mm, though the hor-izontal (sagital) entrance arm was extended with 3.5 m. The authors of [24]describes this as an effect of the low emittance and the source size of the beam.
A model of the I411 beamline has been made in the BESSY raytrace programRAY [27]. Calculations of spot size (figure 19) and energy distribution (figure 20) at500 eV light and 10 µm has been made at IM1.
C Appendix: An outlook on the PEPICO spectrome-ter technical details
The PEPICO setup was designed and described by Kukk et al [18]. It consists of aScienta SES-100 hemisperical electron analyser and a ion time-of-flight spectrometer.
In a homogeneous electric field a charged particle experiences a constant forceparallel or anti-parallel to the field vector. These particles are subject to acceleration
37

FIGURE 19 – Spot size on sample at IM1 calculated for 500 eV light. The spot size isone the mm-scale.
FIGURE 20 – Energy distribution at sample calculated for 500 eV light and 10 µmslit size. The bandwidth is ≈ 0.2 eV.
38

according to Newton’s second law for the accelerating force Facc = ma and the def-inition of the electric force Fe = Eq where E is the electric field. For Facc = Fe(only electric forces present) the acceleration will be inversely proportional to theirmass-to-charge ratio a ∝ (m/q)−1. Thus, the time it takes for a particle with zeroinitial kinetic energy to travel a certain distance in a homogeneous electric field willbe solely determined by the mass-to-charge ratio of that particle. For convenience themass-to-charge ratio is given in units of u/e where 1 u is the unified atomic mass unitand e is the elementary charge. In this unit e.g. the O+ ion would have mass-to-chargeratio 16 and OH2+ would have 8.5. This argument allows us to use time-of-flight. Ifthe initial kinetic energy of a certain ion is sufficiently low, all ions of that kind havethe same TOF. Hence, one is able to use TOF-spectrometers to evaluate the mass-to-charge ratio of an unknown particle.
In this setup the electron detection trigger is used as a clock-starter. The clockstops when an ion is recorded on the ion detector. The detector can record a seriesof ion hits with a very small dead-time between the events. The ability to recordand analyze two photo-ions in coincidence with a photoelectron is called photoelec-tron photo-ion photo-ion coincidence spectroscopy (PEPIPICO). Two photo-ions will ofcourse only occur if the process creates at least two cation fragments.
The TOF-spectrometer is of Wiley-McLaren type [31]. The extraction region isfollowed by a acceleration region and a drift tube. The 10 mm long extraction regionis applied with a voltage. The following 392 mm long drift tube is without electricfield. Its purpose is to extend the effect of the acceleration region. The active area ofthe detector consist of a 40 mm wide multi-channel plate. The detector can to someextent measure the position of the ion hit, but this will not be further explored here.
FIGURE 21 – Schematic layout of a typical hemispherical electron analyzer. (Picture:Jessica Woods)
The Scienta SES-100 electron energy analyser [32] provides a possibility to detectelectrons and measure their energy. The working principle of an hemispherical elec-tron analyser is that a bundle of charged particles with equal energy originating froma point at the entrance of a perfect half-sphere condenser (see figure 21) with properapplied charges will be focused to one point at the exit of the half sphere, a theoremproven by Purcell in 1938 [33]. Electrons with equal energy will thus be focused on
39

the same spot even if they have angular spread from the point of origin. This featureallows a properly charged condenser to act as a electron energy analyser. If a detectoris placed at the focus point it will register only electrons with a specific energy. TheSES-100 analyser has been equipped with a resistive anode position-sensitive detector[18]. The position-sensitive feature allows for detection of a certain range of electronenergies. When an electron has slightly lower energy, it will experience more deflec-tion and thus appear at the detector at a point closer to the source; if the energy ishigher the opposite is true. With calibration we are able to deduce from the positionof the hit which energy the electron had.
It has been recalled by Field and Eland [30] that there is a conflict between goodelectron energy resolution and good ion energy resolution since the former is in needof a weak extraction field and the latter requires the opposite. The proposed solution,which is implemented in our setup, is to use pulsed extraction field mode as describedabove. However this setup requires proper timing and careful setup of electronics.It is unavoidable that the extraction pulse will have a delay following the electrondetection. In this setup the delay is set to be 1 µs.
The energy resolution of the electron analyser is determined by applied poten-tials on the condenser and the pass energy. The number of channels on the detectorplate are limited. As one converts distance on the plate to electron energy the reso-lution will be proportional to the energy range one is measuring. If the analyser isset so that the detector accepts a larger range of electron energies the resolution willthus decline. The detectable energy range is determined by the pass energy of thehemisphere, basically the potential on the halfsphere condenser. The energy rangeis always approximately one tenth of the pass energy. To enable tuning of the anal-yser a decelerating electric field can be applied before the entrance of the halfsphere.Measuring the energy of electrons in the vicinity of 500 eV can thus be performedeither with high lens fields and low pass energy or vice versa, the former giving alarge energy range but bad resolution.
Total resolution of the electron energy is a convolution of many individual broad-ening effects. The natural broadening is a intrinsic effect of the Heisenberg uncer-tainty relation showing that if the electron is produced from the decay of an inter-mediate state with short life-time the energy of that electron will be more uncertainand thus broadened. Thermal broadening comes from the motions of particles in theinteraction region. It is in the order of kT 0.01 eV in room temperature. One effectis the deviation of photon energies from the synchrotron light source. However, theall over-shadowing effect determining resolution in this experiment will be the detec-tor resolution. The choice of low detector resolution is determined by our absoluteneed to measure as many electrons as possible, and also electrons in a reasonably largeenergy range to include all resonant Auger electron energies of a transition.
The gross structure of the TOF spectrum is determined by the mass-to-chargeratio of the fragments. Broadening effects will be present depending on the speed ofthe charged fragments after fragmentation. Fragments dissociating in a process wherekinetic energy is deployed on it can have a initial velocity parallell or anti-parallell tothe spectrometer axis. In the former case the arrival to the detector will be earlier,and vice versa.
40

D Populärvetenskaplig sammanfattning (in Swedish)Sönderslagning av vattenmolekyler med hjälp av intensivt ljus har genom historienhaft mycket stor påvekan på människan och världen. Vatten finns överallt omkringoss, och så har det varit under nästan hela jordens historia. När liv uppstod på jor-den för 3,5 miljarder år sedan skedde det troligen i vatten. Detta var under en tid ijordens historia när strålningen från solen var mycket stark, och fragment från vat-tenmolekyler måste ha varit delaktiga i kemiska processer när livets molekyler bil-dades. Detta examensarbete undersöker hur det går till när kemiska bindningar ivattenmolekylen bryts på grund av intensiv röntgenstrålning. Jag har studerat vilkaslutprodukter som bildas och hur mycket energi de bär med sig. Jag har kunnat visaatt vattenmolekylen i vissa fall splittras extremt fort, hela processen tar bara ett parfemtosekunder (alltså 0,000 000 000 000 001 sekunder). På den tidsskalan frigörs vätedirekt från vattenmolekylen.
Vattenmolekylen, som är den minsta byggstenen i vatten, består av två väteatomeroch en syreatom. Atomerna är hårt bundna till varandra. När vattenmolekylenbryts sönder bildas mindre fragment. Dessa fragment kan bestå av ensamma syre-och väteatomer, men också molekyler med en väteatom och en syreatom som sitterihop. En av produkterna man kan få av vattenmolekyer är vätgas. Väteatomerna,som är mycket små och lätta, är en tiondel av vattnets vikt. Vätgas kan separeras frånvattenmolekylen genom kemiska reaktioner. Redan idag finns det bilar och bussarsom tankas med vätgas istället för bensin, etanol och biogas. Vätgasmotorn, ocksåkallad bränslecell, har den enorma fördelen att den inte släpper ut andra avgaser änvatten. Ett perfekt scenario vore om man kunde använda solljus för att skilja ut vätgasfrån vatten och tanka bilarna med. Det skulle vara ett slutet kretslopp av vatten drivetav förnyelsebar solenergi. En av utmaningarna är att hitta ett effektivt sätt att skiljaut vätgasen från vatten.
För att få väte att släppa från vattenmolekylen måste man påverka de bindningarsom håller ihop molekylen. En vattenmolekyl är mycket stabil, men ljus och strål-ning kan påverka dess inre struktur. Den kan byta form. Om man väljer strålningmed rätt energi kan en bindning brytas och en väteatom blir fri. Fria väteatomerbetyder att man kan utvinna vätgas. Den avgörande frågan är då när ljuset eller strål-ningen har precis den energi som behövs.
I detta examensarbete har jag specifikt undersökt vad som händer när man be-strålar vattenmolekyler med röntgenstrålning med olika energi. En röntgenstråle ären mycket intensiv stråle av ljuspartiklar, fotoner. Varje foton bär med sig en litenmen mycket bestämd mängd energi. När en lämplig foton träffar en vattenmolekylkan molekylen ta över fotonens energi. Man säger att vattenmolekylen hamnar i etthögre energitillstånd. När en molekyl har överskottsenergi gör den sig snabbt av medden. Den kan göra sig av med en partikel, ofta en foton eller en elektron. Ibland görsig syreatomen av med en eller båda sina väteatomer. Det experiment som jag hargjort mäter när detta händer och exakt hur fragmenten ser ut.
Experimentet gjordes på forskningsanläggningen MAX-lab. Där kan vi genereraen mycket stark röntgenståle där alla fotoner har den energi som vi bestämmer. Detbetyder att när en vattenmolekyl träffas av fotonen vet vi precis hur mycket över-skottsenergi molekylen får. Vi varierar energin och mäter samtidigt hur molekylenbeter sig. När molekylen gör sig av med en elektron så mäter vi dess hastighet.Samtidigt mäter vi vilka fragment som bildas. Man kan alltså mäta om vi får friaväteatomer eller inte. Farten på elektronen gör att vi kan se hur mycket överskottsen-ergi som finns kvar i fragmenten. All denna information är pusselbitar i ett detekti-
41

varbete där experimentets resultat ska kopplas till teoretiska beräkningar av hur envattenmolekyl sitter ihop. Man kan säga att vi plockar isär vattenmolekylen för attse hur den ser ut på insidan.
Trots att vattenmolekylen är världens mest studerade molekyl så är den fort-farande ett mysterium. Hur kan det komma sig att vatten är det perfekta ämnetför livet här på jorden? Svaren på denna gåta kanske vi i framtiden kan finna när vistuderar dess minsta beståndsdelar, molekyler och atomer.
42

References[1] Empedokles. http://www.ne.se/lang/empedokles, Nationalencyklopedin, 2011-
03-25.
[2] I. Hjelte, M. N. Piancastelli, R. F. Fink, O. Björneholm, M. Bässler, R. Feifel,A. Giertz, H. Wang, K. Wiesner, A. Ausmees, C. Miron, S. L. Sorensen and S.Svensson, Chem. Phys. Lett. 334 (2001) 151-158
[3] R. Feifel, M.N. Piancastelli, J. Electron Spectrosc. Relat. Phenom. 183 (2011) 10
[4] B. H. Bransden and C. J. Joachain (1983), Physics of Atoms and Molecules, (Long-man Scientific & Technical, Harlow, UK)
[5] P. Atkins and R. Friedman (2011), Molecular Quantum Mechanics (fifth edition),(Oxford University Press, Oxford, UK)
[6] H. M. Randall, Rev. Mod. Phys. 10 (1938) 72
[7] R. T. Hall and J. M. Dowling, J. Chem. Phys. 47 (1967) 2454
[8] B. T. Darling and D. M. Dennisson, Phys. Rev. 57 (1940) 128
[9] D. Chattarji (1976), The theory of Auger Transitions, (Academic Press, London,UK)
[10] R. S. Mulliken, J. Chem. Phys. 23 (1955) 1997
[11] D. Attwood (2000), Soft X-rays and extreme ultraviolet radiation : principles andapplications, (Cambridge University Press, Cambridge, UK)
[12] A. Naves de Brito, R. Feifel, A. Mocellin, A. B. Machado, S. Sundin, I. Hjelte,S. L. Sorensen and O. Björneholm, Chem. Phys. Lett. 309 (1999) 377
[13] M. Eroms, O. Vendrell, M. Jungen, H.-D. Meyer and L. S. Cederbaum, J. Chem.Phys. 130 (2009) 154307
[14] A. Lindgren, Ion Spectroscopic Measurements on photo-aligned small molecules,(MediaTryck, Lund University, Lund, 2006), pp. 8-10
[15] H. Siegbahn, L. Asplund and P. Kelfve, Chem. Phys. Lett. 35 (1975) 330
[16] M. N. Piancastelli, A. Hempelmann, F. Heister, O. Gessner, A. Rüdel and U.Becker, Phys. Rev. A 59 (1999) 300
[17] I. Hjelte, M.N. Piancastelli, C.M. Jansson, K. Wiesner, O. Björneholm, M.Bässler, S.L. Sorensen, S. Svensson, Chem. Phys. Lett. 370 (2003) 781
[18] E. Kukk, R. Sankari, M. Huttula, A. Sankari, H. Aksela and S. Aksela, J. Elec-tron. Spectrosc. Rel. Phenom. 155 (2007) 141-147
[19] Direct contact with associate senior lecturer Rami Sankari (MAX-lab, Lunduniversity)
[20] G. C. King, M. Tronc, F. H. Read and R. C. Bradford, J. Phys. B 10 (1977) 2479
43

[21] I. Hjelte, L. Karlsson, S. Svensson, A. De Fanis, V. Carravetta, N. Saito, M.Kitajima, H. Tanaka, H. Yoshida, A. Hiraya, I. Koyano, K. Ueda and M. N.Piancastelli, J. Chem. Phys. 122 (2005) 084306
[22] www.molcas.org
[23] O. Takahashi, M. Odelius, D. Nordlund, A. Nilsson, H. Bluhm and L. G. M.Pettersson, J. Chem. Phys. 124 (2006) 064307
[24] M. Bässler, A. Ausmees, M. Jurvansuu, R. Feifel, J.-O. Forsell, P. de Tarso Fon-seca, A. Kivimäki, S. Sundin, S.L. Sorensen, R. Nyholm, O. Björneholm, S.Aksela and S. Svensson, Nuclear Instruments and Methods in Physics Research A,469 (2001), 382-393
[25] S. Aksela, A. Kivimäki, A. Naves de Brito, O.-P. Sairanen, S. Svensson and J.Väyrynen, Rev. Sci. Instrum., 65 (1994), 831-836
[26] N. Mårtensson, P. Baltzer, P.A. Bruhwiler, J.-O. Forsell, A. Nilsson, A. Sten-borg and B. Wannberg, J. Electron Spectrosc. Relat. Phenom. 70 (1994) 117
[27] F. Schäfers (2008) The BESSY Raytrace Program RAY. In A. Erko, M. Idir,Th. Krist and A. G. Michette (Eds.) Modern Developments in X-ray and NeutronOptics (Springer Verlag, Berlin Heidelberg)
[28] A. Liénard, L’Eclairage Elec. 16 (1898) 5
[29] H. C. Pollock, Am. J. Phys. 51 (1983) 278
[30] T. A. Field and J. H. D. Eland, Meas. Sci. Technol. 9 (1998) 922
[31] W. C. Wiley and I. H. McLaren, Rev. Sci. Instrum. 26 (1955) 1150
[32] M.Huttula, S. Heinasmaki, H. Aksela, E. Kukk and S. Aksela, J. Electron. Spec-trosc. Rel. Phenom. 156-158 (2007) 270-273
[33] E. Purcell, Phys. Rev. 54 (1938) 818
44