electronic course evaluations...experiment because they believe they are helping in the creation of...
TRANSCRIPT

Electronic Course Evaluations at Western Washington University: A Report of the Spring Quarter, 2010 Pilot
OSR Report 2010-03
John M. Krieg Beth Hartsoch
September, 2010
Office of Survey Research Western Washington University

I. Executive Summary Electronic course evaluations are becoming a popular, inexpensive substitute for traditional paper course evaluations. Electronic evaluations are easy to implement, reduce the impact on instructor time, are more uniform in their administration, and can reduce printing and paper costs. Further, some usually unexpected benefits can accrue from electronic evaluations. For instance, students appear to respond in more detail to open ended electronic questions than they would to the same question posed in paper format. While there are clear benefits from electronic course evaluations, there also exist pitfalls. Research suggests students view electronic evaluations as less anonymous thereby bringing into question the validity of student responses. Two other common and related concerns are that electronic course evaluations receive fewer student responses and those who do respond are not representative of the population of enrolled students. Student response rates and the impact of electronic course evaluations on instructor ratings are the focus of this report. The Office of Survey Research (OSR) conducted a controlled pilot of electronic course evaluations during Spring Quarter, 2010. This pilot provided the opportunity to learn about OSR’s ability to implement large scale electronic evaluations and simultaneously investigate the impact of these evaluations relative to traditional paper evaluations. OSR piloted electronic evaluations with 21 WWU instructors teaching 23 different CRNs. Of these 23 CRNs, 3 were part of large, multiple CRN courses whose other CRNs were evaluated with the traditional paper thus providing a control group with which to measure the impact of electronic course evaluations. Seven CRNs were taught by instructors who were simultaneously teaching at least one different section of the same course. These other CRNs serve as a control group. Thirteen CRNs were taught by instructors who taught the same course in a previous quarter; the courses in the prior quarters serve as a control group for these instructors. Student response rates on the electronic evaluations were considerably lower than the response rate in the paper evaluation control groups. 74.2% of enrolled students completed the paper evaluations while 56.8% completed electronic evaluations. This lower response rate is quantitatively consist with the best peer-reviewed research estimate OSR could locate (an estimated decline of about 12%) and qualitatively consistent with the findings of institutional research directors at local colleges and universities. When within-instructor response rates estimates are computed, the student response rate difference rises to almost 20%; thus OSR’s best estimate of the impact of electronic evaluations on student responses is that an additional one-in-five students will choose not to complete an electronic evaluation relative to a traditional paper evaluation. Given that student responses to any evaluation system are voluntary, it is interesting to ask if student participation (or lack thereof) in electronic evaluations is random or systematic. One can think of arguments why a decline in participation is not random. OSR’s electronic evaluations were completed on a student’s own time. Students who felt strongly (either positively or negatively) would be more likely to use their time to complete an evaluation. Students who feel less strongly about a course would be less likely to complete an evaluation. As a result, the student evaluations may become bi-modal. While OSR did not link individual student responses

with the identifying student information, OSR did track responses to specific evaluation questions like question #20 of the teaching evaluation form: “{The} Instructor’s contribution overall to the course was:” Relative to their control groups, the overall variance of responses to this question was considerably larger for electronic evaluations; a result consistent with response distributions becoming more bi-modal. Further, the average electronic response to question #20 was two-tenths of a point lower (on a five point scale) than the paper evaluations. Similar differences occurred in the other questions investigated. In summary, it appears that electronic evaluations reduce response rates by about 20%, reduce the average instructor scores by a small amount (two-tenths of a point), and increase the variance of the responses. While these differences may be attributable to the electronic format, some care should be taken in using these numbers. First, there is a psychological literature on the Hawthorne effect which points out that individuals are more likely to participate in an experiment because they believe they are helping in the creation of knowledge. If this occurred in our pilot, then one might expect even lower response rates after electronic evaluations are adopted. Further, the instructors participating in the experiment may not be representative of the population. If these instructors volunteered to participate because of their enthusiasm for electronic evaluations, then their enthusiasm may have been transmitted to their students thus increasing response rates. A less enthusiastic instructor might receive fewer responses and possibly different ratings in fields like question #20. The remainder of this report documents a list serve discussion regarding electronic course evaluations that took place between members of the Pacific Northwest Association of Institutional Researchers. This discussion involves many local institutions who have experimented or implemented electronic course evaluations. This is followed by a literature review and a complete discussion of the Western Washington University pilot. This report concludes with an estimate of what it would take OSR to implement a campus-wide electronic course evaluation system. To summarize the final section, OSR estimates that it would require a technically skilled employee to spend about 40 hours in initial setup time and about 50 hours per quarter to implement electronic course evaluations. However, this time commitment would serve only to program and e-mail the electronic evaluations to students. Additional time and computing storage space would be needed to store and disseminate results. Of course, these costs may be offset by the elimination of paper surveys. II. Experience of Local Colleges In March, 2010 Anne Marie Karlberg, Director of Institutional Research and Assessment at Whatcom Community College, posted a request to the listserves of the Pacific Northwest Association of Institutional Research and Planning (PNAIRP) and the Washington Association of Research and Planning (WARP) regarding electronic course evaluations. Karlberg asked four questions: What system does your college use for student evaluation of courses and instructors? To what extent are you satisfied with your system? If you recently converted from paper to online, was there a difference in student response rates of paper versus online? If so, what was the difference?

Fifteen individuals (primarily directors of institutional research) responded to Karlberg’s request. These responses were sent to all members of PNAIRP and are reproduced in Appendix A of this report. Of these fifteen, not all schools had experimented with electronic course evaluations so many did not provide answers to the question regarding the differences in student response rates. Those that did consistently claimed that response rates were significantly lower on electronic forms compared to in-class paper forms. Comments like those from Skagit Valley College of “I know that the online response is pretty meager, while we have a fairly good system for administering the on-ground surveys and a good response rate” were common amongst schools which had experimented with electronic methods. One school (Bates Technical College) is considering asking instructors to bring their class to a computer lab to complete their electronic evaluations. Karlberg’s listserve request focused on response rates and did not solicit information regarding the content of the evaluations. From her data, it is unclear if electronic evaluationssystematically alter student responses on the evaluation. This will be a topic of the Western experiment described in section IV. III. Literature Review Online student evaluation of instructional practices has become a widespread practice at many institutions of higher education. Among the major advantages of online evaluation over traditional paper-and-pencil techniques are economic gains (Johnson, 2002), the efficiency and precision of the evaluation tool (McGourty et. al., 2002), and gains dealing with open-ended questions (Goodman and Campbell, 1999). General research on electronic surveys suggests respondents provide more comprehensive answers to open ended questions than what typically occurs in paper surveys (Yun, 2000) which Barkhi and Williams (2010) document specifically in the case of course evaluations. Online evaluations also provide the benefit of standardizing survey administration procedures which often differ dramatically across instructors using traditional paper techniques. Indeed, Orly (1990) reports that after approximately 20 years of using the same administration procedures, his campus had reported violations of survey administration integrity “due to instructors administering the forms as they walked around their classrooms or collecting and reading the evaluations before sending them to the campus office.”1 Electronic surveys, on the other hand, can be administered with little or no involvement of the instructor. While there are substantial benefits to using online evaluations, a number of studies have also documented drawbacks associated with online evaluation of teaching. Several studies have demonstrated that email and web-based questionnaires receive a lower response rate among college students than mailed paper surveys (see Kwak and Radler, 2000) and Arnau, Thompson, and Cook (2001) and Dommeyer, Baum, and Hanna (2002) document this specifically in the case of course evaluations. Further, response rates to electronic surveys have fallen over time (Sheenan, 2001), a possible outcome of survey fatigue or a diminishment of initial novelty of completing electronic evaluations. Low response rates are common (Baum et. al., 2001) and there is evidence suggesting students view electronic evaluations as less anonymous raising the
1 p. 65.

concern that student responses on these evaluations are less candid and revealing than paper evaluations. One of the main concerns of the online method is the potential problem of non-response bias that might result from low response rates. For instance, if only highly satisfied or highly dissatisfied students take the time to complete online evaluations, then one could imagine situations where the mean of an instructor’s ratings remains unchanged while the variance increases. If the non-response occurs in a non-symmetrical manner, then one would expect means to change as well. Complicating matters more, if non-response bias occurs differentially across instructors, then comparing electronic evaluations between instructors becomes highly problematical. Nearly all published research on this subject compares response rates and/or evaluation outcomes by randomly selecting some courses to receive paper evaluations and others to be evaluated electronically. However, this technique can confound the impact of online evaluations with unobserved course or instructor traits. For instance, many studies examine paper results from earlier courses with electronic results from current courses. However, even when the same instructor is examined (which, in the literature is not often), one could expect the electronic results to differ from the paper results not because of the type of evaluation tool used, but instead because the instructor has gained experience over time and this experience changes student ratings. Even comparing paper and electronic tools in courses taught by the same instructor during the same quarter are problematic. It is possible that students non-randomly select into one of the two courses and this selection process alters the evaluations. For instance, if late registering freshmen can only take an instructor’s 8 AM course while earlier registering juniors enroll in the 11 AM course and one of these courses was evaluated electronically, the resulting paper-electronic difference may be the result of class composition differences rather than differences in evaluation techniques. In the only large-scale study identified by OSR that recognizes the importance of randomized comparisons of paper and electronic formats, Layne, DeCristoforo and McGinty (LDM, 1999) randomly selected 66 courses at a large southeastern university and then randomly selected students within each course to complete an electronic or paper evaluation. Since some students within an instructor’s course complete an electronic evaluation while others within the same course complete a paper evaluation, the authors should be able to estimate within-instructor differences in evaluation technique.2 Each evaluation group consisted of about 1,200 students none of whom knew of the electronic experiment until well after the academic quarter was underway. LDM document a decrease in response rates on the electronic survey by 12% and speculate that this difference may be smaller than what would actually occur due to the Hawthorne Effect—that is students knew they were participating in an experiment and, as a result, were more likely to participate. LDM added a question to the evaluation tool that asked respondents to rate their perceptions of anonymity. Students completing the electronic version perceived their evaluation was much less likely to be anonymous than those completing paper evaluations although some students noted that the electronic survey did not allow instructors to recognize handwriting which is part of traditional paper surveys. LDM note that more students completed the open ended response questions on the electronic evaluation relative to the paper
2 Indeed, Layne, Decristoforo, and McGinty neglect this more powerful identification procedure and instead simply make overall comparisons between student completing electronic versus paper evaluations.

evaluation. Interestingly, LDM also note that students with higher grade point averages, students who earned fewer credits, and science students were more likely to respond to electronic evaluations than others. LDM provide conflicting evidence that electronic evaluations alter the actual responses to Likert-scale responses of instructor effectiveness. IV. Western Washington University Experiment Description A. Design In Spring, 2010, the Office of Survey Research was asked to pilot electronic course evaluations using its survey software program, SNAP.3 OSR took the opportunity to use the pilot as a way to compare its electronic course evaluation tool with the traditional paper surveys used on campus. Ultimately, OSR was able to convince 21 instructors to have their course(s) electronically evaluated. Some of these instructors were simultaneously teaching a different section of the same course which was evaluated with paper. Some instructors were teaching large courses and OSR was able to electronically survey a portion of these courses and use paper on the other portion; a sampling technique similar to that used by LDM. All participating instructors had taught the same course in the past which allows OSR to make comparisons between past paper evaluations and Spring, 2010 electronic evaluations. Requests for participation in an electronic course evaluation pilot were initially sent to one entire academic department, to each of the participants in John Farquhar’s electronic experiment4, and to the Vice Provost for Undergraduate Education for distribution to faculty. This solicitation was sent during the first week of spring quarter. A sample of this solicitation appears in Appendix B. Because dealing with the nested instructor structure of lab courses imposes an extra burden on programming the electronic survey software, the call for participation was targeted to faculty teaching non-lab courses. Further, in order to make comparisons with prior paper-based evaluations, faculty were selected only if this was not their first time teaching the electronically evaluated course. As indicated in Appendix B, volunteering for the electronic course evaluation pilot entailed an agreement on the instructors’ part to release evaluation information from courses that were not electronically evaluated. By doing so, instructors provided OSR with an opportunity to make comparisons between the electronic evaluations and traditional paper evaluations. Instructors also agreed to forego issuing paper evaluations to classes which were to be electronically evaluated. OSR worked with the testing center to insure that instructors did not evaluate a single class using both methods. Twenty-one instructors responded to the pilot solicitation and agreed to allow at least one of their courses to be electronically evaluated. In total, 23 different CRNs were evaluated. Of these 23, 6 were from departments in the College of Humanities and Social Sciences and 17 were in the College of Business and Economics. Six CRNs were 200-level courses, 11 were 300-level, 3 400-level, and 3 500-level. Within these 23 CRNs, 898 students were enrolled (CRN mean of 39.04 students, St. Dev. = 22.48)
3 See http://www.snapsurveys.com/us/ for information on SNAP software. 4 John Farquhar conducted a pilot of Blackboard’s electronic course evaluation feature in Fall, 2009 at WWU.

As it turned out, the 23 CRNs which were electronically evaluated can be broken into three groups: 1. Courses taught by an instructor who did not simultaneously teach a different section of the same course. Thirteen CRNs consisting of 369 enrolled students fall into this category. 2. Courses taught by an instructor who simultaneously taught a different section of the same course. Seven CRNs consisting of 432 enrolled students fall into this category. 3. CRNs part of courses that were constituted by multiple CRNs. Three CRNs consisting of 97 enrolled students fall into this category. Of the three groups, the third is the closest to the LDM randomized experiment and thus will provide the best evidence on the impact of electronic evaluations. This group consisted of two instructors who each taught one course that consisted of multiple CRNs. In one case, the course consisted of five CRNs of roughly 40 students each. The only difference between these 5 CRNs is that each met the same TA once per week outside of lecture. Two of these five CRNs were evaluated electronically while the other three were evaluated with the traditional paper evaluations. As students were unaware of the evaluation method when they enrolled for the course, comparing these groups is close to a random experiment. The second instructor taught one class that consisted of two CRNs, one of which was a dedicated “writing proficiency” section while the other was not. In this case, both CRNs met and participated in the course as a unit but one CRN completed the requirements for writing proficiency designation. One obvious limitation of the third group is the very small sample size. The second group expands the sample size by making comparisons across CRNs. To be clear, this group consists of instructors who teach multiple sections of the same course in the same quarter and agreed to have some of their CRNs electronically evaluated. For instance, Professor X may teach two sections of Economics 209; one at 11 AM and one at 1 pm and one of these two sections is electronically evaluated. Overall, OSR electronically evaluated 7 CRNs and, as a comparison group, observed 6 CRNs which were evaluated with paper. In the case of Group #2, OSR randomly assigned CRNs to either be electronically or paper evaluated. In a large experiment, this random assignment should limit the bias resulting from non-random selection into CRNs by students. However, in the case where only 13 different CRNs are observed, this random assignment may not eliminate the possibility that selection bias impacts the results. For instance, if one type of student (perhaps those less likely to complete any evaluation) are more likely to enroll in a section taught by an instructor at noon and if another type of student (who likes completing evaluations) are more likely to enroll in the 8 AM section, and if OSR randomly assigned more noon sections to be electronically evaluated, then one would find electronic evaluation to produce lower response rates than paper evaluations. The first group consists of instructors who agreed to electronically evaluate at least one course in spring, 2010 but did not have another section of the same course during that quarter to evaluate with traditional paper. For these CRNs, the comparisons of electronic evaluation are made against paper evaluations provided by the instructor for the same course taught in a different quarter. For the majority of this group, the course providing the paper evaluation was given in either winter, 2010 or fall, 2009 although there were three CRNs that were evaluated with paper as long ago as spring, 2008.

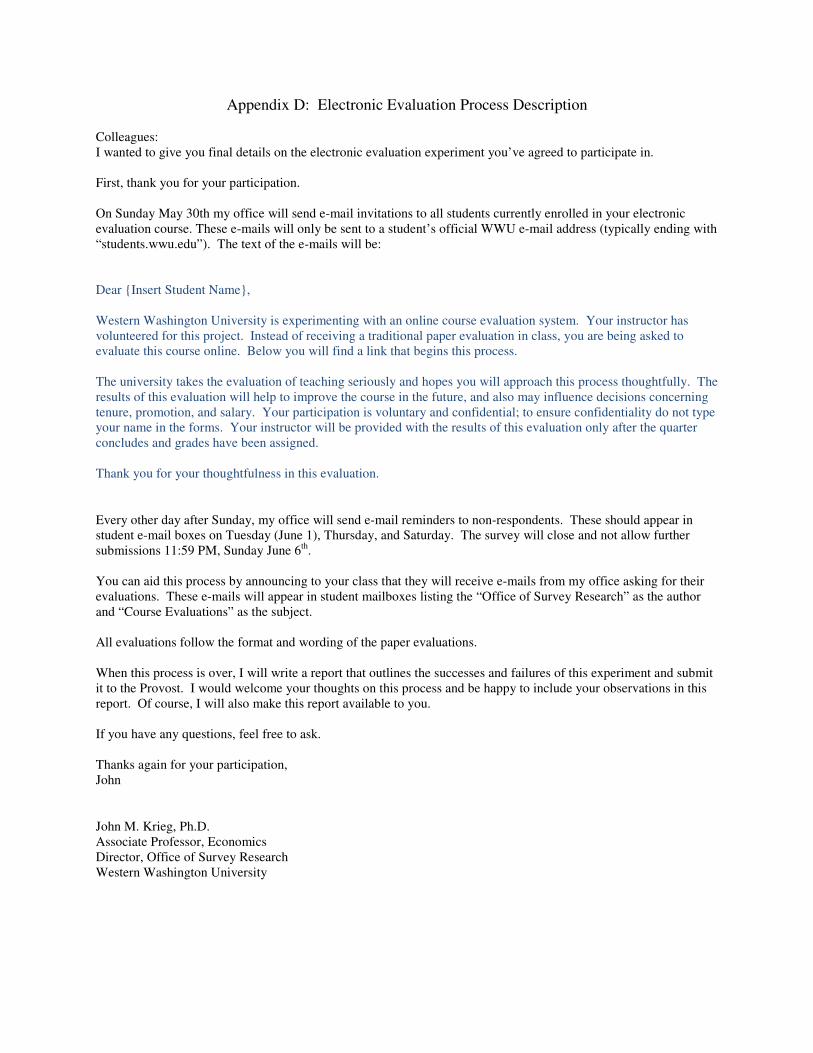
After the initial solicitation for volunteers, OSR planned to contact instructor-participants two additional times. The first of these planned contacts, reproduced in Appendix C, occurred on April 30th when instructors were asked to submit their preferred evaluation form. The electronic evaluation forms asked exactly the same questions, in the same order, as Western’s traditional paper surveys. In order to mimic the paper surveys as precisely as possible, instructors were able to choose their survey form (lettered A through H). Of the 23 CRNs electronically evaluated, seven selected form A, 8 form B, 3 form C, 1 form D, and 4 form E. The third planned contact presented instructors with details as to how the electronic evaluations would be distributed to students (reproduced in Appendix D). This letter encouraged instructors to mention the electronic evaluation procedures to their students prior to the initiation of the evaluation process and provided instructors with the text of the e-mail solicitation students received in connection with their evaluation. It is important to note that this step was very important for this experiment. Instructor endorsement of the electronic survey lends credibility to OSR’s e-mails sent to student soliciting their evaluation. Yet, there was no uniform way of ensuring instructors reminded students that these e-mails would arrive. Thus, lower response to the electronic evaluations may be a result of instructors failing to remind or endorse the experiment with their students. Students were initially contacted at their official Western e-mail address on Sunday, May 30th. Non-respondents were sent e-mail reminders on June 1st, 3rd, and 5th. Because final exam week started on June 7th, the electronic evaluations did not allow further student submissions after 11:59 PM on June 6th. Text of each e-mail sent to students is reproduced in Appendix E. On Monday, May 31st OSR received a number of reports from students and instructors that students were unable to access the electronic evaluations. All students appeared to receive e-mail invitations but some of the links embedded within the e-mail did not take students to the electronic evaluations. Other links worked well (by the end of the day on Monday OSR had recorded over fifty valid responses). It turned out that a programming error caused the electronic survey software to incorrectly join the link to the evaluation to the e-mails sent to some students. OSR corrected this error on 31st and re-sent survey invitations to students on the 1st. In the end, all students received at least three valid e-mail invitations to participate in the electronic evaluations before they closed on June 6th.
B. Response Rates Of the 898 students enrolled in all 23 CRNs that were electronically evaluated, 510 students recorded at least a partial response to the electronic evaluation, a response rate of 56.8%. Eighty-five additional students opened the e-mail link but failed to provide a response to any evaluation question. Among the paper-survey observations of CRNs from groups one, two and three are 33 observations of CRNs that consist of 1,277 enrolled students of which 947

completed paper surveys; a response rate of 74.2%.5 At face value, this confirms the findings of LDM’s research that electronic course evaluations have less student participation than in-class, paper evaluations. However, aggregating response rates across all CRNs neglects relevant information that may improve estimates of the impact on response rates of electronic versus paper surveys. A better comparison of response rates would be between students within the same class (Group 3), between students taking the same class from the same professor during the same quarter (Group 2), and between students taking the same class from the same professor during different quarters (Group 1). These comparisons are produced in Table 1 and demonstrated graphically in Figures 1 through 3. Response rates on electronic evaluations were statistically significantly lower than paper response rates for both Groups 1 and 2. For the same course taught at different times (Group 1), the electronic response rate was 15.5% lower (about one in every six enrolled students) than paper surveys. The within-quarter comparison group (Group 2), presented a rate decrease of about twice as much. For Group 2, electronic evaluations were recorded by almost half of enrolled students whereas paper responses were recorded by nearly 80% of students.6 Only for Group 3, which was composed of two instructors teaching a total of 5 CRNs, did it appear that electronic evaluations produced an improved response rate over the paper version. While this group presents the closest to a natural experiment, its small number of observations prevents one from concluding that the electronic version improves responses above that of the paper version. Response rates could be driven by other factors than just the identity of an instructor. For instance, students may be more likely to evaluate a 400-level course than a 200-level one. To better estimate the impact of electronic evaluations on response rates, consider the grouped logit (glogit) model:
(1) Prob(Completei = 1) = ������������ � ����
�������������� � ����
where Completei equals one if a student completed an evaluation, 0 otherwise; electronic is a binary variable equaling one if the CRN was evaluated electronically, 0 otherwise; and Zi is a matrix of other observables that might explain response rate. The variable of interest in this equation is β1 which provides the impact on response rates of being in a course that is electronically evaluated.7 Table 2 presents various estimates of equation (1) by altering the components of Z.
5 A calculation of the university-wide response rate is difficult. During the spring, 2010, there were 46,228 enrolled spaces occurred that were state-funded on the Bellingham campus. The testing center received a total of 27,645 course evaluations. 6 The reader may notice in the first chart of Figure #2 that instructor #19 appears to be an outlier which may significantly reduce the calculated response rate for electronic surveys. Indeed, one weakness of the electronic method is that if an instructor did not apprise their students that it was coming via e-mail, students would be unlikely to respond to OSR’s solicitation. While OSR does not know if that was the case for instructor #19, we have omitted instructor #19’s observations from Group 2 and recalculated the response rate. When this is done, the response rate of the electronic survey rises to 56.0% and the paper response rate falls to f77.0%. The difference in these rates remains statistically significant. 7 Technically, β1 represents the change in the log odds ratio of completing an evaluation. However, because most people are used to thinking in terms of percentages of students who respond, I convert the log odds ratio into the percent impact assuming all other characteristics are at average levels.

Model #1 of Table 2 simply estimates equation (1) without including any covariates in Z. This amounts to estimating the difference in response rates of electronic and paper surveys. The marginal impact presented for this model in Table 2 of -17.4% is identical to the differences in response rates of the total sample presented in Table 1. Because one might expect response rates to differ across course levels, Model #2 adds three binary variables for 300-, 400-, and 500-level courses. The very small increase in magnitude of the electronic marginal effect to -17.6% suggests that course level had little impact on response rates. A second possible concern involves department-level differences. If students in one department are more (or less) likely to complete any evaluation and if this department happened to be over- (or under-) represented in the electronic sample, then one would expect the marginal effects to be biased. However, including departmental binaries in Model #3 also changes the marginal effects only slightly suggesting that non-random departmental effects are not a concern. The final two rows of Table 2 make use of the experimental nature of the data. Model #4 controls for instructor fixed effects. The interpretation of the marginal effects in this case are best thought of as “within instructor” impacts. Said another way, the marginal effects in this case measure the impact of electronic evaluations versus paper evaluations by comparing response rates of electronic classes and paper classes taught by the same instructor. In reference to Figures 2 through 4, this estimator compares the response rates of the red and black observations of the same instructor number. In essence, this estimator eliminates the instructor-specific effect on response rates. Yet, even after controlling for these, it appears that electronic evaluations receive 18.2% lower response rates than paper evaluations. The final row of Table 2 augments Model #4 by controlling for the presence of the two large courses in Group #3 which had some students evaluated electronically and others with paper. Like the estimator of Model #4, this makes a within-instructor comparison of response rates but further controls for the fact that the two instructors of Group #3 had their unique experimental setup. The marginal effect of -18.6% is large in nature, statistically significant, and given the relatively small numbers of participating CRNs, the best estimate of the impact of electronic evaluations on the response rate. Given that about one out of five additional enrolled students choose not to perform electronic course evaluations, it is important to determine if electronic course evaluations alter the actual ratings of individual courses. This is the subject of the next section. C. Outcomes As is clear from the preceding section, electronic evaluations reduce student response rates relative to paper evaluations. However, if the reduction in response rates occurs randomly across students, the remaining electronic evaluations would provide the same information and ratings as paper evaluations. On the other hand, there are good reasons to believe that respondents to electronic evaluations non-randomly self-select into evaluations. For instance, a student who feels strongly, either positively or negatively, about their course experience is very likely to complete an evaluation. A less passionate student may take the time to complete an in-course

paper evaluation but may be less likely to respond to an e-mail request to take an electronic survey outside of class. Some testable hypotheses exist consistent with the non-random self-selection situation. If only strongly positive or strongly negative students complete electronic evaluations, then one would expect the distribution of responses to questions of course satisfaction to have greater variance than when all students complete an evaluation. In short, if non-respondents fail to respond because they neither are highly satisfied or very dissatisfied, their non-response removes the middle of the satisfaction distribution leaving only observations on the tails. Interestingly, in this case, the average level of satisfaction may be the same in both cases; under plausible conditions the removal of the center of the distribution would not impact the mean of the remaining distribution. However, removing the middle of the distribution will increase its variance. Thus, one method to see if this occurs is to compare the variance of the distributions between the electronic and paper groups. To investigate the impact of electronic evaluations on student responses, we focus on question #20 of the teaching evaluation form: “{The} Instructor’s contribution overall to the course was:” This question is worded identically across all different evaluation form types and has the response options of excellent (5), very good (4), good (3), fair (2), poor (1), very poor (0). Figure 3 presents the distribution of answers to this question for both paper and electronic forms for Group #1. As a reminder, this group consists of instructors who evaluated their courses electronically in spring, 2010 and used a paper evaluation when teaching the same course in a different quarter. Of the 13 different instructors, all but three (Instructors #9, #12, and #18) received a greater proportion of responses at the low end of the contribution scale when surveyed electronically than they did when paper was used. All but four received fewer ratings of excellent when using the electronic version than the paper version. Table 3 formalizes Figure 3 by presenting two statistical tests. The first test focuses on the mean response to Question #20. For Group #1, only one instructor (#5) had a statistically different average on electronic evaluations relative to paper evaluations. In this case, the paper mean was more than one point higher than the electronic mean. However, for all but three of the instructors, the average to Question #20 was higher (though not statistically different) when paper evaluations were used. When all students from Group #1 instructors are pooled, the average to Question #20 was about two-tenths of a point higher on paper evaluations. This suggests that moving to electronic course evaluations will lower instructor ratings but not so much as to be noticeable when comparing one class to another and only noticeable when examining multiple courses over time (or, untested here, very large courses). In other words, a particular instructor will be unlikely to note that a given electronic course is below their long-term paper mean but, after many electronic evaluations are given, that instructor will notice lower scores. The second test presented in Table 3 is an F-test of common variances. For the thirteen Group #1 instructors, all but two had higher variances in student responses to Question #20 under electronic evaluations. Of the eleven with higher variances, four were statistically different at the 95% level and only one of the instructors presented a case where the paper version had a statistically higher variance than their electronic experience. When all students of these instructors are aggregated, the standard deviations are about 20% larger under electronic evaluations.

Figure 4 and the bottom two panels of Table 3 repeat this exercise for faculty groups #2 and #3. As a reminder, Group #2 compares paper and electronic courses that were both taught in spring, 2010 and Group #3 compares paper and electronic systems used within the course. With respect to average scores on Question #20, paper respondents scored instructors higher in four of seven opportunities and half of these are statistically significant. Aggregating all students again suggests that paper evaluations generate higher instructor scores. Similarly, four courses had a larger variance when the electronic evaluations were used of which two differed statistically. Each of the 7 different evaluation forms used by the testing center share the same three questions: Question #18 (The course overall was:), Question #19 (Instructor’s effectiveness in teaching the subject matter was:) and Question #20. To check to see that the decreased mean and increased variance is not an artifact of Question #20, Table 4 reproduces the aggregated results of Table 3 for Questions #18 and #19. For both questions, electronic averages were statistically lower and had statistically greater variances than those recorded on the paper forms. D. Experiment Conclusions From the electronic experiment conducted at Western during the spring of 2010, it appears very clear that response rates to electronic course evaluations fall relative to paper evaluations. This decline is consistent with the LDM’s formal research and the anecdotal evidence provided by the PNAIRP/WARP researchers who have examined this issue. While a best guess at the decline in the response rate in Western’s experiment is about 20%, one should take care when extrapolating this to the future if Western commits to an electronic evaluation system. A number of participating instructors expressed enthusiasm for electronic evaluations (perhaps this is why they volunteered for the experiment). If instructor enthusiasm for course evaluations was transmitted to their students, then perhaps more students participated in the electronic version than would when less enthusiastic instructors promoted electronic evaluations. Further, there may be some novelty associated with evaluating your class electronically which caused some students to complete the evaluation just to see what it was like. As this novelty wears off, one might see a further decline in response rate. On the other hand, if Western commits to forming student culture in a way that promotes the importance of course evaluations, then one might find response rates rise or at least decline a smaller amount than found here. The evidence presented in Tables 3 and 4 and Figures 3 and 4 suggest that electronic evaluations tend to lower instructor ratings and increase their variance. One simple explanation incorporates the observed lower response rates. Unlike the captive-audience quality of paper evaluations, electronic evaluations are completed by students on their own time outside of class. Because this imposes a cost on students, one might expect only students who believe the benefit of doing the evaluation exceeds this cost would complete the evaluation. Those who see a low benefit in completing the evaluation would not do so and a lower response rate would result. However, if those with low perceived benefits of completing the evaluation are not representative of their classmates, there will be systematic differences in the submitted responses. For instance, a highly satisfied student may believe the benefit of telling others of their course experience is high. Likewise, a very dissatisfied student may believe the benefit of telling others is also high.

Both of these students would be likely to complete the evaluation. On the other hand, a student whose experience was average may think that telling others about an average experience would not provide much benefit and hence choose to not complete the evaluation. If this occurs, one would expect the resulting instructor evaluations to be composed of a greater percentage of highly satisfied and highly dissatisfied students than a captive-audience paper evaluation. Interestingly, under the scenario where more highly satisfied and highly dissatisfied students complete an electronic evaluation, the electronic evaluation results would show a higher standard deviation; which is exactly what is observed in the experiment. If slightly more highly dissatisfied students complete evaluations than highly satisfied ones, then the mean on electronic evaluations would be expected to fall as well. While the data presented in Tables 3 and 4 is consistent with the explanation that students in the middle of the distribution are less likely to complete the evaluation, one can think of other possible explanations which could produce similar results. First, little is known about student thinking when completing evaluations, either paper or electronic. If students believed that instructors were more or less likely to identify individual students in an electronic framework, then one might see differences in responses. For instance, if students believe it is less likely that an instructor can identify their responses on an electronic survey, they may respond more negatively than they would on a paper survey. A second potential explanation is instructor cheating. Under the paper survey regime, instructors have wide latitude when and how to administer course evaluations. If instructors game the system by administering evaluations to students when some students are missing, or if they did something perceived by students as particularly fun on evaluation day, one might expect to see paper evaluations score higher than electronic evaluations which, in the experiment’s case, were available to students at their, and not the instructor’s, convenience. From a statistical viewpoint, the lower mean of electronic evaluations may not be an important problem. If the culture of the university adjusts to expect course evaluations centered two-tenths of a point lower under electronic regimes, then there is little impact of the lower means. However, if the university were to use a dual paper and electronic system, one would take care in comparing the results of each. A more important statistical problem occurs because of the lower response rate. Ignoring for the moment the increased variance of responses, the fact that the response rate falls by about 20% results in each evaluation containing less statistical information. For instance, consider two 30 student courses each of whom answer Question #20 with an instructor average of 4.00. The first course was sampled with paper and the second course was sampled electronically and, as a result, had a 20% lower response rate; in this case 6 fewer students responded. If everything else is identical between these courses, the standard deviation of the Question #20 average in the electronic course will be 12% higher than that of the paper course. Put another way, an evaluator of the instructor will construct a confidence interval of the instructor’s true value of Question #20 that is about 12% larger because that instructor used electronic course evaluations. Of course, this ignores the fact that electronic evaluations also appear to naturally generate higher standard deviations. If we assume that the overall increase in standard deviations represented in Table 3 is correct, then it appears that a better approximation is that electronic course evaluations are about 20% less precise than paper ones.

V. Implementing Electronic Evaluations at Western OSR was originally tasked with piloting electronic evaluations because it uses a survey software system, SNAP Surveys, to conduct its surveys of students, alumni, and community members. In addition to its standard survey features, SNAP surveys can also be programmed to conduct course evaluations. Snap Surveys is a survey software package that is designed to handle course evaluations in addition to its primary purpose of designing, publishing, and hosting surveys in a variety of formats. Snap Surveys software is comprised of two applications, a network installation including a thick client application and a network license server, and a web server application. The thick client application, Snap Professional, is installed on client machines via the network, and accesses a license file installed on a server. OSR is currently working with Susan Brown in ATUS Software Services to make Snap Professional available by authorization on the X: drive, and to serve the license from there. The web application, WebHost, is installed on a Western web server and is responsible for hosting and managing Snap web surveys. There is no additional charge to Western to operate Snap Professional and Snap Webhost. Our maintenance agreement, which grants access to software updates and technical support, is valid through approximately March of 2011. Western could choose to purchase additional time on the maintenance agreement, in yearly increments, for approximately $2500 per year but the purchase (or lack thereof) of the maintenance agreement does not preclude anybody on campus from utilizing Snap. As designed, Snap handles course evaluations with an iterative survey. The first question in the survey is a multiple-response question containing a list of all courses to be evaluated that quarter. This question is seeded by OSR during the design phase of the evaluation process and is not viewed by the student during the evaluation process. The data uploaded to the survey comprises one case per student, and has columns for courses 1 through n, where n = maximum number of courses taken by a single student that quarter. The columns are populated with the courses each student is registered, and remaining columns are blank. The survey iterates based on the number of responses seeded in the first question. The second question is a single-response question with the same response options as the first question. It is masked based on the first question, so only courses seeded in the first question are shown in the second question. At the beginning of each iteration, the student chooses one of the courses in this list to evaluate. In subsequent iterations, courses already evaluated are eliminated from the list. After evaluating the last course the student is routed to a submission page and then to an external webpage (such as Western’s website) specified by OSR. There are two options for setting up data collection with Snap. The first option is to construct a single survey form containing a database of course/instructor combinations with associated form choices, and another of students with the courses in which they enrolled that quarter. The survey will list a student’s courses at the outset, and the student will choose a course to review and be branched to the appropriate form questions, iterating through until all courses are reviewed. This survey contains all questions asked on every form, but only shows the questions for the form chosen by the instructor of the course the student is evaluating. All other questions are hidden for that iteration.
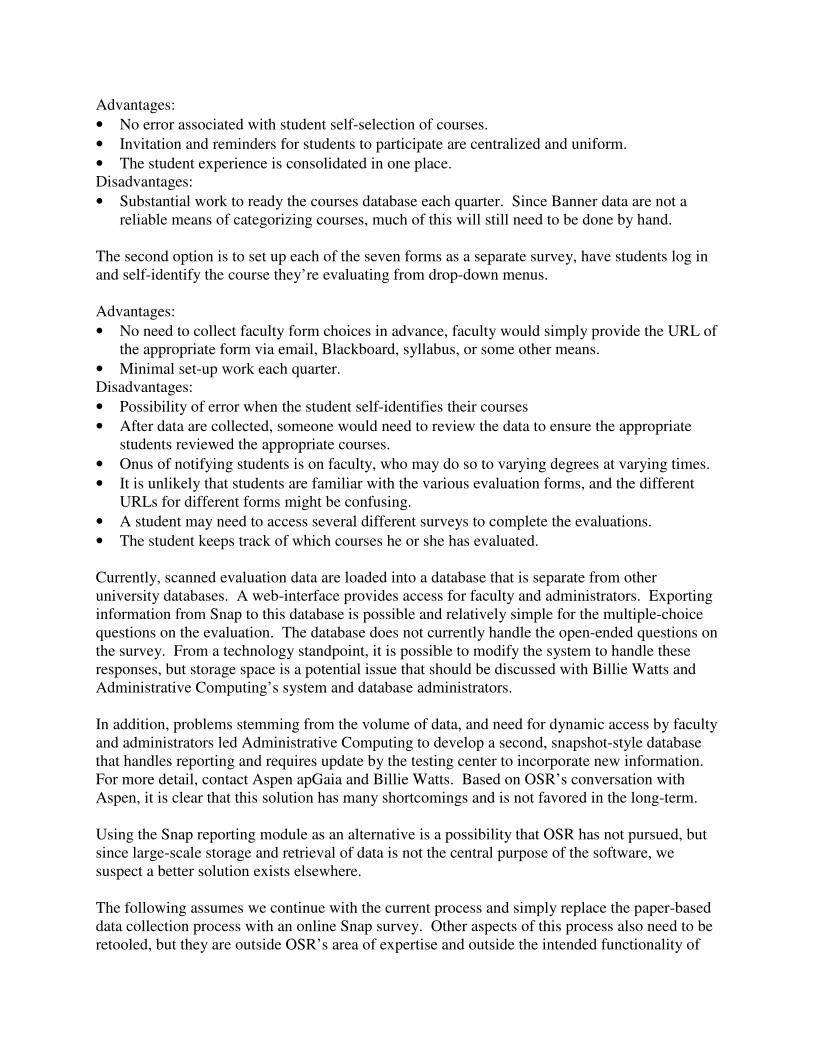
Advantages:
• No error associated with student self-selection of courses.
• Invitation and reminders for students to participate are centralized and uniform.
• The student experience is consolidated in one place. Disadvantages:
• Substantial work to ready the courses database each quarter. Since Banner data are not a reliable means of categorizing courses, much of this will still need to be done by hand.
The second option is to set up each of the seven forms as a separate survey, have students log in and self-identify the course they’re evaluating from drop-down menus. Advantages:
• No need to collect faculty form choices in advance, faculty would simply provide the URL of the appropriate form via email, Blackboard, syllabus, or some other means.
• Minimal set-up work each quarter. Disadvantages:
• Possibility of error when the student self-identifies their courses
• After data are collected, someone would need to review the data to ensure the appropriate students reviewed the appropriate courses.
• Onus of notifying students is on faculty, who may do so to varying degrees at varying times.
• It is unlikely that students are familiar with the various evaluation forms, and the different URLs for different forms might be confusing.
• A student may need to access several different surveys to complete the evaluations.
• The student keeps track of which courses he or she has evaluated. Currently, scanned evaluation data are loaded into a database that is separate from other university databases. A web-interface provides access for faculty and administrators. Exporting information from Snap to this database is possible and relatively simple for the multiple-choice questions on the evaluation. The database does not currently handle the open-ended questions on the survey. From a technology standpoint, it is possible to modify the system to handle these responses, but storage space is a potential issue that should be discussed with Billie Watts and Administrative Computing’s system and database administrators. In addition, problems stemming from the volume of data, and need for dynamic access by faculty and administrators led Administrative Computing to develop a second, snapshot-style database that handles reporting and requires update by the testing center to incorporate new information. For more detail, contact Aspen apGaia and Billie Watts. Based on OSR’s conversation with Aspen, it is clear that this solution has many shortcomings and is not favored in the long-term. Using the Snap reporting module as an alternative is a possibility that OSR has not pursued, but since large-scale storage and retrieval of data is not the central purpose of the software, we suspect a better solution exists elsewhere. The following assumes we continue with the current process and simply replace the paper-based data collection process with an online Snap survey. Other aspects of this process also need to be retooled, but they are outside OSR’s area of expertise and outside the intended functionality of

Snap software. This also assumes we use the consolidated, single-survey method with email invitations.
Initial Setup – 40 hours
1. Automate via script/code: a. retrieval of faculty form choices, - 4 hours b. download of student/course sample, and 8 hours c. download of course information 6 hours
2. Design and construct survey – 10 hours 3. Design and construct reporting and data export – 6 hours 4. General troubleshooting – 6 hours
Quarterly Implementation – 50 hours
1. Notify faculty of form choice procedure and deadline - 2 hours 2. Collect faculty form choice information via existing Testing Center web form - 2 hours 3. Assemble student data file student/course sample – 8 hours 4. Assemble course information file – 4 hours 5. Assemble database file with student/course/form information for upload into survey – 8
hours 6. Revise survey with current course and form choice information - 4 hours 7. Write and schedule invitations and reminders to be emailed to students – 4 hours 8. Export and clean data – 4 hours 9. Create reports of open-ended responses (paper? Electronic file for email?) – 8 hours 10. Review data in the reporting database to ensure no error was introduced in the conversion
process – 4 hours 11. Notify faculty of available reporting – 2 hours
Estimating the dollar costs involved for OSR to assume these responsibilities is difficult. Currently, OSR is staffed by a 10-month one-third time director, a one-half time management analyst 3, and a one-half time research analyst 3. As currently scheduled, these three OSR employees do not have the time to add 50 additional hours of work per quarter to conduct electronic course evaluations. Further, the 10-month nature of the director’s contract would preclude supervision during administration of summer evaluations. If the University chooses to use electronic course evaluations, OSR could conduct them if provided additional support. Ideally, an individual with strong computer and statistical skills could learn SNAP and implement a university wide electronic course evaluation system. The University should also be aware that other, unanswered questions exist which may impact the estimates of time needed to proceed to electronic evaluations. Currently the Testing Center has a process for identifying which forms are used to evaluate an instructor’s course. Ideally, this would be incorporated into an electronic system but SNAP has the ability to read data created by other applications. Regardless of who identifies the forms, this task will still need to be done. One possibility is to create a field in Banner that has a default course evaluation form for each course which faculty can override only if necessary.

The existing electronic reporting of the paper surveys includes only the multiple-choice data and not the open ended student responses. One advantage of electronic evaluations is the open ended data can be encoded and reported easily. However, to do this Administrative Computing would need to rewrite the programs which make this data available to instructors. Further, all of the evaluation data, both open-ended and multiple choice, will require a large amount of computer storage space if one hopes to save this data in a central location. Alternatively, one could print the open-ended responses (presumably in a much smaller format than one response per page) and distribute these to instructors. A budget would be needed for printing and distribution.

Bibliography
Arnau, H.M., R.L. Thompson, and C. Cook (2001) Do different response formats change the latent structure of responses? An empirical investigation using taxometric analysis. Educational
and Psychological Measurement. Barkhi, R. and P. Williams (2010) the impact of electronic media on faculty evaluation. Assessment and Evaluation in Higher Education. Baum, P., Chapman, K.S., Dommeyer, C.J., and Hanna, R.W (2001) Online versus in-class student evaluations of faculty, paper presented at the Hawaii Conference on Business. Dommeyer, C.J., P. Baum, K.S. Chapman, and R.W. Hanna (2002) College student’s attitudes toward methods of collecting teaching evaluations: In class vs. online. Journal of Education for
Business. Goodman, A. and M. Campbell (1999) Developing appropriate administrative support for online teaching with an online unit evaluation system, paper presented at the International Symposium
on Intelligent Multimedia and Distance Education. Johnson, T. (2002) Online student ratings: will students respond?, paper presented at the Annual
Meeting of the American Educational Research Association. Kwak N. and Radler B.T. (2000) Using the web for public opinion research: a comparative analysis between data collected via mail and the web, paper presented at the Annual Meeting of
the American Association for Public Opinion Research. Layne, B.H., DeCristoforo, J.R., and McGinty, D. (1999) Electronic versus traditional student ratings of instruction, Research in Higher Education. McGourty, J., Scoles, K. and Thorpe, S.W. (2002) Web-based student evaluation of instruction: promises and pitfalls, paper presented at the Forty-second Annual Forum of the Association for
Institutional Research. Orly, J. (1990) Student ratins of instruction: Ethics and Practice. In M. Theall and J. Franklin (eds.) Student Ratings of Instruction: Issues for Improving Practice, San Francisco: Jossey-Bass. Sheenan, K. (2001) Email survey response rates: a review, Journal of Computer Mediated
Communication. Yun, G.W. and Trumbo G.W. (2000) Comparative response to a survey executed by post email and web form, Journal of Computer Mediated Communication.

Table 1: Enrollment, Responses, and Response Rate by Evaluation Group # of
Electronic CRNs
# of Paper CRNs
# of Electronic Students Enrolled
# of Paper Students Enrolled
# of Electronic Responses Received
# of Paper Responses Received
Electronic Response
Rate
Paper Response
Rate Group 1 13 23 369 844 225 646 61.0% < 76.5% Group 2 7 6 432 308 215 243 49.8% < 78.9% Group 3 3 4 97 125 70 58 72.2% > 46.4% Total 23 33 898 1277 510 947 56.8% < 74.2%
Notes: < and > indicate statistically significant differences at the 95% level.
Figure 1: Responses and Enrollment of Group #1
Notes: Numbers represent individual instructors teaching a unique CRN. Black represents paper surveys and red represents electronic surveys. Dashed lines indicate OLS best fit lines. The blue line represents the 45˚ (enrollment = response) line.
0 10 20 30 40 50 600
10
20
30
40
50
60
1
2
3
4
5
9
12
13
14
15
18
20
21
1
2
3
4
5
9
12
13
14
15
18
20
21
Enrollment
Num
ber
of
Respo
nses

Figure 2: Responses and Enrollment of Groups #2 and #3
Notes: Numbers represent individual instructors teaching a unique CRN. Black represents paper surveys and red represents electronic surveys. Dashed lines indicate OLS best fit lines which, because of so few observations, are omitted for Group #3. The blue line represents the 45˚ (enrollment = response) line.
0 20 40 60 80 100 1200
20
40
60
80
100
120
17
7
16
10
19
67
17
7
19
610
16
Enrollment
Nu
mb
er
of R
esp
onses
Group #2
0 20 40 60 80 100 1200
20
40
60
80
100
120
1111
8
8
11
11
11
Enrollment
Num
ber
of R
esponses
Group #3

Table 2: Glogit Estimates of the Marginal Impact of Electronic Evaluation on Response Rates
Model #
Z Marginal Impact of
Electronic Evaluation
1 None -17.4%*** 2 Binary indicators for 300-, 400-, and 500-level courses -17.6%*** 3 Binary indicators for department -19.4%*** 4 Instructor Fixed Effects -18.2%*** 5 Instructor Fixed Effects and binary for Group #3 -18.6%*** Notes: *** indicates statistical significance at the 99% level. Notes: >, < indicate a statistically significant difference tested at the 95% level.
Table 3: Means and Variances of Responses to Question 20, by Instructor Instructor
ID Paper Mean
Electronic Mean
Paper St. Dev.
Electronic St. Dev.
Group #1 1 4.67 = 4.20 .594 = .861 2 4.30 = 3.94 .864 = .966 3 4.83 = 4.70 .408 = .483 4 4.75 = 4.56 .493 < .727 5 4.69 > 3.54 .478 < 1.26 9 4.23 = 4.33 .438 = .5
12 4.35 = 4.67 1.017 > .651 13 4.18 = 4.07 .716 < 1.10 14 4.86 = 4.64 .363 < .674 15 5 * 4.84 0 * .375 18 4.28 = 4.55 1.24 = .820 20 4.53 = 4.23 .662 = .883 21 4.04 = 3.91 .888 = 1.08
Group #1 4.46 > 4.24 .778 < .956 Group #2
6 4.13 = 4.26 1.06 = .931 7 4.13 > 3.59 .972 < 1.27
10 3.94 = 4.06 1.19 = .885 16 4.38 = 4.27 .804 = .883 17 4.19 = 4.59 .906 = .856
Group #2 4.19 = 4.07 .924 < 1.09 Group #3
8 4.57 = 3.91 .534 = .831 11 4.58 > 4.15 .537 < .867
Group #3 4.58 > 4.11 .532 < .860 Overall 4.36 > 4.14 .834 < 1.00

Figure 3: Distribution of Question 20, by Instructor for Group #1
Notes: Black distribution represents paper survey responses. Red distribution represents electronic responses. X-axis values correspond to evaluation measures with 5 indicating excellent, 4 very good, 3 good, 2 fair, 1 poor, and 0 very poor. Y-axis values represent the fraction of respondents who chose a particular response.
1 2 3 4 50
0.2
0.4
0.6
0.8
1
P-Mean=4.67, E-Mean=4.2
Instructor #1
1 2 3 4 50
0.2
0.4
0.6
0.8
1
P-Mean=4.3, E-Mean=3.94
Instructor #2
1 2 3 4 50
0.2
0.4
0.6
0.8
1
P-Mean=4.83, E-Mean=4.7
Instructor #3
1 2 3 4 50
0.2
0.4
0.6
0.8
1
P-Mean=4.75, E-Mean=4.57
Instructor #4
1 2 3 4 50
0.2
0.4
0.6
0.8
1
P-Mean=4.69, E-Mean=3.54
Instructor #5
1 2 3 4 50
0.2
0.4
0.6
0.8
1
P-Mean=4.23, E-Mean=4.33
Instructor #9
1 2 3 4 50
0.2
0.4
0.6
0.8
1
P-Mean=4.35, E-Mean=4.67
Instructor #12
1 2 3 4 50
0.2
0.4
0.6
0.8
1
P-Mean=4.18, E-Mean=4.07
Instructor #13
1 2 3 4 50
0.2
0.4
0.6
0.8
1
P-Mean=4.86, E-Mean=4.64
Instructor #14
1 2 3 4 50
0.2
0.4
0.6
0.8
1
P-Mean=5, E-Mean=4.85
Instructor #15
1 2 3 4 50
0.2
0.4
0.6
0.8
1
P-Mean=4.28, E-Mean=4.55
Instructor #18
1 2 3 4 50
0.2
0.4
0.6
0.8
1
P-Mean=4.53, E-Mean=4.23
Instructor #20
1 2 3 4 50
0.2
0.4
0.6
0.8
1
P-Mean=4.04, E-Mean=3.91
Instructor #21

Figure 4: Distribution of Question 20, by Instructor for Groups #2 and #3 Group #2
Group #3
Notes: Black distribution represents paper survey responses. Red distribution represents electronic responses. X-axis values correspond to evaluation measures with 5 indicating excellent, 4 very good, 3 good, 2 fair, 1 poor, and 0 very poor. Y-axis values represent the fraction of respondents who chose a particular response.
0 1 2 3 4 50
0.2
0.4
0.6
0.8
1
P-Mean=4.13, E-Mean=4.26
Instructor #6
0 1 2 3 4 50
0.2
0.4
0.6
0.8
1
P-Mean=4.13, E-Mean=3.59
Instructor #7
0 1 2 3 4 50
0.2
0.4
0.6
0.8
1
P-Mean=3.94, E-Mean=4.06
Instructor #10
0 1 2 3 4 50
0.2
0.4
0.6
0.8
1
P-Mean=4.38, E-Mean=4.27
Instructor #16
0 1 2 3 4 50
0.2
0.4
0.6
0.8
1
P-Mean=4.19, E-Mean=4.59
Instructor #17
0 1 2 3 4 50
0.2
0.4
0.6
0.8
1
P-Mean=4.24, E-Mean=4.08
Instructor #19
1 2 3 4 50
0.1
0.2
0.3
0.4
0.5
0.6
0.7
0.8
0.9
1
P-Mean=4.57, E-Mean=3.91
Instructor #8
1 2 3 4 50
0.1
0.2
0.3
0.4
0.5
0.6
0.7
0.8
0.9
1
P-Mean=4.58, E-Mean=4.15
Instructor #11

Table 4: Overall Means and Variances of Selected Evaluation Questions # Question Paper
Mean Electronic
Mean Paper St.
Dev. Electronic
St. Dev. Q18 The overall course was: 4.09 > 3.86 .900 < 1.10 Q19 Instructor’s effectiveness in teaching
the subject matter: 4.26 > 4.03 .871 < 1.07
Q20 Instructor’s contribution overall to the course:
4.36 > 4.14 .834 < 1.00
Notes: >, < indicate a statistically significant difference tested at the 95% level.
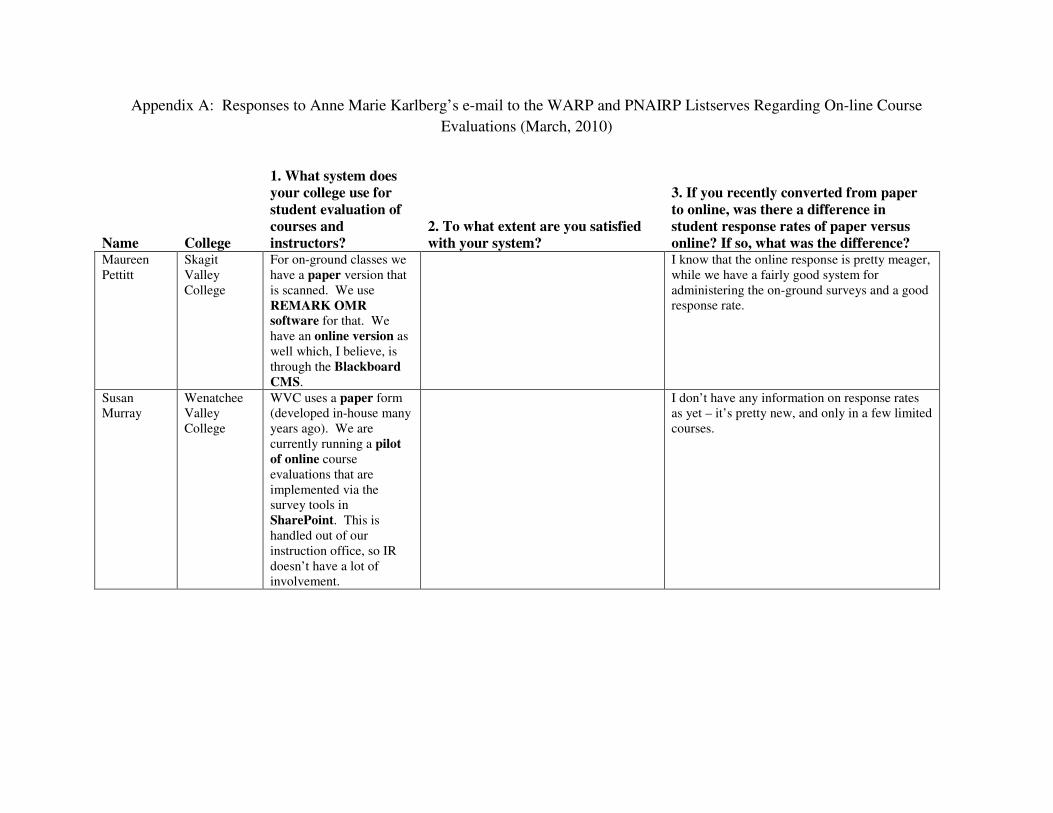
Appendix A: Responses to Anne Marie Karlberg’s e-mail to the WARP and PNAIRP Listserves Regarding On-line Course
Evaluations (March, 2010)
Name College
1. What system does
your college use for
student evaluation of
courses and
instructors? 2. To what extent are you satisfied
with your system?
3. If you recently converted from paper
to online, was there a difference in
student response rates of paper versus
online? If so, what was the difference? Maureen Pettitt
Skagit Valley College
For on-ground classes we have a paper version that is scanned. We use REMARK OMR software for that. We have an online version as well which, I believe, is through the Blackboard
CMS.
I know that the online response is pretty meager, while we have a fairly good system for administering the on-ground surveys and a good response rate.
Susan Murray
Wenatchee Valley College
WVC uses a paper form (developed in-house many years ago). We are currently running a pilot
of online course evaluations that are implemented via the survey tools in SharePoint. This is handled out of our instruction office, so IR doesn’t have a lot of involvement.
I don’t have any information on response rates as yet – it’s pretty new, and only in a few limited courses.

Darryl Dieter
Everett Community College
At Everett, we use the IDEA course evaluation system. This is not an online evaluation, but instead a paper and pencil evaluation on a Scantron-like sheet, which we send via USPS and receive hardcopy reports in return for each instructor and each class.
We adopted this system about seven years ago and we're quite happy with it. One of the things that we find most valuable is that there are questions that link the instructors' identified course objectives with student responses that report gains in those particular objectives. Additionally, students report the frequency with which an instructor used a variety of teaching methods, and each teaching method is linked with different course objectives. If you would like further information take a look at this URL: http://www.theideacenter.org/
Daniel Kmitta
Argosy University
Argosy University is using IDEA out of Kansas State University.
Michael Moon
Willamette University
Class Climate /
Scantron: all paper
Mostly - would like ability to export data and create various adhoc reports
All paper
Summer Kenesson
Bates Technical College
We have started to roll in
Survey Monkey. The students like it, some instructors like it, it is certainly easy to use (although downloading reports to include open ended comments is a little cumbersome).
Response rates depend on how it is administered, and we need to do some work with this. Some instructors give the web link out to students, and leave it to them to respond; that works with small career training groups, but the high school students tend not to bother. We are aiming to move next year into encouraging instructors to take their class to a computer lab and do it there as a group; I think that might work very well.

Bonnie January
Everett Community College
Everett Community College uses Kansas State University's IDEA system. We use paper forms in face-to-face classes and online questionnaires in online classes. We've used this system for the last 6 years or so.
As far as what form we are using and the IDEA Center's service, I think everyone is generally satisfied. The few problems with students being able to access the survey have so far all been solved with simple troubleshooting such as restarting browsers or pasting the URL into the location bar rather than just clicking on the link.I think the biggest problem we've had with the online system is the fact that the faculty are used to all eval communications coming to them from their division assistants. And the online system requires that one eval-coordinator email address be used for all faculty messages So the messages come "from" me, an unknown entity to many. Every quarter I deal with those who delete all messages from me unread. One quarter this resulted in half the scheduled OL evals not being done at all. This particular cat-herding-type problem may be specific to our campus, but how the switch to online evaluations might change who the faculty will be dealing with and answering to is something to at least be aware of.
There is a difference with online response rates. They are generally much lower. Looking at this quarter's online classes, the majority have a response rate of less than 50%. Much seems to depend on the instructor, though. Online instructors are asked to post the link in the classroom and while some instructors appear to post it and forget it, others must give reminders to the students (one online class this quarter had a 92% response rate. Amazing!)We used to have the link to the student survey sent to students through their evcc email account. The response rates with that delivery method were dismal. Up to 80% of the classes would have less than 30% responding.
Kathleen Bigsby
Kwantlen Polytechnic University
We are in Day 2 of the test of our new web-based survey process. We are using Scanron's Class
Climate software. I'll be able to answer your questions in May.
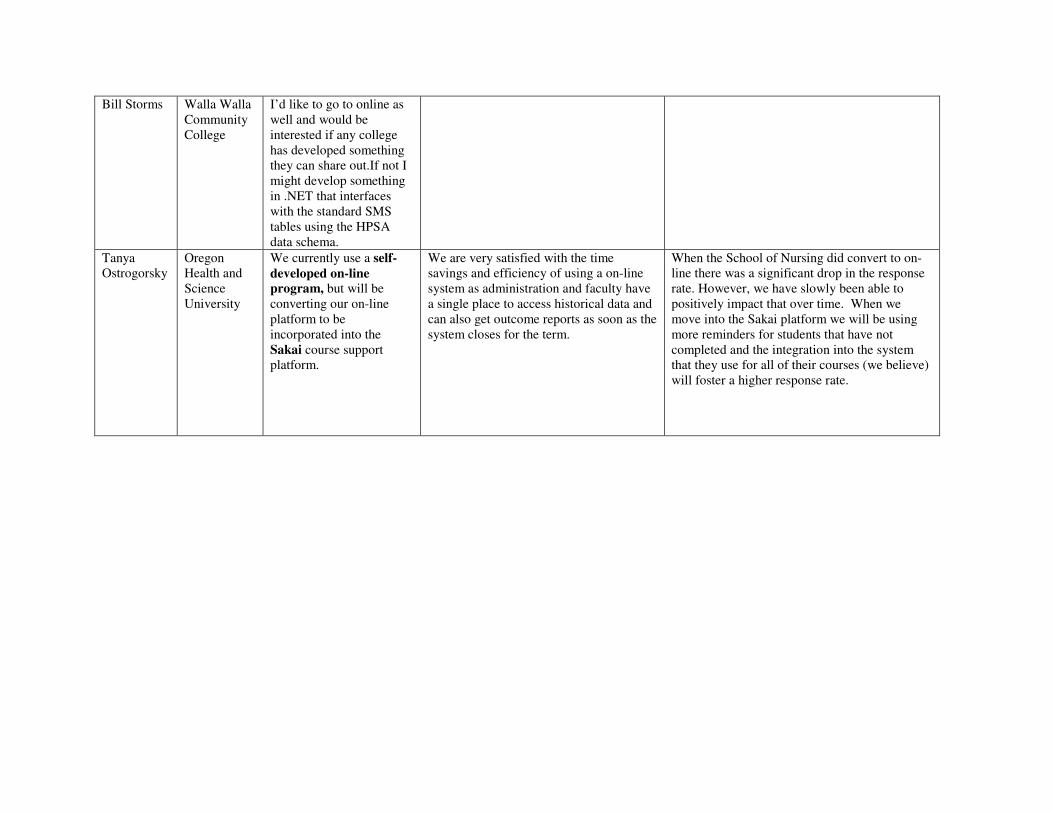
Bill Storms Walla Walla Community College
I’d like to go to online as well and would be interested if any college has developed something they can share out.If not I might develop something in .NET that interfaces with the standard SMS tables using the HPSA data schema.
Tanya Ostrogorsky
Oregon Health and Science University
We currently use a self-
developed on-line program, but will be converting our on-line platform to be incorporated into the Sakai course support platform.
We are very satisfied with the time savings and efficiency of using a on-line system as administration and faculty have a single place to access historical data and can also get outcome reports as soon as the system closes for the term.
When the School of Nursing did convert to on-line there was a significant drop in the response rate. However, we have slowly been able to positively impact that over time. When we move into the Sakai platform we will be using more reminders for students that have not completed and the integration into the system that they use for all of their courses (we believe) will foster a higher response rate.

Gordon Bower
University of Alaska Fairbanks
We use the Instructional
Assessment System forms from the University of Washington. A scannable bubble form (the instructor chooses which of several standard sets of questions to use) and a free-response comment sheet, administered on paper during class time a couple weeks before the semester ends. The forms used today look identical to the ones I filled out as a freshman in 1993. There must have been some tiny change since they are marked copyright 2005 at the bottom but I don't know what it was.
Not very. The big problem is that we mail in the forms and, literally, wait 3 months for the results to come back. If we scanned them ourselves it shouldnt take but a day or two. The standardized report we receive has some limitations too, but it at least serves its stated purpose.
The feeling here is that distributing the survey materials in the classroom during class time is essential to achieving a high response rate. A fear of a dramatic drop in response rate if we administered it online is probably the single biggest reason that we haven't changed the method. I will be curious to hear whether your other respondents report actually suffering such a drop in response rates.
Gale Roid Warner Pacific College
Although I'm new at Warner Pacific College in Portland, Oregon, and not as familiar with their paper system, I was previously at Southern Methodist University (SMU) in Dallas, TX where the course evaluations were converted to online; and this also has recently occurred at George Fox University in Newberg, Oregon
In both cases (SMU and GFU), percentages of response dropped off dramatically (e.g., less than half returned...sometimes only a handful) with initial online implementation....It's a serious concern, and will take some type of motivation (benefit to students?) to assure the response rate of online surveys.
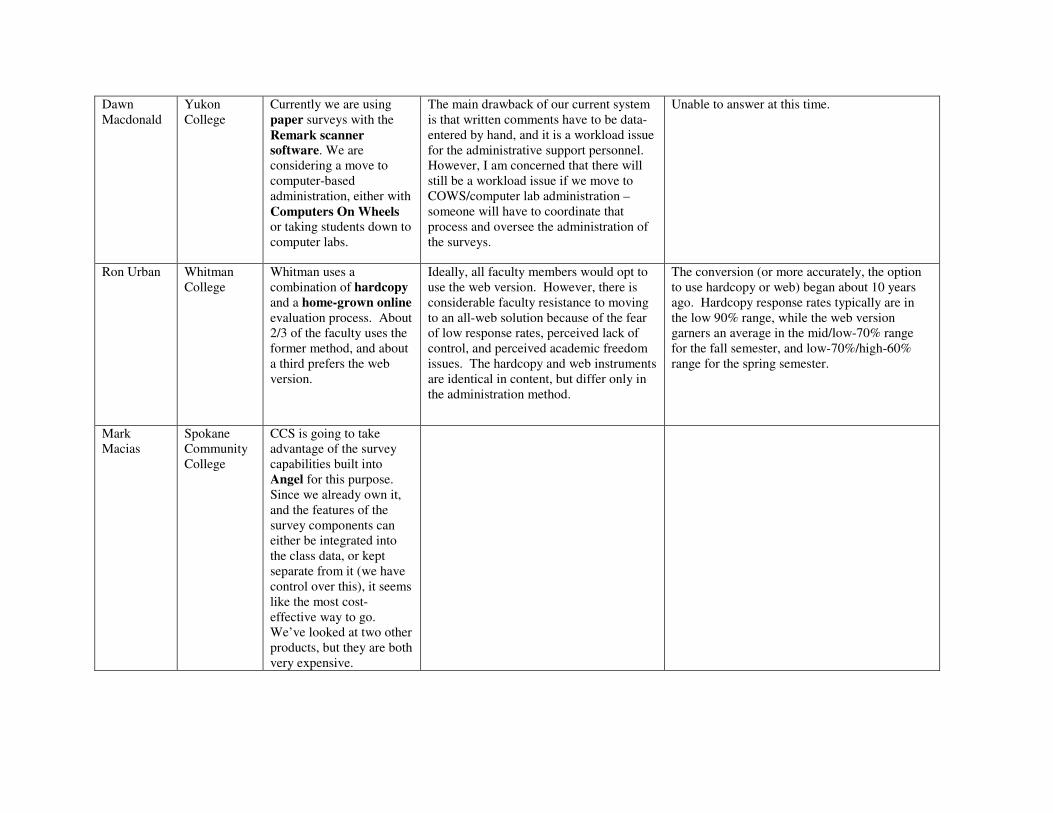
Dawn Macdonald
Yukon College
Currently we are using paper surveys with the Remark scanner software. We are considering a move to computer-based administration, either with Computers On Wheels or taking students down to computer labs.
The main drawback of our current system is that written comments have to be data-entered by hand, and it is a workload issue for the administrative support personnel. However, I am concerned that there will still be a workload issue if we move to COWS/computer lab administration – someone will have to coordinate that process and oversee the administration of the surveys.
Unable to answer at this time.
Ron Urban Whitman College
Whitman uses a combination of hardcopy
and a home-grown online evaluation process. About 2/3 of the faculty uses the former method, and about a third prefers the web version.
Ideally, all faculty members would opt to use the web version. However, there is considerable faculty resistance to moving to an all-web solution because of the fear of low response rates, perceived lack of control, and perceived academic freedom issues. The hardcopy and web instruments are identical in content, but differ only in the administration method.
The conversion (or more accurately, the option to use hardcopy or web) began about 10 years ago. Hardcopy response rates typically are in the low 90% range, while the web version garners an average in the mid/low-70% range for the fall semester, and low-70%/high-60% range for the spring semester.
Mark Macias
Spokane Community College
CCS is going to take advantage of the survey capabilities built into Angel for this purpose. Since we already own it, and the features of the survey components can either be integrated into the class data, or kept separate from it (we have control over this), it seems like the most cost-effective way to go. We’ve looked at two other products, but they are both very expensive.

Appendix B: Participation Request E-mail
Dear X: I have a request to make of you. The provost’s office has asked the Office of Survey Research to conduct a feasibility study of electronic course evaluations. Basically, my office has the capability of creating an identical course evaluation (to the paper version) and ask students to complete them online (rather than in class like we do every quarter). Right now I’m looking for volunteers to participate in this and I’ve chosen to approach you because you each teach multiple sections of the same course this quarter. What I propose to do is to electronically evaluate one of your multiple courses and then have you evaluate the other in the traditional method. Hopefully, this will provide a decent comparison that can measure the impacts of electronic course evaluation. So you have full disclosure, the university experimented with electronic course evaluations in the fall (using a different system than ours). Generally, it appeared that participation rates fell (although the experiment didn’t control within course/instructor effects like my paired design will). Compared to traditional paper-in-classroom evaluations, I suspect students who use electronic course evaluations will be on the satisfaction extremes (either really liked your course or really didn’t). But, we won’t know until we try. If you would be willing to do this, what I will need from you is your permission and your agreement that I can look up (or ask you for) your paper evaluations from the course(s) that wasn’t electronically evaluated. This will allow me to compare response rates and differences in responses between electronic and paper methods. I have already spoken to {your department chair} about this and he/she is willing to accept electronic course evaluations from this experiment in lieu of paper evaluations for faculty evaluation purposes. If you agree, when it comes time to evaluate your courses electronically, I will provide you and your students with detailed (and simple) instructions of how to do so. I will also ask that you frequently remind your students to do these online evaluations. Thank you for considering this! --John John M. Krieg, Ph.D. Associate Professor, Economics Director, Office of Survey Research Western Washington University MS-9074 Department of Economics Western Washington University Bellingham, WA 98225-9074 Ph: 360-650-7405 Fax: 360-650-6315

Appendix C: Course Evaluation Form Request
Dear X: Let me begin by thanking you for volunteering to participate in our electronic course evaluation experiment. It is my hope to provide the administration with as accurate cost/benefit information as possible so a wise, informed decision can be made to adopt or not adopt an electronic evaluation system. My records indicate that we will electronically evaluate your PsyXXX course. This is CRN# XXXXX. To be clear, do not request traditional paper evaluations from the Testing Center for this course. You will need to request paper evaluations for any other courses you teach. In order to arrange for electronic evaluations, I will need you to tell me what evaluation form you would like used. We will use the exact formats that are already used in paper-form by the rest of the university: Form A: Small Lecture Class Form B: Large Lecture Class Form C: Seminar or Discussion Group Form D: Problem Solving Class Form E: Skill Acquisition Class Form F: Large Lecture/Homework Form G: Lab Section Form H: Distance Learning (online) You may view the questions contained on these forms at: http://www.wwu.edu/depts/assess/tc/tvalforms.htm Please e-mail me with your form selection. My office will initiate contact with your students requesting their course evaluations via their official university e-mail address. We will schedule our first e-mail solicitation on the Tuesday of the 10th week of class (June 1st). We will then follow-up non-respondents every other day through Saturday, June 5th. We will close the electronic course evaluations Monday the 7th of June prior to 8 AM. It is important to note that our system will be sent only to a student’s official Western e-mail (usually their on-campus account); you can help students to expect their course evaluations by reminding them to check this account. Upon receiving course evaluations, my office will provide summaries that contain the same numerical information provided to instructors using paper evaluations. We will also compile and pass along the complete text of student’s written comments. In order to better understand the impact of electronic evaluations, my office will solicit summary information on your Spring Quarter paper evaluations from the testing center. This will allow us to compare response rates and student numerical evaluations between electronic and paper methods. All research using these materials will be confidential and will not be reported at the individual level. If you do not wish to be included in this study, please let me know. Thank you again for your participation. John Krieg John M. Krieg, Ph.D. Associate Professor, Economics Director, Office of Survey Research Western Washington University
Appendix D: Electronic Evaluation Process Description
Colleagues: I wanted to give you final details on the electronic evaluation experiment you’ve agreed to participate in. First, thank you for your participation. On Sunday May 30th my office will send e-mail invitations to all students currently enrolled in your electronic evaluation course. These e-mails will only be sent to a student’s official WWU e-mail address (typically ending with “students.wwu.edu”). The text of the e-mails will be: Dear {Insert Student Name}, Western Washington University is experimenting with an online course evaluation system. Your instructor has volunteered for this project. Instead of receiving a traditional paper evaluation in class, you are being asked to evaluate this course online. Below you will find a link that begins this process. The university takes the evaluation of teaching seriously and hopes you will approach this process thoughtfully. The results of this evaluation will help to improve the course in the future, and also may influence decisions concerning tenure, promotion, and salary. Your participation is voluntary and confidential; to ensure confidentiality do not type your name in the forms. Your instructor will be provided with the results of this evaluation only after the quarter concludes and grades have been assigned. Thank you for your thoughtfulness in this evaluation.
Every other day after Sunday, my office will send e-mail reminders to non-respondents. These should appear in student e-mail boxes on Tuesday (June 1), Thursday, and Saturday. The survey will close and not allow further submissions 11:59 PM, Sunday June 6th. You can aid this process by announcing to your class that they will receive e-mails from my office asking for their evaluations. These e-mails will appear in student mailboxes listing the “Office of Survey Research” as the author and “Course Evaluations” as the subject. All evaluations follow the format and wording of the paper evaluations. When this process is over, I will write a report that outlines the successes and failures of this experiment and submit it to the Provost. I would welcome your thoughts on this process and be happy to include your observations in this report. Of course, I will also make this report available to you. If you have any questions, feel free to ask. Thanks again for your participation, John
John M. Krieg, Ph.D. Associate Professor, Economics Director, Office of Survey Research Western Washington University

Appendix E: Sample E-mails Sent to Student Participants Initial Student invitation:
Second student invitation:
Third student invitation:

Final student invitation: