electronic arts inc.sb.cofc.edu/academics/specialty-programs/investment... · ea maxis...
TRANSCRIPT

Chase WestenfelderQuantitative Model Developer
Michael GudePortfolio Manager
Taylor CrawfordPrivate Equity Analyst
Electronic Arts Inc.
January 18th, 2018
EA
Table of Contents
Competitor Analysis
SWOT Analysis
Fundamental Analysis
Investment Thesis
Company Overview & Strategy
Product Lines
ValuationEarnings Breakdown
OutlookVideo Game Market Breakdown
Sports Market Analysis Proposal

● Company ○ Better buy than competitors based on value oriented strategy○ Increased sales in fastest growing segments (digital & mobile)
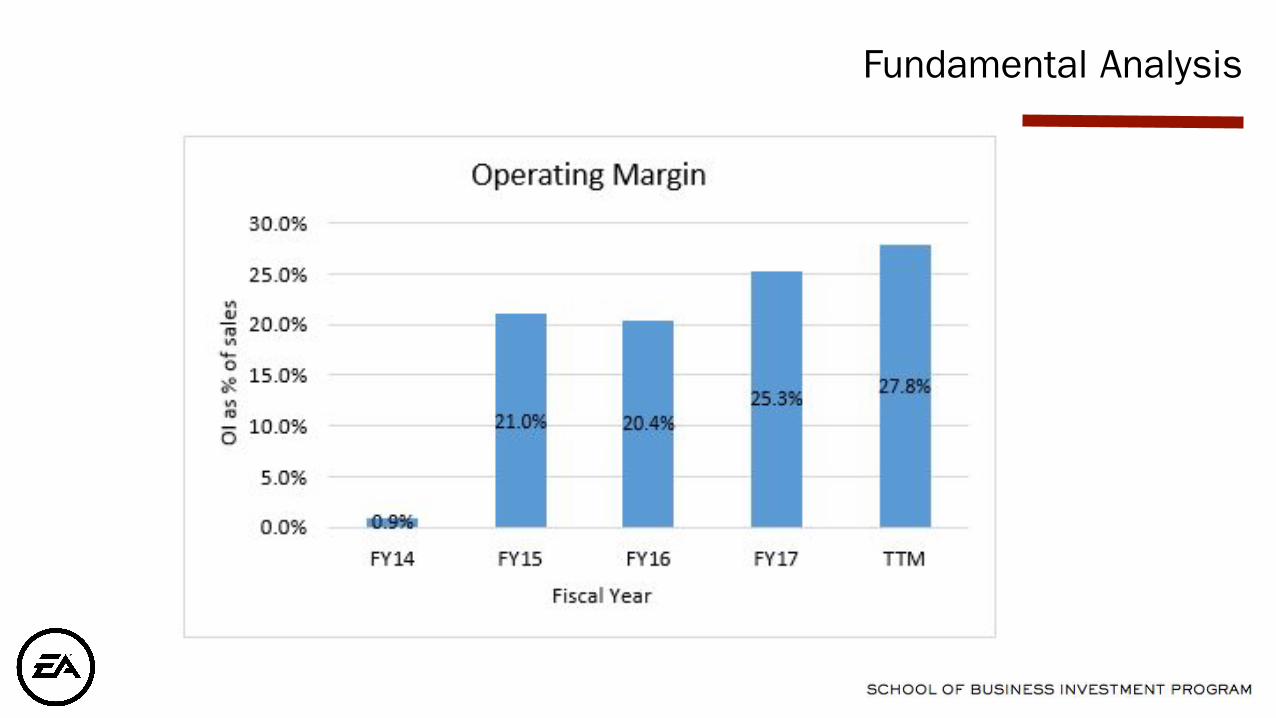
■ Improving OM○ More efficient software development ○ Growing live services engagement
■ Microtransactions, downloadable content, subscriptions○ Stock repurchase program of $1.2B through May 2019
● Macro Perspective○ Steadily growing gaming market (4-6% CAGR through 2020)○ Expansion of digital market with focus on mobile○ Growing sports fan base provides opportunity to reach new customers○ More video game players due to mobile and free to download PC games
Investment Thesis

Company Overview, History, & Strategy

● Global leader in digital interactive entertainment software ● Develop, market, publish and distribute games, content and services that can be played by
consumers on a variety of platforms○ Game consoles (Xbox, Playstation)○ PC / Browser○ Mobile (App, Google Play stores)
Company Overview & Key Events
1982Company is founded in Redwood City, California
1990IPO at $8 per share
2000’sIntroduction of FIFA, Madden, NBA Live and recurring game business model
2011EA acquires PopCap for $750 mm, largest acquisition in their history
2015Creation of the Competitive Gaming Division (CGD), allowing EA to break into eSports world
2017SEED is created, EA’s first investment commitment to deep learning research

Leadership
Andrew Wilson - CEO
CEO since 2013, served several positions within EA since 2000.
CompensationAndrew Wilson 2017
Base Salary - $1,083,846 Stock Comp - $16,150,342
Blake Jorgensen - CFO
CFO since 2012, served as CFO for Levi Strauss and Yahoo! prior to joining EA.
CompensationBlake Jorgensen 2017
Base Salary - $762,981 Stock Comp - $7,498,342
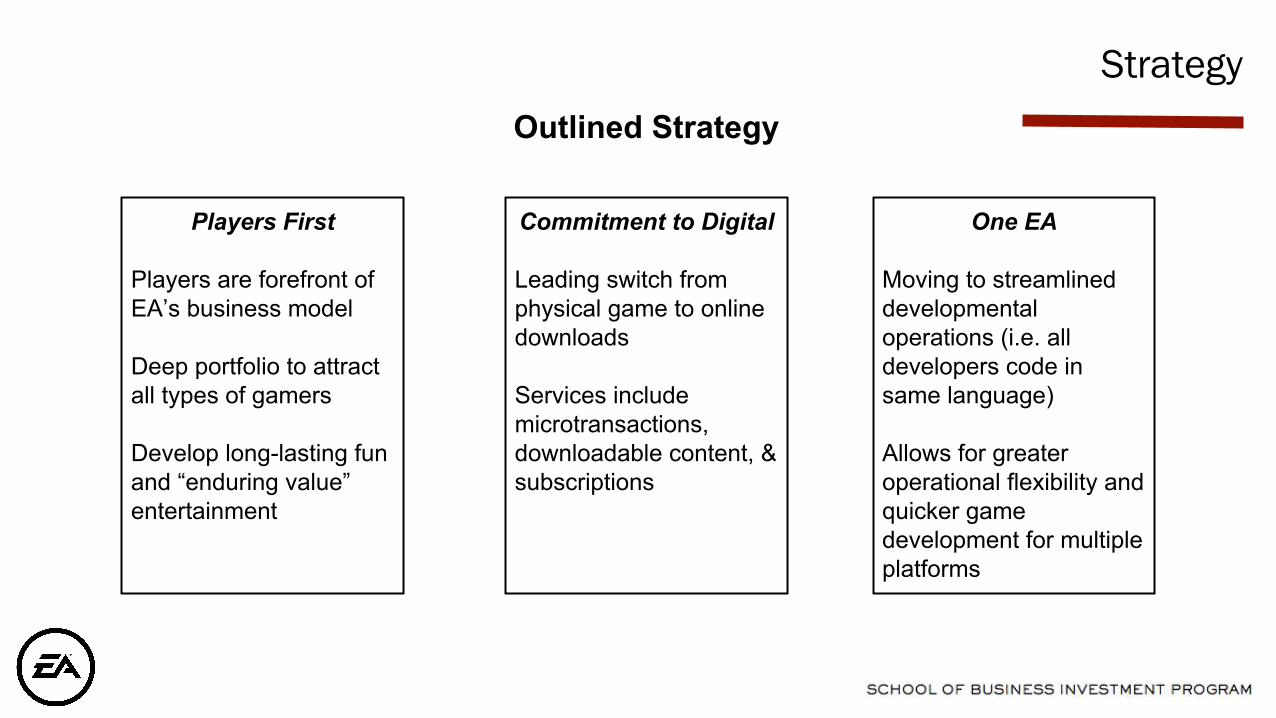
Strategy
Players First
Players are forefront of EA’s business model
Deep portfolio to attract all types of gamers
Develop long-lasting fun and “enduring value” entertainment
One EA
Moving to streamlined developmental operations (i.e. all developers code in same language)
Allows for greater operational flexibility and quicker game development for multiple platforms
Commitment to Digital
Leading switch from physical game to online downloads
Services include microtransactions, downloadable content, & subscriptions
Outlined Strategy
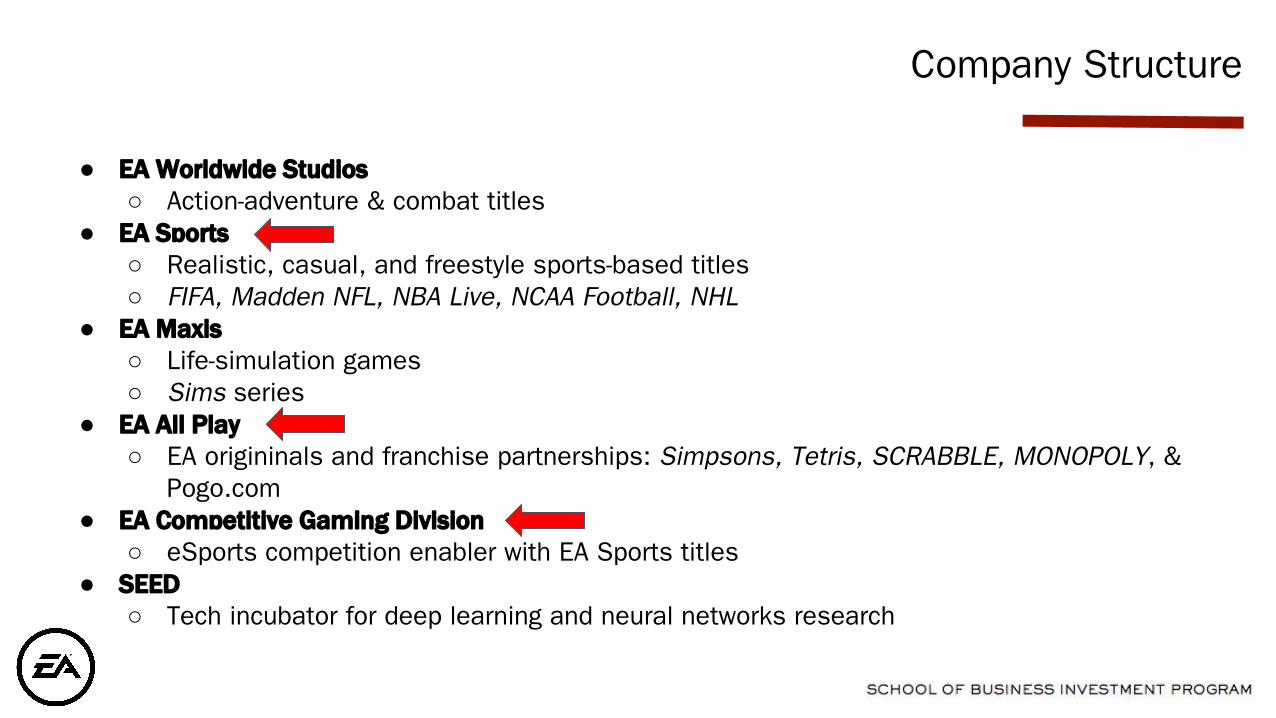
● EA Worldwide Studios○ Action-adventure & combat titles
● EA Sports○ Realistic, casual, and freestyle sports-based titles○ FIFA, Madden NFL, NBA Live, NCAA Football, NHL
● EA Maxis○ Life-simulation games○ Sims series
● EA All Play○ EA origininals and franchise partnerships: Simpsons, Tetris, SCRABBLE, MONOPOLY, &
Pogo.com● EA Competitive Gaming Division
○ eSports competition enabler with EA Sports titles● SEED
○ Tech incubator for deep learning and neural networks research
Company Structure

Partnerships
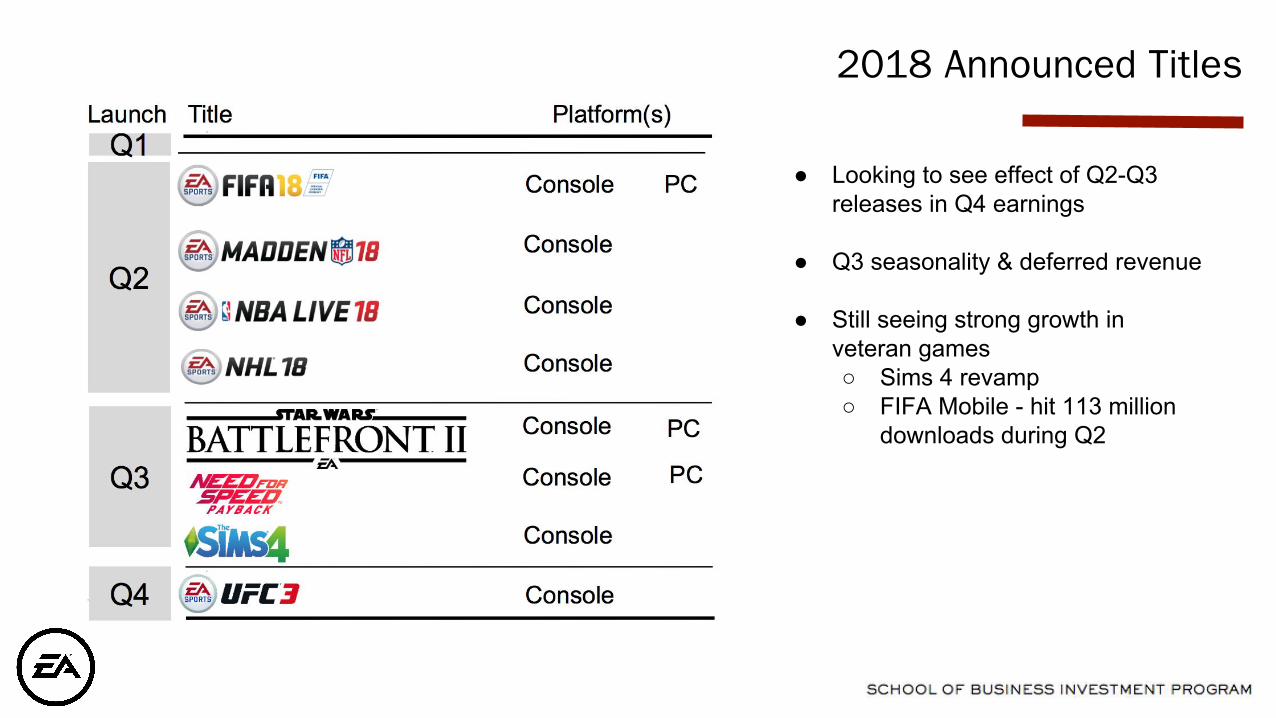
2018 Announced Titles
● Looking to see effect of Q2-Q3 releases in Q4 earnings
● Q3 seasonality & deferred revenue
● Still seeing strong growth in veteran games○ Sims 4 revamp○ FIFA Mobile - hit 113 million
downloads during Q2

Earnings Breakdown

Earnings Breakdown

Breakdown by Platform & Region

EA’s Market Breakdown

Gaming Market - Platform Revenue

Gaming Market

Gaming Market - Geographic Breakdown
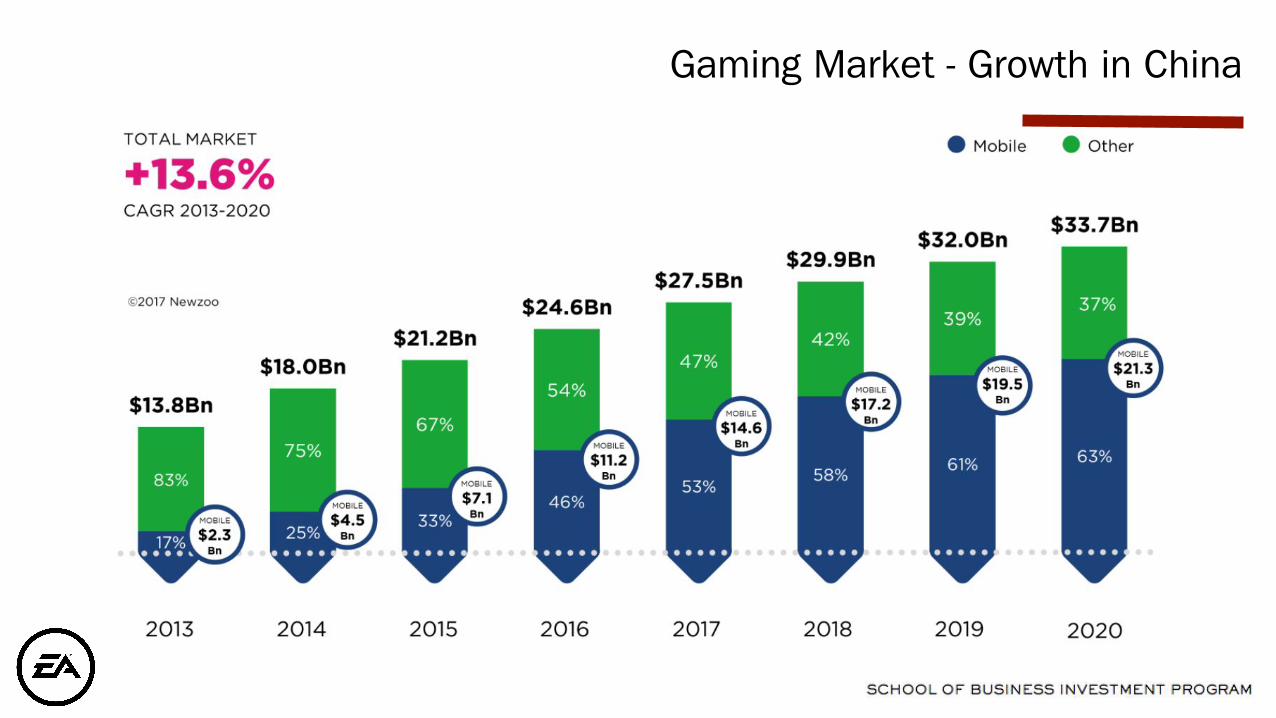
Gaming Market - Growth in China

Sports Markets
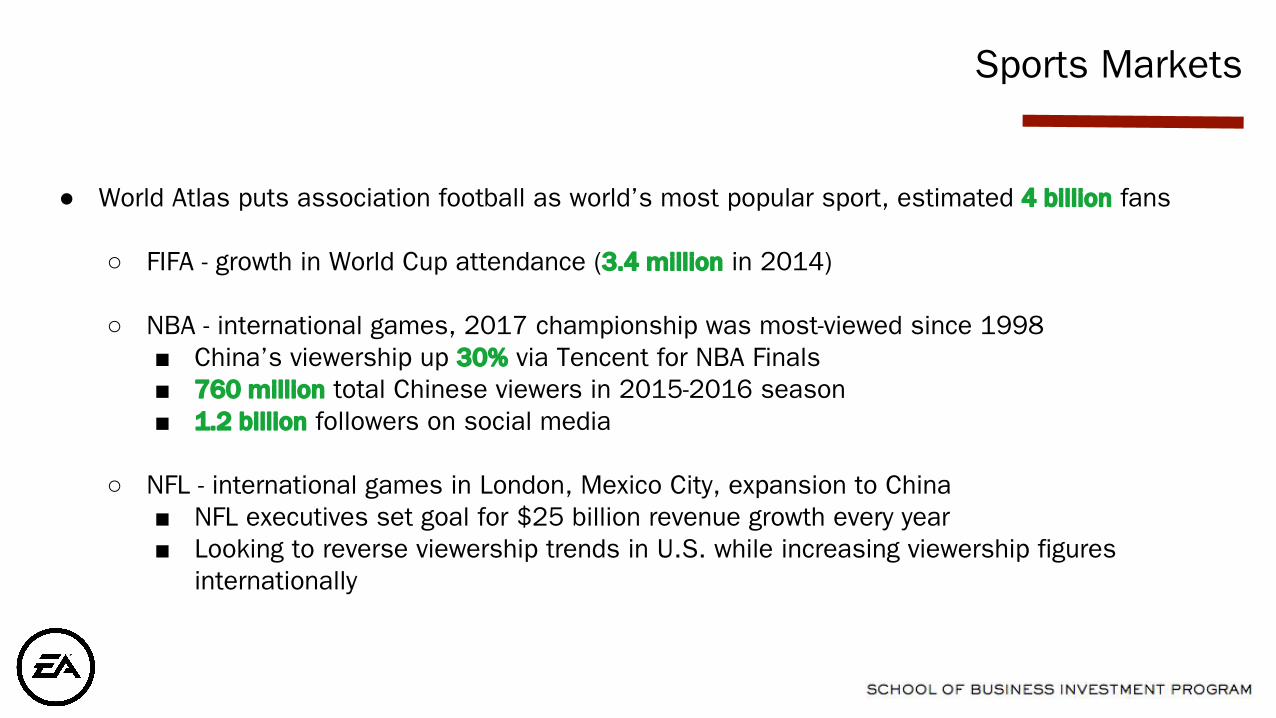
● World Atlas puts association football as world’s most popular sport, estimated 4 billion fans
○ FIFA - growth in World Cup attendance (3.4 million in 2014)
○ NBA - international games, 2017 championship was most-viewed since 1998■ China’s viewership up 30% via Tencent for NBA Finals■ 760 million total Chinese viewers in 2015-2016 season■ 1.2 billion followers on social media
○ NFL - international games in London, Mexico City, expansion to China■ NFL executives set goal for $25 billion revenue growth every year■ Looking to reverse viewership trends in U.S. while increasing viewership figures
internationally
Sports Markets

Competitor Analysis
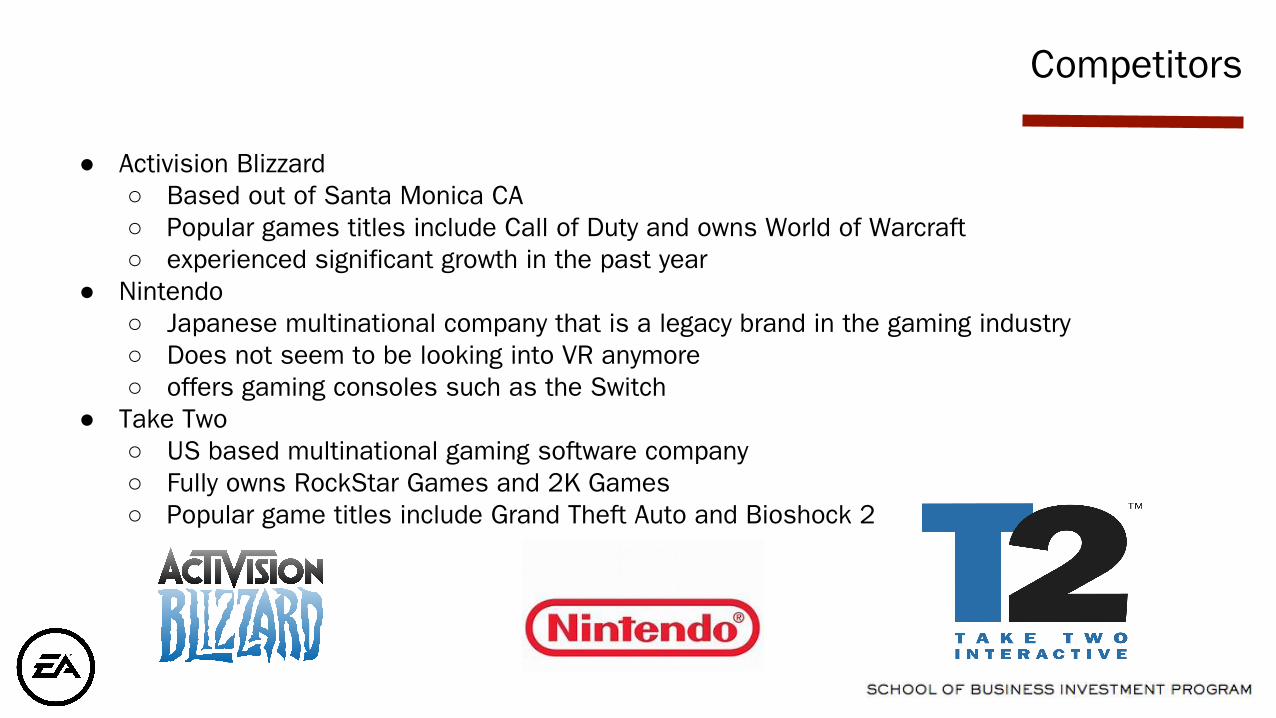
● Activision Blizzard○ Based out of Santa Monica CA○ Popular games titles include Call of Duty and owns World of Warcraft○ experienced significant growth in the past year
● Nintendo○ Japanese multinational company that is a legacy brand in the gaming industry○ Does not seem to be looking into VR anymore○ offers gaming consoles such as the Switch
● Take Two○ US based multinational gaming software company○ Fully owns RockStar Games and 2K Games○ Popular game titles include Grand Theft Auto and Bioshock 2
Competitors
Competitors

Comps Analysis

Comps Analysis

Comps Analysis

Comps Analysis

Comps Analysis

Strengths:● Heavy investment in R&D● Steady growth in both revenue and net
income● Focus on a relatively small portfolio of
products in order to produce high quality ones that will drive sales
SWOT Analysis
Opportunities:● Hold licenses to big names such as Star Wars,
which could increase● Experimenting with implementing VR into games● Growth still exists in the gaming industry● E-sports are gaining traction and EA is poised to
grow alongside them● opportunity for expansion in global markets
Threats:● A significant portion of sales are made to a
limited number of large customers● Potential for currency exchange rate effects
on revenue● Success is related to the performance of
products from third parties
Weaknesses:● Seasonality of revenue - timing of game
releases are typically clustered together● No dividend

Fundamental Analysis & Valuation
Fundamental Analysis

-
Fundamental Analysis
Fundamental Analysis

Fundamental Analysis
Fundamental Analysis

Valuation

Valuation

Valuation
Valuation
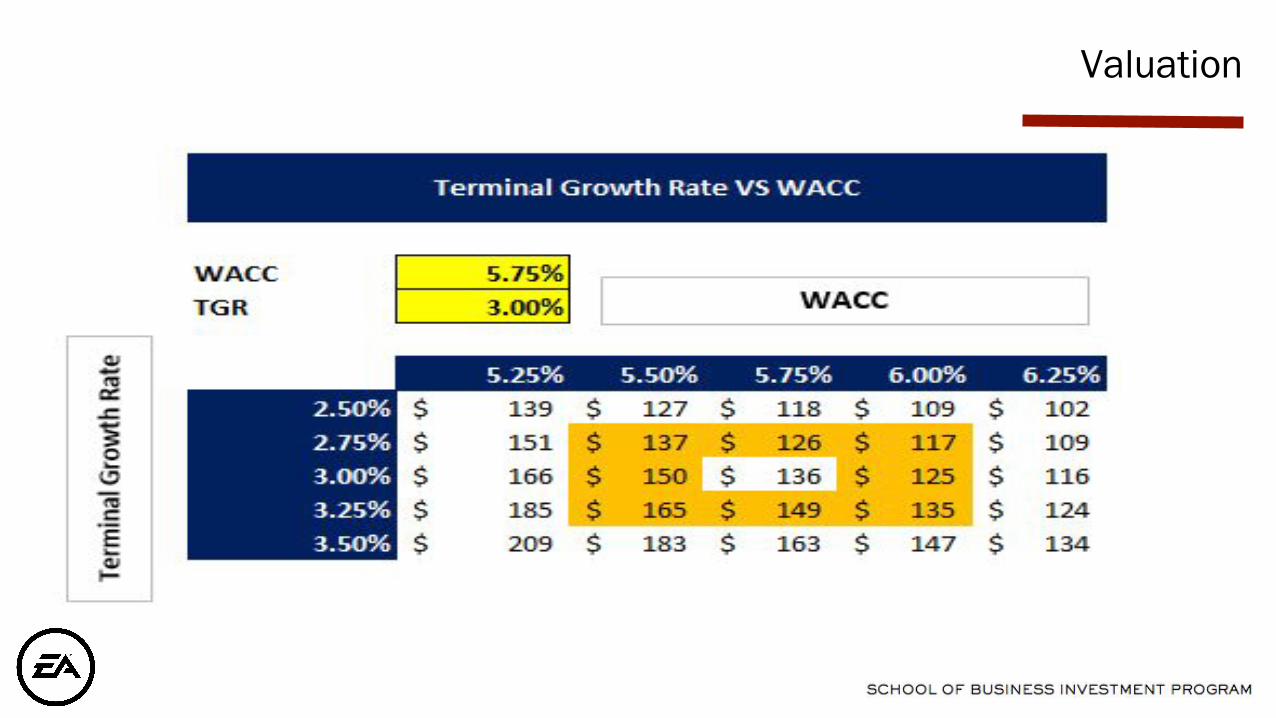
Valuation
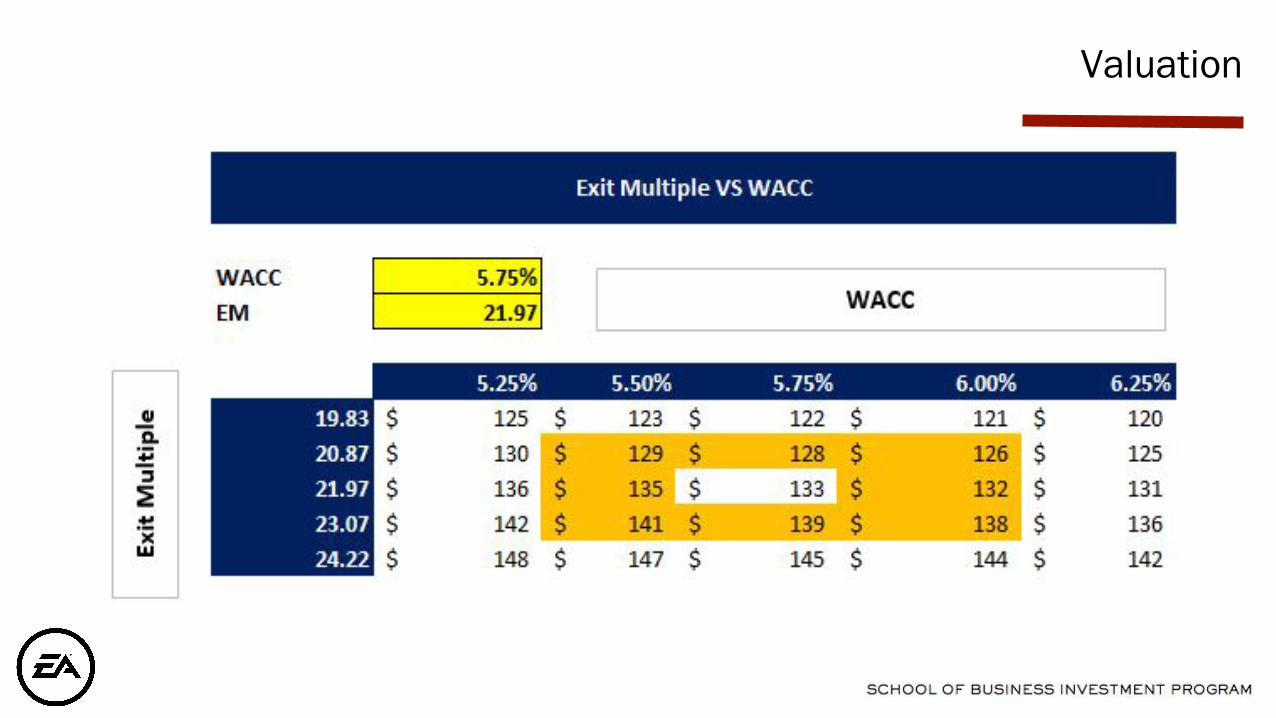
Valuation
● Continued OM improvement with shift to digital
● Steady industry growth with broadening customer base
● One code language on one platform will cut costs and development time ○ Compared to 20+ development platforms
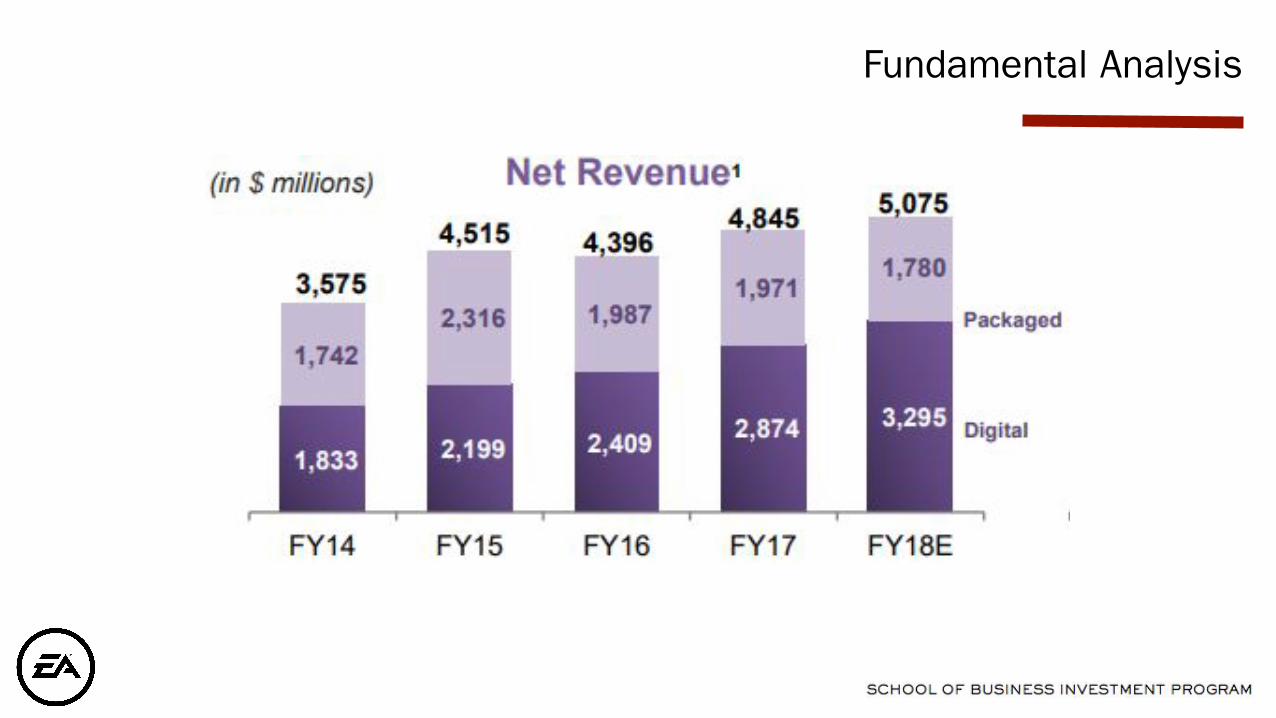
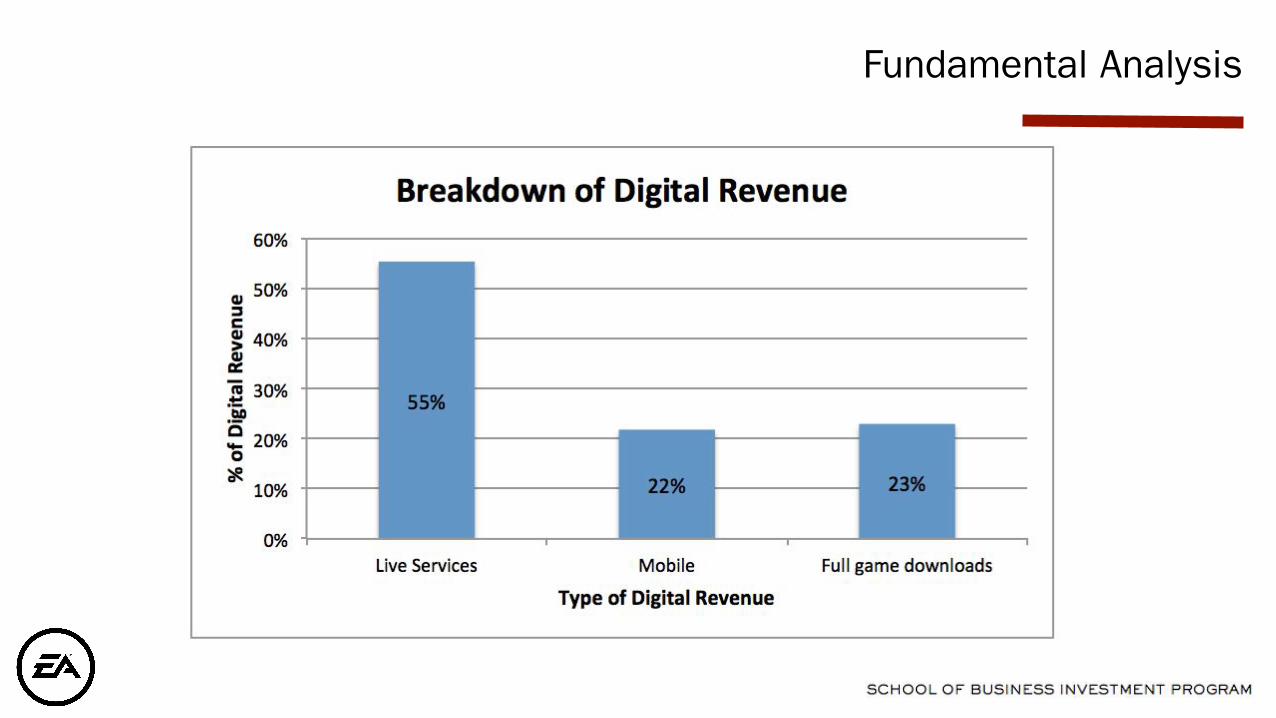
● Continued growth in digital segment and reduction in packaged goods○ Focus on mobile and live services
● Stock repurchase program
Outlook

Investment Proposal
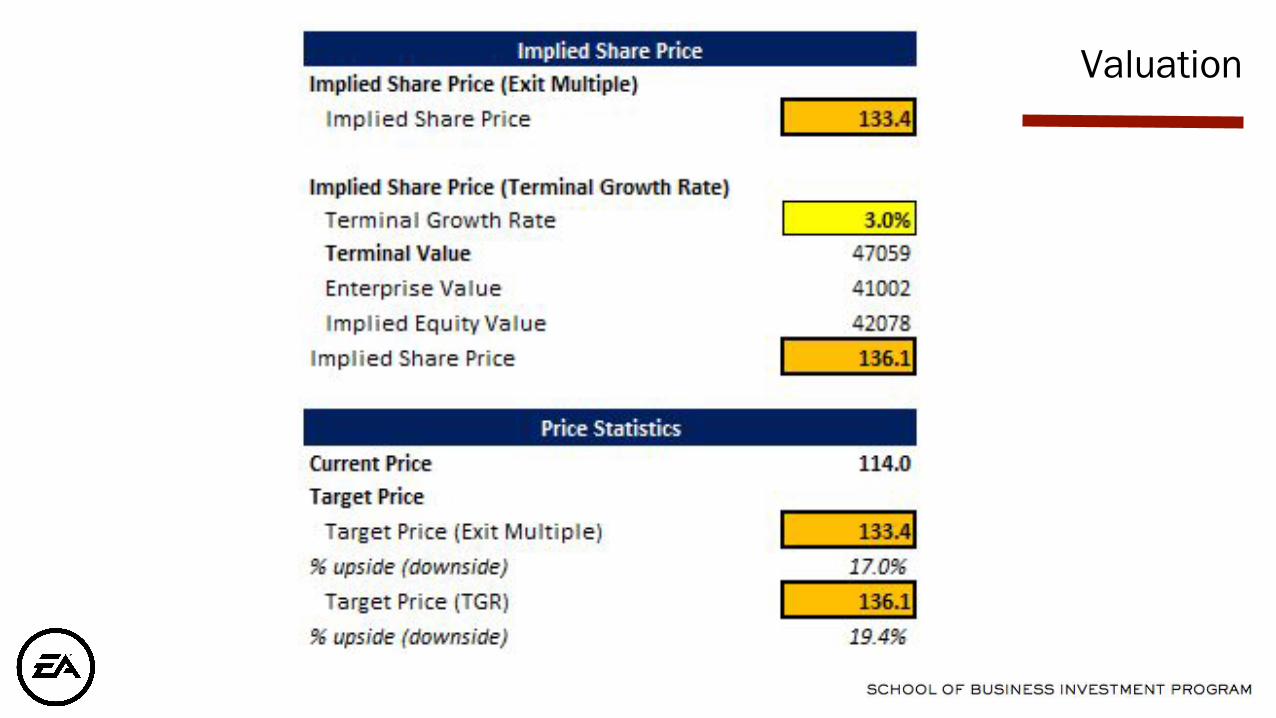
Buy 94 shares at $114.14 for a total of $10,729.16
Proposal
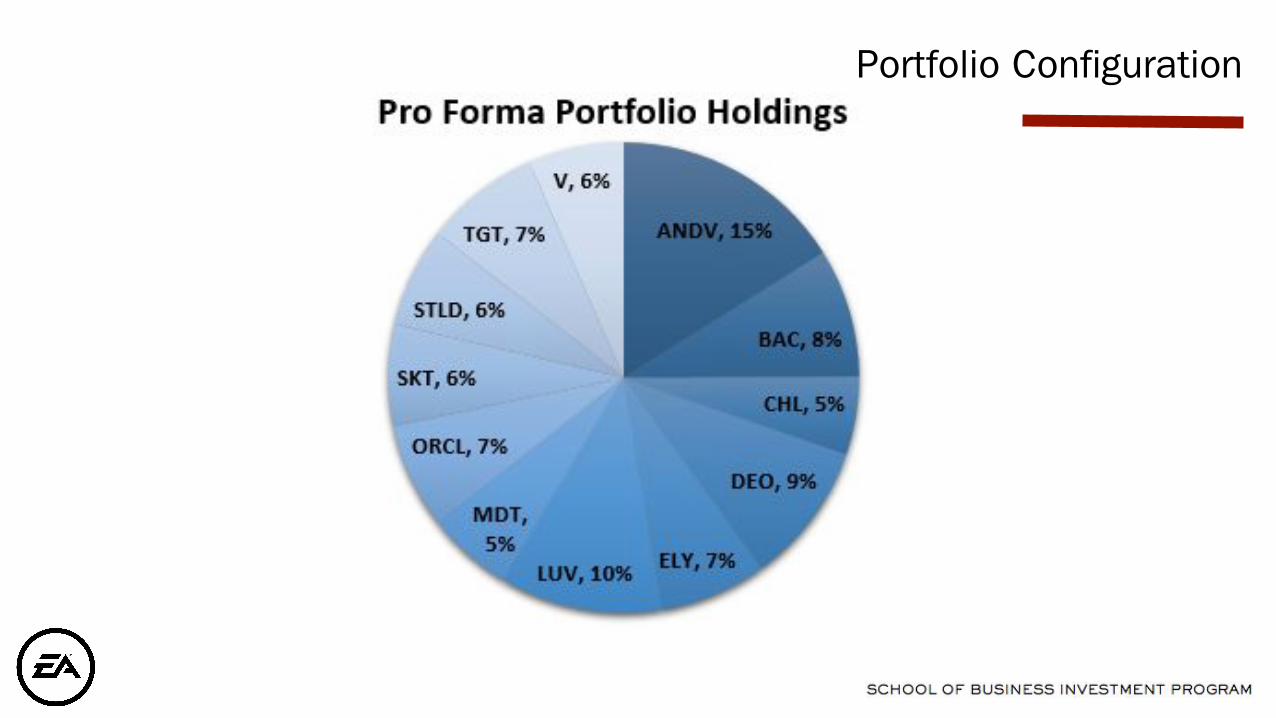
Portfolio Configuration

Questions?
Appendix
1. Major Game Console Sales Trendsa. Using Tableau, we compared the sales (units) of major game consoles between Microsoft and their Xbox console and Sony and
their Playstation console. Although revenue stemming from gaming consoles is increasing, we have noticed two distinct patterns from this data.
i. Overall game console sales, in units, is declining for the entire market. This is theoretically a poor situation for EA, but given the strength in partnerships for all video game companies, this declining market will hurt anyone involved. Again, it is also a fundamental factor that revenue stemming from game consoles is steadily increasing for EA.
ii. Another trend is the pattern of units sold for the two major consoles, Xbox and Playstation. Overall, we want to ignore the competition between these two consoles because EA has strong partnerships with both Microsoft and Sony. However, if we look at units sold, we see a right-tailed distribution when a new console is released. There is strong growth that slightly tails off, as expected when a console becomes 2-3 years old and outdated. Using Tableau, we compared the latest 2 versions of each major console and saw that this distribution existed. We think that this trend will continue, adding to the seasonality of revenue for video game companies. We also believe there is a large gap from the absence of mobile devices in this market that makes up for the decrease in overall consoles.
2. Call of Duty sales (units) of each version (Statista Research)a. This is an Activision game that is a key driver in the growth of the company. Without this game, Activision loses its grip in the
video game market. Sales of Call of Duty: WWII (as of November, 2017) were twice that of Call of Duty: Infinite Warfare (about 22 million units), showing that the newest version, although popular, has come nowhere close to the top spot set by Modern Warfare 3 in 2011.
See Graphs Below

Appendix
3. Earnings Hits and Missesa. EA’s history of earnings (quarterly) over the last 7 years is displayed. They have missed earnings expectations twice in 24
quarters, leading us to believe they have a strong future of consistent earnings performancesi. Average stock increase in an earnings week for EA is put at 2.5% (NASDAQ)
4. Forward P/E Ratioa. Displayed is the forward P/E ratio estimates for EA
i. Differing from our actual calculations due to current price fluctuations and calculation of EPSii. Ranging from 30 - 37 2017A
5. eSports Market Valuationa. Figures for CAGR forecast through 2020
6. Geographic eSports Breakdowna. China VS North America eSports market figures
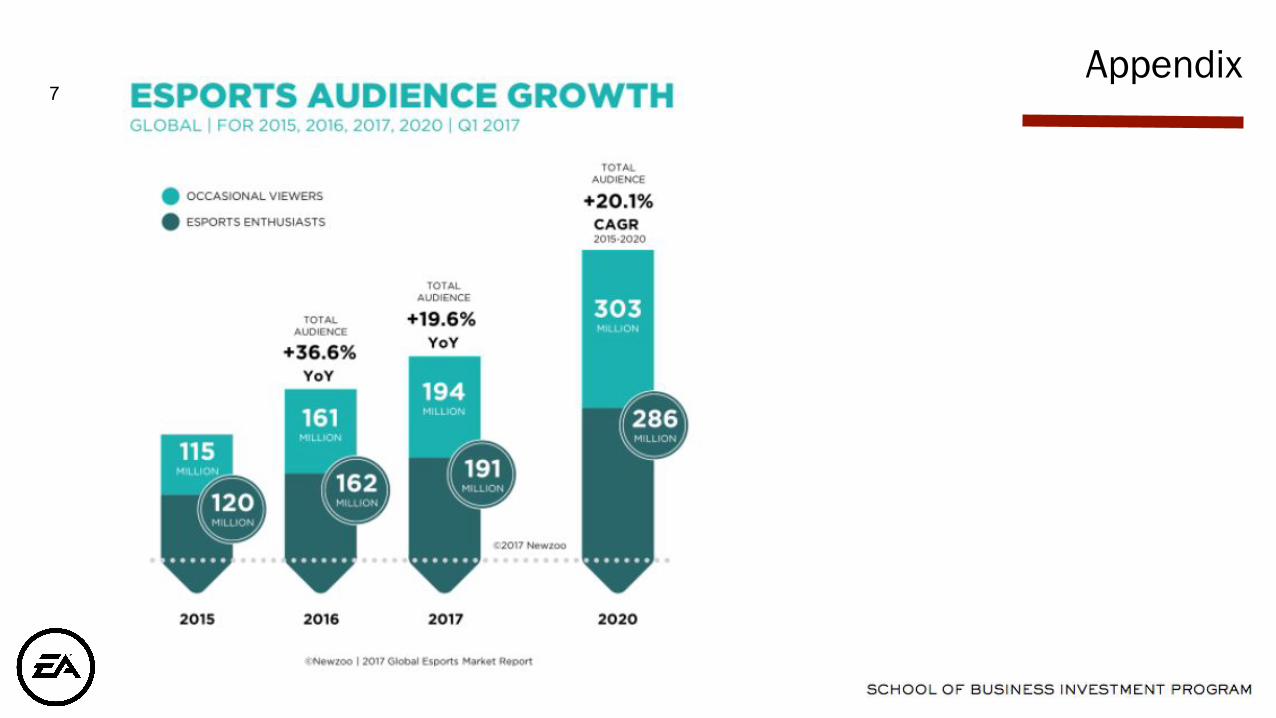
7. eSports Audience Growtha. Broken down between “occasional viewers” and “eSports Enthusiasts”, which is a metric that is very hard to gather data on. This
is important for market sizing, and growth in enthusiasts is the most important driver for the eSports market. This is due to the fact that the monetary distribution is favored towards companies like EA when there are gamers that are playing, not viewers.
See Graphs Below
Appendix
8. Litigation (no graphic)a. 2 appeals against favorable ruling for EA regarding minor copyright infringement casesb. 1 case dealing with lack of consent to use characters in Madden games - case was thrown out c. Based on website Justia and reports reviews, no evidence to suggest EA is involved in any major or minor lawsuits at this time.
9. Game Portfolio Graphica. Not every game is included in this graphic, but it is a good visualization of their diversity in platform development.

Appendix
1 2

Appendix3 4

Appendix5 6
Appendix7

Appendix9

Appendix9

Appendix

Appendix