electron microscopy: the basics - · pdf filephysics of advanced materials winter school...
TRANSCRIPT
Physics of Advanced Materials Winter School 2008 1
Electron Microscopy:
The Basics
written by Bettina Voutou Aristotle University of Thessaloniki, Greece, [email protected]
and Eleni-Chrysanthi Stefanaki Aristotle University of Thessaloniki, Greece, [email protected]
based on the lecture of Dr. Konstantinos Giannakopoulos National Center for Scientific Research ‘Demokritos’, Greece
Abstract
Since its invention, electron microscope has been a valuable tool in the
development of scientific theory and it contributed greatly to biology, medicine
and material sciences. This wide spread use of electron microscopes is based on
the fact that they permit the observation and characterization of materials on a
nanometer (nm) to micrometer (µm) scale. This paper presents the basic theory
for electron microscopy, focusing on the two basic types of Ems; SEM, TEM.
1. Introduction
Electron Microscopes are scientific instruments that use a beam of highly
energetic electrons to examine objects on a very fine scale. This examination can
yield information about the topography (surface features of an object),
morphology (shape and size of the particles making up the object), composition
(the elements and compounds that the object is composed of and the relative
amounts of them) and crystallographic information (how the atoms are arranged
in the object).
Electron Microscopes were developed due to the limitations of Light Microscopes
which are limited by the physics of light to 500x or 1000x magnification and a
resolution of 0.2 micrometers. In the early 1930's this theoretical limit had been
reached and there was a scientific desire to see the fine details of the interior
structures of organic cells (nucleus, mitochondria...etc.). This required 10,000x
plus magnification which was just not possible using Light Microscopes.
The Transmission Electron Microscope (TEM) was the first type of Electron
Microscope to be developed and is patterned exactly on the Light Transmission
Microscope except that a focused beam of electrons is used instead of light to
"see through" the specimen. It was developed by Max Knoll and Ernst Ruska in
Germany in 1931.
The first Scanning Electron Microscope (SEM) debuted in 1942 with the first
commercial instruments around 1965. Its late development was due to the
electronics involved in "scanning" the beam of electrons across the sample.
Electron Microscopes (EMs) function exactly as their optical counterparts except
that they use a focused beam of electrons instead of light to "image" the
specimen and gain information as to its structure and composition.
The basic steps involved in all Ems are the following: A stream of electrons is
formed in high vacuum (by electron guns). This stream is accelerated towards the
specimen (with a positive electrical potential) while is confined and focused using
metal apertures and magnetic lenses into a thin, focused, monochromatic beam.

Physics of Advanced Materials Winter School 2008 2
The sample is irradiated by the beam and interactions occur inside the irradiated
sample, affecting the electron beam. These interactions and effects are detected
and transformed into an image.
The above steps are carried out in all EMs regardless of type. A more specific
treatment of the workings of two different types of EMs (SEM, TEM) as well as the
function of an electron gun and the theory of electron- specimen interaction is
described in more detail below.
2. Electron Gun
The first and basic part of the microscopes is the source of electrons. It is usually
a V-shaped filament made of LaB6 or W (tungsten) that is wreathed with Wehnelt
electrode (Wehnelt Cap). Due to negative potential of the electrode, the electrons
are emitted from a small area of the filament (point source). A point source is
important because it emits monochromatic electrons (with similar energy). The
two usual types of electron guns are the conventional electron guns and the field
emission guns (FEG). Figure 1 illustrates the geometry of an electron gun.
In conventional electron guns, a positive electrical potential is applied to the
anode, and the filament (cathode) is heated until a stream of electrons is
produced. The electrons are accelerated by the positive potential down the
column, and because of the negative potential of cap, all electrons are repelled
toward the optic axis. A collection of electrons occurs in the space between the
filament tip and Cap, which is called a space charge. Those electrons at the
bottom of the space charge (nearest to the anode) can exit the gun area through
the small (<1 mm) hole in the Whenelt Cap and then move down the column to
be later used in imaging.
A field emission gun consists of a sharply pointed tungsten tip held at several
kilovolts negative potential relative to a nearby electrode, so that there is a very
high potential gradient at the surface of the tungsten tip. The result of this is that
the potential energy of an electron as a function of distance from the metal
surface has a sharp peak (from the work function), then drops off quickly (due to
electron charge traveling through an electric field). Because electrons are
quantum particles and have a probability distribution to their location, a certain
number of electrons that are nominally at the metal surface will find themselves
at some distance from the surface, such that they can reduce their energy by
moving further away from the surface. This transport-via-delocalization is called
'tunneling', and is the basis for the field emission effect. FEGs produce much
higher source brightness than in conventional guns (electron current > 1000
times), better monochromaticity, but requires a very good vacuum (~10-7 Pa).
Figure 1. Illustration of the electron gun

Physics of Advanced Materials Winter School 2008 3
3. Electron-specimen interactions
When an electron beam interacts with the atoms in a sample, individual incident
electrons undergo two types of scattering - elastic and inelastic (Figure 2). In the
former, only the trajectory changes and the kinetic energy and velocity remain
constant. In the case of inelastic scattering, some incident electrons will actually
collide with and displace electrons from their orbits (shells) around nuclei of
atoms comprising the sample. This interaction places the atom in an excited
(unstable) state. Specimen interaction is what makes Electron Microscopy
possible. The interactions (inelastic) noted on the top side of the diagram are
utilized when examining thick or bulk specimens (Scanning Electron Microscopy,
SEM) while on the bottom side are those examined in thin or foil specimens
(Transmission Electron Microscopy, TEM).
Figure 2. Effects produced by electron bombardment of a material
3.1. Reactions Exploited In SEM
3.1.1. Secondary Electrons
When a sample is bombarded with electrons, the strongest region of the electron
energy spectrum is due to secondary electrons. The secondary electron yield
depends on many factors, and is generally higher for high atomic number targets,
and at higher angles of incidence. Secondary electrons are produced when an
incident electron excites an electron in the sample and loses most of its energy in
the process. The excited electron moves towards the surface of the sample
undergoing elastic and inelastic collisions until it reaches the surface, where it can
escape if it still has sufficient energy.
Production of secondary electrons is very topography related. Due to their low
energy (5eV) only secondaries that are very near the surface (<10 nm) can exit
the sample and be examined. Any changes in topography in the sample that are
larger than this sampling depth will change the yield of secondaries due to
collection efficiencies. Collection of these electrons is aided by using a "collector"
in conjunction with the secondary electron detector.Figure 3 presents two
secondary electron images from SEM.

Physics of Advanced Materials Winter School 2008 4
(A) (B)
Figure 3. SEM secondary electron image. A) Pollen - various types B) ZnO Nanorods (side
view)
3.1.2. Backscattered Electrons
Backscattered electrons consist of high-energy electrons originating in the
electron beam, that are reflected or back-scattered out of the specimen
interaction volume. The production of backscattered electrons varies directly with
the specimen's atomic number. This differing production rates causes higher
atomic number elements to appear brighter than lower atomic number elements.
This interaction is utilized to differentiate parts of the specimen that have
different average atomic number. Figure 4 illustrates a backscattered electron
image.
Figure 4. SEM backscattered electron image.
3.1.3 Relaxation of excited atoms
As was mentioned above, inelastic scattering, places the atom in an excited
(unstable) state. The atom “wants” to return to a ground or unexcited state.
Therefore, at a later time the atoms will relax giving off the excess energy. X-
Rays, cathodoluminescence and Auger electrons are three ways of relaxation. The
relaxation energy is the fingerprint of each element.
When the sample is bombarded by the electron beam of the SEM, electrons are
ejected from the atoms on the specimens surface. A resulting electron vacancy is
filled by an electron from a higher shell, and an X-ray is emitted to balance the
energy difference between the two electrons. The EDS X-ray detector (also called
EDS or EDX) measures the number of emitted x-rays versus their energy. The
energy of the x-ray is characteristic of the element from which the x-ray was
emitted.
In practice, EDS (or EDX) is most often used for qualitative elemental analysis,
simply to determine which elements are present and their relative abundance. In
some instances, however, the area of interest is simply too small and must be
analyzed by TEM (where EDS is the only option) or high resolution SEM (where

Physics of Advanced Materials Winter School 2008 5
the low beam currents used preclude WDS-Wavelength X-ray Dispersive
Spectroscopy-, making EDS the only option)[1].
Cathodoluminescence (CL) is the emission of photons of characteristic
wavelengths from a material that is under high-energy electron bombardment.
The electron beam is typically produced in an electron microprobe (EPMA) or
scanning electron microscope (SEM-CL)
Auger electrons are electrons ejected by radiationless excitation of a target atom
by the incident electron beam. When an electron from the L shell drops to fill a
vacancy formed by K-shell ionization, the resulting X-ray photon with energy EK -
EL may not be emitted from the atom. If this photon strikes a lower energy
electron (e.g.an M-shell electron), this outer electron may be ejected as a low-
energy Auger electron. Auger electrons are characteristic of the fine structure of
the atom and have energies between 280 eV (carbon) and 2.1 keV (sulfur). By
discriminating between Auger electrons of various energies, a chemical analysis
of the specimen surface can be made. Auger electrons are exploited in Auger
Electron Spectroscopy tools (AES)
The volume inside the specimen in which interactions occur while being struck
with an electron beam is called specimen interaction volume. Figure 5, illustrates
the interaction volumes for secondary and backscattered electrons, as well as X-
Rays.
Figure 5. Generalized illustration of interaction volumes for various electron-specimen
interactions
3.2. Reactions Exploited In TEM
TEM exploits three different interactions of electron beam-specimen; Unscattered
electrons (transmitted beam), elastically scattered electrons (diffracted beam)
and inelastically scattered electrons.
When incident electrons are transmitted through the thin specimen without any
interaction occurring inside the specimen, then the beam of these electrons is
called transmitted. The transmission of unscattered electrons is inversely
proportional to the specimen thickness. Areas of the specimen that are thicker
will have fewer transmitted unscattered electrons and so will appear darker,
conversely the thinner areas will have more transmitted and thus will appear
lighter.
Another part of the incident electrons, are scattered (deflected from their original
path) by atoms in the specimen in an elastic fashion (no loss of energy). These
scattered electrons are then transmitted through the remaining portions of the
specimen. All electrons follow Bragg's Law and thus are scattered according to

Physics of Advanced Materials Winter School 2008 6
n∙λ=2∙d∙sin(θ)
where:
λ is the wavelength of the rays
θ is the angle between the incident rays and the surface of the crystal and
d is the spacing between layers of atoms.
All incident electrons have the same energy (thus wavelength) and enter the
specimen normal to its surface. All incidents that are scattered by the same
atomic spacing will be scattered by the same angle. These scattered electrons can
be collated using magnetic lenses to form a pattern of spots; each spot
corresponding to a specific atomic spacing (a plane). This pattern can then yield
information about the orientation, atomic arrangements and phases present in
the area being examined. Figure 6 shows the diffraction pattern of a
monocrystalline sample.
Figure 6. Diffraction pattern of a monocrystalline sample
Finally, another way that incident electrons can interact with the specimen is
inelastically.Incident electrons that interact with specimen atoms in an inelastic
fashion, loosing energy during the interaction. These electrons are then
transmitted through the rest of the specimen. Inelastically scattered electrons can
be utilized in two ways; Electron Energy Loss Spectroscopy (EELS) and Kikuchi
Bands.
Elemental composition and atomic bonding state can be determined by analyzing
the energy with the spectroscope attached under the electron microscope
(Electron Energy Loss Spectroscopy). Because the analyzing region can be
selected from a part of the enlarged electron microscopic image, one can analyze
very small region. Moreover, by selecting electrons with a specific loss energy by
a slit so as to image them, element distribution in specimen can be visualized
(Elemental Mapping) [2].
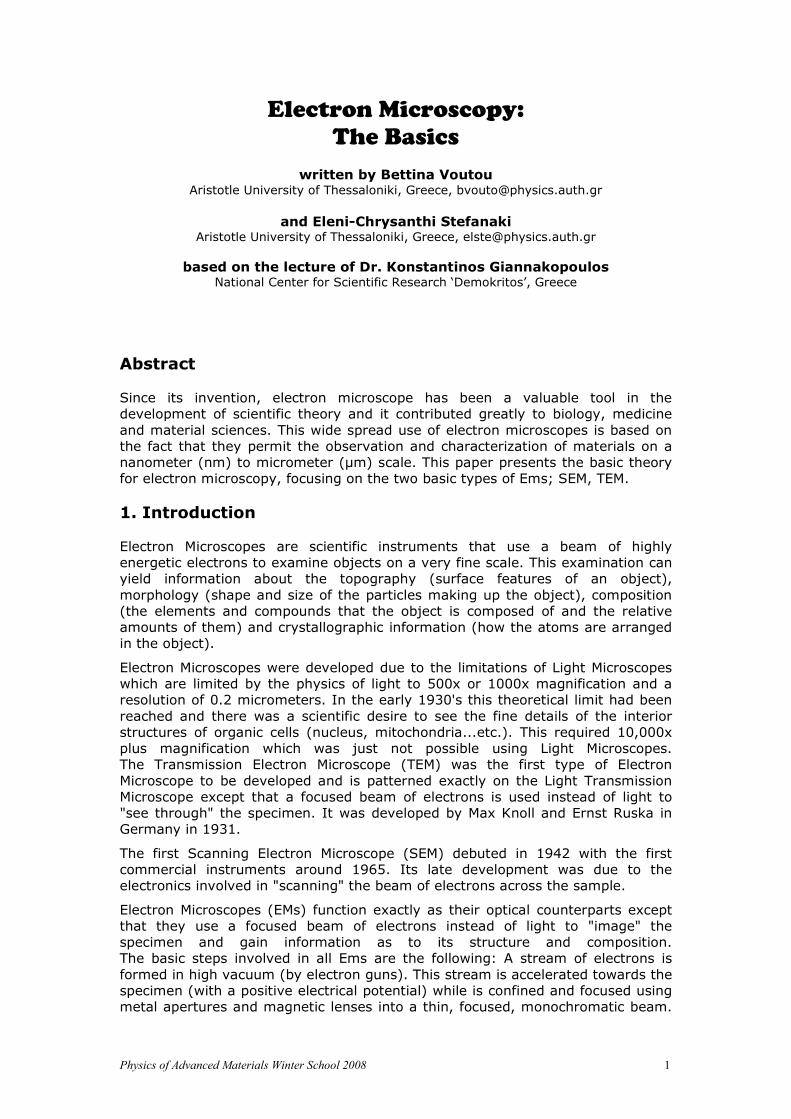
Kikuchi lines appear in transmission electron diffraction patterns of relatively thick
crystals due to Bragg reflection of the inelastically scattered electrons. They are
alternating light and dark lines that are related to atomic spacings in the
specimen. These bands can be either measured (their width is inversely
proportional to atomic spacing) or "followed" like a roadmap to the "real"
elasticity scattered electron pattern [3].
Physics of Advanced Materials Winter School 2008 7
Figure 7.The Kikuchi lines pass straight through the transmitted and diffracted spots.
The diffracting planes are therefore tilted at exactly the Bragg angle to the optic axis.
4. SEM-TEM
For the purpose of detailed materials characterization, two potent instruments are
used: the Scanning Electron Microscope (SEM) and the Transmission Electron
Microscope (TEM). Their operation is described below.
4.1 SEM
4.1.1 Operation
In SEM, a source of electrons is focused in vacuum into a fine probe that is
rastered over the surface of the specimen. The electron beam passes through
scan coils and objective lens that deflect horizontally and vertically so that the
beam scans the surface of the sample (Figure 8).
As the electrons penetrate the surface, a number of interactions occur that can
result in the emission of electrons or photons from or through the surface. A
reasonable fraction of the electrons emitted can be collected by appropriate
detectors, and the output can be used to modulate the brightness of a cathode
ray tube (CRT) whose x- and y- inputs are driven in synchronism with the x-y
voltages rastering the electron beam. In this way an image is produced on the
CRT; every point that the beam strikes on the sample is mapped directly onto a
corresponding point on the screen [2]. As a result, the magnification system is
simple and linear magnification is calculated by the equation:
M=L/l (1)
where L is the raster’s length of the CRT monitor and l the raster’s length on the
surface of the sample.
SEM works on a voltage between 2 to 50kV and its beam diameter that scans the
specimen is 5nm-2µm. The principle images produced in SEM are of three types:
secondary electron images, backscattered electron images and elemental X-ray
maps. Secondary and backscattered electrons are conventionally separated
according to their energies. When the energy of the emitted electron is less than
about 50eV, it is referred as a secondary electron and backscattered electrons are
considered to be the electrons that exit the specimen with an energy greater than
50eV [4]. Detectors of each type of electrons are placed in the microscope in
proper positions to collect them.

Physics of Advanced Materials Winter School 2008 8
Figure 8. Geometry of SEM
4.1.2 Advantages and Disadvantages Electrons in scanning electron microscopy penetrate into the sample within a
small depth, so that it is suitable for surface topology, for every kind of samples
(metals, ceramics, glass, dust, hair, teeth, bones, minerals, wood, paper,
plastics, polymers, etc). It can also be used for chemical composition of the
sample’s surface since the brightness of the image formed by backscattered
electrons is increasing with the atomic number of the elements. This means that
regions of the sample consisting of light elements (low atomic numbers) appear
dark on the screen and heavy elements appear bright. Backscattered are used to
form diffraction images, called EBSD, that describe the crystallographic structure
of the sample. In SEM, X-rays are collected to contribute in Energy Dispersive X-
Ray Analysis (EDX or EDS), which is used to the topography of the chemical
composition of the sample.
Consequently, SEM is only used for surface images and both resolution and
crystallographic information are limited (because they’re only referred to the
surface). Other constraints are firstly that the samples must be conductive, so
non-conductive materials are carbon-coated and secondly, that materials with
atomic number smaller than the carbon are not detected with SEM.
4.1.3 SEM Today
As time goes on, the ultimate resolution of the SEM levels out near 0.6nm at 5kV.
In Scanning Trasmission Electron Microscopy in which internal microstructure
images of thin specimens are obtained, achieved resolution is up to 1.5nm at
30kV.
4.1.4 Environmental SEM (ESEM)
The major growth of SEMs is in the development of specialized instruments.
Environmental SEM uses differential pumping to permit the observation of
specimens at low-pressure gaseous environments (e.g. 1-50 Torr), at high
relative humidity (up to 100%) and at higher pressures. In this type of SEM,
there’s no need for conductive coating, the secondary electron detector operates

Physics of Advanced Materials Winter School 2008 9
in the presence of water vapour, and in the microscope’s column there are
pressure-limiting apertures. The ESEM is ideal for non-metallic surfaces, such as
biological materials, plastics and elastomers [4].
4.2.1 TEM
Transimission Electron Microscopy (TEM) is a technique where an electron beam
interacts and passes through a specimen. The electrons are emitted by a source
and are focused and magnified by a system of magnetic lenses. The geometry of
TEM is shown in figure 9. The electron beam is confined by the two condenser
lenses which also control the brightness of the beam, passes the condenser
aperture and “hits” the sample surface. The electrons that are elastically
scattered consist the transmitted beams, which pass through the objective lens.
The objective lens forms the image display and the following apertures, the
objective and selected area aperture are used to choose of the elastically
scattered electrons that will form the image of the microscope. Finally, the beam
goes to the magnifying system that is consisted of three lenses, the first and
second intermediate lenses which control the magnification of the image and the
projector lens. The formed image is shown either on a fluorescent screen or in
monitor or both and is printed on a photographic film.
Figure 9. Transmission electron microscope with all of its components
4.2.2 Operation
The operation of TEM requires an ultra high vacuum and a high voltage. The first
step is to find the electron beam, so the lights of the room must be turned off.
Through a sequence of buttons and adjustments of focus and brightness of the
beam, we can adjust the settings of the microscope so that by shifting the sample
holder find the thin area of the sample. Then tilting of the sample begins by
rotating the holder. This is a way to observe as much areas as we can, so we can
obtain as much information.

Physics of Advanced Materials Winter School 2008 10
Different types of images are obtained in TEM, using the apertures properly and
the different types of electrons. As a result, diffraction patterns are shown
because of the scattered electrons. If the unscattered beam is selected, we obtain
the Bright Field Image. Dark Field Images are attained if diffracted beams are
selected by the objective aperture. Also in TEM, analysis is done with EDX
(Energy Dispersive X-ray), EELS (Electron Energy Loss Spectrum), EFTEM
(Energy Filtered Transmission Electron Microscopy),etc data.
In transmission microscopy, we can actually see the specimen’s structure and its
atomic columns, thus compositional and crystallographic information is attained.
However, is a very expensive technique, expertise is needed and the sample
preparation phase is too difficult so that very thin samples are achieved.
4.2.3 Sample Preparation
The first step is to decide whether the sample is useful to be observed and in
which view, plan or cross-section. Due to the strong interaction between electrons
and matter, the specimens have to be rather thin, less than 100nm. This is
achieved with several methods, depending on the material. In general,
mechanical thinning is used to thin and polish the sample. Then it is glued with
epoxy glue on a really small and round holder. Whereas TEM data come from the
edges of a hole in the centre of the specimen, in sample preparation, the hole is
created by the method of ion thinning. Ion thinning is a method where a
specimen is irradiated with beams of Ar ions (usually), and after a period of time
a hole is created. To minimize the damage created during focus ion beam milling,
the embedded sample can first be coated with a metal deposition layer [5].
Consequently, sample preparation is a precise and a severe procedure, which
may affects the results of the microscopic analysis and study.
4.2.4. Main difficulties in the exploitation of TEM Transmission Microscopy provides several types of images, as reported above.
The diffraction patterns show dots, regions or circles originating from the sample
area illuminated by the electron beam that depend on the material’s structure.
Monocrystals show distinguished dots in diffraction patterns, polycrystalline
materials common centred circles and amorphous materials diffused circles.
Distortions and defects are visible in bright and dark field images, but expertise is
needed in order to interpret whether they are defects or artifacts. Electron or ion
beam damages must be considered in TEM analysis, because of the sensibility of
the sample and its really low thickness.
Additionally, there’s always the problem of calibration and alignment of the
instrument. Both of them require experience and skills so the resulting images
and data that emerge are reliable and free of objective astigmatism. These works
have to be done in order to keep the instrument in excellent working condition.
4.2.5 Important Technological Challenges TEM provides accurate measurements and studies in different types of materials,
given that observations are in atomic scale in HRTEM. This is due to technology
that reduces the errors and corrects more and more the interferences in formed
images.
In order to improve the results of TEM, ultra high vacuum with no vibrations is
needed, fact that emerge the production of different types of pumps such as
mechanical pumps, oil diffusion pumps, ion getter pumps, cooled stage. Higher

Physics of Advanced Materials Winter School 2008 11
voltage up to 3MV and small probe size were developed, and methods to assure
monochromaticity and coherency of the electrons. This is a way to avoid «
chromatic aberration » and «spherical aberration», the most usual errors in
electron microscopy. Lastly, stability of the beam and sample position to
vibrations, drift etc, are achieved.
Today’s transmission electron microscopes offer resolutions up to 0.1nm at 300kV
and probe diameters up to 0.34nm. Thus, future trends include the use of
ultrahigh vacuum TEM instruments for surface studies and computerized data
acquisition for quantitative image analysis.
5.References
[1] William R. Herguth, President, Guy Nadeau.Applications of Scanning
Electron Microscopy and Energy Dispersive Spectroscopy (SEM/EDS)
To Practical Tribology Problems. Senior Technical Associate Herguth
Laboratories, Inc.
[2] R.F. Egerton. Electron Energy-Loss Spectroscopy in the Electron
Microscope.
[3] M.Von Heimendahl, W.Bell, G.Thomas. Applications of Kikuchi line
Analyses in Electron Microscopy. Journal of Applied Physics 35 (1964)
3614.
[4] C. Richard Brundle, Charles A. Evans Jr, Shaun Wilson. Encyclopedia of
materials characterization, Butterworth-Heinemann publications, 1992.
[5] Joachim Mayer, Lucille A. Giannuzzi, Takeo Kamino, and Joseph Michael.
TEM Sample Preparation and FIB-Induced Damage. Mrs Bulletin,
volume 32, May 2007.