electromagnetic radiation test facilities evaluation of ... ·...
TRANSCRIPT

REFERENCENBS
PUBLICATIONS
NBSIR 86-3051
A 11 IDS 2 4 7 1> 2 4
It
Crawford, M^ron ^24762400100 use No -8e-3«r1T8i^i
,c
cr
?^s .p
ELECTROMAGNETIC RADIATION TESTFACILITIES EVALUATION OFREVERBERATION CHAMBERS LOCATEDAT NSWC, DAHLGREN, VIRGINIA
Myron L. Crawford
Galen H. Koepke
National Bureau of StandardsU.S. Department of CommerceBoulder, Colorado 80303
June 1986


/ RBS
RESEARCH
INFORMATION
CENTER
NBSIR 86-3051
ELECTROMAGNETIC RADIATION TESTFACILITIES EVALUATION OFREVERBERATION CHAMBERS LOCATEDAT NSWC, DAHLGREN, VIRGINIA
Myron L. Crawford
Galen H. Koepke
Electromagnetic Fields Division
Center for Electronics and Electrical Engineering
National Engineering Laboratory
National Bureau of StandardsBoulder, Colorado 80303
June 1986
Sponsored by
Naval Surface Weapons Center
Dahlgren Laboratories
Dahlgren, Virginia 22448
U.S. DEPARTMENT OF COMMERCE, Malcolm Baldrige, Secretary
NATIONAL BUREAU OF STANDARDS, Ernest Ambler, Director


CONTENTS
Page
List of Figures and Tables v
1 . 0 Introduction 1
2.0 Description of the NSWC Reverberation Chamber Facilitiesand NBS Evaluation System 2
3.0 Reverberation Chambers Evaluation Results 4
3.1 Antenna Coupling Efficiency and VSWR 4
3.2 Tuner Effectiveness3.3 Test Zone E-Field Uniformity3.4 E-Field Amplitude Calibration
4.0 Comparison of NSWC Reverberation Chambersand NBS Reverberation Chamber 7
5.0 Summary of Measurement Uncertainty 8
5.1 Estimate of Uncertainty in Establishing E-Field AmplitudeInside the Chambers 8
5.2 General Comments 10
6.0 Summary and Conclusions 11
7.0 Acknowledgments 12
8.0 References 13
iii
CTv
U1


LIST OF FIGURES AND TABLES
Figure 1
.
Figure 2.
Figure 3.
Figure M.
Figure 5.
Figure 6.
Figure 7.
Figure 8.
Figure 9.
Figure 10
Figure 11
Figure 12
Cross sectional views of NSWC reverberation chamber(s) showingplacement of tuner(s), transmitting and receiving antennas, andprobe used to evaluate E-field amplitude inside the chamber(s).
Photographs of interior of NSWC "half” reverberation chambershowing transmitting antennas mounted on side wall and tunermounted from ceiling.
Photograph showing closeup of NSWC reverberation chamber tuner.
Photograph of video monitoring camera mounted inside NSWCreverberation chambers.
Block diagram of NBS system used in evaluation of NSWCreverberation chambers.
Statistical representat i on of the composite VSWR of thetransmitting antennas used to launch the fields inside the NSWCreverberation chambers, (see table 1)
Coupling efficiency (maximum, average and minimum losses)between transmitted and received powers measured at antennas'terminals inside NSWC reverberation chambers, (see table 1 for
definition of antennas used.)
Ratio of maximum to minimum received power obtained by rotatingtuner(s) in the frequency range 100 MHz to 18 GHz inside theNSWC reverberation chambers.
Cross sectional views and photograph of NSWC reverberationchambers showing placement of NBS isotropic probes forevaluation of spatial distribution of E-fields.
Spatial distribution of the E-field measured inside the NSWChalf reverberation chamber using array of 10 NBS isotropicprobes: (a) average, and (b) maximum. Net input powernormalized to 1 watt. Transmitting antennas are log periodic,0.1 GHz to 1.0 GHz, and low power horn, 1.0 GHz to 2.0 GHz.
. Spatial distribution of the E-field measured inside NSWC fullreverberation chamber using array of 10 NBS isotropic probes:(a) average, and (b) maximum. Net input power normalized to 1
watt. Transmitting antennas same as figure 10.
. Spatial distribution of the E-field measured inside NSWC fullreverberation chamber using array of 10 NBS isotropic prober,
,
100 MHz to 300 MHz: (a) average, and (b) maximum. Net inputpower normalized to 1 watt. Log periodic transmitting antennareplaced by Cavitenna.
v

Figure 13. Average values of the E-field strength measured inside NSWCreverberation chambers using array of 10 NBS isotropic probeswith 1 watt net input power: (a) and (c) average of theaverages, (b) and (d) average of the maximums. Transmittingantennas same as figure 10.
Figure 14. Average values of the E-field strength measured inside NSWC fullreverberation chamber using array of 10 NBS isotropic probes,100 MHz to 300 MHz: (a) average of the averages, (b) average ofthe maximums. Net input power normalized to 1 watt. Logperiodic transmitting antenna replaced with cavitenna.
Figure 15. Average and maximum E-field strength determined inside NSWCreverberation chambers using: (1) composite of three receivingantennas (see table 1) received power measurements, and (2)
calibrated 1 cm dipole probe measurements. Net input powernormalized to 1 watt.
Figure 16. Average and maximum E-field strength inside empty NBSreverberation chamber for 1 watt net input power determinedfrom: (1) composite of 3 antennas received power measurements,and (2) calibrated 1 cm dipole probe measurements.
Figure 17. Comparison of the peak responses of NBS 1 cm dipole probe andNBS single ridged horn to normalized E-field of 37 dB V/mdetermined using NBS and NSWC reverberation chambers, (a) 1 cmdipole probe, (b) ridged horn.
Table 1 . Transmitting and receiving antennas used in the NSWCreverberation chambers evaluation.
Table 2. Spatial variations in the E-field average and maximum valuesmeasured inside the NSWC reverberation chambers.
Table 3. Summary and estimates of measurement uncertainties fordetermining field strength inside NSWC reverberation chambers -
Mode Tuned (100 MHz - 2.0 GHz).
Table 4. Summary and estimates of measurement uncertainties fordetermining field strength inside NSWC reverberation chambers -
Mode Stirred (1.0 GHz -18.0 GHz).
Table 5. Estimates of impedance mismatch uncertainties for received power
measurements for NSWC reverberation chambers.
vi

Electromagnetic Radiation Test FacilitiesEvaluation of Reverberation ChambersLocated at NSWC, Dahlgren, Virginia
Myron L. CrawfordGalen H. Koepke
Electromagnetic Fields DivisionNational Bureau of Standards
Boulder, Colorado 80303
This report describes measurement procedures and resultsobtained from evaluating the reverberation chamber facilitieslocated at the Naval Surface Weapons Center (NSWC), Dahlgren,Virginia. The two chambers tested are referred to as 1) the halfchamber, and 2) the full chamber. The facilities were developedby the NSWC for use in measuring and analyzing theelectromagnetic susceptibility/vulnerability (EMS/V) of weaponsystems and the shielding effectiveness of enclosures andshielding materials. A brief description of each facility is
given including the instrumentation used for performing theevaluation and calibration of the facilities by the NationalBureau of Standards (NBS). Measurements described include: 1)
evaluation of the chambers' transmitting and receiving antennas'voltage standing wave ratios; 2) measurement of the chambers'insertion loss or coupling efficiency versus frequency; 3)measurement of the chambers' tuner effectiveness; 4)
determination of the E-field uniformity in the chambers' testzones versus frequency; 5) determination of the absoluteamplitude calibration of the test E-fields in the chambers basedupon the reference antennas received power measurements andcalibrated dipole probe antenna measurements; and 6) comparisonof reference equipment under test (EUT) responses to test fieldsestablished inside the NSWC reverberation chambers and the NBSreverberation chamber. These results can then be compared toanechoic chamber results. Conclusions given indicate that theNSWC chambers can be used at frequencies down to approximately150 MHz. Estimates are given of the measurement uncertaintiesderived empirically from the test results.
Key words: electromagnetic radiated susceptibility/vulnerabilitymeasurements; reverberation chamber.
1.0 Introduction
The use of a reverberation chamber for performing EMS/V measurements is
relatively new. Considerable work has been done in the past to evaluate anddocument methods for using this technique [1-4], Recently, considerableresearch work has been done at the National Bureau of Standards (NBS) to
1

carefully evaluate, develop (when necessary), describe, and document themethodology for performing radiated susceptibility/vulnerability (EMS/V)measurements using a reverberation chamber. This effort is described in anNBS publication, NBS TN 1 092 [5]. The incentive for performing this workstems from the numerous advantages suggested for the use of a reverberationchamber. These include:
1. Electrical isolation from or to the external environment;2. Accessibility (indoor test facility);
3. The ability to generate high level fields efficiently over largetest volumes;
M . Broad frequency coverage;5. Cost effectiveness;6. Potential use for both radiated susceptibility and emission testing
with minor instrumentation changes;
7. No requirement of physical rotations of the equipment under test(EUT)
;
8. Security; and9. Personnel not exposed to radiated test fields.
These advantages are somewhat offset by limitations which include lossof polarization and directivity information relative to the EMC/EMI profileof the EUT and somewhat limited measurement accuracy. However, thistechnique does offer a time-efficient, cost-effective way to evaluate the
EMS/V performance of large equipment using a shielded enclosure with minormodifications. The measurement concept utilizes the shielded, high-Q,
multimoded environment to obtain uniform (time averaged) fields that maysimulate "real world", near field environments. Also, it may well be the
only technique by which very high exposure fields can be safely generatedfor performing EM susceptibility tests required by the Department of Defensefor some of their "real world" applications.
These considerations, along with others, motivated the Naval SurfaceWeapons Center, Dahlgren, VA to invest in the research and development of
this methodology and finally to construct and place into operation the
facilities whose description and evaluation are given in this report.Measurements described were performed between May 10 and May 31, 1985.
2.0 Description of the NSWC Reverberation Chamber Facilities and NBSEvaluation System
The NSWC reverberation chambers are made from one large shieldedenclosure partitioned into two compartments with a double walled bulkheadremovable panel. The two chambers evaluated consist of: 1) the "halfchamber", 3.51 m x 5.18 m x 5.86 m in size (which is actually a little over
half of the full size enclosure), and 2) the full chamber, 3.51 m x 5.18 m x
10.82 m in size. The enclosure is constructed of continuous welded steel
sheeting similar to the NBS reverberation chamber [5]. It is equipped withtwo large 2.13 m x 2.13 m air inflatable sliding doors located at each end
for access into the two compartments when the partition is in place. Eachcompartment has its own tuner as shown in figure 1. Typically only the
larger of the two compartments (half chamber), or the full size chamber areused for performing EMS/V tests. The particular chamber in use (half or
full) is excited by transmitting antennas located either close to a corner,
2

oriented toward the corner (150 MHz - 1.0 GHz), or on the side wall of the
chambers oriented toward the tuner (1.0 GHz - 18 GHz) as shown in figures 1
and 2. Forty-five degree waveguide elbows are used at frequencies above 8.0
GHz. The purpose of these antenna placements is to couple the transmittedsignal into all possible chamber modes as efficiently and uniformly as
possible without favoring particular modes or transmitting directly into the
chamber’s test zone, or coupling the signal directly between thetransmitting and receiving antennas. This is necessary to obtain a uniform,
statistical, spatial distribution of the field in the chamber's test zone.
A single tuner, mounted from the ceiling (figures 2 and 3) was used for thehalf chamber evaluation tests. A second tuner, also ceiling mounted, was
activated for the full chamber evaluation tests. The chambers have remotevideo monitoring equipment shown in the photograph of figure M. Thisequipment is EMI hardened and was left in the chambers during the evaluationtests. The reference receiving antennas (used for determining the fieldstrength in the chamber) are placed in and oriented toward one corner of the
chamber as shown in figure 1 . The transmitting and reference receivingantennas used within their specified frequency bands are identified in Table1 .
The chambers were evaluated using two different operational approachesreferred to as mode-tuned and mode-stirred [5]. The mode-tuned approach wasused at frequencies from 100 MHz to 2 GHz, and the mode-stirred approach wasused at frequencies from 1.0 GHz to 18 GHz.
For the mode-tuned tests, the tuner is stepped at selected, uniformincrements, permitting measurements of the net input power supplied to thetransmitting antenna, the receiving antenna power, field-measuring probesresponses and the EUT response at each tuner position. This allowscorrections to be made for the changes in the transmitting antenna's inputimpedance as a function of tuner position and frequency so that themeasurement results can be normalized to a constant net input value (1 wattfor these tests). The number of tuner steps per revolution used were 200 at
frequencies below 1.0 GHz and MOO in the frequency range 1 - 2 GHz.
For the mode-stirred tests, the tuner is continuously rotated whilesampling the reference antenna received power, field probe response and theEUT response at rates much faster than the tuner revolution rate. Thesemeasurements are made using a spectrum analyzer, diode detectors, and"smart" voltmeters that are capable of data storage and calculation ofstatistical functions such as mean values and standard deviations. The modestirred approach allows large data samples (up to 9,999) to be obtained fora single tuner revolution. Tuner revolution rates can be adjusted to meetthe EUT output monitor and diode probe response time requirements. Typicalrates used are approximately 3 to 6 minutes per revolution.
A block diagram of the basic system used to evaluate the chambers is
shown in figure 5. The test field was established inside the chamber underevaluation by means of an rf source connected to the appropriatetransmitting antenna defined in table 1. Modes excited inside the chamberwere then stirred by rotating the tuner(s) which function as field-perturbing devices. The test zones in the chambers were defined as thechambers’ volume less a minimum separation from the walls, and ceiling of1/2 meter. Placement of an EUT should fall within this volume exc-ptpossibly relative to the floor which mav be less than 1/2 meter depending
3

-
r*-
CP
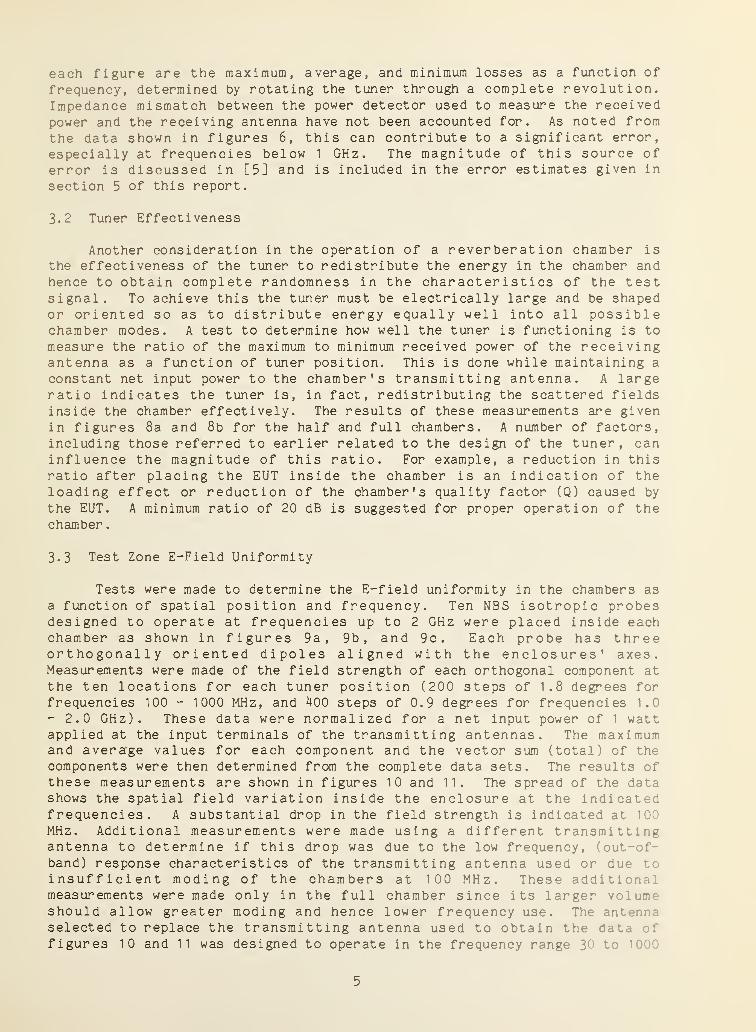
each figure are the maximum, average, and minimum losses as a function of
frequency, determined by rotating the tuner through a complete revolution.Impedance mismatch between the power detector used to measure the receivedpower and the receiving antenna have not been accounted for. As noted fromthe data shown in figures 6, this can contribute to a significant error,
especially at frequencies below 1 GHz. The magnitude of this source oferror is discussed in [5] and is included in the error estimates given in
section 5 of this report.
3.2 Tuner Effectiveness
Another consideration in the operation of a reverberation chamber isthe effectiveness of the tuner to redistribute the energy in the chamber andhence to obtain complete randomness in the characteristics of the testsignal. To achieve this the tuner must be electrically large and be shapedor oriented so as to distribute energy equally well into all possiblechamber modes. A test to determine how well the tuner is functioning is to
measure the ratio of the maximum to minimum received power of the receivingantenna as a function of tuner position. This is done while maintaining a
constant net input power to the chamber's transmitting antenna. A largeratio indicates the tuner is, in fact, redistributing the scattered fieldsinside the chamber effectively. The results of these measurements are givenin figures 8a and 8b for the half and full chambers. A number of factors,including those referred to earlier related to the design of the tuner, caninfluence the magnitude of this ratio. For example, a reduction in thisratio after placing the EUT inside the chamber is an indication of theloading effect or reduction of the chamber's quality factor (Q) caused by
the EUT. A minimum ratio of 20 dB is suggested for proper operation of thechamber
.
3.3 Test Zone E-Field Uniformity
Tests were made to determine the E-field uniformity in the chambers as
a function of spatial position and frequency. Ten NBS isotropic probesdesigned to operate at frequencies up to 2 GHz were placed inside eachchamber as shown in figures 9a, 9b, and 9c. Each probe has threeorthogonally oriented dipoles aligned with the enclosures' axes.Measurements were made of the field strength of each orthogonal component at
the ten locations for each tuner position (200 steps of 1.8 degrees forfrequencies 100 - 1000 MHz, and 400 steps of 0.9 degrees for frequencies 1.0-2.0 GHz). These data were normalized for a net input power of 1 wattapplied at the input terminals of the transmitting antennas. The maximumand average values for each component and the vector sum (total) of thecomponents were then determined from the complete data sets. The results ofthese measurements are shown in figures 10 and 11. The spread of the datashows the spatial field variation inside the enclosure at the indicatedfrequencies. A substantial drop in the field strength is indicated at 10C
MHz. Additional measurements were made using a different transmittingantenna to determine if this drop was due to the low frequency, (out-of-band) response characteristics of the transmitting antenna used or due toinsufficient moding of the chambers at 100 MHz. These additions,measurements were made only in the full chamber since its larger volum--
should allow greater moding and hence lower frequency use. The antennaselected to replace the transmitting antenna used to obtain the data offigures 10 and 11 was designed to operate in the frequency range 30 to 1
5

MHz. The antenna's lower frequency limit is well below the 100 MHzanticipated lower frequency limit for the full size chamber. Results of themeasurements are shown in figure 12. A comparison of these results withfigure 11 indicate the chamber is operating properly down to 100 MHz. Thedrop in E-field indicated in figure 11 at 100 MHz is believed then, to bedue to the out of band response characteristics (poor VSWR and/orefficiency) of the log periodic antenna used in obtaining the data offigures 10 and 11. The spread in the data (spatial distribution) atselected frequencies is summarized in table 2. The spread is as great as ±
8 dB at 100 MHz (half chamber) decreasing to approximately ± 3.5 dB at 300MHz, ± 2 dB at 1.0 GHz, and ± 1.5 dB. at 2.0 GHz. The average values,determined statistically from the data measured at the ten locations, forthe average and maximum E-fields of each component and their composite totalare summarized in figures 13 and 14. Note that the relative amplitudes ofthe field components are approximately the same and the composite total ofthe average E-field components is approximately 4.8 dB or a ratio of /3greater than the individual components. This indicates the measured valuesof the average of each component are independent of polarization in the
chamber. Hence, the average field inside the chambers appears to berandomly polarized. The composite total however, of the E-field components'maxima (figures 1 3b, 1 3d ,and, 1 4b) are less than 4.8 dB. This indicates thatthe maximum measured values for each component are not independent (i.e.,
E ,, , ,, is a function of E etc.). This is similar to the resultsx(total) y(total)obtained in the NBS reverberation chamber and appears to be inherent in the
reverberation chamber measurement method. The implication is that ifmultiple receptors are involved in establishing the maximum susceptibilityof an EUT (for example in measuring the E-field in the chamber by using anisotropic probe with 3 orthogonal dipoles), the difference between the
maximum and average response determined for the EUT may be incorrectlyweighted (less than the 7-8 dB anticipated). (See section 2.3 of [5].)
3.4 E-Field Amplitude Calibration
The field strength in the chamber can be determined in two ways. The
first is to measure the power received by the reference antennas, and thendetermine the equivalent power density in the enclosure using the equation
wave impedance in the chamber, P ’ is the equivalent power density in the
enclosure, A is the wavelength, and P ' is the average measured received
power. The averaged wave impedance is assumed to be approximately equal to
1
2
Ott ohms. The validity of (1) has been verified and is discussed insection 2.3.1 of NBS TN 1092 [5].
The maximum and average electric field strengths inside the NSWCchambers determined from the receiving antenna power measurements and (1 )
[5],
(V/m)
,
( 1 )
where E is the equivalent electric field, n' is the statistically averaged3.
6

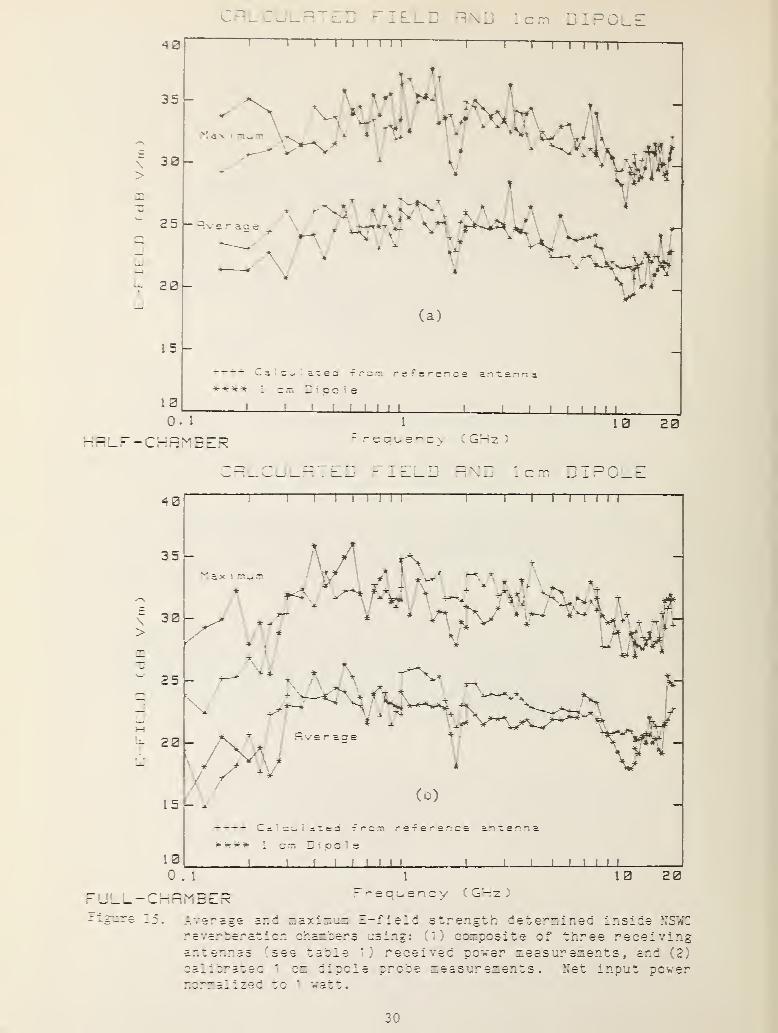
are shown in figures 15a and 15b. These data were obtained for a 1 watt net
input power to the enclosure's transmitting antenna.
The electric field strength inside the chambers can be determined a
second way by measuring it with one or more calibrated probes. Dataobtained using a 1 cm dipole probe fabricated a>t the NBS are also shown on
figures 15a and 15b. The probe was calibrated in a planar field using a TEM
cell [6] at frequencies up to 500 MHz and in an anechoic chamber at
frequencies from 500 MHz to 18 GHz [7]. The assumption is made that the
field strength over the aperture of the probe inside the reverberationchambers will approximate the planar field used to calibrate the probe.
This is reasonable, at least at frequencies for which the probe iselectrically small. Also, the open-space far-field gain of an electricallysmall dipole is small (1.76 dB). Thus, the probe-measured fields should be
equivalent, within approximately 1.76 dB, to the E-fields determined using a
receiving antenna. This is true if the equivalent gains for the probe andreceiving antenna, after being placed inside the chambers, are assumed to be
unity. The agreement shown is typical of the random variations in the dataused to determine the field strength inside the reverberat ion chambers.
4.0 Comparison of NSWC Reverberation Chambers with NBS ReverberationChamber
Since the NSWC chambers are very similar to the NBS chamber (all areconstructed of continuous welded steel sheeting), it is of value to compareevaluation results obtained for the different chambers. Such a comparisonwas made to answer two significant questions. First, can the input powerrequirements of a chamber as a function of its size be estimated based uponthe calibration of a chamber of similar construction, and second, aresusceptibility test results obtained for the same EUT in differentreverberation chambers comparable? Results shown in figures 16 and 17
indicate that both questions are answered in the affirmative. Figure 16
shows the fields inside the NBS chamber calculated from the chambers'reference antenna received power measurements and also measured by thecalibrated 1 cm long dipole probe. These data can then be compared withfigures 15a and 15b showing the same type data for the NSWC chambers. Thenet input power was normalized to one watt for all three chambers. Thefield inside the NBS chamber is approximately 4 dB stronger than the NSWChalf chamber and 6 dB stronger than the NSWC full chamber. It isinteresting to recall from theory that the power density inside a secondchamber can be estimated from a calibrated chamber by using the equation[5],
V2
Q,
U1
«2
( 2 )
where is the power density, V is the volume and Q is the quality factor
for the particular chamber (1 or 2). If we assume the first chamber is th*
NBS chamber with a volume, = 38.19 cubic meters and Q = 0.548/6,, n :
the second chamber is the larger, full size NSWC chamber with a V. 1
9
1
7

0.887/6cubic meters and 2 , the ratio in average power densities
(assuming the same net input power and the same metal, 6j = 6 2 )» /P.d
1
d2
3.22. (The parameter, 6, is the skin depth of the metal used in theenclosures.) The average power density inside the larger chamber would beapproximately 1/3.22 or 0.311 times as much as that in the NBS enclosure.This is equal to about 5 dB, a little less than the approximate 6 dBdifference indicated by comparing figures 15b and 16, but still withinreason.
The positive answer to the second question, that of obtainingcomparable susceptibility results using different chambers, is demonstratedin figures 17a and 17b. These graphs show the comparison in measuring theresponses of the NBS 1 cm dipole probe and a rectangular single ridged hornto a normalized 37 dB V/m field inside the 3 different reverberationchambers. Comparisons of the estimated curve fits for each data set agreequite well (within approximately 2 dB).
An effort was also made to compare results obtained, for the tworeference standard EUT referred to above (section 4), between thereverberation chambers and an anechoic chamber to estimate a "correlationfactor." The results consisted of the measured peak output response of twoEUTs exposed to test fields in the two environments of the same relativeamplitude. The anechoic chamber used was a 4.9 m x 6.7 m x 8.5 m chamberlined with 66 cm high-frequency rf absorber located at NBS, Boulder,Colorado. The EUTs were designated as references because they are simplestructures that can be accurately characterized both theoretically andexperimentally. The outcome of this effort can be found in NBS TN 1092 [5].
5.0 Summary of Measurement Uncertainty
5.1 Estimate of Uncertainty in Establishing E-Field Amplitude inside theChambers
Susceptibility/vulnerability test fields established inside thechamber (s) can be determined two ways: either using a reference receivingantenna or a calibrated probe. If a reference receiving antenna is used,the field is determined in terms of "equivalent" power density or
"equivalent" electric field strength by using (1). If a calibrated E-fieldprobe is used, the field strength is measured relative to an equivalentprobe response in a known planar field. An estimate of the uncertainties in
each of these methods can be determined by analyzing the contributingparameters involved in each method. The significant sources of error aresummarized in tables 3 and 4 for the mode-tuned and mode stirred approachesrespectively, within their appropriate frequency bands. Four majorcategories are identified. The first is the uncertainty in determining the
received power measured by the reference antennas, (la. tables 3 and 4), or
in measuring the E-field with the calibrated probe, (1b. tables 3 and 4),
The uncertainty in determining the received power is broken up into fivecomponents: cable loss, attenuator calibration, reference antennaefficiency, power meter or spectrum analyzer measurement uncertainties, andimpedance mismatch. Values shown for the first four components are typical
of estimated uncertainties stated for these types of measurements andinstruments. The fifth component, impedance mismatch is the uncertainty in
8

determining the actual power delivered to the detector (load) attached tothe antenna (source) relative to the power available. The actual or
measured power is a function of the impedance match between the source andload, with maximum power transfer occurring when a conjugate impedance matchexists
.
Power transfer between a source and a load is given as
Pf
fraction of maximum,
^ _| r
i
2
^
,
1
available power absorbed = ^ S ^
^
|L
by the loadi
. f ri
2
1 S L 1
(3)
where r c and r. denote complex reflection coefficients for the source andO Li
load respectively. The magnitudes, |Tg| and |r^| can be obtained from the
appropriate VSWR by the expressions
VSWR - 1
VSWR + 1
i = S or L .
The VSWRs for the reference antennas (sources) and power detectors(loads) used in the NSWC reverberation chambers are given in table 5. Thesevalues were used to calculate the estimated uncertainties shown for themismatch errors in tables 3 and 4. Both the statistical average and maximumvalues are given.
Discussions of the uncertainty in calibrating E-field probes in planarfields can be found in [6,7]. Their response to fields inside a
reverberation chamber has been shown to be less than their response in a
planar field. The difference is proportional to their free-space gain [4].
Typical probes used are electrically short dipoles over most of thefrequency range. Sometimes however, they are used beyond their resonancefrequency (for example the 1 cm dipole probe at frequencies above 15 GHz).The corrections needed to' correlate results obtained in the reverberationchambers with those obtained in free-space or in anechoic chambers thencorrespond to from 1.76 dB to 2.6 dB. The total estimated uncertainties of
using the NBS 1 cm dipole probe to measure E-field amplitudes in thereverberation chambers are shown on tables 3 and 4 (see 1b).
The second category of error, referred to as mixing or samplingefficiency, is divided into two parts. The first part relates to theability to obtain a uniform spatial field distribution (statistically)inside the chamber and to effectively destroy the polarizationcharacteristics of the exposure field, (i.e., the statistically determinedresponse characteristics of the EUT and chamber reference antenna areindependent of their directional properties.) The second part is theuncertainty due to limiting the number of tuner positions per revolutionwhen performing the measurement. This source of uncertainty is differentwhen determining the average as compared to the maximum field as shown : r.
the tables. Data contained in [5] (figure 2.27 and table 6.4) were used : r.
obtaining these estimates.
9

The third category of uncertainty relates only to determining theequivalent E-field strength in the chamber from the equivalent powerdensity. Recall that equation (1) assumes that the equivalent waveimpedance inside the chamber is 1 20tt ohms. In reality this is not true as
has been shown [5]. However, data shown in [5] can be and were used toprovide an estimate for this error. These data indicate that a waveimpedance as great as 1600 ohms can exist at frequencies below 500 MHz whenthe maximum E-field is measured. This corresponds to approximately 6 dB ofcorrection. However, a significant amount of data obtained to date,indicates that a well behaved relationship (7-8 dB difference) existsbetween the measured peak and average values of the E-field. This suggests,at least at frequencies above a f ew hundred megahertz where the chambers arehighly moded, that the peak value of the wave impedance for the maximummeasured E-field inside the chambers decreases as the frequency increases.In the limit, it is believed the value approaches 1 2
0
tt ohms. Thus thissource of error decreases as frequency increases. These observations arereflected in the uncertainty estimates shown in the cables.
The fourth source of error occurs if one fails to correct for net inputpower variations due to the loading effect of the chamber on the VSWR of thesource antennas. These corrections are made when using the mode-tunedapproach and hence are not included in table 3. They are not made however,when using the mode-stirred approach and hence are shown in table 4.
The total worst-case uncertainties for each method (receiving antennaand calibrated probe) of determining the E-field for both the mode-tuned andmode-stirred approaches are shown at the bottom of the appropriate table.These uncertainties should be regarded as a conservative estimate. The
probability of the true value of amplitude of the test field being near anextreme is small. This is because the probability of all error sourcesbeing at their extreme value in the worst possible combination is almostzero
.
A more realistic method of combining uncertainties is the root-sum-of-the-squares (RSS) method. The RSS uncertainty is based on the fact thatmost of the errors are statistically independent of each other and hencecombine like random variables.
Finding the RSS uncertainty requires that each individual uncertaintybe expressed in fractional form. The method of calculation follows the name- square the components, sum those squares and then take the square root.The results for both methods of determining the E-fields are shown at the
bottom of tables 3 and 4.
5.2 General Comments
Some general comments on interpreting uncertainties of immunitymeasurement results based upon the above experimental error analysis are
appropriate
.
1) The mismatch error at frequencies below 2 GHz, (particularly if
corrections are not made for the transmitting or receiving antennasmismatches looking into their source or load), will cause the fielddetermination inside the chamber to be low. This also causes the EUT
10

response results to be lower than they actually are. For example, the
low frequency data of figures 17a and 17b should be corrected (response
increased) proportionally to the systematic offset error estimatesshown in tables 3 and 4.
The wave impedance, when the peak response of an EUT is measured,appears to be higher than 120 tt ohms. This means that if the free spacewave impedance of 1 2
0
tt ohms is used in determining the correspondingpeak amplitude of the exposure field, there will be a systematic offseterror resulting in too low a calculated E-field exposure value. Since
the actual E-field is higher than the calculated value this results intoo high a EUT response indication for a specified E-field exposure.If the E-field is determined using a calibrated E-field probe, therestill remains a degree of uncertainty since the wave impedance is
different in the calibration environment as compared to thereverberation chamber environment. For this reason, this source oferror was included in calculating the total and RSS uncertainties inestablishing the E-field using the probe method.
3) The spatial variation in the measured, statistically determined E-fieldin the chambers resulting from a complete revolution of the tuner(s)decreases from as great as ± 8 dB at 100 MHz to less than ± 2 dB at 2.0GHz. It is expected that this variation will continue to decrease as
the frequency increases. However, high variations exist in theresponse data obtained for the reference standard EUT (1 cm dipole andridged horn) at frequencies where the spatial E-field variation aresmall. This is due to the other contributing sources of error as
discussed in 5.1. A way to reduce this problem is to increase thenumber of frequencies at which data are taken (clustered around a
particular frequency of interest) or increase the number of referencereceiving antennas or probes used to determine the exposure field andthen average the data (for example as was done in figures 13 and 14).
6.0 Summary and Conclusions
1. The practical lower frequency limits recommended for using the NSWChalf and full size chambers, assuming the transmitting antennas listedin table 1 are used, are approximately 200 MHz and 150 MHzrespectively.
2. Spatial variations in the E-field maximum and average valuesdetermined in the half and full chamber test volumes are shown in table2. These data were determined using the mode-tuned approach with 200tuner increments at 100 MHz to 1 000 MHz and 400 tuner increments at
1000 MHz to 2000 MHz for one complete tuner revolution. The limitationfor determining the spatial E-field variation is most likely due to theincreasing mode density and hence field complexity in the chamber as a
function of frequency. The limited sample size then becomesinsufficient to determine the actual maximums with greater accuracy.In reality, the spatial E-field variations should continue to decrease(less than ± 1 .8 dB) above 2 GHz if sufficiently large data samples aretaken and the measurement instrumentation has adequate dynamic rang'
and precision.

3.
Antennas used within the chambers for transmitting energy or fordetermining the test E-field amplitude should not be used outside theirrecommended frequency range. See table 1 for antennas recommended forthe NSWC chambers.
4.
The mode-tuned approach is recommended for use in both chambers at
frequencies below 1 GHz. Either mode-tuned or mode-stirred can be usedfrom 1 to 2 GHz. The mode stirred approach is recommended for useabove 2.0 GHz. This allows for some overlap in the measurementapproach selected. Based upon antenna VSWR and EUT response dataobtained from evaluation measurements, the following approaches andnumber of samples per tuner (s) revolution are suggested for performingsusceptibility testing.
Frequency Range Method # Tuner Positio:0.15 - 1.0 GHz Mode Tuned 2001.0 -- 2.0 GHz Mode Tuned 4001.0 — 4.0 GHz Mode Stirred >30004.0 - 18.0 GHz Mode Stirred >5000
5.
The maximum E-field is approximately 8 dB greater than the averageE-field established inside the chambers.
6.
The theory for predicting input power requirements for a secondunknown chamber based upon the known requirements of a first chamberappears to be valid.
7.
EMS/V data obtained for an EUT in similarly constructed, butdifferent reverberation chambers, are approximately the same.
8.
Since results of EUT response measurements made using the NSWCreverberation chambers are approximately the same as for the NBSreverberation chamber, it follows that these results will be lower thanwhen measured in the open field or in anechoic chambers. The"correlation factor" appears to be the open space (far-field) gain of
the EUT. This implies that susceptibility criteria determined for an
EUT using a reverberat ion chamber must include an additional factorproportional to the EUT ' s open-field estimated maximum gain as a
function of frequency.
9.
Also implied from 7 above is that the directional characteristicsof an antenna or EUT placed inside a reverberation chamber are lost,resulting in an equivalent gain in this complex environment of unity.
7.0 Acknowledgments
Work described in this report was sponsored by the Naval SurfaceWeapons Center, Dahlgren, Virginia, with Mr. John Bean as project monitor.The authors wish to acknowledge the assistance of Mr. Bean and MikeHatfield, NSWC, Lawrence C. Halley, EG&G, Washington Analytical ServicesCenter Inc., Dahlgren, Virginia and John Workman, NBS for their help and
cooperation in performing the measurements discussed in this report. In
addition, the authors express appreciation to Dr. Mark Ma, NBS for his
support, helpful comments and editorial review.
12

8.0 References
[1] Mendes, H.A. A new approach to electromagnetic field-strengthmeasurements in shielded enclosures. Wescon Tech. Papers; Los Angeles,CA. 1968 August.
[2] Cummings, J.R. Translational electromagnetic environment chamber, a
new method for measuring radiated susceptibility and emissions. Proc.IEEE Int. Symp. on EMC; 1975; San Antonio, TX.
[3] Corona, P.;Latmiral, G. ;
Paolini, E.;Piccioli, L. Performance of a
reverberation enclosure for power measurements in the microwave range.2nd Symp. Tech Exhibition on EMC; 1977; Montreux, Switzerland.
[4] Bean, J.L.; Hall, R.A. Electromagnetic susceptibility measurementsusing a mode-stirred chamber. Proc. IEEE Int. Symp. on EMC; 1978;Atlanta, GA.
[5] Crawford, M.L.; Koepke,
G.H. Design, evaluation and use of a
reverberation chamber for performing electromagneticsusceptibility/vulnerabilty measurements. Nat. Bur. Stand. (U.S.)Tech. Note 1092; 1986 April. 148 p.
[6] Crawford, M.L. Generation of standard EM fields for calibration ofpower density meters: 20 kHz to 1000 MHz. Nat. Bur. Stand. (U.S.)NBSIR 75-804; 1975 January. 40 p.
[7] Crawford, M.L.; Koepke, G.H. Comparing EM susceptibility measurementresults between reverberation and anechoic chambers. IEEE Inter. Symp.on EMC; 1985; Wakefield, MA.
13

Figure 1. Cross sectional views of NSWC reverberation chamber(s) showingplacement of tuner(s), transmitting and receiving antennas, andprobe used to evaluate E-field amplitude inside the chamber(s).Cavitenna and log periodic antennas used in location A for halfchamber when partition is in place. Cavitenna and log periodicantennas used in location B for full chamber when partition is
removed. Antennas on side wall remain in place for eitherchamber configuration (half or full).
14

15
Figure
2.
Photographs
of
interior
of
NSWC
"half"
reverberation
chamber
showing
transmitting
antennas
mounted
on
side
wall
and
tuner
mounted
from
ceiling.

16
Figure
3-
Photograph
showing
closeup
of
NSWC
reverberation
chamber
tuner.

Figure 4. Photograph of video monitoring camera mounted insidereverberation chambers.
NSWC
17

TUNER
CONTROL
o5=CO2<4H
O
Co
•l—
I
4->
CO
3i—
I
CO
>CD
C•H
•aCD
CO
3
ECD
CO
>>(0
COCO
<4-f
O
ECO
S-,
bOCO
HX3
XOorHCO
in
CD
S-3bO•rH
Cx-<
18
reverberation
chambers.

Composite VSWR of Transmit antennas in NSWC Chamber
Composite VSWR of Transmit antennas in NSNC Chamber
Full Chamber Frequency (GHz)
Figure 6. Statistical representation of the composite VSWR of thetransmitting antennas used to launch the fields inside the N.
reverberation chambers, (see table 1)
19

SYSTEM LOSS of NSNC Chamber
Full Chamber Frequency (GHz)|
Figure 7. Coupling efficiency (maximum, average and minimum losses)between transmitted and received powers measured at antennas'terminals inside NSWC reverberation chambers, (see table 1 fordefinition of antennas used.)
20

Tuner Effectiveness C20*Log(Ld. max/Ea min)]
Tuner Effectiveness C20*Log(La max/La min)]
NSWC Full Chamber Frequency (GHz)
Figure 8. Ratio of maximum to minimum received power obtained by rotatingtuner(s) in the frequency range 100 MHz to 18 GHz inside theNSWC reverberation chambers.
21

<fr
Tuner
Side View
Figure 9a. Cross sectional views of NSWC half size reverberation chambershowing placement of NBS isotropic probes for evaluation of
spatial distribution of E-fields.
22

Door
§
4
Side View
Figure 9b. Cross sectional views of NSWC full sire reverberation chambershowing placement of NBS isotropic probes for evaluation of
spatial distribution of E-fields.
23

**H ai •pH
rd CL4= O
Li
CJ H-*
O in
to ui no
z •H —
«
m•4-4 •pH
O to •4-i
oa 1
Z wMO •4-4
•pH •4-4 oLi oHI c:
-*-• op H-* pH
• pH c 4->
OJ Pe X)
*4-4 ai •pH
o a Li
rd H—
*
—
•
in
x: CL •pH
ca- T5rd
t-j cn —
«
cn £ rd
o PH • pH
-*-• 2 H—
*
o o rd
jp jC ea-
PH in rn
U in
D* ai
to xaZ o
MO.
•hh
o o• PH
OuJp oCL Mrd h-*
Li Ocj» in
o in
noO tO —
•
x m oi
O. Z -
•nowerd -*-* *4-i
C o0J
in 0 P£ «u ooi a
• ph rd •«-»
> —• PCL X)
24

AVERAGE CHRNNEL X, Half Chamber AVERAGE CHRNNEL Y, Half Chamber
RVERRGE CHRNNEL Z, Half Chamber RVERRGL Oh TOTAL, NSWC Half Chamber
5 2
2^4.
35
30
\h . \25
>
'
; " 6 v4-*-
j i
tn
11 20 i- j
1 pJLJ
, 5
i
6
L
1 0-7
-_U. J i_ i_ L 1 ..1 .1 a._i 1 _i__x 1 1 . 1 .
5
e 300 600 300 1200 1500 10002100
FREQUENCY (MHz)FREQUENCY ( MHz
)
MAXIMUM CHRNNEL X, Half Chamber MAXIMUM CHANNEL Y, Half Chamber
(b)MAXIMUM CHANNEL Z, Half Chamber
11. in FREQUENCY IMHjI
Figure 10. Spatial distribution of the E-field measured inside the NSWCchamber using array of 10 NBS isotropic probes: (a) aver i/
•
Net input power normalized to 1 watt. Transmitting antennas0.1 GHz to 1.0 GHz, and low power horn, 1.0 GHz to 2.0 GHz.
half reverberationand (b) maximum,are log periodic.
25

/
(a)
RVERRGE ON CHANNEL X, NSWC Full Chamber
FREQUENCY (MHz)
RVERRGE ON CHANNEL 2, NSWC Full Chamber
* * *“ 0
~r ~r T
.*4 i.O „ 4 ||S
•V '
.
r‘- G
s'
'
300 600 900 1200 1500 18002100FREQUENCY ( Ml iz )
AVERAGE ON CHANNEL Y, NSWC Full Chambe
Lin'liiiijiintH
1
1
'i
• i
jiiiilii'lijjf'ihVu
J . . I 1 I I 1 . I—
300 600 900 1200 1500 18002100FRLOUI.NCY ( MH/. )
/
(b) <
Figure 11.
® 25
MAXIMUM ON CHANNEL X, NSWC Full Chamber. MAXIMUM ON CHANNEL Y, NSWC Full Chamber.
t'i
W:r
,?
600 900 1200 1500 18002100FREQUENCY (MHz)
MAXIMUM ON CHANNEL Z, NSWC Ful
I
Chamber.
600 900 1200 1500 18002100FREQUENCY (MHz)
MAXIMUM OF TOTAL. NSWC Full Chamber
FREQUENCY (MHz)
Spatial distribution of the E-field measured inside NSWC full reverberationchamber using array of 10 NBS isotropic probes: (a) average, and (b) maximum.
Net input power normalized to 1 watt. Transmitting antennas same as figure 10
26

RVENRGE ON CHRNNEL X, NSWC Full Chamber.
(a)/<
«3 FREQUENCY (MHz)
fiver age of Channel Z, NSWC Ful I Chamber.
Average of Channel Y, NSWC Full Chamber.
five rage of TOTRL, NSWC Full Chamber.
(b)
\
>
/
\I
Maximum of Channel X, NSWC Full Ch a mb e r .
40
35
~ 30E
>
5 25
PJU 20ML.
I 5
l 050 100 150 200 250 300 350
+* FREQUENCY (MHz)
Maximum of Channel Z, NSWC" Ful I Chamber.
Maximum of Channel Y, NSWC Full Chamber
Overage of TOTRL, NSWC Ful I ChamberT~ ~r ~r ~r
9 e
I 7
1—L|—M-!
_lI S0
I
200I
250f REOUENC Y ( MM i >
Figure 12. Spatial distribution of the E-field measured inside NSWC full rev. r! .• •
i
chamber using array of 10 NBS isotropic probes, 100 MHz to 300 MHz:(a) average, and (b) maximum. Net input power normalized to 1 wait,periodic transmitting antenna replaced by Cavitenna.
27

|0 PROBE AVERAGE OF AVERAGE. NSWC Half Chamber
FREQUENCY (MHz)
10 PROBE AVERAGE OF MAXIMUM. NSWC Half Chamber
l0 PROBE AVERAGE OF AVERAGE. NSWC Full Chamber 10 PROBE RVERRGE OF MRXIMUM, NSWC Full Chamber
E\>
m-o
p_J
uh-i
L.
44 ,45 FREQUENCY (MHz)
Figure 13. Average values of the E-field strength measured inside NSWC
reverberation chambers using array of 10 NBS isotropic probes
with 1 watt net input power: (a) and (c) average of the
averages, (b) and (d) average of the maximums. Transmitting
antennas same as figure 10.
28

FIELD
CdB
V/m)
43
Figure 1
RVE of RVES and MRXS , NSNC Full Chamber.
FREQUENCY (MHz)
. Average values of the E-field strength measured inside NSWC fullreverberat ion chamber using array of 10 NBS isotropic probes,100 MHz to 300 MHz: (a) average of the averages, (b) average ofthe maximums. Net input power normalized to 1 watt. Logperiodic transmitting antenna replaced with cavitenna.
29
CALCULATED FIELD AND Icm DIPOLE
-CHAMBER Frequency (GHz)
-C--^BER
V
“requency (GHz)
Laximun I-field strength determined inside NSWCchambers _sir.g: ' composite of three receiving
: table ' received power measurements, and (2)
:m dipole probe measurements. h'et input powerW 3.X, X .
30

-FIELD
<dB
Wm
)
E-FIELD IN E>1PTY CHAMBER (MODE TUNED I, l WATT INPUT
Figure 16. Average and maximum E-field strength inside empty NBSreverberation chamber for 1 watt net input power determinedfrom: (1) composite of 3 antennas received power measurements,and (2) calibrated 1 cm dipole probe measurements.
31

OUTPUT
Normalized
to
37dB
V/m
(
dbm
)
OUTPUT
Normalized
to
37dB
V/m
(db
mV)
PERK RESPONSE o -f 1cm DIPOLE in VARIOUS CHRMBERS
PERK RESPONSE of RIDGED HORN in VARIOUS CHRMBERS
FREQUENCY (GHz)
Figure 17. Comparison of the peak responses of NBS 1 cm dipole probe andNBS single ridged horn to normalized E-field of 37 dB V/mdetermined using NBS and NSWC reverberation chambers, (a) 1 cm
dipole probe, (b) ridged horn.
32

Table 1. Transmitting and receiving antennas used in NSWC reverberationchambers evaluation
Frequency Transmitting Receiving(GHz)
0.1 - 0.2 Cavitenna Log Periodic *
0.2 -1 .0 Log Periodic Log Spiral
1.0- 2.0 1-2 GHz Lo.Pwr. Horn NBS Rect . Ridged Horn2.0 - 4.0 2-4 GHz Lo.Pwr. Horn NBS Rect. Ridged Horn4.0 - 8.0 4-8 GHz Lo.Pwr. Horn NBS Double Ridged Cir. Horn
8.0 - 12.0 8-12 GHz Lo.Pwr. Horn NBS Double Ridged Cir. Horn2.0 - 18.0 12-18 GHz Lo.Pwr. Horn NBS Double Ridged Cir. Horn
ed out of band. Recommend use of appropriate (in band) antenna.
Table 2. Spatial variations in the E-field average and maximum valuesmeasured inside the NSWC reverberation chambers
Frequency(GHz) Half
Variation in E-fieldChamber
(dB)
Full Chamber
100 < ± 8.0 < ± 7.0150 < + 7.0 < + 6.0200 < + 5.5 < ± 5.0300 < + 4.0 < + 3.5500 < ± 3.0 < + 3.01000 < + 2.5 < ± 2.32000 < ± 2.0 < + 1 .8
33
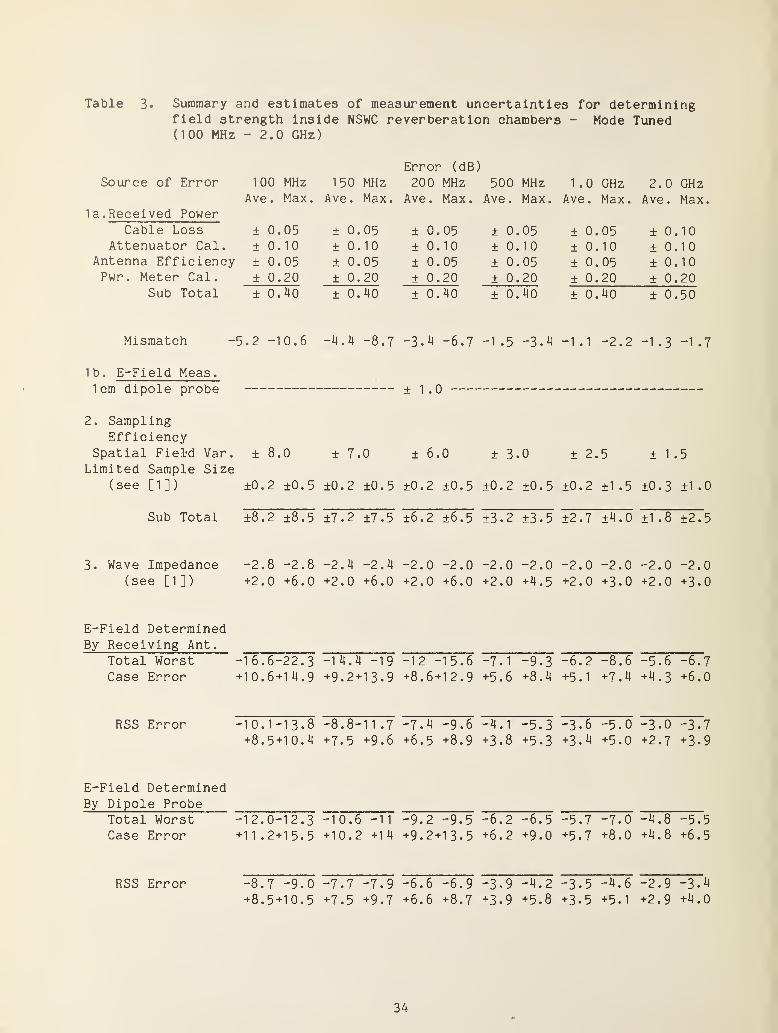
Table 3. Summary and estimates of measurement uncertainties for determiningfield strength inside NSWC reverberation chambers - Mode Tuned(100 MHz - 2.0 GHz)
Source of Error 100 MHz 150 MHz
la. Received PowerAve. Max. Ave. Max
Cable Loss ± 0.05 ± 0.05Attenuator Cal. ± 0.10 ± 0.10
Antenna Efficiency ± 0.05 ± 0.05Pwr. Meter Cal. ± 0.20 ± 0.20
Sub Total ± 0.40 ± 0.40
Mismatch 5.2 - 10.6 -4.4 -8.7
1b. E-Field Meas.1cm dipole probe
2. SamplingEfficiency
Spatial Field Var. ± 8 .0 ± 7 .0
Limited Sample Size(see [1 ]
)
±0.2 ±0.5 ±0.2 ±0.5
Sub Total ±8.2 ±8.5 ±7.2 ±7.5
3. Wave Impedance -2.8 -2.8 -2.4 -2.4
(see [1 ]
)
+2.0 +6.0 +2.0 +6.0
E-Field DeterminedBy Receiving Ant.
Total WorstCase Error
-16.6-22.3+ 10.6 + 14.9
-14.4 -19
+9.2+13.9
RSS Error -10.1-13.8+8.5+10.4
-8.8-1 1 .7
+7.5 +9.6
E-Field DeterminedBy Dipole Probe
Total WorstCase Error
-12.0-12.3+ 1 1 .2 + 15.5
-10.6 -11
+ 10.2 +1 4
RSS Error -8.7 -9.0
+8.5+10.5-7.7 -7.9
+7.5 +9.7
Error (dB)
200 MHz 500 MHz 1.0 GHz 2.0 GHzAve. Max. Ave. Max. Ave. Max. Ave. Max.
± 0.05 ± 0.05 ± 0.05 ± 0.10± 0.10 ± 0.10 ± 0.10 ± 0.10±0.05 ±0.05 ±0.05 ± 0.10± 0.20 ± 0.20 ± 0.20 ± 0.20± 0.40 ± 0.40 ± 0.40 ± 0.50
-3.4 -6.7 -1 .5 -3.4 -1.1 -2.2 -1.3 -1 .7
+ 1.0
± 6 .0 ± 3 .0 ± 2. 5 ± 1 • 5
±0.2 ±0.5 ±0.2 ±0.5 ±0.2 ±1 .5 ±0.3 ±1 .0
±6.2 ±6.5 ±3.2 ±3.5 ±2.7 ±4.0 ±1.8 ±2.5
-2.0
+2.0
-2.0
+6 .
0
-2.0
+2.0
-2.0
+4.5
-2.0
+2.0
-2.0
+3.0
-2.0
+2.0
-2.0
+3.0
-12 -15.6
+8.6+12.9-7.1
+5.6
-9.3+8.4
-6.2
+5.1
-8.6
+7.4
-5.6
+4.3
-6.7
+6 .
0
-7.4 -9.6
+6.5 +8.9
-4.1
+3 • 8
-5.3
+5.3
-3.6
+3.4
-5.0+5.0
-3.0+2.7
-3.7+3.9
-9.2 -9.5
+9.2+13.5
-6.2
+6.2
-6.5
+9.0
-5.7
+5.7
-7.0+8.0
-4.8
+4.8-5.5+6.5
-6.6 -6.9
+6.6 +8.7
-3.9
+ 3.9
-4.2
+5.8
-3.5
+3.5
-4.6
+5.1
-2.9
+2.9
-3.4
+4.0
34

Table 4. Summary and estimates of measurement uncertainties for determining
field strength inside NSWC reverberation chambers - Mode Stirred
(1.0 GHz - 18.0 GHz)
Error (dB)
Source of Error 1.0 GHz 2.0 GHz 4.0 GHz 8.0 GHz 12.0 GHz 18.0 GHz
Ave . Max. Ave. Max. Ave. Max. Ave. Max. Ave. Max. Ave. Max.
la. Received Power
Cable Loss ± 0.05 ± 0.10 ± 0.10 ± 0.15 ± 0.15 ± 0.20
Atten. Calibration ± 0.10 ± 0.10 ± 0.15 ± 0.15 ± 0.20 ±0.20Antenna Efficiency ± 0.05 ± 0.10 ± 0.15 ± 0.15 ± 0.20 ± 0.20
Spec. Analyzer Cal. ±1.00 ± 1 .00 ± 1 .50 ±1.50 ± 1 .50 ± 1 .50
Sub Total ± 1 .20 ±1.30 ±1.90 ± 1 .95 ±2.05 ± 2.10
Mismatch -1 .3 -2.4 -1 .2 -1 .7 -0.8 -1 .3 -1 .5 -1 .7 -0.5 -1.0
1b. E-Field Meas.
1 cm Dipole Probe ± 1 .0 ± 1 .0 ± 1 .5 ± 1 .5 ± 2.0 ± 2.0
2. SamplingEfficiency
Spatial Field Var.
Limited Sample Size± 2.5 ± 1.5 ± 1 .0 ± 0.5 ± 0.5 ± 0.5
(see [1 ]) ±0.1 ±0.2 ±0.1 ±0.3 ±0.2 ±0.5 ±0.3 ±0.7 ±0.3 ±1 .0 ±0.3 ±1 -5
Sub Total ±2.6 ±2.7 ±1.6 ±1.8 ±1 .2 ±1 .5 ±0.8 ±1 .5 ±0.8 ±1 .5 ±0.8 ±2.2
3. Wave Imped * 1
2
Ott Average C\1
+1VII 0, -2.0 ^ Maximum ^ +3. 0
4. Input Power Var. -1.3 -2.4 -1 .2 -1 .7 -0.8 -1 .3 -1 . 6 -0 .5 -1
.
0
E-
By
Field DeterminedReceiving Ant.
Total WorstCase Error
-8.4-
+5.8
•10.7
+6.9
-7.3+4.9
-8.5
+6 .
1
-6.7
+5.1
-8.0
+6.4
-7.9+4.8
-8.8
+6.5
-5.9+4.9
-6.6
+6 .
6
-6.9
+6.9
-8.3
+7.3
RSS Error -4.0
+3.5
-4.9+4.2
-3.3+2.9
-3.8+3.7
-3.2+2.9
-3.6+3.9
-3.6+2.9
-3.9+3.9
-3.1
+3.0-3.3+ 3.9
-3.3+3.0
-3.9+4.3
E-Field DeterminedBy Dipole Probe
Total WorstCase Error
-6.9
+5.6
-8.9
+6.7
-5.8+4.6
-6.5
+5.8
-5.5
+4.7
-6.3
+6.0
-5.9+4.3
-6.6
+6 .
0
-5.3 -6.0+4 .8 +6.5
-5.8 -7.2
+4.8 +7.2
RSS Error -3.7
+3.4
-4.3+4.2
-3.0+2.8
-3.3
+3 • 6
-2.9
+2.8
-3.2
+3.7
-3.1
+2 .
6
-3.3+3.7
-3.0 -3.2
+2.9 +3.9
-3.1 -3.7
+2.9 +4.2
35

Table 5. Estimates of impedance mismatch uncertainties for received powermeasurements for NSWC reverberation chambers
VSWRFrequency Source
GHz Ave Max
0.1 10.0 40.0
0.15 8.0 25.0
0.2 6.0 15.0
0.3 14.0 10.0
0.5 3.0 6.0
1 .0 2.5 4.0
1 .0 2.5 4.0
2.0 2.5 3.0
M.O 2.0 2.5
8.0 2.8 3.0
12.0 1.5 1.5
18.0 1.8 1.8
Mismatch ErrorLoadMax
(dB)
Ave Max
1.10 -5.15 -10.6
1.10 -4.36 -8.68
1.10 -3.40 -6.67
1.10 -2.19 -5.15
1.10 -1.46 -3.40
1.10 -1 .07 -2.19
1 .20 -1 .25 -2.44
1 .20 -1.25 -1.67
1 .20 -0.81 -1 .25
1.20 -1.51 -1 .67
1 .30 -0.48 -0.48
1 .50 -1 .03 -1.03
36
MBS- 11 4A .'REV. 2 -BC>
U.S. DEPT. OF COMM.
BIBLIOGRAPHIC DATASHEET (See instructions)
1. PUBLICATION ORREPORT NO.
NBSIR 86-3051
2. Performing Organ. Report No 3. Publication Date
June 1986
4 . TITLE AND SUBTITLE
Electromagnetic Radiation Test Facilities Evaluation of Reverberation Chambers
Located at NSWC, Dahlgren, Virginia
5. AUTHOR(S)Myron L. Crawford and Galen H. Koepke
6 . PERFORMING ORGANIZATION (If joint or other than NBS. see instructions)
national bureau of standardsDEPARTMENT OF COMMERCEWASHINGTON, D.C. 20234
7. Contract/Grant No.
8. Type of Report & Period Covered
9. SPONSORING ORGANIZATION NAME AND COMPLETE ADDRESS (Street. City. State, ZIP)
10. SUPPLEMENTARY NOTES
Document describes a computer program; SF-185, FIPS Software Summary, is attached.
This report describes measurement procedures and results obtained from evaluating thereverberation chamber facilities located at the Naval Surface Weapons Center (NSWC),Dahlgren, Virginia. The two chambers tested are referred to as 1) the half chamber,and 2) the full chamber. The facilities were developed by the NSWC for use inmeasuring and analyzing the electromagnetic susceptibil ity/ vulnerabil ity (EMS/V) ofweapon systems and the shielding effectiveness of enclosures and shielding materials.A brief description of each facility is given including the instrumentation used forperforming the evaluation and calibration of the facilities by the National Bureau ofStandards (NBS). Measurements described include: 1) evaluation of the chambers'transmitting and receiving antennas' voltage standing wave ratios; 2) measurement ofthe chambers' insertion loss or coupling efficiency versus frequency; 3) measurementof the chambers' tuner effectiveness; 4) determination of the E-field uniformity inthe chambers' test zones versus frequency; 5) determination of the absolute amplitudecalibration of the test E-fields in the chambers based upon the reference antennasreceived power measurements and calibrated dipole probe antenna measurements; and 6)comparison of reference equipment under test (EUT) responses to test fieldsestablished inside the NSWC reverberation chambers and the NBS reverberation chamber.These results can then be compared to anechoic chamber results. Conclusions givenindicate that the NSWC chambers can be used at frequencies down to approximately 150MHz. Estimates are given of the measurement uncertainties derived empirically fromthe test results.
12. KEY WORDS (Six to twelve entries; alphabetical order; capitalize only proper names; and separate key words by semicolonnelectromagnetic radiated susceptibility/vulnerability; reverberation chamber
13. AVAILABILITY
1 xl Uni imited
| |
For Official Distribution. Do Not Release to NTIS
5] Order From Superintendent of Documents, U.S. Government Printing Office, Washington, D.C.20402.
Q3 Order From National Technical Information Service (NTIS), Springfield, VA. 22161
14. NO. OFPRINTED PAGES
^4
15. Price


