electroencephalograph based brain computer interfacesamber.feld.cvut.cz/bio/konopka/file/11.pdf ·...
TRANSCRIPT

UNIVERSITY COLLEGE DUBLIN
Department of Electrical and Electronic Engineering
Electroencephalograph based Brain
Computer Interfaces
by
Raymond Carl Smith
A thesis presented to University College Dublin (NUI)
in fulfilment of the requirements for the degree of
Master of Engineering Science (MEngSc)
in the faculty of
Electrical and Electronic Engineering.
Dublin, Ireland.
©Ray C. Smith, Feb 2004
Research Supervisor: Dr. R. Reilly
Head of Department: Prof. T. Brazil
ii
Publications arising from this thesis
E. Lalor, S.P. Kelly, C. Finucane, R. Smith, R. Burke, R. B. Reilly, G. McDarby –
“Steady-state VEP-based Brain Computer Interface Control in an Immersive 3-D Gaming
Environment ", Journal of Applied Digital Signal Processing – Special issue on Brain Computer
Interfaces. See Appendix. (Submitted)
R. B. Reilly, R. Smith - Nonverbal Information Processing, Marcel Dekker Inc., 270 Madison
Avenue, New York, NY 10016. (Submitted)
Declaration
I hereby declare that I am the sole author of this thesis. I authorize University College Dublin to
lend this thesis to other institutions or individuals for the purpose of scholarly research. I further
authorize University College Dublin to reproduce this thesis by photocopying or by other means,
in total or in part, at the request of other institutions or individuals for the purpose of scholarly
research.
Signature: Date: 29/02/2004

iii
Acknowledgements
I would like to thank all those who supported me throughout this degree. First and foremost I
would like to thank Dr. Richard Reilly for all his time and valuable guidance. He was an
approachable supervisor who motivated me to achieve my goals. I would like to thank Lisa
Jamieson and Emma Roddy, the laboratory executive assistants, for their efforts.
I would like to thank Dr. John Foxe of the Nathan Kline Institute New York for his
hospitality and generosity whilst visiting. I would like to thank my colleagues of the DSP
laboratory, particularly Barry Greene and Philip de Chazal for proof reading this thesis. I would
like to offer a special thanks to Simon Kelly, Ed Lalor and Rob Burke who worked in the BCI
area.
I would like to thank the Embark Initiative of the Irish Research Council for Science,
Engineering and Technology (IRCSET) for the scholarship, without which, this work would not
have been possible.
Finally, a more general thanks to the teaching staff of the Electronic & Electrical
Engineering Department, family and friends for their support.

iv
Abstract
Brain computer interfaces (BCIs) have the potential to offer humans a new and innovative non-
muscular modality through which to communicate directly via their brain activity with their
environment. These systems rely on the acquisition and interpretation of the commands encoded in
neurophysiological signals without using the conventional muscular output pathways of the central
nervous system (CNS). Brain imaging technologies such as EEG, fMRI and MEG are used to
observe this neurophysiological activity. Electroencephalograph (EEG) is the only practical non-
invasive, cheap and real-time capable imaging technology for use in a BCI system. BCIs propose
to offer people who suffer from neuromuscular disorders, whom lack any voluntary motor
movement, with the only possibility of communication and control.
This thesis firstly addresses the issues for using EEG as a BCI input modality by
reviewing the methods for EEG acquisition and analysis. The components and methodologies for a
BCI system framework and the current state of the art of this technology are then presented. Two
studies that investigate different BCI system implementations and applications are presented and
discussed.
The first study presents a left-right self paced typing exercise that was employed to
highlight that the brain generates a movement-related potential (MRP) that can be used to
distinguish upcoming left or right finger movement. The study proves that we can predict the
laterality of upcoming left or right finger movements with an offline accuracy of approximately
60%. The second study involves an implementation of a real-time video game controlled by the
user’s selective attention of different visual stimuli. Steady-State Visual Evoked Potentials
(SSVEPs) generated at the occipital cortex are used as the input signals. The game requires the
user to maintain the balance of a tight-rope walker. The implemented online system achieved
approximately 89% accuracy with 41 of the 48 games successfully completed.
This thesis has described and demonstrated by implementation the components and
framework of a BCI system to facilitate the use of brain signals to control a computer system. It
concludes by discussing the future potential of BCI technology and the work needed to improve
information transfer rates and usability for the development of marketable applications not only for
the disabled but a potential wider audience.

v
Table of Contents
Acknowledgements............................................................................................................ iii
Abstract .............................................................................................................................. iv
Table of Contents ................................................................................................................v
List of Figures .................................................................................................................. viii
List of Tables...................................................................................................................... xi
Chapter 1 Introduction ...................................................................................................1
1.1. Background........................................................................................................................ 1 1.2. Aim and Objectives ........................................................................................................... 3 1.3. Thesis Outline.................................................................................................................... 3
Chapter 2 Electroencephalography (EEG) ...................................................................5
2.1. Introduction ....................................................................................................................... 5 2.1.1. History ....................................................................................................................... 6 2.1.2. Brain imaging ............................................................................................................ 6
2.2. The human brains’ neurophysiology ................................................................................. 9 2.2.1. The neuron................................................................................................................. 9 2.2.2. The brain and its functions ...................................................................................... 12
2.3. Acquisition Methods........................................................................................................ 13 2.3.1. Equipment................................................................................................................ 14 2.3.2. Electrodes & electrode placement ........................................................................... 15 2.3.3. Referencing and bipolar recordings......................................................................... 18 2.3.4. Artifacts ................................................................................................................... 19
2.4. EEG signal properties...................................................................................................... 22 2.4.1. Rhythmic brain activity ........................................................................................... 25 2.4.2. Event-related potentials (ERPs)............................................................................... 26 2.4.3. Event-related (de/)synchronization (ERD/ERS)...................................................... 28
2.5. Applications..................................................................................................................... 28 2.5.1. Biofeedback ............................................................................................................. 29
2.6. Summary.......................................................................................................................... 30
Chapter 3 Brain Computer Interfaces (BCIs) ............................................................32
3.1. Introduction ..................................................................................................................... 32

vi
3.2. Two fundamental approaches to BCI design................................................................... 35 3.2.1. Pattern Recognition (PR) approach ......................................................................... 36 3.2.2. Operant Conditioning (OC) approach ..................................................................... 37
3.3. BCI control: synchronous Vs asynchronous.................................................................... 38 3.4. BCI framework ................................................................................................................ 39 3.5. BCI system methodologies.............................................................................................. 41
3.5.1. Experimental paradigm design ................................................................................ 41 3.5.2. Pre-processing ......................................................................................................... 42 3.5.3. Artifact removal....................................................................................................... 43 3.5.4. Channel selection and dimension reduction ............................................................ 46 3.5.5. Feature extraction .................................................................................................... 46 3.5.6. Feature selection ...................................................................................................... 48 3.5.7. Classification ........................................................................................................... 48 3.5.8. Feedback.................................................................................................................. 50
3.6. BCI systems: State of the art ........................................................................................... 52 3.6.1. Categorisation.......................................................................................................... 55 3.6.2. Principal BCI research groups ................................................................................. 58 3.6.3. Performance metrics ................................................................................................ 59
3.7. Summary.......................................................................................................................... 61
Chapter 4 Study 1: MRP based BCI system...............................................................62
4.1. Aim.................................................................................................................................. 63 4.2. Introduction ..................................................................................................................... 63
4.2.1. Elucidation of MRP on single-trial basis................................................................. 66 4.3. Overview of the system ................................................................................................... 67 4.4. Methodology.................................................................................................................... 67
4.4.1. Experimental protocol ............................................................................................. 68 4.4.2. Pre-processing ......................................................................................................... 69 4.4.3. Electrode selection................................................................................................... 69 4.4.4. Artifact rejection...................................................................................................... 71 4.4.5. Feature extraction .................................................................................................... 71 4.4.6. Classification ........................................................................................................... 78
4.5. Results ............................................................................................................................. 79 4.5.1. Parametric modeling................................................................................................ 79 4.5.2. Time-frequency feature extraction .......................................................................... 85 4.5.3. Competition Data..................................................................................................... 87
4.6. Discussion........................................................................................................................ 89 4.6.1. Performance analysis............................................................................................... 89 4.6.2. Future Work............................................................................................................. 91
4.7. Summary and Conclusion................................................................................................ 93

vii
Chapter 5 Study 2: SSVEP based real-time BCI gaming system .............................95
5.1. Aim.................................................................................................................................. 95 5.2. Introduction ..................................................................................................................... 97 5.3. Methodology.................................................................................................................... 99
5.3.1. Preliminary investigation......................................................................................... 99 5.3.2. Game experimental protocol ................................................................................. 103 5.3.3. Feature extraction .................................................................................................. 104 5.3.4. Classification ......................................................................................................... 107 5.3.5. Training ................................................................................................................. 108
5.4. Real-time game development ........................................................................................ 109 5.4.1. C# and the .NET framework.................................................................................. 110
5.5. Results and performance ............................................................................................... 111 5.6. Discussion...................................................................................................................... 113
5.6.1. Performance analysis............................................................................................. 114 5.6.2. Interesting findings ................................................................................................ 115 5.6.3. Future work ........................................................................................................... 117
5.7. Summary and Conclusion.............................................................................................. 119
Chapter 6 Conclusions ................................................................................................120
6.1. Study 1 – MRP based BCI system................................................................................. 120 6.2. Study 2 – SSVEP based BCI system............................................................................. 120 6.3. Future of BCI technology .............................................................................................. 121
Bibliography ....................................................................................................................126
Appendix A : List of BCI research groups worldwide .................................................... I
Appendix B : CD contents ............................................................................................... III
Appendix C : Collaborative approach to our work in UCD ........................................ IV
Appendix D : Additional plots in MRP study..................................................................V

viii
List of Figures
Figure 2-1: Scale of spatio-temporal resolution for various brain imaging technologies ..................................7 Figure 2-2: The structure of the Neuron ............................................................................................................10 Figure 2-3: A single cortical pyramidal cell showing the current flow that contributes to the surface EEG
during a net excitatory input. .....................................................................................................................10 Figure 2-4: The pyramidal cell neuron demonstrating its structure and interconnectivity with a neural
community ..................................................................................................................................................11 Figure 2-5: Structure of the cerebral cortex, which consists of six layers, shown using three different stains
under the microscope: (a) Golgi stain showing cell bodies and dendrites, (b) Nissi cellular stain and (c) myelin sheath stain showing axons. The six layers on the vertical axis are: I molecular layer, II external granular layer, III external pyramidal layer, IV internal granular layer, V large or giant pyramidal layer (ganglionic layer), VI fusiform layer .........................................................................................................11
Figure 2-6 : Orientation of brain with respect to the rest of body.....................................................................12 Figure 2-7: Anatomical areas of the brain .........................................................................................................12 Figure 2-8: Functional areas of the brain...........................................................................................................12 Figure 2-9: EEG acquisition system at the DSP laboratory in UCD. Equipment suppliers include Electrocap
International Inc , Grass Telefactor Inc and Cambridge Electronic Design (CED) ................................15 Figure 2-10: (a) ElectroCap System I© consisting of 21 electrodes according to 10-20 system, (b) 128
channel electrode cap based on a modified 10-20 system (right). ............................................................16 Figure 2-11: (a) Gold (Au) and Silver-Silver Chloride (Ag-AgCl) disc electrodes, (b) Electrode placement
over C3 and C4. The inter-electrode and skin-electrode impedance is checked. .....................................16 Figure 2-12: The International 10-20 electrode system: side and top views [15] ............................................16 Figure 2-13: Electrode positions and labels for various systems. Black circles indicate positions of the
original 10–20 system, grey circles indicate additional positions in the 10–10 extension and small dots indicate additional positions in the 10–5 extension [16] (from [16]). ......................................................16
Figure 2-14: Selection of 10–10 electrode positions in a realistic display. Lateral, frontal and posterior views. The head and brain contours based on typical models. Black circles indicate positions of the original 10–20 system, grey circles indicate additional positions in the 10–10 extension (from [16]). ................17
Figure 2-15: (a) Examples of alpha, beta, delta and theta EEG rhythms, (b) Change from alpha waves to asynchronous pattern when subject opens eyes.........................................................................................25
Figure 3-1: Processing Stages necessary for BCI implementation ...................................................................39 Figure 3-2: A functional model of a BCI system proposed by Mason & Birch [72] .......................................41 Figure 3-3: EEG single-trial recording from frontal electrode sites FP1, FP2 and F7 (left) and the
simultaneous vertical EOG recording from the left eye (right). The y-axis in the plots represents magnitude in microvolts (µV) and the x-axis represents sample number (fs=512.82 Hz). It is clearly noticeable that the VEOG activity due to an eye blink has significantly corrupted the EEG recordings.....................................................................................................................................................................44
Figure 3-4: An example of the PCA artifact removal algorithm. The original single-trial from the FT8 electrode position and the post-artifact removal single-trial are depicted. The large peak due to an eye-blink can be seen to be effectively removed without corrupting the underlying EEG.............................45
Figure 3-5: The feedback display used in the TTD. The user is presented with a smiley face as positive reinforcement after successfully moving the cursor to the target side of the screen. ...............................51
Figure 4-1: An example of an averaged MRP recorded for 918 left finger movement trials (onset at t=0) at C3 (channel 3, blue) and C4 (channel 4, green). The main components of a MRP as highlighted by [151,153,160] are indicated. The difference between C3 and C4 in the BP2 will be addressed later in the chapter.........................................................................................................................................................65
Figure 4-2: Overview of offline MRP based BCI system using self-paced voluntary finger movements ......67 Figure 4-3: Sitting position of subject with arms comfortably resting on a table. ...........................................68 Figure 4-4: Hands resting over the home keys. Subjects were asked to press one of the home keys at a time
on either side with their respective index fingers. .....................................................................................68 Figure 4-5: Measuring of the C3 and C4 electrode positions according to the 10-20 standard. ......................68 Figure 4-6: Vertical EOG (vEOG) recording performed on the left eye to aid in artifact identification and
rejection. .....................................................................................................................................................71

ix
Figure 4-7: Ensemble averaged trials for Left and Right finger presses for electrode positions C3 and C4. The underlying ERP, the Bereitschaftspotential, is seen as expected with the more negative potential on the contralateral side. The BP1 and BP2 components of the BP are also noticeable. ..............................72
Figure 4-8: Grand ensemble average of STFT Time-Frequency PSD plots for electrodes C3 (top) and C4 (bottom) during left and right finger movement (left and right side respectively). The time window is 500ms prior to press (x-axis) over an extended mu frequency band (9-13Hz). .......................................73
Figure 4-9: AR model.........................................................................................................................................74 Figure 4-10: ARX model structure ....................................................................................................................75 Figure 4-11: Plot of an AR model fit versus the number of parameter’s for the downsampled and filtered
version of the data (fs=100Hz, LPF fc=40Hz) (left) and the original high-resolution data (fs=1000Hz). Note the greater percentage of unexplained output variance for the filtered signal. ................................80
Figure 4-12: Plot of classification accuracy for each subject using the AR feature extraction method. Note that a random event is 50% ........................................................................................................................82
Figure 4-13: Representation of inputs and outputs of ARX modelling for a specific left trial ........................83 Figure 4-14: Plot of classification accuracy for each subject using the ARX feature extraction method. Note
that a random event is 50% ........................................................................................................................85 Figure 4-15: Grand ensemble averaged frequency spectrum power for left trials (left) and right trials (right)
for C3 (blue) and C4 (green) electrode positions filtered over the range 6-30Hz for the 500ms preceding movement onset..........................................................................................................................................86
Figure 4-16: Grand ensemble averaged ERP for left trials (left) and right trials (right) for C3 (blue) and C4 (green) electrode positions filtered over the range 2-25Hz for the 500ms preceding movement onset ..86
Figure 4-17: Grand ensemble averaged short time power spectral density (STPSD) plots for left and right trials (respectively located) for C3 (top) and C4 (bottom) electrode positions over the range 0-25Hz for the 500ms preceding movement onset. The time window for the STPSD was 125 ms with 25% overlap....................................................................................................................................................................86
Figure 4-18: Grand ensemble average of STFT Time-Frequency PSD plots for electrodes C3 (top) and C4 (bottom) during left and right finger movement (left and right side respectively). The time window is 500ms prior to press (x-axis) over an extended mu frequency band (9-13Hz). .......................................87
Figure 4-19: Plot of Performance Accuracy comparing the training and test results.......................................88 Figure 5-1: Mind Balance© game logo ..............................................................................................................96 Figure 5-2: Mawg©, the Scottish tightrope walking behemoth .........................................................................96 Figure 5-3: Ensemble averaged VEP response, from the electrode position Oz, to a checkerboard pattern
alternating at a rate of 2 Hz. The N1, P1 and N2 trough-peak-trough occurs at 75, 110 and 140 ms respectively.................................................................................................................................................97
Figure 5-4: Grand average PSD response for all subjects under the same conditions during visual focus to low freq stimulus F1=7 Hz (top) and high frequency stimulus F2=13Hz (bottom).................................98
Figure 5-5: Dimensions and visual angle of subject relative to CRT monitor during investigation stage ....101 Figure 5-6: Block diagram of SSVEP-based BCI system for Mind Balance© game control. Nicholas
Negroponte, founder of the Massachusetts Institute of Technology's famed Media Lab successfully plays the game at the open-day. ...............................................................................................................102
Figure 5-7: Open day test environment illustrating projection screen and a user wearing an electrode cap.103 Figure 5-8: Dimensions and visual angle of subject relative to projector screen for finished gaming
application ................................................................................................................................................103 Figure 5-9: Training process: The user must attend to the flashing disc highlighted by the arrows in order to
train the BCI to establish a classification threshold. The Mawg character remains inactive throughout...................................................................................................................................................................104
Figure 5-10: Mawg character loosing his balance to the right requiring the user to attend to the left flashing disc for him to restore his balance ...........................................................................................................104
Figure 5-11: Random single trial (1 second duration) for subject NF during visual focus to low freq stimulus F1=7 Hz (top) and high frequency stimulus F2=13Hz (bottom) ............................................................105
Figure 5-12: DSP signal processing performed on the continuous O1 and O2 EEG recordings to produce a combined power spectral estimate ...........................................................................................................106
Figure 5-13: Signal Acquisition and Processing GUI that controls calibration and gaming modes..............109 Figure 5-14: Distribution plots for various features with themselves (diagonal cells) in the form of 1-D
histograms and with other features (off diagonal cells) in the form of 2-D scatter plots .......................112

x
Figure 5-15: Plot of the Pt PSD Ratio for F1/F2 during attention to the low frequency stimulus (red) and high frequency stimulus (blue) in different runs. It can be seen that the former is predominantly greater than one while the latter is predominantly less than1 one...............................................................................113
Figure 5-16: Histogram of Pt PSD ratio feature of F1/F2 during visual attention to low frequency stimulus F1 (blue) and high frequency F2 (red).....................................................................................................114
Figure 5-17: The effects of windowing the segments of continuous EEG on the power spectral estimate. It can be seen that the attended SSVEP has a greater response for the raw unwindowed case .................117
Figure 5-18: Comparison of windowed (blue) and unwindowed (red) spectral estimate for a single frequency sinusoid. The time and frequency domain are represented in the left and right graphs respectively. The unwindowed has greater power at the given frequency than the windowed case. .................................118

xi
List of Tables
Table 2-1: Comparison of brain imaging technologies .......................................................................................8 Table 2-2: Cortical areas of the brain and their function..................................................................................13 Table 2-3: Necessary EEG acquisition equipment specifications.....................................................................14 Table 2-4 : Groups of physiological artifacts and their origins during EEG recordings..................................19 Table 2-5 : Common technical and physiological artifacts, their possible causes and solutions.....................20 Table 2-6: Common descriptors of EEG activity: explanation, examples and comments ...............................24 Table 2-7: Normal EEG rhythms characteristics...............................................................................................26 Table 3-1: A summary of implemented BCI systems by various researchers and grouped according to the
neuromechanism or characteristic EEG activity that was employed. .......................................................57 Table 3-2: A summary of the principal BCI research groups and their approach ............................................58 Table 4-1: Results of cross-correlative comparison for Left/Right press Vs electrode position. The closer the
value is to the one the more similar the ERP is for a left and right for the electrode position.................71 Table 4-2: AR feature extraction classification accuracy averaged across subject 1 versus model orders for
various parameter estimation methods. .....................................................................................................80 Table 4-3: AR feature extraction classification accuracy for subject 1 versus model orders for the Yule-
Walker AR parameter estimation method. The parameters were used as the features and classified using 20 shuffle by 10-fold cross validation. Note: 50% represents an equiprobable occurrence. ...................81
Table 4-4: Classification accuracy across 10 subjects using the AR feature extraction method with a chosen model order of na=7....................................................................................................................................81
Table 4-5: ARX model orders versus the classification accuracy for subject 1. The optimum accuracy occurs for model orders na=4 and nb=4 as highlighted. .......................................................................................84
Table 4-6: Classification accuracy across 10 subjects using the ARX feature extraction method with an optimally chosen model order of na=4 and nb=4......................................................................................84
Table 4-7: Classification accuracy across 10 subjects using a time-frequency (STFT) feature extraction method. The feature consisted of an STFT in the bands 8-13Hz and 18-25Hz in 400 ms windows with 25 % overlap...............................................................................................................................................87
Table 4-8: Training and test set accuracy for the competition data ..................................................................88 Table 4-9: Official BCI Competition results table for dataset 4 (Berlin dataset)
http://ida.first.fraunhofer.de/projects/bci/competition/results/index.html ................................................89 Table 5-1: Classification results for various features or their combinations during the investigation stage .111

Chapter 1
1
Chapter 1 Introduction
1.1. Background
Human-computer interaction has been a topical research concept since the birth of the computer
era. Methods of computer interaction have progressed rapidly over the years from cards with
punched holes to keyboards and mice. Today there exist a multitude of innovative technologies
that allow humans to interface with computers for the purposes of data entry, control or
communication. Most of the efforts over the years have been dedicated to the design of user-
friendly and ergonomic systems to produce a more efficient and comfortable means of
communication. Interfaces such as voice recognition, gesture recognition and other technologies
based on physical movement have received enormous research attention over the years and
successful examples of these technologies are being rolled out commercially as a consequence.
The past two decades have seen an explosion of scientific interest in a completely different
and novel approach of interacting with a computer. Inspired by the social recognition of people
who suffer from severe neuromuscular disabilities, an interdisciplinary field of research has been
created to offer direct human computer interaction via signals generated by the brain itself. Brain-
Computer Interface (BCI) technology, as it is known, is a revolutionary communication channel
that enables users to control computer applications through thoughts alone. The development of
the cognitive neuroscience field has been instigated by recent advances in brain imaging
technologies such as Electroencephalography (EEG), Magnetoencephalography (MEG) and
functional magnetic resonance imaging (fMRI). EEG is an imperfect and distorted indicator of
brain activity, yet the fact that it can be acquired cheaply, is non-invasive and demonstrates direct
functional correlations with high temporal resolution makes it the only practical direct brain-
computer communication channel. It is a new and challenging medium for us to exploit in a
similar manner to the other communication modalities such as voice or vision. The endless
potential of tapping into human brain signals may see the fantasies of science fiction writers
becoming reality in the future.
The growing field of BCI research is however in its infancy. First signs of BCI research
can be dated back to the early 1970s. The work of Dr. J. Vidal and his military research group at
UCLA is cited as the first successful BCI implementation endeavour [1]. The current goal of BCI
research is to develop replacement communication and control means for severely disabled people.

Chapter 1
2
For those who have lost all voluntary muscle control, referred to as locked-in syndrome1, BCI
technology offers the only means of communication or environment control. Locked-in syndrome
can be caused, for example, by amyotrophic lateral sclerosis (ALS)2, brainstem stroke,
mitochondrial disease, spinal-cord injury, traumatic-brain injury3 and even later-stage cerebral
palsy. Despite these sufferers being completely physically paralyzed and unable to speak, they are
however, cognitively intact and alert and thus have a need to communicate. It is estimated that in
the order of one million people worldwide suffer from locked-in syndrome. It is this motivation
that has inspired researchers to explore the possibility of harnessing the intact brain signals of
these people as a means of communication.
BCI design represents a new frontier in science and technology that requires
multidisciplinary skills from fields such as neuroscience, engineering, computer science,
psychology and clinical rehabilitation to achieve the goal of developing an alternative
communication medium. Despite the technological developments, there remain numerous
obstacles to building efficient BCIs. The biggest challenges are related to accuracy, speed and
usability. Due to these limitations, no BCI system has become commercially available as yet. If a
disabled person can move their eyes or even one muscle in a controlled way, the interfaces based
on eye-gaze or EMG switch technology are more efficient than any of the BCIs that exist today.
The maximum transfer rate of current BCI systems is in the order of 25 bits per min. The standard
dial-up modem can transfer information at a rate of 56 Kbits per second and even this is rapidly
being replaced by Megabit and even Gigabit technology. The question that remains to be answered
by the scientific community is: what is the future of BCI technology outside rehabilitative
communication and control applications for the severely disabled? Can the wider population
expect to play games, browse the internet and navigate other multimedia rich applications via
thought alone? The research carried out in this thesis explores the field of BCI design and
implementation in the hope of understanding the potential of this technology.
1 Locked-in Syndrome - Locked-in syndrome is a rare neurological disorder characterized by complete paralysis of voluntary muscles
in all parts of the body except for those that control eye movement. It may result from traumatic brain injury, diseases of the circulatory
system, diseases that destroy the myelin sheath surrounding nerve cells, or medication overdose. Individuals with locked-in syndrome
are conscious and can think and reason, but are unable to speak or move. The disorder leaves individuals completely mute and
paralyzed. There is no cure for locked-in syndrome, nor is there a standard course of treatment. (Courtesy of the American National
Institute of Neurological Disorders and Stroke - http://www.ninds.nih.gov/health_and_medical/disorders/lockedinsyndrome_doc.htm) 2 Amyotrophic lateral sclerosis (ALS) is a devastating neuromuscular disease that strikes adults in the prime of their life. ALS attacks
motor neurons which control the movement to voluntary muscles, and progresses rapidly, leading to complete paralysis followed by
death within a 3 to 5 year period. 5,000 cases are diagnosed annually in the United States (MDA). 3 Traumatic Brain Injury (TBI) is an injury to the brain caused by trauma, i.e. a blow to the head. Annually 80,000 to 90,000 TBI
suffers in the US experience the onset of long-term or lifelong disability associated with TBI. In Ireland it is estimated that over 13,000
people sustain TBI every year (Courtesy of Headway Ireland Information and Support Department).

Chapter 1
3
1.2. Aim and Objectives
The aim of this research was to gain an insight into the rapidly developing field of BCI research.
Focusing on the EEG as the BCI input modality, the goal was to develop a deep understanding of
the neurophysiological processes that could be exploited to implement a BCI system. After
performing a state-of-the-art review of BCI systems, it was envisaged to design and implement a
system. A sound knowledge of the data acquisition process, EEG waveform characteristics, signal
processing methodologies for feature extraction and classification is a prerequisite before
attempting to design and implement a BCI system. The projects objectives can be summarised as
follows:
To develop a neurophysiological understanding of the human brain.
To investigate electroencephalography as a means of identifying mental activity.
To provide a comprehensive review of EEG based BCI systems implemented to-date.
To develop experimental BCI systems.
To discuss the future of BCI technology
1.3. Thesis Outline
This thesis presents the fundamental knowledge behind developing an Electroencephalogram
based BCI, presents a state-of-the-art review of BCI research and then describes two systems
implemented by the author. The thesis concludes by looking to the future of BCI technology. The
author highlights the challenging areas that must be addressed to facilitate further progression of
this line of research.
Chapter 2 performs a thorough review of Electroencephalography (EEG), a brain imaging
technology based on the electrophysiological activity within the brain. The chapter describes in
detail the origin, functional behaviour, acquisition, characterization and applications of EEG
recorded signals. The purpose of this chapter is to familiarise the reader with terminology and EEG
characteristics that will be exploited and referred to in later chapters.
Chapter 3 begins by introducing the idea and purpose of a BCI. The essential components
of a BCI framework are described and some of the signal-processing methodologies behind them
are reviewed in detail. A large portion of this chapter is devoted to performing a state-of-the-art
review of BCI technology and describing the approaches of various different BCI research groups
around the globe. The chapter concludes by reviewing necessary standardised performance metrics
and discusses the challenges for future progression of this technology.

Chapter 1
4
Chapter 4 describes an offline BCI system based on activity in the brain related to limb
movement. It introduces the fundamental brain patterns and signal processing methodologies
exploited in this study to predict upcoming limb movement. A discussion analyses the results to
conclude the performance and potential of such a system.
Chapter 5 presents a real-time BCI controlled video game with immersive audio-visual
feedback. The chapter describes the brain activity associated with visual stimulation and the
methodologies that are exploited in this study to offer control. The real-time deployment of this
system and the associated performance results are reviewed. Finally, a discussion reviews the
success and future work of this type of BCI implementation.
Chapter 6 provides a conclusion on the issues addressed by this research and on the future
of BCI technology.

Chapter 2
5
Chapter 2 Electroencephalography (EEG)
This chapter serves as an introduction to the electro-biological brain imaging technique known as
Electroencephalography (EEG). It begins with a brief introduction to the origins of EEG and its
comparison to other brain imaging techniques. The neurophysiological and anatomical structure of
the human brain is then presented to introduce some terminology and to serve as background
information on its structure and function. This will particularly focus on the creation of the
electrochemical currents that are picked up by scalp electrodes and that form the EEG. The
subsequent section highlights the methods, potential complications and equipment necessary in
relation to EEG acquisition. Section 2.4 explains from a digital signal processing (DSP) point of
view, the characteristic signal properties of EEG activity. This will form an important basis for
later discussion when we hope to elicit pertinent features from continuous EEG that identifies with
a particular event or function for the purposes of developing a Brain Computer Interface. Finally,
the chapter catalogues the many clinical applications of EEG and concludes with an introduction to
EEG as a new alternative and augmentative communication medium.
2.1. Introduction
The great Greek philosophers such as Aristotle and Plato spawned an inquisitive era for
hypothesizing the anatomical and biological make-up of the human body. Herophilus (335-280
B.C.), often referred to as the ‘Father of Anatomy’, was the first man to begin meticulously
cataloguing his anatomical findings. Through mankind’s insatiable curiosity, this quest developed
into modern day medicine. Today every aspect of the human body from our very genetic make-up
to the historical progression of the human genome is explored.
Throughout these periods, the human brain was the great medical and philosophical
fascination of the human body. It began with human autopsies to explore the anatomical structure
and then developed to live in-situ brain experiments to explore its behaviour and functionality.
These were first performed on animals and then later on humans with severe cranial fractures or
terminal illnesses. Slowly, on a trial-by-trial basis, an understanding of the physiology of the
human brain was developed. It generated much interest for philosophers, psychologists and
surgeons alike. Mankind was no longer content to simply know the anatomical make-up of the
brain but we now wanted to know how this frail organ performed so many complex functions. This
multi-disciplinary collation gave birth to the field of Neuroscience. Its goal was to explore and

Chapter 2
6
understand the physiological and psychological behaviour of the brain, spinal cord and peripheral
nerves that make up this complex integrated information processing and control system.
2.1.1. History
The existence of electrical currents in the brain was discovered in 1875 by a Liverpool surgeon
named Richard Caton (1842-1926). He studied action potentials from the exposed brains of rabbits
and monkeys. Hans Berger (1873-1941), a German neuropsychiatrist working on cerebral
localization and intracranial blood circulation, followed on from Caton’s work. In 1924, he used
his ordinary radio equipment to amplify the brain’s electrical activity measured on the human
scalp. This was the first Electroencephalogram (EEG) recording of humans. He showed that weak
electric currents generated in the brain can be recorded without opening the skull, and depicted
graphically on a strip of paper [2].
“We see in the electroencephalogram a concomitant phenomenon of the continuous nerve
processes which take place in the brain”…Berger (1929).
The activity that he observed changed according to the functional status of the brain, such as
during sleep, anaesthesia, lack of oxygen and in certain neural diseases such as in epilepsy. He was
correct in his assertion that brain activity changes in a consistent and recognizable way when the
general status of the subject changes, as from relaxation to alertness [3]. Berger was the first to use
the word “electroencephalogram” to describe the brain electric potentials in humans. He laid the
foundations for many of the present applications for EEG (as covered later in section 2.5) and as a
result earned himself the title as the ‘father of EEG’. An interesting review of the historical
progression of EEG to its modern day applications is presented by Collura [4].
The modern day Electroencephalogram (EEG) is defined as the electrical activity of an
alternating type generated by brain structures and recorded from the scalp surface by metal
electrodes and conductive media [5]. Many variations of the scalp recorded EEG exist. EEG
measured directly from the cortical surface using subdural electrodes is called the
electrocorticogram (ECoG) while when using a depth probe is called electrogram. In this thesis,
we will refer only to EEG recorded from the surface of the scalp. In the following subsection,
Electroencephalography is compared with other brain imaging technologies, highlighting its
advantages for the purposes of BCI design.
2.1.2. Brain imaging
Modern medicine applies a variety of imaging techniques to analyse the functioning of the human
body. The group of electro-biological measurements consist of electrocardiography (ECG, heart),
electromyography (EMG, muscle contraction), electrogastrography (EGG, stomach),

Chapter 2
7
electrooculography (EOG, eye dipole field) and electroencephalography (EEG, brain). EEG
involves the recording of scalp electrical activity generated by brain structures. It is just one of the
many brain imaging technologies that have been developed in the pursuit of the ability to visualise
brain condition and understand brain function. Based on various physical properties, other brain
imaging technologies include x-ray Computed (Axial) Tomography (CT), Positron Emission
Tomography (PET) [6], Single-Photon Emission Computed Tomography (SPECT) [6], rapid-rate
Transcranial Magnetic Stimulation (rTMS), Event-Related Optical Signal (EROS),
Magnetoencephalography (MEG) [7] and (functional) Magnetic Resonance Imaging (f/MRI) [8].
Table 2-1 provides a summary of each brain imaging technique, its physical measurement
property, highlights its applications and presents its relative advantages and disadvantages. See [5]
for a review of Electroencephalography as a brain imaging modality.
Brain scans are subject to a phenomenon analogous to physics’ Heisenberg uncertainty
principle: they could detect either the localization or the timing of neural activation, but not both.
Figure 2-1 depicts the relative spatio-temporal resolutions for some brain imaging technologies
and the progression towards a method with both good temporal and spatial resolution (bottom left
of Figure 2-1). Perhaps in the future, the multimodal fusion of multiple technologies such as EEG
and fMRI may facilitate further improvements.
Figure 2-1: Scale of spatio-temporal resolution for various brain imaging technologies

Chapter 2
8
Table 2-1: Comparison of brain imaging technologies
Brain Imaging
Tech.
Physical Measurement Property Advantages Disadvantages
EEG Macroscopic brain electrophysiology.
Inexpense & ease of acquisition High temporal resolution Non-invasive
Poor spatial resolution Trial-to-trial variability of ERPs Volumetric smearing effects of skull
ECoG Electrophysiology of extra-cellular currents.
High temporal resolution Good spatial resolution Equipment inexpensive
Highly invasive Requires surgery, craniotomy required Procedurally expensive
MEG Cortical magnetic fields associated with the electrical activity.
Completely non-invasive Spatial resolution up to 3mm Good temporal resolution
Extremely expensive equipment Difficult to acquire, requires magnetic isolation room Not practical for real-time analysis
CT X-Ray brightness intensity maps in
relation to brain tissue density. Superseded by MRI technology
Excellent spatial resolution
Only anatomical information, none on cognitive function Extremely expensive X-Ray radiation hazard
SPECT Tracking of radioactive tracers in
blood stream. The measurement of blood flow, oxygen and glucose
reflects the amount of brain activity.
Do not require on-site cyclotron to produce SPECT tracers, unlike PET Less technical and medical staff required than PET
Measures blood flow instead of electrophysiology Poor time and spatial resolution Ionizing radiation hazard Procedurally expensive More limited than PET tracers
PET
Tracking of gamma radiation from decaying radioactive tracers in blood
stream. Measures the regional cerebral metabolism and blood flow
that reflect the amount of brain activity.
More versatile than SPECT More spatial resolution than SPECT, particularly for deeper brain structures. Able to identify which brain receptors are being activated by neurotransmitters, abused drugs and potential treatment compounds
Measures metabolism of oxygen and sugar rather than electrophysiology Ionizing radiation hazard Poor time resolution (~2 mins) Measurements cannot be repeated, annual maximum dosage is one examination Equipment extremely expensive. (cyclotron required) Highly qualified staff required
MRI
Radio waves pass through a large magnetic field (~1.5T). A computer monitors the variations in the radio waves due to the electro-magnetic activity in the brain to generate a
picture.
High anatomical detail (spatial resolution) Non-invasive
Only anatomical information, none on cognitive functionality Poor temporal resolution Expensive equipment and procedure
fMRI
Magnetic fields and radio waves exploit the magnetic properties of blood to track its flow. It involves monitoring the Blood Oxygenation
Level Dependence (BOLD) in response to a function or stimulus.
Good spatial resolution Non-invasive
Depends on haemodynamic response of blood which introduces an inherent lag Trades off some spatial resolution from MRI to improve temporal resolution. Expensive equipment and procedure Temporal resolution (~1s) not as good as EEG
(r)TMS Induced electrical activity of
neuronal regions by pulsed magnetic fields to stimulate a brain region
Diagnostic aid to check that the nerve pathways are intact Able to influence many brain functions, including movement, visual perception, memory, reaction time, speech and mood
Stimulator of brain function rather than an imaging technique Unknown health risks
EROS Changes occur in optical parameters
(scattering and absorption) of cortical tissue when active
Good temporal resolution Non-invasive Good spatial resolution Non-ionizing radiation Relatively low cost
Penetration only several centimetres Studying the cortical activity rather than the sub-cortical Infancy of its development

Chapter 2
9
Despite the EEG’s poor spatial resolution, it has excellent temporal resolution of less than
a millisecond. It is also relatively inexpensive and simple to acquire making it the only practical
non-invasive brain imaging modality for repeated real-time brain behavioural analysis. For this
reason, the remainder of this thesis will focus on EEG as the input brain imaging modality for BCI
design.
In the advent of the miraculous invention of the MRI machine, neuroscience has become a
hugely popular research area spanning disciplines such as neurophysiology, psychology,
engineering, mathematics and clinical rehabilitation. It has inspired many researchers to explore
every aspect of clinical and cognitive brain imaging. fMRI, has enabled researchers to locate with
high precision the regions within the brain associated with a function, e.g. the response to a
stimulus. Similarly, it has inspired the use of EEG in parallel to observe with high precision the
dynamics of such brain activity. The section that follows highlights the physical make-up of the
brain, focusing on its electro-biological behaviour which explains how EEG allows an insight into
brain activity.
2.2. The human brains’ neurophysiology
This section explains the anatomical and physiological structure of the brain. It focuses on how,
why and where the brain generates electrical activity that can be recorded on the scalp. In order to
understand the creation of local current flows within the brain, one must first look at the
fundamental brain cell, the neuron. For a greater insight into the physiology that leads to an
understanding of the human brain, the avid reader is referred to the book by Carlson [9].
2.2.1. The neuron
Any biometric potentials observed on the skin are due to the flow of ion-based electrical currents
within the body. In the case of EEG, the potentials are due to the summation of the electrical
potentials of many brain nerve cells, called neurons. The human brain at birth consists of
approximately 100-billion (1011) neurons at an average density of 104 neurons per cubic mm [10].
The number of neurons decreases with age. Neurons share the same characteristics and have the
same parts as other cells, but the electrochemical aspect lets them transmit electrical signals and
pass messages to each other over long distances. Neurons have three basic parts (Figure 2-2):
• Cell body - This main part has all of the necessary components of the cell, such as the nucleus
(contains DNA), endoplasmic reticulum and ribosomes (for building proteins) and mitochondria (for
supplying energy). If the cell body dies, the neuron dies.

Chapter 2
10
• Axon - This long, cable-like projection of the cell carries the electrochemical message (action
potential - AP) along the length of the cell.
• Dendrites - These small, branch-like projections of the cell make connections to other cells and
allow communication with other neurons. Dendrites can be located on one or both ends of the cell.
There exist different types of neurons that can have varying structures depending on their
functionality. Sensory, motor and cortical pyramidal cell neurons are examples of such different
types. The pyramidal neuron cell is the most prevalent neuron cell in the cerebral cortex,
particularly in the cortical peaks and valleys (gyri and sulci respectively) that are parallel to the
scalp. It is the key neuron structure responsible for most electrical activity recordable by EEG. It
has a long straight dendrite that extends up perpendicularly towards the surface of the brain. Hence
most neurons in the cerebral cortex have parallel dendrites, which cause a summation of potentials
in one direction. Furthermore many neighbouring neurons will have the same presynaptic sources
causing a synchrony of potentials that can be readily picked up on the scalp.
The inter-neuron communication system as shown in Figure 2-4 and resulting brain
electrical activity consists mostly of Na+, K+, Ca++ and Cl- ions that are pumped through channels
in neuron membranes in the direction governed by the membrane potential [11]. When neurons are
activated by means of an electrochemical concentration gradient, local current flows are produced.
The electrical activity of neurons can be divided into two subsets: action potentials (AP) and
postsynaptic potentials (PSP). If the PSP reaches the threshold conduction level for the
postsynaptic neuron, the neuron fires and an AP is initiated.
The electrical potentials recordable on the scalp surface are generated by low frequency
summed inhibitory and excitatory PSPs from pyramidal neuron cells that create electrical dipoles
between the soma and apical dendrites (see Figure 2-3). These PSPs summate in the cortex and
Figure 2-2: The structure of the Neuron Figure 2-3: A single cortical pyramidal cell showing the current flow that contributes to the surface EEG during a net excitatory input.

Chapter 2
11
extend to the scalp surface where they are recorded as the EEG. Nerve cell APs have a much
smaller potential field distribution and are much shorter in duration than PSPs. APs therefore do
not contribute significantly to either scalp or clinical intracranial EEG recordings. Only large
populations of active neurons can generate electrical activity recordable on the scalp.
Allison [12] lists four prerequisites, which must be met for the activity of any network of
neurons to be visible in an EEG recording:
a) The neurons must generate most of their electrical signals along a specific axis oriented perpendicular to the scalp
Figure 2-4: The pyramidal cell neuron demonstrating its structure and interconnectivity with a neural community
Figure 2-5: Structure of the cerebral cortex, which consists of six layers, shown using three different stains under the microscope: (a) Golgi stain showing cell bodies and dendrites, (b) Nissi cellular stain and (c) myelin sheath stain showing axons. The six layers on the vertical axis are: I molecular layer, II external granular layer, III external pyramidal layer, IV internal granular layer, V large or giant pyramidal layer (ganglionic layer), VI fusiform layer
(a) (b) (c)

Chapter 2
12
b) The neuronal dendrites must be aligned in parallel so that their field potentials summate to create a signal which is detectable at a distance
c) The neurons should fire in near synchrony d) The electrical activity produced by each neuron needs to have the same electrical sign
Thus a majority of neuronal communication remains invisible to EEG.
2.2.2. The brain and its functions
The average adult human brain weighs around 1.4 kg. The terminology for its orientation with
respect to the body is shown in Figure 2-6. The brain is surrounded by cerebrospinal fluid that
suspends it within the skull and protects it by acting as a motion dampener. In relation to the stages
of brain development, Carlson [13] categorises its components into three groups; the Forebrain,
Midbrain and Hindbrain. Anatomically the brain can be divided into the three largest structures:
brain stem (hindbrain), cerebrum and cerebellum (forebrain). This is illustrated in Figure 2-7. The
functions of these structures are summarised as follows:
• The brainstem controls the reflexes and autonomic nerve functions (respiration, heart rate, blood
pressure).
• The cerebrum consists of the cortex, large fiber tracts (corpus callosum) and some deeper
structures (basal ganglia, amygdala, hippocampus). It integrates information from all of the sense organs,
initiates motor functions, controls emotions and holds memory and higher thought processes.
• The cerebellum integrates information from the vestibular system that indicates position and
movement and uses this information to coordinate limb movements and maintain balance.
• The hypothalamus and pituitary gland control visceral functions, body temperature and
behavioural responses such as feeding, drinking, sexual response, aggression and pleasure.
• The thalamus or specifically the thalamic sensory nuclei input is crucial to the generation and
modulation of rhythmic cortical activity.
Figure 2-6 : Orientation of brain with respect to the rest of body Figure 2-7: Anatomical areas of the brain Figure 2-8: Functional areas of the brain

Chapter 2
13
The cerebrum can be spatially sub-divided. Firstly into two hemispheres, left and right,
connected to each other via the corpus callosum. The right one senses information from the left
side of the body and controls movement on the left side. Similarly the left hemisphere is connected
to the right side of the body. Each hemisphere can be divided into four lobes. They are the frontal,
parietal, occipital and temporal lobes. The cerebral cortex is the most relevant structure in relation
to EEG measurement. It is responsible for higher order cognitive tasks such as problem solving,
language comprehension and processing of complex visual information. Due to its surface
position, the electrical activity of the cerebral cortex has the greatest influence on EEG recordings.
The functional activity of the brain is highly localized. This facilitates the cerebral cortex to be
divided into several areas responsible for different brain functions. The areas are depicted in
Figure 2-8 and the related functions are described in Table 2-2.
Table 2-2: Cortical areas of the brain and their function
Cortical Area Function
Auditory association area Complex processing of auditory information Auditory cortex Detection of sound quality (loudness, tone) Broca’s area (speech centre) Speech production and articulation Prefrontal cortex Problem solving, emotion, complex thought Premotor cortex Coordination of complex movement Primary Motor cortex Initiation of voluntary movement Primary somatosensory cortex Receives tactile information from the body Sensory association area Processing of multisensory information Gustatory area Processing of taste information Wernicke’s area Language comprehension Primary Visual Cortex Complex processing of visual information
Since the architecture of the brain is non-uniform and the cortex is functionally organised,
the EEG can vary depending on the location of the recording electrodes. With this brief
introduction into the physiological creation of EEG, we can now move on to look at how to
acquire, process and interpret the EEG signals recorded from the various locations on the scalp.
2.3. Acquisition Methods
In the scalp recorded EEG the neuronal electrical activity is recorded non-invasively, typically
using small metal plate electrodes. Recordings can be made using either reference electrode(s) or
bipolar linkages. While the number of the electrodes used varies from study to study, they are
typically placed at specific scalp locations. The voltages, of the order of microvolts (µV), must be
carefully recorded to avoid interference and digitized so that it can be stored and viewed on a
computer.

Chapter 2
14
The amplitude of the recorded potentials depends on the intensity of the electrical source,
on its distance from the recording electrodes, its spacial orientation, and on the electrical properties
of the structures between the source and the recording electrode. The greatest contributions to the
scalp recorded signals result from potential changes which (a) occur near the recording electrodes,
(b) are generated by cortical dipole layers that are orientated towards the recording electrode at a
90 angle to the scalp surface, (c) are generated in a large area of tissue, and (d) rise and fall at rapid
speed [14].
This section will briefly highlight the equipment, methods and standards involved in
acquiring a scalp recorded EEG. It serves as a review of the key issues related to acquisition
however for a more detailed review of the principles of digital and analog EEG processing see
[3,5,14].
2.3.1. Equipment
The basic EEG recording system consists of electrodes with conductive media, amplifiers with
filters, an analog-to-digital (A/D) converter and finally a recording device to store the data.
Electrodes, in conjunction with the electrode gel, sense the signal from the scalp surface;
amplifiers bring the microvolt and often nanovolt signals into a range where they can be digitized
accurately; and the A/D converter changes signals from analog to digital form that can be finally
stored or viewed on a computer. Table 2-3 provides a summary of the necessary EEG acquisition
equipment and the typical specifications or products. The equipment used in the DSP laboratory in
UCD is shown in Figure 2-9.
Table 2-3: Necessary EEG acquisition equipment specifications.
EEG acquisition component Typical Specifications or Products
Electrodes Electrode cap with conductive jelly
Ag-AgCl or Au disc electrodes with conductive paste
Amplifiers (with filters) Amp Gain between 100-100K
Input Impedance >100MΩ
Common-mode rejection ratio >100dB
High pass filter with cut-off in range 0.1 -0.7Hz
Low pass filter with cut-off below half the sampling rate
Notch filter at mains frequency. (50 / 60 Hz)
Analog-to-Digital Converter At least a 12 bit A/D converter with accuracy lower than overall noise (0.3-2µV
pp.) and sampling frequency typically between 128-1024 Hz per channel.
Storage / Visualization unit Sufficiently fast PC for presentation, processing and storage

Chapter 2
15
2.3.2. Electrodes & electrode placement
An electrode is a small conductive plate that picks up the electrical activity of the medium that it is
in contact with. In the case of EEG, electrodes provide the interface between the skin and the
recording apparatus by transforming the ionic current on the skin to the electrical current in the
electrode. Conductive electrolyte media ensures a good electrical contact by lowering the contact
impedance at the electrode-skin interface.
Spike 2 data acquisition software
External Trigger
ElectroCap System
Ag/AgCl Electrodes
or
A / D
Grass Telefactor P511 Biopotential Rack Amplifiers
PC
Micro 1401 Data acquisition unit
Figure 2-9: EEG acquisition system at the DSP laboratory in UCD. Equipment suppliers include Electrocap International Inc 4, Grass Telefactor Inc 5 and Cambridge Electronic Design (CED) 6
The following types of electrodes are available:
• Disposable (gel-free, and pre-gelled types)
• Reusable cup electrodes (gold, silver, stainless steel or tin)
• Electrode caps
• Needle electrodes
• Nasopharyngeal and Sphenoidal electrodes
4 ElectroCap Inc.: http://www.electro-cap.com 5 Grass Telefactor Inc. : http://www.grass-telefactor 6 Cambridge Electronic Design (CED): http://www.ced.co.uk/indexu.shtml

Chapter 2
16
For large multi-channel montages comprising of up to 256 or 512 active electrodes,
electrode caps such as those shown in Figure 2-10 are preferred to facilitate quicker set-up of high-
density recordings. Commonly, Ag-AgCl cup or disc electrodes of approximately 1cm diameter
are used for low density or variable placement recordings as shown in Figure 2-11. For optimum
performance, the space between the electrode disc and the skin is filled with conductive paste
which also helps them to bond to the scalp.
To improve the stability of the signal, the outer layer of the skin (stratum corneum) should
be removed under the electrodes by light abrasion. In the case of the electrode caps, the blunt
syringe for conductive gel insertion is also used for skin scraping. The cleaning of the skin surface
(a) (b)
(a) (b)
Figure 2-10: (a) ElectroCap System I© consisting of 21 electrodes according to 10-20 system, (b) 128 channel electrode cap based on a modified 10-20 system (right).
Figure 2-11: (a) Gold (Au) and Silver-Silver Chloride (Ag-AgCl) disc electrodes, (b) Electrode placement over C3 and C4. The inter-electrode and skin-electrode impedance is checked.
Figure 2-12: The International 10-20 electrode system: side and top views [15]
Figure 2-13: Electrode positions and labels for various systems. Black circles indicate positions of the original 10–20 system, grey circles indicate additional positions in the 10–10 extension and small dots indicate additional positions in the 10–5 extension [16] (from [16]).

Chapter 2
17
from sweat, oil, hair products and dried skin is also highly recommended. Sterile alcoholic medical
wipes are useful here to prepare the skin and maintain hygiene.
In order to standardize the methodology of applying the electrodes on the skull, in 1949
the International Federation of Societies for Electroencephalography and Clinical
Neurophysiology (IFSECN) adopted a system proposed by Jasper [15] which has now been
adopted worldwide and is referred to as the 10-20 electrode placement International standard. This
system, consisting of 21 electrodes, standardized physical placement and nomenclature of
electrodes on the scalp. This allowed researchers to compare their findings in a more consistent
manner. In the system, the head is divided into proportional distances from prominent skull
landmarks (nasion, inion, mastoid and preauricular points see Figure 2-12). The ‘10-20’ label in
the system title designates the proportional distances in percents between the nasion and inion in
the anterior-posterior plane and between the mastoids in the dorsal-ventral plane (see Figure 2-12).
Electrode placements are labelled according to adjacent brain regions: F (frontal), C (central), P
(parietal), T (temporal), O (occipital). The letters are accompanied by odd numbers for electrodes
on the ventral (left) side and even numbers for those on the dorsal (right) side. The letter ‘z’
instead of a number denotes the midline electrodes. Left and right side is considered by convention
from the point of view of the subject. Based on the principles of the 10–20 system, a 10–10 system
and a 10-5 system have been introduced as extensions to further promote standardization in high-
resolution EEG studies (see Figure 2-13 and Figure 2-14).
The high density EEG electrode placement can help pinpoint more accurately the brain
region contributing to the recording at a given electrode. This is known as source localization.
There exist signal-processing methods to generate inverse solution models to estimate the origins
Figure 2-14: Selection of 10–10 electrode positions in a realistic display. Lateral, frontal and posterior views. The head and brain contours based on typical models. Black circles indicate positions of the original 10–20 system, grey circles indicate additional positions in the 10–10 extension (from [16]).

Chapter 2
18
of the main components of the EEG recordings. However the scalp electrodes may not reflect the
activity of particular areas of the cortex, as the exact location of the active sources is still unknown
due to the limitations caused by the non-homogenous properties of the skull, different orientation
of the cortex sources and coherences between the sources etc. [10].
2.3.3. Referencing and bipolar recordings
Scalp recordings of neuronal activity in the brain, identified as the EEG, allow measurement of
potential changes over time in a basic electric circuit conducting between signal (active) electrode
and reference electrode [17]. For getting a differential voltage, an extra third electrode called the
ground electrode, is needed by the amplifiers to subtract the active and reference channels from it.
The placement of the ground electrode plays no significant role in the measurement. Typically the
forehead (FPz), ear lobe, wrist or leg is the preferred ground location.
The EEG recordings can be divided into two major categories: reference recordings and
scalp-to-scalp bipolar linkages. In the reference recording each electrode is referred to either a
distant reference electrode, one common electrode on each side of the head or to the combined
activity of two or more electrodes. The reference electrode(s) must be placed on the parts of the
body where the electrical potential remains fairly constant. Several different recording reference
electrode placements are mentioned in the literature [3,5,14,18-20]. These include references such
as the vertex (Cz), linked-ears, linked-mastoids (bones behind the ear), ipsi-lateral-ear, contra-
lateral-ear, FPz, AFz and the tip of the nose. In addition to one single reference electrode, two
reference electrodes shorted together can be used. The choice of reference may produce
topographic distortion if relatively electrically inactive locations such as the ear and mastoid are
not chosen. Linking reference electrodes from both earlobes or mastoids reduces the likelihood of
artificially biasing activity in one hemisphere [20].
The most preferred reference is linked ears due to the relative electrical inactivity, ease of
use and symmetry which prevents a hemispheric bias being introduced. The vertex (Cz) is also
predominant due to its central location. Reference-free methods are represented by common
average reference, weighted average reference, and source derivation. These methods use the
average or weighted average of the activity at all electrodes as the reference. This can be carried
out by means of a resistor network or digitally as part of post-processing method. These do not
suffer the same artifact problems associated with an actual physical reference.
Bipolar recordings are differential measurements that are made between successive pairs
of electrodes. In the literature, C3-C3’, refers to a bipolar link from one channel at C3 and the
other in close proximity (typically around 2-3 cm from electrode in direction away from Cz).
Closely linked bipolar recordings are affected less by some artifacts, particularly ECG, due to the

Chapter 2
19
differential cancelling out of signals similarly picked up at the pair of electrodes. Bipolar
referencing is not commonly used due to placement issues and a lack of spatial resolution.
2.3.4. Artifacts
Artifacts are undesirable potentials of non-cerebral origin that contaminate the EEG signals. As
they can potentially masquerade and be misinterpreted as originating from the brain, there is a
need to avoid, minimise or ideally remove them from the EEG recording to facilitate accurate
interpretation.
Table 2-4 : Groups of physiological artifacts and their origins during EEG recordings
Physiological artifact type Possible sources
Movements: Movements of the head, body or scalp
Bioelectrical potentials: Moving electrical potentials within the body such as those produced by eye, tongue and pharyngeal muscle movement. Also those generated by the scalp muscles, heart (ECG) or sweat glands
Skin resistance fluctuations: Sweat gland activity, perspiration and vasomotor activity
Typical EEG artifacts originate from two sources, technical and physiological. Technical
artifacts are mainly due to line interference, equipment malfunction or result from poor electrode
contact. Incorrect gain, offset or filter settings for the amplifier will cause clipping, saturation or
distortion of the recorded signals. Technical artifacts can be avoided through proper apparatus set-
up, meticulous inspection of equipment and consistent monitoring. Physiological artifacts arise
from a variety of body activities that are either due to movements, other bioelectrical potentials or
skin resistance fluctuations as summarised in Table 2-4.
The predominant physiological artifacts include electrooculargraphic activity (EOG, eye),
scalp recorded electromyographic activity (EMG, muscle), electrocardiographic activity (ECG,
heart), ballistocardiographic activity (heart-related pulsatile motion) and respiration. These
artifacts are always present to some extent and are typically much more prominent on the scalp
than the macroscopic cerebral potentials. This results in an undesirable negative signal-to-noise
ratio in the EEG. Physiological artifacts are often involuntary and hence cannot be controlled or
‘turned off’ during acquisition. They pose a much greater challenge than technical artifacts to
avoid or remove them. Traditionally non-cerebral recordings such as EOG, ECG or EMG are also
performed to aid in the discrimination and potentially the removal of the relevant artifacts from the
EEG signals, as will be discussed more fully later. Table 2-5 presents a summary of the most
common technical and physiological artifacts, their probable causes and potential steps to avoid /
remove them.
Vertical eye movements such as eye closure or blinking, which are recorded as vertical
electrooculographic (vEOG) spikes, spread to a certain degree to all scalp locations, particularly

Chapter 2
20
the frontal sites. Although subjects are typically asked not to move or blink during acquisition,
blinking is for most an involuntary response to dry eyes or prolonged visual focus.
Table 2-5 : Common technical and physiological artifacts, their possible causes and solutions
Eye movement artifacts in EEG can be identified by their frontal distribution, their
symmetry and their characteristic shape. The amplitude of vertical eye movement decreases in
successive channels from anterior to posterior. In addition, typical eye blinks are 100ms in
duration. Therefore repetitive eye movements may mimic cerebral rhythms at around 10Hz (alpha
band) which is an important rhythm in most EEG studies as will be discussed in section 2.4.1. In
the hope that we can eliminate or at least minimise other artifacts, EOG activity is typically the
most dominant and corruptive artifact that must be eliminated by other means, namely signal
processing techniques.
There are three main approaches to combat the problem of artifacts in EEG recordings:
• Artifact minimisation or avoidance
• Artifact rejection
• Artifact removal
Although these approaches may appear similar, they have very different methodologies and
resulting EEG data.
Artifact minimisation is a prerequisite to most EEG recordings, whether or not artifact
rejection or artifact removal is performed in conjunction. It uses a thorough understanding of the
Origin Artifact examples Potential sources Possible solutions
Line Interference (50/60 Hz)
Power Supply Interference – The surrounding electrical equipment may induce a 50Hz (Europe) or 60Hz (USA) component in the signal especially in the case of high electrode impedance at contact.
Use shorter electrode wires. Reduce electrode impedance. Scalp-electrode impedance < 5KΩ. Electrode-electrode impedance ~ 1MΩ. Perform recordings within a shielded room. Use an analog or digital notch filter. Technical
Electrode impedance fluctuations
Loose or damaged wire contacts. Inconsistencies in electrode gel application (contaminants or dried pieces). Cable movements.
Check impedances with digital multi-meter and ensure good electrode contact.
Electrooculographic (EOG), eye activity
Eye movements. Blinking. Saccadic activity related to focus variation.
Instruct subject to minimise eye movement. Do not stare, as this will force eye-blinking. Allow brief intervals between stimuli for subject to blink.
Electromyographic (EMG), muscle activity
Muscle movement or tension particularly masticatory (jaw & tongue), neck & forehead causes EMG artifacts.
Ensure no movement particularly the neck, mouth, tongue or face.
Electrocardiographic (ECG), heart activity
Heart beating. Ballistocardiographic ( pulsatile motion of heart). Respiration. Pacer.
Close bipolar referencing. Reference electrode having similar ECG activity.
Physiological
Skin conduction variation
Sweating offers an epidermal layer of lower impedance for current conduction. It produces a slow baseline drift in EEG recording.
Cool environment.

Chapter 2
21
artifacts’ origins to first identify them and then reduce or eliminate its impact on the EEG by some
appropriate steps. This is predominantly effective for technical artifacts but can also be applied to
physiological artifacts. For example, potential changes generated by the heart are picked up mainly
in EEG recordings with wide inter-electrode distances, especially in inter-hemispheric linkages
across the head or referencing to the left ear and particularly in subjects who are overweight [14].
This understanding can then be used to avoid or at least limit the impact the ECG artifact may have
on the EEG signals by employing linked-ear referencing or a grounding collar. Similarly for other
artifacts, an understanding of their origins can be exploited to minimise their influence.
Artifact rejection, involves the identification and exclusion of the artifact segments from
the EEG trace. In the past it was conventionally performed by trained experts who visually score
the EEG data or the artifact activity itself (such as EOG, EMG, ECG etc.), rejecting any periods of
EEG with unacceptable levels of artifact activity. This is an extremely laborious and inconsistent
approach but is typically done in clinical studies. More popular today are automated signal
processing approaches (e.g. threshold-based rejection methods) that make it much less labour
intensive to implement but at the cost of under- or over-rejection of EEG data. The goal in artifact
rejection is to produce EEG data that is as clean as possible, ignoring the cost of discarding
valuable periods of EEG recordings. This is a huge drawback and would be unacceptable for the
purposes of processing EEG signals in real-time or on a single trial basis where every segment of
EEG data is required. This requires the artifact to be removed from the continuous EEG and can
only be performed with the aid of digital signal processing algorithms.
Artifact removal methods utilise such algorithms to isolate and remove, as best as
possible, certain artifacts from the recorded EEG activity while most importantly unlike the other
approaches retaining the period of EEG. These methods are a very topical research area and may
be divided into two different approaches:
• Filtering and,
• Higher-Order statistical separation
Filtering, involves the development of a filter model to emulate the artifact activity and
use it to remove the artifact from the EEG recorded signals. The filter coefficients can either be
established from definitive artifact properties such as line interference at 50Hz or from empirical
processing of the non-cerebral bioelectrical artifact recordings such as ECG, EMG and EOG. This
may result in a conventional low-pass, high-pass, band-pass and notch filter or a more complex
filter model. Typically continuous adaptive regressive filtering is used in this approach. Regressive
filtering methods in the time [21,22] or frequency domain [23,24] can, despite their computational

Chapter 2
22
efficiency, overcompensate for the artifact contribution resulting in the loss of EEG information or
the introduction of new artifacts.
The ultimate goal is a method of removing any artifacts on a single trial basis from EEG
recordings without corrupting or smearing the underlying EEG data, thus removing the need to
reject corrupted periods or trials of EEG data. However, due to the uncertainty and variability in
the desired EEG signals, the large number of potential artifact sources and the significant
background neuronal (EEG) noise, this becomes a very difficult goal to achieve. Due to the large
number of unknown sources of neuronal and non-neuronal origins contributing to the recorded
signal, it becomes a blind source separation (BSS) challenge to identify and remove artifacts on a
single trial basis. The BSS method exploits the higher-order statistical differences between the
contributory signals to discriminate possible artifact and cerebral components. This is a very
difficult problem if one is uncertain of the properties of the artifacts one wishes to separate from
the EEG. Artifacts such as EOG, ECG and EMG activity can be monitored and used as inputs in
such algorithms to identify the isolated components and subsequently filter out their contributions
to the EEG recordings without smearing the underlying EEG activity. Makeig, Jung et al.
successfully employ Independent Component Analysis (ICA), a BSS method, to remove blink
(EOG), EMG and line interference artifacts [25-27] and highlight its superiority over PCA and
regressive methods [28]. This approach is however very computationally intensive.
The ICA and regressive filter approaches have their own relative advantages and
disadvantages in terms of effectiveness, computational complexity and implementation
practicality. Despite this research topic receiving much attention, a de-facto standard has not yet
been set for EEG artifact removal due to the underlying uncertainty of the contributory neuronal
and non-neuronal signals. Some of the methods mentioned above will be discussed later in greater
detail in section 3.23 with relation to EEG signal preparation prior to its use as a BCI input.
2.4. EEG signal properties
This section performs an introduction to the analysis and characteristics of scalp recorded EEG
signals from both a clinical and signal processing point of view. It is the most important section in
this chapter for the purposes of following succeeding chapters but more importantly for
understanding how EEG can be used as a BCI input modality. A review is performed in this
section on the numerous ways to characterise EEG activity but more importantly features that can
be associated with a brain response to a function or stimulus that could act as a BCI input and an
ultimate control or communication means.
An individual’s brain wave patterns are unique. In some cases, it is possible to distinguish
a person according to their characteristic brain activity, e.g. location of alpha peak [29]. Subjects

Chapter 2
23
who regard themselves as rational types or as holistic/intuitive types may demonstrate certain
higher activity in their frontal left and frontal right regions respectively. An EEG signal consists of
many components with different characteristics. A large amount of data received from even one
single EEG channel presents a difficulty for interpretation.
The EEG recorded brain waves originate from a multitude of different neural communities
from various regions of the brain. These neural communities produce electrical contributions or
components that can differ by a number of characteristics such as topographic location, firing rate
(frequency), amplitude, latency etc. A big assumption in BSS methods, which will be addressed
later, is that these components are independent of one another thereby inferring that certain neural
populations are acting in isolation of one another, even if it is in response to the same stimulus.
Due to the complex interconnectivity of neuronal cells from one brain region to another, it would
be difficult to justify such an assumption physiologically. The volumetric effect of the
cerebrospinal fluid, skull and scalp result in a smearing of these many electrical components that
result in the scalp recorded EEG macropotential. Similar coherent electrical activity can be picked
up in nearby electrodes. Through the use of high density EEG recordings one can hope to perform
an inverse solution to undo as best as possible the volumetric smearing effects of the medium
through which the neuro-electric signals permeate. These BSS methods attempt to isolate
dominant (independent) components and localize them to particular brain regions to aid in the
understanding of the cognitive processes that resulted in their creation or to identify abnormalities.
The results are often used to create 2D or 3D colour topographic brain maps to enhance
visualization. Whether it is the macropotential EEG signal or its contributory components, there is
a need to characterise the EEG waveforms using standard terminology to help characterise the
functional behaviour of the brain.
This section highlights the many descriptors that are used with EEG recorded signals or its
decomposed components to help in the categorization and description of complex brain activity. A
brief summary of these are listed in Table 2-6 along with examples, for a more detailed insight in
both pictorial and descriptive form the reader is referred to [14,19] for a review. Clinical
electroencephalography uses a large number of these descriptors, particularly in the study of
epilepsy, to facilitate accurate analysis. In relation to cognitive research the most important aspects
of EEG activity are distribution, frequency, amplitude, morphology, periodicity but more
importantly the behavioural and functional correlates. In summary, EEG requires a considerable
level of experience to accurately identify and characterise the signals.

Chapter 2
24
Table 2-6: Common descriptors of EEG activity: explanation, examples and comments
Descriptor of EEG signals
Explanation Characterisation examples Comments
Morphology Shape of the wave
Rhythmical (regular) Arrhythmical (irregular) Sinusoidal Spindles Complexes Spikes Polyspikes Sharp waves
Morphology is the primary EEG descriptor in epileptic studies Brain patterns form wave shapes that are commonly sinusoidal A complex can be made up of a combination of sharp and slow waves and tend to last longer than 0.25s therefore do not repeat over rates of 4Hz.
Repetition Defines the type of waveform occurrence
Rhythmic Semi rhythmic Irregular
Spindles are groups of rhythmical repetitive waves that gradually increase and then decrease in amplitude.
Frequency How often a repetitive wave recurs
Frequency Bands Delta Theta Alpha Beta
An symmetry seen in one bipolar montage should be verified using another montage orientated at 90° to the first or reference montage. Differences of amplitude are sometimes caused by factors outside the brain, especially by unequal spacing and impedance at recording electrodes.
Amplitude Measured in microvolts (µV) peak-to-peak or from the calibrated zero reference
Clinical reference: Low ( < 20µV) Medium (20-50µV) High (>50µV) Amplitude Asymmetry
Typically between 10 and 100 µV (in adults more commonly between 10 and 50 µV) [30] Longer inter-electrode distances produce increasing amplitudes up to an inter-electrode distance of about 8cm
Distribution The occurrence of electrical activity recorded by electrodes positioned over different parts of the head
Widespread, diffuse (generalised) Lateralised Localised (Focal)
Lateralised activity is suggestive of a cerebral abnormality In describing the location of local patterns electrode names should be used, not head regions or brain areas.
Phase Relation The relative timing and polarity of components of waves in one or more channels e.g. Do the troughs and peaks line up?
In-phase Out of phase Phase Angle
In a single channel, phase refers to the time relationship between different components of a rhythm.
Timing Relative occurrence of activity in time at different parts of the brain recorded by different channels
Simultaneous (Synchronous) Independent (Asynchronous) Bilaterally synchronous
The resolution of time relations deteriorates if more distant channels are compared Gives an idea of possible triggering mechanism
Persistence How often a wave or pattern occurs during a recording session
Index Percentage (Proportion of time for which these waves appear in the recording) Poorly / Well sustained High, moderate & low persistence
Very common in Polysomnography (Sleep staging studies) The persistence and amplitude are often described together in terms of Quantity, Amount & Prominence
Reactivity Refers to changes that can be produced in some normal and abnormal patterns by various manoeuvres or functions
EEG alteration in response to: Closing the eyes Hyperventilation Visual or sensory stimulation Changes in levels of alertness Movements
Useful in abnormal or drug addiction studies Useful to prepare or evaluate the subjects condition prior to recording
For the purposes of BCI system design, there exist various EEG signal properties that
discriminate brain function and hence can be used as an input mechanism to offer control or
communication. EEG signal properties for BCI systems can be categorised into one of the
following groups:
1. Rhythmic brain activity
2. Event-related potentials (ERPs)
3. Event-related desynchronization (ERD) and event-related synchronization (ERS).

Chapter 2
25
2.4.1. Rhythmic brain activity
Frequency is one of the most important criterions for assessing abnormality in clinical EEG and
for understanding functional behaviour in cognitive research. With billions of oscillating
communities of neurons as its source, the human EEG potentials are manifested as aperiodic
unpredictable oscillations with intermittent bursts of oscillations having spectral peaks in certain
observed bands: 0.1-3.5 Hz (delta, δ), 4-7.5 Hz (theta, θ), 8-13 Hz (alpha, α), 14-30 Hz (beta, β)
and >30Hz (gamma, γ) [5]. Figure 2-15 illustrates examples of these EEG rhythms and the
reactivity of the important alpha band to eye closure. The band range limits associated with the
brain rhythms, particularly beta and gamma, can be subject to contradiction and are often further
sub-divided into sub-bands that can further distinguish brain processes [29,31]. Table 2-7
summarises some common brain rhythms and their resulting EEG characteristics such as typical
amplitude, frequency, location and reactivity.
Activity that is either less than 0.5 Hz or greater than 20 Hz is often assumed to be of
limited clinical utility. Some recent papers have published the existence of cognitive brain process
in the beta and gamma bands. The literature does not clarify whether the higher frequency activity
(>30 Hz) is of cerebral origin.
Figure 2-15: (a) Examples of alpha, beta, delta and theta EEG rhythms, (b) Change from alpha waves to asynchronous pattern when subject opens eyes
Human EEG rhythms are affected by different actions, thoughts and stimuli. For example
the planning of a movement can block or attenuate the mu rhythm (as described in Table 2-7). The
fact that mere thoughts affect the rhythmical activity of the brain can be used as the basis for a BCI
system. In the next chapter, some BCIs based on rhythmical property variation are used as a
discriminatory control feature.

Chapter 2
26
Table 2-7: Normal EEG rhythms characteristics
Brain
Rhythm
Typical
Frequency
range (Hz)
Normal
Amp.
(µV)
Where it can be found Reactivity Comments
Delta 0.1 - 4 <100
Dominant in infants, during deep stages of adult sleep and serious organic brain disease. Central cerebrum and parietal lobes
Focal in pathologies. Occur after transactions of the upper brain stem separating the reticular activating system from the cerebral cortex
Polymorphic delta: severe, acute, or ongoing injury to cortical neurons. Rhythmic discharge: psychophysiologic dysfunction.
Theta 4 – 8 <100 In drowsy normal adult, in frontal, parietal and temporal regions. In children when awake
Rare in EEG of awake adults During emotional stress in some adults Sudden removal of something causing pleasure will cause about 20s of theta waves
Niedermeyer lists some studies in which the theta activity of 6-7 Hz over frontal midline region had been correlated with mental activity Focal or lateralized theta indicates focal pathology, Diffuse theta more generalized neurologic syndrome.
Alpha 8 - 13 20-60
The most prominent rhythm in the normal alert adult brain. Most prominent at occipital and parietal regions. About 25% stronger over the right hemisphere.
Fully present when a subject is mentally inactive, alert, with eyes closed. Blocked or attenuated by deep sleep, attention, especially visual, and mental effort When a person is alert and their attention is directed to a specific activity, the alpha waves are replaced by asynchronous waves of higher frequency and lower amplitude. Eye opening/closure offers the most effective manipulation
Location of central alpha peak declines with age and in dementia. Alpha waves are usually attributed to summated dendrite potentials Slowing is considered a non-specific abnormality in metabolic, toxic, and infectious conditions. Asymmetries - unilateral lesions. Loss of reactivity - a lesion in the temporal lobe. Loss of alpha - brainstem lesion.
Mu 10 - 12 <50 Central electrodes, over motor and somatosensory cortex
Does not react to opening of eyes like alpha rhythm Blocking before movement of the contra lateral hand. Blocking for light tactile stimuli. Blocking for readiness or imagination to move limbs
Physiologically and topographically different to alpha rhythm Not clinically useful. Useful as a BCI input in relation to actual and imagined limb movement Typically appears as part of a background rhythm.
Beta 14 – 30 <20 Three basic types Frontal beta Widespread Posterior
Frontal beta blocked by movement Widespread beta often unreactive Posterior beta shows reactivity to eye opening
Beta I waves, lower frequencies, which disappear during mental activity Beta II waves, higher frequencies, appear during tension and intense mental activity Under intense mental activity beta can extend up as far as 50Hz
Gamma > 30 <2 Widespread Found when the subject is paying attention or is having some other sensory stimulation
Due to its really low amplitude it is very difficult to isolate without band-pass filtering
2.4.2. Event-related potentials (ERPs)
Event-related potential (ERP) is a common title for potential changes in the EEG that
occur in response to a particular “event” or a stimulus. ERPs provide a suitable methodology for
studying the aspects of cognitive processes of both normal and abnormal nature, such as
neurological or psychiatric disorders. Mental operations such as those involved in perception,
selective attention, language processing and memory, proceed over time ranges in the order of tens
of milliseconds. Whereas PET and MRI can localize regions of activation during a given mental
task, ERPs can help in defining the time course of these activations.

Chapter 2
27
Amplitudes of ERP components are often much smaller than spontaneous EEG
components, typically a factor of ~10. They are subsequently unrecognisable from the raw EEG
trace. They can be elicited by ensemble averaging EEG epochs time-locked to repeated sensory,
cognitive or motor events [32]. The assumption is that the event-related activity, or signal of
interest, has a more or less fixed time delay to the stimulus, while the spontaneous background
EEG fluctuations is random relative to the time when the stimulus occurred. Averaging across the
time-locked epochs highlights the underlying ERP by averaging out the random background EEG
activity (similar to additive white noise), thus improving the signal-to-noise ratio. These electrical
signals reflect only the activity which is consistently associated with the stimulus processing in a
time-locked manner. The ERP thus reflects, with high temporal resolution, the patterns of neuronal
activity evoked by a stimulus. This approximation to the real ERP however, offers no phasic
information. ERPs can be divided into exogenous and endogenous [33]. Exogenous ERPs occur up
to about 100ms after the stimulus onset. They depend on the properties of the physical stimulus.
The potentials pre-stimulus and 100ms after the stimulus are termed endogenous. DC-shifts or
Slow-Cortical Potentials are endogenous ERPs and are used by Birbaumer [33] in their “Thought
Translation Device (TTD)” BCI system.
Evoked-potentials (EPs) are a subset of the ERPs that occur in response to or during
attention to certain physical stimuli (auditory, visual, somatosensory etc.). They can be considered
to result from a reorganization of the phases of the ongoing EEG signals [34]. The EPs can have
distinguishable properties related to different stimuli properties, for example, the EEG or Visual
Evoked Potential (VEP) over the visual cortex varies at the same frequency as the stimulating light
[5]. There are many successful EP based BCI systems that utilise VEPs [35], steady-state VEPs
[36] or P300s [37] as inputs which will be reviewed later.
Readiness Potential (RP) or Movement-Related Potentials (MRP) is an ERP of the order
of 1µV generated in response to a cognitive desire to perform or imagination of limb movement
and is prevalent at highly localised areas of the brain related to that function (primary motor
cortex). The ERP pattern recognition approach to BCI design produces a more natural brain
response directly related to the function. Most relevant for the BCI use is the fact that these
patterns do not require actual movements and are similarly generated by imagined movements
[38]. Most present-day BCIs based on imagined movements use a synchronous cued approach to
time-lock the event [38-46]. This restricts the user to fixed time periods but dramatically simplifies
the classification process. The system knows the exact timing of when a brain pattern can occur
and consequently only has to classify the event rather than both the occurrence of an event and
then the event itself. In contrast, an asynchronous paradigm has the difficult task of detecting an
event from continuous EEG amidst the widely varying baseline or background EEG activity.

Chapter 2
28
A common goal in many BCI research groups is to detect these small ERPs of
approximately 1µV from the background EEG (10-50 µV), extract distinguishable features and
classify them for subsequent use as inputs to a computer interface. The largest portions of BCI
systems to date are based on using event-related or evoked potentials. A review of some of these
systems is presented in chapter 3.
2.4.3. Event-related (de/)synchronization (ERD/ERS)
Pfurtscheller and Aranibar first quantified event-related desynchronization (ERD) in 1977 [47].
Pfurtscheller developed a BCI known as the Graz BCI in the 1990s that was based on detecting
ERD and ERS of the different mu and beta rhythms bands during the imagination of left and right
hand movements [47-52]. ERD is amplitude attenuation and ERS is amplitude enhancement of a
certain EEG rhythm. In order to measure ERD or an ERS, the power of a chosen frequency band is
calculated before and after the event over a number of trials. The average power across a number
of trials is then measured in percentage relative to the power of the reference interval. The
reference interval can be an arbitrary period prior to the event representing a period of inactivity or
rest. The ERS is the power increase (in percent) and the ERD is the power decrease relative to the
reference interval that is defined as 100%. ERD/ERS measurements selected over specific
frequency ranges are typically used to produce a spatio-temporal map to visualise the functional
behaviour of the brain. The reader is referred to [49] for a more detailed quantification of
ERD/ERS in time and space.
2.5. Applications
This section highlights the many clinical and cognitive research applications that have been
established over the years for EEG. Hans Berger in his original papers (grouped together and
translated in [2]) laid the foundations for most of today’s clinical uses for EEG. The greatest
advantage of EEG over other brain imaging technologies is speed and cost. Complex patterns of
neural activity can be recorded with millisecond resolution. As mentioned above, EEG however
provides poor spatial resolution (~1cm) compared to MRI or PET (<1mm). Thus for better insight
into the origins of neural activity EEG inverse solution images are often compared with MRI scans
for a similarly but separately run trial.
According to Bickford [18] research and clinical applications of the EEG in humans and
animals are to:
Monitor alertness, coma and brain death Locate areas of damage following head injury, stroke , tumour etc. Test afferent pathways (by evoked potentials) Monitor cognitive engagement (alpha rhythm) Produce biofeedback situations, alpha, etc. Control anaesthesia depth (‘servo anaesthesia’)

Chapter 2
29
Investigate epilepsy and locate seizure origin Test epilepsy drug effects Assist in experimental cortical excision of epileptic focus Monitor human and animal brain development Test drugs for convulsive effects Investigate sleep disorder and physiology
Symmetry of alpha activity within hemispheres can be monitored. In cases of restricted lesions
such as tumour, haemorrhage, and thrombosis, it is usual for the cortex to generate lower
frequencies. EEG signal distortion can be manifested by reduction in amplitude; decrease of
dominant frequencies beyond the normal limit; production of spikes or special patterns. Epileptic
conditions produce stimulation of the cortex and the appearance of high-voltage waves (up to
1000µV) referred to as “spikes” or “spike and wave” [18]. EEG patterns have been shown to be
modified by a wide range of variables , including biochemical, metabolic, circulatory, hormonal,
neuroelectric, and behavioural factors [3]. By tracking changes of electrical activity during such
drug abuse-related phenomena as euphoria and craving, brain areas and patterns of activity that
mark these phenomena can be determined. As the EEG procedure is non-invasive and painless, it
is widely being used to study the brain organization of cognitive process such as perception,
memory, attention, language comprehension and emotion in normal adults and children. For this
purpose, the most useful application of EEG recording is the ERP analysis method.
Taking the functional and cognitive insight that EEG offers a step further, would allow
humans to modulate their brainwave activity in order to communicate. This gives rise to the
rapidly developing area of neuroscience and engineering that is brain computer interface design.
Its development is in its infancy with respect to other communication technology such as mobile
phones, television etc. but despite it presently offering limited communication rates, it could
possibly replace other communication modes particularly within the area of rehabilitation in the
future.
2.5.1. Biofeedback
Biofeedback is the process in which a subject receives information about his physiological state
[53]. It creates an external loop by which a subject can monitor one or more of his physiological
states to aid in training or performance of a task. The most popular biofeedback methods include;
galvanic skin response (GSR), body temperature, EEG, ECG, heart-rate variability (HRV), EMG
and respiration. These various methods are used for different clinical purposes to report on the
physiological state of the human body. EEG biofeedback or neurofeedback can be dated back to
the early 1970’s when the self-regulation of the alpha rhythm was used to aid in relaxation and
meditation [54]. Today it proposes to offer a greater insight into the physiological and mental state
of a subject compared to other biofeedback modalities.

Chapter 2
30
While many researchers are sceptical about neurofeedback, some assume that subjects can
improve their mental performance, normalize behaviour and stabilize mood through its use. There
are a wide range of applications which market the use of EEG biofeedback. Predominantly it is
used in monitoring and rehabilitation for conditions such as attention deficit hyperactivity disorder
(ADHD), depression, anxiety, epilepsy, sleep disorders and alcoholism. Biofeedback is a powerful
therapeutic tool which teaches people to take responsibility to learn self-regulation of their bodily
systems and behaviour [53].
The EEG signals at the neurofeedback input are typically fed into a computer to decipher
the physiological or mental state of the subject. This allows the feedback to be presented to the
subject in a more stimulating and meaningful manner using a combination of sensory feedback
methods such as visual, auditory and tactile. It is necessary to provide interesting feedback,
particularly in studies with children, to maintain the subjects’ attention during the typically long
and tedious EEG biofeedback treatment sessions.
Neurofeedback in a training situation may help a subject to modify his or her brainwave
activity. Through the use of extensive training, it can allow a subject to alter the EEG so that it can
then be used as a BCI input to offer control or communication. This BCI application of EEG
biofeedback is fundamentally different to its use in clinical treatment. In biofeedback treatment the
goal is to reach a certain condition and maintain it, whereas in BCI design the goal is that the user
learns to alter his or her EEG activity between two or more conditions (functional classes) [55,56].
The positive effects of EEG biofeedback will be readdressed in greater detail in section XX in
relation to BCI system design and then again in chapter 5 in a BCI gaming system implementation.
2.6. Summary
EEG is limited by the vast number of electrically active neuronal elements, the complex electrical
and spatial geometry of the brain and head, and the disconcerting trial-to-trial variability of brain
function [57]. The layers of cerebrospinal fluid, skull and scalp between the electrodes and the
brain itself, act as an electrical shield severely attenuating and volume smearing the electrical
contributions of neuron communities to EEG recordings. This presents a difficult challenge to
localize and decipher the contributions of neuron communities to the EEG recorded
macropotentials. Despite EEG’s poor spatial resolution, its excellent temporal resolution of less
than one millisecond and ease of acquisition makes it the only practical brain imaging modality for
real-time BCI systems. Despite the Herculean challenges for utilising EEG as the input modality to
a BCI, recent advances in signal processing techniques make it more feasible than ever before.
The next chapter will review the key components to an EEG based BCI system, paying
considerable attention to signal processing methods involved. Then a literature review is provided

Chapter 2
31
on all aspects of BCI design, implementation and performance. The fundamentals of EEG as
covered in this chapter coupled with a review of the components and methodologies of an EEG
based BCI system as covered in the next chapter will prepare the reader for the subsequent three
chapters which report on different BCI designs and implementations that were carried out.

Chapter 3
32
Chapter 3 Brain Computer Interfaces (BCIs)
This chapter serves as an introduction and state of the art review of EEG-based BCI technology. It
begins by introducing the idea of a direct human computer interaction via the electrical signals
generated within the brain. It explains the social and scientific need of such a system that inspires
this line of research. Having clarified the concept and purpose of a BCI, the chapter moves on to
discuss the various approaches and methodologies that are employed to realise a fully functional
BCI system. Section 3.1 highlights the two fundamentally different approaches to designing a BCI
system based on the nature of brain signal generated as the control mechanism. The next section
identifies and briefly explains the necessary components to a typical BCI system. Section 3.5 goes
further to describe some of the signal processing methodologies involved with these BCI
components. The chapter performs a review of BCI technology to date by cataloguing in tabular
form a large selection of implemented systems and describing the varying approaches taken. The
work of the principal BCI research groups from around the world is reviewed. To facilitate
comparison, the chapter concludes by introducing performance metrics that can used to evaluate
BCI systems. The key issues that need to be addressed to facilitate a more rapid development of
BCI research and the future prospects of this technology will be discussed in the conclusion after
the presentation of two BCI system implementations in the next two chapters.
3.1. Introduction
This introduction serves to provide the reader with a clear understanding of what is involved with
the novel idea of a direct human-computer interaction via signals generated within the brain. This
BCI technology will first be briefly introduced and then discussed in more detail by answering
some of the commonly posed questions on BCI systems.
For many years the scientific community has identified direct correlations between brain
activity and cognitive functional and mental tasks. This sparked huge interest over the years in the
multidisciplinary field of cognitive neuroscience that culminated with much speculation as to the
enormous potential of harnessing this correlation to offer a new non-muscular channel for sending
messages and commands to the external world. Over the past two decades, productive BCI
research groups have arisen to explore this new potential communication modality. Facilitated and
encouraged by new understanding of brain function, by the advent of powerful low-cost computer
equipment, and by growing recognition of the social needs of people with disabilities, these groups
focused their attention on developing a new alternative communication and control technology to

Chapter 3
33
exploit this medium. Today, BCI systems propose to offer humans a new non-muscular modality
through which to communicate directly with their environment. They rely on the acquisition and
interpretation of the user-controlled commands encoded in the neurophysiological signals.
What is a Brain Computer Interface?
BCI technology provides a direct interface between a brain and a computer. In the first
international BCI workshop held in June 1999 in Rensselaerville, New York involving 22 research
groups, a formal definition of the term BCI was set forward [58]:
“A brain-computer interface is a communication system that does not depend on the brain’s
normal output pathways of peripheral nerves and muscles”
In basic terms, a BCI involves monitoring brain activity (via a brain imaging technology)
and detecting characteristic brain pattern alterations that the user controls in order to communicate
(via digital signal processing algorithms) with the outside world. In a BCI, messages and
commands are expressed not by muscle contractions as with conventional communication means,
but rather by electrophysiological signals generated within the brain.
What is the Research motivation?
The original motivation that inspired this line of research was to develop an alternative and
replacement communication technology for severely disabled people. For people who are ‘locked-
in’ as a result of a severe neuromuscular disability such as ALS7, TBI8, CP9, mitochondrial disease
and SCI10, this may offer the only means of communication and environment control. Several
rehabilitative communication systems have been developed over the years to compensate for this
communication impairment, but most of these require some sort of limited movement ability in
order to function. In the worst cases of the aforementioned disabilities when the sufferers loose all
voluntary muscle control but remain cognitively intact, harnessing brain activity is the only viable
method of communication.
Despite the principal motivation being to offer a means of communication for individuals
with neuromuscular impairments, more and more media attention has been attributed to exploring
the full potential of this communication medium for the wider audience in areas such as
multimedia applications and video games.
7 ALS - Amyotrophic Lateral Sclerosis 8 TBI - Traumatic Brain Injury 9 CP - Cerebral Palsy 10 SCI – Spinal Cord Injury

Chapter 3
34
Why EEG as the BCI input modality?
There exist a number of technologies that can monitor brain activity. These include, for example,
functional Magnetic Resonance Imaging (fMRI), Magnetoencephalography (MEG), Positron
Emission Tomography (PET), Single Photon Emission Computer Tomography (SPECT) and
Electroencephalography (EEG). As summarised in section 2.1.2, EEG is the only practical non-
invasive brain imaging technology for the following reasons:
• Inexpensive
• Ease of acquisition
• High temporal resolution (i.e. almost instantaneous representations of brain activity, within 1ms)
• Real-time implementation possible
• Direct correlation of functional brain activity with EEG recordings
Almost all of BCIs reported to date have been based on EEG for these reasons. Research reported
in this thesis focuses for these reasons on EEG-based BCI system design and implementation.
How can users modify their EEG signals to select a specific control attempt?
Communication or control based on BCI technology requires patterns of brain activity that can be
consciously generated or controlled by a subject and ultimately clearly distinguishable by a
computer system. EEG based BCI systems decipher patterns in the scalp recorded electrical
signals.
These patterns can be created by one of two possible BCI approaches which will be
discussed in greater detail in section 3.12. One approach requires the BCI user to concentrate on a
mental task in order to produce a characteristic brain pattern that identifies with the desired
control, for example, the imagination of hand movement. The performances of different mental
tasks generate different EEG responses and hence can be translated into a control codebook for the
user, assuming the BCI system can be trained to decipher the associated EEG activity. The other
approach requires users to perform extensive training to develop the ability to self-regulate their
EEG activity, for example, the mu rhythm.
How can a BCI system detect the control attempts from the EEG signals alone?
Once the user can generate ‘distinguishable’ brain activity associated with different control
commands, the goal of the BCI system is to identify this EEG activity by extracting features or
signal characteristics that identifies with this specific control and maximally distinguishes it from
activity associated with other control commands. The fundamental requirement of a BCI is to
identify a control or communication attempt from EEG signals by attributing values associated to
characteristic activity. As summarised in section 2.4, there are many ways to categorise EEG

Chapter 3
35
signals for this task. Broadly speaking, most EEG-based BCIs approaches can be characterised
into three groups of EEG patterns: Rhythmic brain activity, Event-related potentials (ERPs) and
Event-related (de)synchronization (ERD/ERS) that can identify with various control attempts.
Successful BCI operation requires that the user have control over the activity that generate these
signal features and that the BCI correctly derive the user's intentions from them.
What is the relationship between the user and the system?
BCI operation depends on the interaction of two adaptive controllers, the user, who must maintain
close correlation between his or her intentions and these signal features, and the BCI, which must
translate them into device commands that accomplish the user's intentions. The user and the BCI
system need to adapt to each other both initially and continually so as to ensure stable
performance.
What is the current research attention?
The last 25 years since the first successful BCI implementation by Prof. J. Vidal at UCLA [1] has
witnessed an explosion of scientific interest in the area of BCI research. Due to the realisation of
the enormous potential for exploiting this innovative direct communication medium, there are now
more than 40 research groups around the globe investigating BCI systems and its potential
applications. Consequently more and more research grants are being allocated to this rapidly
developing multidisciplinary field. However, Donchin expressed in [59] that the potentially huge
human impact of such a technology is not reflected by the funding or commercial interest. An
excellent review of all the efforts to make BCI technology a mature field of research can be found
in [57].
What is the goal of BCI Technology?
Present-day BCIs provide maximum information transfer rates up to 25 bits/min. With this
relatively limited capacity, they can provide basic communication and control functions (e.g.,
environmental controls, simple word processing) to those with the severe neuromuscular
disabilities. It also supports basic limb control such as a hand grasp to those with mid-level
cervical spinal cord injuries through its incorporation with FES. This area of neuroprosthesis is
becoming an important aspiration of this technology. More complex BCI applications targeted at a
wider population of users depend on the achievement of higher information transfer rates. Thus
accuracy and speed of this technology hinder the goals of this technology.
3.2. Two fundamental approaches to BCI design
The ideal BCI system would be capable of simply detecting a user’s commands or communication
attempt directly from the electrophysiological signals generate. There would be no need to perform

Chapter 3
36
a wilful alteration of one’s thoughts in order to change the brain activity in a characteristic manner
to result in a control decision. It would simply involve an effortless ‘wish’. This could be
considered similar to the way humans perform limb movements. A BCI system that could interpret
human desire directly in this manner would have enormous potential for the widespread
population.
Unfortunately, this is not possible with today’s technology and neurophysiological
understanding. As the best alternative, BCI researchers have utilised their knowledge of the brain’s
electrophysiology to exploit brain activity that can be characteristically altered by the user in order
to offer distinguishable commands. It requires a much more conscious effort on behalf of the user
compared to the ideal case described above. In some cases extensive training is also required. It is
a very difficult signal processing challenge to extract the control signals from the electrical soup
that make up the EEG recordings even when the user is fully devoted to the task. It is questionable
that in the near future, one would be capable of deciphering the subtleties of desire from any brain
imaging modality.
There exist two basic approaches widely referred to in the literature to modify ones brain
activity to form as the BCI input. The first is the pattern recognition approach based on
identification of characteristic brain activity in response to performing a cognitive mental task. The
second is the operant conditioning approach based on the self-regulation of the EEG response.
3.2.1. Pattern Recognition (PR) approach
Earlier in section 2.2.2 it was discussed that the human brain is functionally organised. The activity
associated with certain mental tasks is highly localised to specific and known regions of the brain.
BCI researchers utilize this knowledge and cognitive psychology to devise suitable experimental
paradigms to guide the user to generate distinguishable brain patterns in response to different
cognitive mental tasks. The principle of choosing the different mental tasks is that they produce
detectable and different EEG patterns. The Pattern Recognition (PR) approach employs signal
processing algorithms for feature extraction and classification that identify and distinguish the
brain activity in response to these mental tasks, thus offering a means of control or
communication.
The mental tasks used in BCIs to date have included motor imagery, visual, arithmetic and
baseline tasks. Activation in response to the chosen task should occur close to the cortex so that it
can be detected with scalp electrodes. The simplest approach to generating different EEG patterns
is to ensure that the mental tasks activate different parts of the brain. This topographic PR
approach looks for activity level variations in specific brain regions that identify with the mental
task and hence offer a means of control. For example, the imagination of right hand movements

Chapter 3
37
should activate the left motor cortex and the imagination of left hand movements the right motor
cortex. Similarly, visual and arithmetic tasks should activate the visual association area and the
prefrontal cortex respectively. A more challenging PR approach is to decipher distinguishable
patterns from brain activity in the same brain region related to different mental tasks (localized PR
approach).
Decoding brain patterns is a challenge however due to the inter-trial variability of brain
activity, the low signal-to-noise ratio (SNR) of the brain response to the mental task with
comparison to the background activity, the subtlety between the responses to different tasks and
the real-time requirement of the decoding process. It should also be noted that some mental tasks
suit some people better than others. For example, a subject with poor spatial relation visualization
may find the cube rotation mental task by Keirn and Aunon in [60] too difficult. Penny describes
in [61] the PR approach taken by his Oxford BCI research group and discusses the additional
signal-processing challenges compared with the operant approach. It will be shown later in the
state-of-the-art review that the majority of implemented BCI systems take the PR approach.
3.2.2. Operant Conditioning (OC) approach
The Operant Conditioning (OC) approach to BCI design requires the user to perform lengthy
training sessions in a biofeedback environment to master the skill of being able to self-regulate
one’s brain activity. It was first defined by Niels Birbaumer [62-64] and the Tübingen BCI
research group11 in their BCI called the Thought Translation Device (TTD). The system was based
on the self-regulation of slow-cortical potentials (SCP), a low-frequency modifiable potential shift.
As discussed earlier in section 2.4 there exist many descriptors of EEG activity. Rhythmic
brain activity, event-related potentials and event-related (de)synchronization (ERD/ERS) are the
most common method of categorizing EEG patterns for use in a BCI system. The brain activity
that one hopes to regulate in the OC approach is often empirically discovered by studies that
investigate the effects of biofeedback. The most prominent BCI research groups have based their
BCIs on the self-regulation of specific brain rhythms and potentials. Birbaumer et al. [62-65] and
their TTD device exploits controllable variations in SCPs. Wolpaw et al. [57,58,66-69] at the
Wadsworth Center12 have based their BCI on the self-regulation of µ or ß rhythms.
The nature by which a given EEG signal property is self-regulated by the user with the OC
approach is an ambiguous area. Wolpaw et al. [68] report that the users of their BCI are advised
before any experiments that various kinds of motor imagery are helpful to affect control. Wolpaw
11 Institute of Medical Psychology and Behavioral Neurobiology, University of Tübingen, Germany- http://www.uni-
tuebingen.de/medizinischepsychologie/projekte/als.htm 12 Neuroscience Program, Wadsworth Center, NYS Dept. of Health, NY http://www.wadsworth.org/resnres/neurosci.htm

Chapter 3
38
et al. describes how the users later develop self-regulation without the need to use mental imagery.
In the case of the TTD, the users were simply instructed to be attentive to the feedback and to
develop whatever mental strategy to offer maximum control. Patients that utilized the TTD device
were reported in [63,70] to have used very different mental strategies of affect control. These
varied from the subject visualizing ‘carrying a heavy object up a hill’ to ‘electrifying the brain’.
The varied nature of the mental strategies points to the importance of the feedback in the learning
procedure, irrespective of the strategy employed. According to Kübler et al. [70] there are three
necessary elements required to facilitate the learning procedure in the self-regulation of EEG
activity:
1) Real-time feedback of the specific EEG activity
2) Positive reinforcement of correct behaviour
3) Individual shaping schedule in which progressively more demanding tasks are rewarded
The OC approach hinges on the effective use of biofeedback in the training scenario for a
subject to develop the ability to self-regulate an EEG signal property. The performances of BCIs
based on the OC approach are reasonably successful but the lengthy and arduous training
requirement makes it difficult for rapid deployment. Also the number of possible different self-
regulation states limits the possible information transfer rates. Some subjects in [63] and [68]
displayed the inability to develop the skill of brain activity self-regulation. The OC approach
places the biggest requirement on the subject’s ability to adapt compared to the PR approach
whereby it is up to complex signal processing to ensure success. The PR approach is more
challenging to ensure high classification accuracy. It however requires limited classifier training,
does not explicitly require feedback, has the potential to offer many control states and can offer a
more natural control method.
3.3. BCI control: synchronous Vs asynchronous
A BCI can be either cue-based (synchronous) i.e. when mental activities are triggered by external
stimuli or un-cued (asynchronous) i.e. when the user decides by wilful control that a mental task
should occur and the resultant control signal be generated. The former case is computer-driven and
the EEG has to be analyzed only in predefined time windows. The latter is user-driven and the
EEG signals have to be analyzed and classified continuously.
The cue-based BCIs are dramatically less demanding in the feature extraction and
classification stages compared with the un-cued systems. Only a small segment of EEG data, time-
locked to the cue, needs to be analyzed in comparison to the un-cued approach. The synchronous
approach does not need to estimate from the continuous EEG when a control attempt occurred

Chapter 3
39
seeing as it is relative to the cue. It only has to distinguish what control occurred within the small
window of EEG data. The synchronous BCIs offers a less natural method of control because one
must wait for the appropriate cue in order to make a decision. This limits the speed of command
generation for such an approach. However, synchronous BCIs tend to have higher accuracies due
to their simplicity and the removal of the need to identify a large range of features from the widely
varying continuous EEG signals.
Asynchronous BCIs are user driven i.e. the control is not system-initiated but user-
initiated. This offers complete control to the user. They tend however to have lower accuracy
compared to synchronous systems because of the need to identify what and when a control
occurred from the continuous EEG activity. Mason and Birch present an interesting hybrid
approach in [71] to combine the benefits of both the time-locked synchronous and user-guided
asynchronous approach. They introduced an additional EEG feature set that is controlled by the
subject to initiate a new synchronous trial.
3.4. BCI framework
This section highlights and explains the functional components involved in an EEG-based BCI
system. The basic components required for implementation are depicted in Figure 3-1 and
summarised as follows:
Figure 3-1: Processing Stages necessary for BCI implementation
1) The data acquisition stage involves the recording of the raw EEG data from electrodes at
specific locations on the scalp that form the input to the BCI system. Choices such as the
number, position and density of electrodes determine the input channels. The pre-processing
stage of the acquisition process involves amplification, analog filtering and A/D conversion.
See section 2.3 for a review on the methods and potential problems associated with EEG
data acquisition.
Amplifier& Filters
ArtifactRemoval
FeatureExtraction Classification Decision
Data Acquisition Digital Signal Processing Device Control

Chapter 3
40
2) The next stage is an optional information optimisation stage that involves improving the
signal-to-noise ratio (SNR) by removing artifacts and reducing information redundancy from
the EEG channels. See section 2.3.4 for a review on artifacts and methods to counteract their
adverse effect on EEG recordings.
3) Feature extraction is the most important stage to any BCI. It involves the development of
command-dependent discriminatory features from the pre-processed EEG signals by
employing DSP algorithms to identify with command-related activity. It is this stage that
often characterises the BCI design approach. If robust features that are resilient to artifacts
and the volumetric smearing effect of the neuronal signals can be extracted, the need for the
previous information optimisation stage is reduced. It also reduces the challenge on the
classifier to discriminate between the features of different controls. It is important to note
that the experimental paradigm is as crucial as the feature extraction methods for the
consistent elicitation of physiological brain patterns.
4) The classification or feature translation stage involves the identification of the feature
patterns to facilitate the categorisation of the user’s commands. It can be anything from a
simple threshold or linear model to a complex nonlinear neural network based classifier that
can be trained to categorise the features according to the control selection. Most classifiers
are based on a probabilistic approach whereby the class of highest probability is chosen. A
‘nothing’ class can be included to offer a no selection instead of a control.
5) The output of the classification stage is the controlling input of the device. The device
control transforms the classification into a device action. The output of the classification
stage may instruct the device that no appropriate control was classified and hence to perform
no action.
Mason & Birch proposed in [72] a general framework for brain-computer design in the
hope of standardising terminology and functional models to facilitate the benchmarking of BCI
systems. They proposed the generic functional model for a BCI system in Figure 3-2. They
stressed the importance of having such a model to compare the performance of BCI
communication technologies within the research community.

Chapter 3
41
Figure 3-2: A functional model of a BCI system proposed by Mason & Birch [72]
With the explanation of the various components to a BCI system listed above, the question
still remains about how the BCI design process begins and how all these components interlink. The
preliminary stage to any BCI requires an investigation into the paradigm and the brain activity
which one hopes to generate to offer distinguishable controls. This requires recording numerous
sessions or trials of data to later examine for distinguishable features. Ensemble averaging of trials
in the time or frequency domain is initially carried out in the hope of observing a general
characteristic pattern. The greatest challenge is to see if this characteristic activity can be elicited
on a single-trial basis or over a small segment of continuous EEG data. If this can be satisfactorily
achieved, feature extraction methods must be employed to represent these characteristics by a
number of values that can distinguish the different brain activity and resulting controls on a single-
trial or online basis. Thus a BCI system can be designed to exploit this human-controlled EEG
activity alteration to offer control.
3.5. BCI system methodologies
This section discusses the methodologies and digital signal processing involved with implementing
a BCI system. Particular attention is given to the methods that will be discussed in context of the
author’s BCI implementations covered in later chapters.
3.5.1. Experimental paradigm design
The experimental paradigm decides the environmental conditions in order to prompt or allow the
user to generate the controlling EEG activity. This is extremely important during the investigation
stages of BCI design whereby a command-related EEG activity (neuromechanism) has to be
established through extensive testing. A deep understanding of the human psychology and
neurological behaviour associated with the experimental environment is paramount to the feature
extraction and classification tasks for the purpose of eliciting distinguishable electrophysiological

Chapter 3
42
brain patterns to offer communication. It is clear in the literature that, subtle variations in the
environment during experiments, e.g. lighting, visual angle etc. for a visual task, can dramatically
alter the brain response and thus hinder extraction of the controlling feature for a BCI system. It
will be shown later in Study 2 (Chapter 5) that the exploited Visual Evoked Potential (VEP) was
sensitive to a wide-range of visual stimuli characteristics. Similarly for movement-related activity,
whereby the somatosensory cortex is closely located to the primary motor area, contamination of
the desired control signals could be caused by unnecessary sensory stimulation.
It is clear that our experimental environment should be as idyllic as possible, whereby the
only brain activity should be associated with the mental or functional task of communicating via
the BCI system. The brain however, is continuously performing many voluntary and involuntary
tasks that cannot be controlled during the experiments. We are also attempting to replicate real life
in a contrived experimental set-up whereby the user is repeatedly required to perform a task. In
real-life, a BCI system would be expected to function in a ‘noisy’ environment at any instant. This
is the ultimate goal of any experimental paradigm design, to imitate as best as possible a real-life
scenario. Unfortunately this would not be practical for the early investigatory stages of BCI design
whereby we need to work with clean and artifact-free data in order to identify the desirable
controlling brain activity pattern. When a satisfactory working BCI prototype from the ideal
testing environment is achieved, the goal is then to make the system robust enough to function in a
real-life scenario. There is however an inherent psychological difference between subjects
performing an event on a sporadic basis as in day-to-day life compared with repeated monotonous
trials in a contrived experimental environment.
The author’s collaboration with Trinity College Institute for Neuroscience (TCIN)13 and
Nathan Kline Institute for Psychiatric Research (NKI)14 offered the physiological and
psychological background knowledge for designing the experimental protocol for acquiring data
during various BCI related studies.
3.5.2. Pre-processing
Pre-processing involves the preparation of the EEG recordings prior to any form of digital signal
processing. In addition to sample rate conversion, it is an important stage that decides the filtering,
segmentation and detrending methods employed to prepare the EEG data for further BCI
processing stages. Filtering and segmentation (or epoching as it is referred) are used to identify and
maximise the information over a certain time or frequency range that is associated with the
characteristic brain activity to be elicited. It is widely assumed that no cognitive EEG activity
13 Trinity College Institute for Neuroscience (TCIN), Dublin – http://www.tcd.ie/Neuroscience/index.html 14 Nathan Kline Institute for Psychiatric Research (NKI), NY – http://www.rfmh.org/nki

Chapter 3
43
exists above around 40 Hz and thus filtering thereafter reduces the noise. A notch filter at the
mains frequency is typically performed in addition. Breaking the EEG data into epochs time-
locked to a stimulus (synchronous BCIs) identifies the time-window for which the desired activity
occurs, thus reducing the task to identifying what control activity occurred instead of what and
when in the case of continuous EEG data (asynchronous BCIs). It dramatically simplifies the
feature extraction and classification process. Detrending removes any baseline drift associated with
the EEG recordings. This is important to ensure the quasi-stationarity of small EEG segments. The
sample rate can be converted to represent the data in as few samples as possible to reduce the
computational demands of processing a large number of samples. The sampling rate must be
chosen to be at least twice that of the maximum frequency contained in the data (Nyquist rate) in
order to prevent aliasing. A sampling rate of 128 Hz is typically chosen in the literature as it is
capable of representing frequencies up to 64 Hz, thus the entire accepted range of EEG activity.
3.5.3. Artifact removal
Artifacts are undesirable potentials of non-neural origin that contaminate the underlying EEG
activity that one hopes to elucidate to offer control in a BCI system. The simplest approach to
dealing with artifacts is to discard EEG trials with an unacceptable level of artifact corruption. This
is commonly carried out for the collection of training data or for an offline investigation [44,73-
75]. For an online BCI implementation however, these artifacts must be dealt with without
eliminating any single trials or control attempts. Artifact removal as described in section 2.3.4,
involves the use of adaptive signal processing methods to identify, isolate and remove artifacts
from the EEG recorded activity on a single-trial basis. This all must be carried out without
corrupting the underlying EEG activity such as an event-related potential. As reviewed in section
2.3.4 there exist two main approaches to artifact removal:
• Filtering
• Higher-order statistical separation and elimination
The filtering method typically requires the recording of the artifact activity itself. It is typically
applied to EOG [25,76,77], EMG [78] and ECG [23] activity related artifacts. Regressive filtering
methods in the time [21,22] or frequency domain [23,24] can smear the EEG data or add additional
artifacts.
Higher-order statistical separation methods are often referred to as global techniques due
to the fact that they simultaneously use information from all available electrodes (typically >32
channels). This approach offers the most promising approach of removing artifacts from the EEG
recordings without corrupting valuable EEG data. The problem is analogous to the source

Chapter 3
44
localisation task common in digital signal processing. If we can determine the origins of the
components that make up the EEG recording (such as EOG originating from the eye) we can
remove ones that correspond to artifacts. This is a form of spatial filtering. It is often referred to as
the Blind Source Separation (BSS) challenge to identify and remove artifacts on a single-trial
basis, see [79] for a review of the statistical principles. Principal component analysis (PCA), a BSS
method, is used to decompose a multi-electrode EEG trial into linearly uncorrelated components,
and then reconstruction is performed by omitting unwanted artifact components such as EOG. The
unwanted components are either visually scored or automatically detected by correlation with
simultaneous artifact recordings. An example of PCA artifact removal on a single-trial is
demonstrated in Figure 3-3 and Figure 3-4. See [80] for a review of PCA for EEG artifact removal.
0 100 200 300 400 500 600-100
0
100
200
300
400VEOG
Figure 3-3: EEG single-trial recording from frontal electrode sites FP1, FP2 and F7 (left) and the simultaneous vertical EOG recording from the left eye (right). The y-axis in the plots represents magnitude in microvolts (µV) and the x-axis represents sample number (fs=512.82 Hz). It is clearly noticeable that the VEOG activity due to an eye blink has significantly corrupted the EEG recordings.
An extension of PCA is Independent Component Analysis (ICA) [81,82]. ICA
decomposes simultaneous recordings into linearly independent components (statistically more
distinctive components than simply uncorrelated). A justification of the ICA assumptions (linear
independence of sources hypothesis) for the application to EEG recorded signals is presented in

Chapter 3
45
[83]. Makeig, Jung et al. have successfully applied ICA to the removal of EOG, EMG and line
interference artifacts [25,28]. A quantitative comparison in [84] and [76] confirms the superiority
of ICA over PCA and regressive filtering methods. ICA is however impractical for online
implementation due to the computational demands of the iterative algorithm. For a review of ICA
and its possible applications to EEG the interested reader is referred to [85-88]. ICA is also
capable of extracting event related potentials (ERPs) or components from the background EEG
[26,89,90].
Figure 3-4: An example of the PCA artifact removal algorithm. The original single-trial from the FT8 electrode position and the post-artifact removal single-trial are depicted. The large peak due to an eye-blink can be seen to be effectively removed without corrupting the underlying EEG.
Artifact removal is a very computationally demanding processing stage. It forces most
BCI researchers to design experimental paradigms and extract features that will be resilient to most
artifacts. A large number of BCI groups do not implement an artifact removal stage in their
systems. It is critical that future BCI systems address this issue to facilitate real-life application
development. As can be seen in Figure 3-4, a simple eye blink, can dramatically corrupt the EEG.
0.1 0.2 0.3 0.4 0.5 0.6 0.7 0.8 0.9 1 1.1-80
-60
-40
-20
0
20
40
60
80
time [sec]
pote
ntia
l rel
ative
to re
fere
nce
[uV
]
Scalp location FT8
post-artifact removaloriginal

Chapter 3
46
3.5.4. Channel selection and dimension reduction
In any successful BCI application, the optimal recording sites associated with the command-
related EEG activity needs to be determined (e.g. P300 is dominant over the central vertex and
VEPs are dominant over the occipital lobe). Once the ideal locations have been determined and it
has been established that the command-related activity actually comes from brain generated
signals and not artifacts, the number of recording sites can be reduced to the minimum number
needed to extract the activity associated with the control attempt. A reduced number of channels
typically results in smaller feature vector dimensionality and hence reduced processing
requirements.
Traditionally EEG channel dimension reduction has been physiologically motivated,
selecting electrodes positioned near the interested region of cortical activity. Now other signal
processing techniques, such as principal component analysis (PCA), independent component
analysis (ICA), spatial pattern analysis and mutual information estimation, not only support the
physiological motivation but also go further to optimise the information contained within the
reduced channels by removing redundancy and noise. Spatial pattern analysis is able to estimate
the impact of the expected information from different electrodes and to weight this information
appropriately. This facilitates an optimal electrode set-up to be determined specific for each
subject and has been proven to yield optimal results compared with PCA [91]. The danger in
applying higher order statistical channel reduction techniques such as PCA/ICA to EEG is the
uncertainty of the accuracy and order of the components these algorithms may return.
3.5.5. Feature extraction
The goal in feature extraction is to characterise an object by a set of measurements whose values
are very similar for objects in the same category but very different for objects in different
categories [92]. For a BCI system one hopes to attribute features or values to EEG recordings that
are representative of a recently occurred control event. These features identify with some
characteristic that describes the EEG activity and maximally discriminates between the control
classes. A summary is performed in section 2.4 of the many EEG signal descriptors that can
characterise the type of EEG activity.
EEG events may be characterised in the time-domain such as is typical with the case of
Slow-Cortical Potentials (SCPs)15, P300 evoked potentials16, Movement-Related Potentials
15 Slow Cortical Potential (SCP) - is a slow voltage variation that occurs on time scales of 0.5 to 10 seconds (i.e. over low frequency
range 0.1 - 2 Hz) and is associated with movement and cortical activation. It can be self-regulated by a user in order to offer control
(operant conditioning BCI approach). It has been used by the Tübingen group in their so-called TTD [62-64,70]. An excellent review of
the origins and applications of SCPs is performed in [93].

Chapter 3
47
(MRPs)17, Visual Evoked Potentials (VEPs)18. Time domain feature extraction involves the
analysis of the morphology of the EEG waveform using descriptive parameters such as amplitude
etc. However due to the dominating presence of background EEG activity and the low SNR of the
desired command-related EEG pattern, time domain feature extraction has moved more towards
parametric modelling methods. This involves fitting a time-series to the EEG activity or its
components and the parameters that describe this curve can discriminate each command-related
activity.
Frequency domain features are more commonly used by BCI systems. Frequency domain
events such as mu and beta rhythm power variations are commonly exploited in BCI design. These
rhythms are related to cortical activity in the sensorimotor area. This can be stimulated or
controlled through the actual or imagination of limb movement. Most systems use the mental task
of left versus right hand motor imagery as the mental task to offer binary control in a BCI
[39,41,94,95,101,102].
Phase relationships or estimations of the synchronisation levels for a community of
neurons or a series of EEG channels propose an alternative source of information for EEG activity.
Event-related synchronization and event-related desynchronization (ERD/ERS) is an estimation of
the amplitude attenuation or enhancement of a certain EEG rhythm. It was first quantified by
Pfurtscheller and Aranibar for detecting command-related patterns in the mu and beta rhythms.
The ERD/ERS features are used in [49,103-106] to identify with EEG command-related activity
for the purposes of BCI design. Methods of calculating ERD/ERS is summarised in section 2.4.3
but for a more detailed insight the reader is referred to [48]. The information contained within
phase relationships of different EEG locations has not yet been explored to its full potential.
Features associated with the topographical variations of EEG activity offer significant
information regarding the origins of the dominant neural community that contributes mostly to the
recordings. Spatial filtering or spatial pattern analysis methods can be employed to improve the
16 P300 Evoked Potential – is a significant mid-central positive peak that occurs 300ms after an infrequent or significant stimulus
imbedded amidst a series of routine stimuli. It generates a different response to a desired randomly occurring stimulus compared with
non-target routine stimuli. It can thus be exploited to offer control. Donchin has successfully implemented a BCI system in [59] based
on the P300. 17 Movement-related Potential (MRP) – is an increasingly negative potential that occurs on the contra-lateral side of the motor cortex
area to the side of limb movement. The imagination of limb movement generates similar responses to actual movements and thus the
imagination of left versus right hand movement has been exploited by many BCI systems [38,40-44,46,94-96]. 18 Visual Evoked Potential (VEP) – is a potential generated in the occipital region in response to a changing visual stimulus. The
evoked activity displays properties that are characteristic of the type of visual stimulus. By directing one’s attention to stimuli of
different properties, one can use the VEP response to select a control in a BCI system. It was one of the first neuromechanisms
exploited in a BCI system [1,35,97]. Today, steady-state VEPs (SSVEPs) are heavily exploited in BCI systems using frequency based
features [98-100].

Chapter 3
48
time or frequency features to generate scalp maps. The Surface Laplacian (SL)19, Common Spatial
Patterns (CSPs) and Signal Space Projection (SSP) are common spatial filter methods that are
implemented to improve on the raw EEG to facilitate the extraction of better features [39-
44,75,80,107]. Through the use of these high-resolution algorithms the spatial resolution may be
reduced to around 2-3 cm compared with around 6-10cm for the raw EEG.
3.5.6. Feature selection
The feature selection process is an optional stage that prevents the accumulation of irrelevant
features to describe the EEG command-related activity. Too many overlapping features will cause
the classifier to have poor generalization, increase the computational complexity and require many
training samples to reach a given accuracy [108]. All features generated at the feature extraction
stage were used in the classification stages of research reported in this thesis. Through the use of
feature selection methods that choose an optimal subset of features, it is possible to dramatically
improve performance. Information theoretic approaches involving mutual information estimation
methods have proven to optimise the features selected as inputs to the classification stage but is
hindered by the computational overheads [109].
Genetic algorithms (GA) offer an alternative approach. A GA can be described as a
stochastic search and optimization technique based on evolutionary computation. They can be
divided into three main groups [108]: Embedded algorithms, where the selection is embedded
within the induction algorithm; Filter algorithms, where features are selected before passing them
to the classification stage; and wrapper algorithms, which performs feature selection in unison with
the classification algorithm. See [110] for a review of the above feature selection algorithms in
relation to the classification of Movement Related Potentials (MRPs). The use of a wrapper
method in conjunction with a non-linear support vector machine (SVM) classifier has been
successfully employed by the Tübingen group in a BCI system [111].
3.5.7. Classification
The role of the classification stage is to recognise patterns in training data to facilitate the online
translation of EEG features to controls. While important to system performance, the choice of the
classification method for the feature translation task is less crucial than the features themselves for
developing a robust BCI. The classification stage has three main criteria; accuracy, computational
efficiency and complexity. Ultimately the aim for a BCI classification stage is to ensure a high
accuracy, robust adaptability and transferability, and real-time implementation. A decision tree is 19 Surface Laplacian (SL) – is a second order spatial derivative of the scalp potential at each electrode that provides an estimation of
the local radial surface current flow through the skull [10]. It can be viewed as a spatial high pass filter as it removes the blurring effect
due to the volume conduction effects of the skull and cerebrospinal fluid.

Chapter 3
49
used in [73], a local neural network in [61], a Bayesian network in [1,60,112], a K-Nearest
Neighbour algorithm in [71,94,113,114], Linear Discriminant Analysis in [66] and threshold-
based methods in [35,36,67,97,100,103,105,115-117].
The two fundamental classifier choices include a systems analysis approach or a machine
learning approach. The traditional systems approach seeks to model the underlying biophysical
system whereas the machine-learning methods need not create a mechanistic model. Machine-
learning methods to classification may actually work well for an application without offering much
insight into the underlying system. Although an understanding of the underlying processes is
desirable, it is more important for the systems to function correctly. A review is performed in [118]
that compares linear and non-linear methods for a BCI classification stage. It states that when
control can be achieved with a linear classifier, then a non-linear classifier should not be used.
Linear Discriminant Analysis (LDA) is employed, unless stated otherwise, for the feature-
to-control translation or pattern recognition task in this thesis. LDA requires less training and
computation compared with neural network based classifiers but as a trade-off requires more
discriminatory feature vectors to distinguish successfully between the classes [119]. The uniform
application of a fixed classifier facilitated the comparison of feature extraction methods and an
exploration of different feature combinations to yield the optimum classification accuracy. LDA
consists of estimating k discriminant functions to construct k, n-space, hyper-planes that optimally
distinguish the k classes using n features.
In more explicit detail, consider a set of c classes Ck.. Given an input vector x of features,
we may formulate the classification problem in terms of a set of discriminant functions y1(x), y2(x),
…, yc(x) where an input vector x is assigned to class Ck if
kjxyxy jk ≠∀> )()( (1)
Therefore the class for which has the largest corresponding discriminant function is chosen. The
discriminant function may be derived in terms of Bayes’ theorem given by
)(
)()|()|(
xpCPCxp
xCP kkk = (2)
Bayes’ theorem relates the posterior probability to the product of the class conditional probability
and prior probability. The p(x) term serves as a normalisation so that the posterior probabilities
sum to unity. The usefulness of Bayes’ theorem stems from the fact that it is easier to calculate the
right hand side of equation 2 than the left hand side. The simplest discriminant function might be
)|()( xCPxy kk = and we may go further by omitting the normalising class independent

Chapter 3
50
probability and taking logs of the right hand side to get ))(ln()|(ln()( kkk CPCxpxy += . Next,
we assume a normal distribution for the class conditional densities, given in d dimensions as
−Σ−−
Σ= − )()(
21exp
)2(1)( 1
2/12/µµ
πxxxp T
d (3)
where the mean vector and covariance matrix are given respectively by )(xE=µ and
]))([( TxxE µµ −−=Σ . By assuming that covariance matrices are identical for all classes
Σ=Σ k , and dropping constant terms, we form the linear discriminant function
))(ln(21)( 11
kkTk
Tkk CPxxy +Σ−Σ= −− µµµ (4)
The feature vectors determined by the feature extraction stage are used as the inputs to the
classifier. An M-shuffle by N-fold cross-fold validation technique was employed to form an
unbiased estimate of an offline system performance.
3.5.8. Feedback
The basic concept of human feedback enables mankind to take account of their actions or
performance. How this feedback information is assimilated is entirely up to the person. Feedback
in a training environment either encourages the trainee to strive to do better or else give up and
quit. Through the use of feedback such as exam results, rankings and reports people have the
potential to improve on their performance.
It is similarly an important concept in BCI system design to ensure rapid human adaptation
and skill development with using the alternative communication medium. For BCIs based on the
Operant Conditioning approach, feedback training is essential for the user to acquire the control of
his or her EEG response and develop the skill of EEG self-regulation. BCIs based on the Pattern
Recognition approach do not explicitly require feedback training but it can speed up the learning
process and improve performance. Feedback is typically visual, although as will be shown later in
Chapter 5 a combination of audio-visual feedback can be used to captivate the user’s attention.
There are two methods of feedback that are utilized in most BCI systems, discrete and
continuous feedback. The choice is application dependent. Discrete feedback involves presenting
to the user the performance of a control attempt after the event has completed. For example, the
Graz BCI system [52,120,121] indicates to the user at the end of the trial the classified result
associated with the left versus right imagined hand movement. If the requested movement could be
correctly classified, a ‘+’ was shown. If the data of the current trial was identified to the other class

Chapter 3
51
than was requested, a ‘-’ was shown. Ambiguous results were shown as ‘o’. Discrete feedback
cannot directly affect the EEG activity as it does not occur during the acquisition windows.
Continuous feedback on the other hand is continuously presented to the user during the
acquisition of the command-related EEG activity. Cursor control is the most common form of
continuous feedback. It is used in a number of BCI systems mainly based on the Operant
Conditioning approach [63,64,68-70,122,123]. In BCIs using the Operant Conditioning approach
(see section 3.2.2), the feedback about the performance is essential to skill development, i.e. in
acquiring control over the EEG response. In the TTD device users are instructed to control the
cursor, up or down from the centre, by self-regulating their SCP. The trial ends when the user
moves the cursor (‘ball’) all the way to the side they desire. Figure 3-5 shows an example of the
feedback display used in the TTD device. The smiley face and ‘very good’ remark offers the user
positive reinforcement for the achievement of correctly moving the cursor to the target side. This is
an important aspect to feedback whereby if the user feels a sense of achievement or being
rewarded for their attempt, the training progress can be improved. Continuous feedback can
directly impact the EEG generation process. If the user is succeeding or failing at a task, the
continuous feedback can encourage or discourage and thus modify the continually recorded brain
activity. It is not possible with the current BCI systems to offer ‘true’ continuous feedback due to
inherent classification delays. A finite sample of EEG data needs to be analyzed and classified
before the feedback can be presented to the screen. For example, the Wadsworth BCI [68] boasts
one of the shortest EEG sample windows of 200 ms. Therefore the cursor movement is not
actually continuous but instead jumps.
Figure 3-5: The feedback display used in the TTD. The user is presented with a smiley face as positive reinforcement after successfully moving the cursor to the target side of the screen.
Graded feedback can also be incorporated in the discrete or continuous case whereby the
user is presented with how well the classifier recognizes the control attempt. It is directly
proportional to how distinguishable the command-related features are and thus an indication of
how ‘well’ the mental task is being performed.

Chapter 3
52
The effects of feedback cannot be directly monitored. It is clear that it is an important
aspect to the Operant Conditioning approach of BCI design to facilitate learning self-regulation of
EEG activity. Very little research has been reported on the long-term effects of biofeedback.
McFarland et al. documented the possible beneficial and harmful effects of cursor feedback in
relation to the Wadsworth BCI [124] as follows.
Beneficial effects Harmful effects
Improves performance by allowing rapid reaction to wrong classifications
Furnishes continual motivation
Ensures attention to the task by maintaining the subject's interest
The feedback stimulus might prevent concentration on internal state
The visual feedback stimulus might affect the alpha rhythm
The correct classifications might lead to anticipation and thus affect the EEG response (for example, cause EEG synchronization)
The false classifications can elicit frustration and thus affect the EEG response (for example, cause EEG desynchronization)
The training of the human and BCI system interaction, jointly referred to as the man-
machine learning dilemma, is a mutual process. Vaughan et al. define in [125] that BCI operation
depends on effective interaction between two adaptive controllers, the user who encodes his or her
commands in the neurophysiological input provided to the BCI, and the BCI that recognizes the
commands contained in the input and expresses them as device control. Pfurtscheller and Neuper
address this issue in [38] and stress that the human being is as important as the BCI system to the
successful performance.
3.6. BCI systems: State of the art
To date there exist over 45 BCI research groups worldwide. United by the same goal of developing
a new alternative communication and control technology for the motor-impaired, they have
explored many different approaches with varying success rates. Apart from the review of different
BCI methodologies discussed earlier in this chapter, it would be too lengthy and cumbersome to
discuss in detail the many different approaches taken by different research groups around the
world. The following table presents a review of some of the key systems implemented and the
methodologies employed by the research group.

Chapter 3
53
Research
Group Year
Neuro-
Mechanism Input
Feature Extraction
Technique Feature Translation
Vidal [1] 1977
Single-Trial VEP evoked
by a strobed checkerboard
determining the direction
of eye-gaze
EEG over occipital
cortex
Wiener filtering of the time locked input
signal followed by a step-wise
discriminant procedure to reduce feature
vector dimensionality
Bayesian Classifier with outlier rejection
Sutter [35,97] 1984
Steady-state VEPs
(SSVEPs) evoked by
alternating symbols on
computer screen
EEG over occipital
cortex
The feature vector (FV) was the single-
trial, time-domain signal time locked to
the VEP stimulus
The time-domain signal was correlated
with templates related to 6 possible
responses. A state was selected when one
of the time-averaged correlation values
exceeded a threshold
Farwell &
Donchin
[59,117]
1988 P300, evoked by flashing
symbols on computer
screen
EEG at Pz
referenced to linked
mastoids
36 feature vectors were produced, one for
each cell of the 6x6 menu on the Control
Display. When a row of the menu was
flashed, a 600ms time-locked window of
the input signal was added to all the
feature vectors corresponding to cells in
that row. Similarly for columns
The feature vectors representing signal
averages were continually ranked and
either a correlation/threshold was used to
select a cell, or the highest ranked cell was
selected after a fixed length of time
Keirn &
Aunon
[60,112]
1990
Differences in lateralized
spectral power levels
related to various
cognitive mental tasks
such as imagined cube
rotation
EEG over parietal
and occipital lobes
Three feature vectors were generated
using three methods: two spectral power
estimation methods (FFT and AR spectral
estimation) followed by band-pass
filtering in four frequency bands; and a
method that used AR coefficients of
signals in four frequency bands
Bayesian quadratic classification of power
or AR coefficient features
Wolpaw et
al. [66] 1991 Active control of mu
rhythm power
EEG from a bipolar
link anterior and
posterior to C3
The feature vector (FV) was produced by
calculating the EEG power spectrum
(FFT) with 3Hz resolution. Power value
centred at 9 Hz was used as amplitude of
mu rhythm
Linear discrimination of mu rhythm
power with heuristic thresholds into 5
levels.
Pfurtscheller
[114] 1993
Active control of mu
event-related
desynchronization (ERD)
EEG recorded over
sensorimotor cortex
The FV was generated by filtering the
input signal to 8-12Hz. Then the result
was squared as an estimate of
instantaneous power. Five consecutive
power estimates of mu power related to
ERD were bundled into a 5-D FV
One-nearest neighbour (1-NN)
classification, using reference vectors
selected with a learning vector
quantization (LVQ) method
Wolpaw et
al. [67] 1994
Active control of
distributed mu rhythm
power
EEG across
sensorimotor cortex
using bipolar
electrodes at FC3-
CP3 and FC4-CP4
The FV was generated for each of the two
EEG channels. The square root of signal
power in a 5Hz (or 4Hz) band centred at
10 Hz (or 12 Hz) was calculated for both
inputs. The mu rhythm signal power was
estimated for both inputs using a FFT.
The sum of the power level features was
mapped (using an adaptive linear
transform) to vertical movement and the
difference of power level features was
mapped to horizontal movement.
Pfurtscheller
[113] 1994
Active control of spectral
power of several
frequency bands related to
finger, toe and tongue
movement
EEG over
sensorimotor cortex
The FV was generated by calculating
spectral power of several frequency bands.
The instantaneous signal power was
estimated from the input signals using
four, narrow band-pass filters (between 8-
40Hz). Eight consecutive power estimates
(1/4 second) were bundled into an 8-D FV
One-nearest neighbour (1-NN)
classification, using reference vectors
selected with LVQ
McMillan &
Calhoun
[115]
1995 Magnitude of the steady-
state VEP evoked by
13.25Hz strobe light
EEG from bipolar
electrode between
O1 and O2
The FV was generated by band pass
filtering the bipolar EEG (centred on
13.25 Hz), followed by signal
amplification and power level estimation
Linear discrimination with two heuristic
thresholds for dwell time period. Feature
values were mapped to three states based
on the thresholds

Chapter 3
54
Pfurtscheller
[94] 1997
Active control of the
alpha and beta rhythm
power related to imagined
hand movements
EEG over
sensorimotor cortex
The FV was generated by estimating
signal power from two user-specific signal
inputs and two user specific frequency
bands. These estimates were calculated
four times over a period of 1 second. The
16 power features (within each second)
were bundled into a 16-dimensional
feature vector
One-nearest neighbour (1-NN)
classification, using reference vectors
selected with LVQ
Middendorf
et al. [36] 2000
Self-regulation of an
SSVEP and also the
response to multiple
stimuli.
Differential EEG
between O1 and O2
and grounded at the
left mastoid
Relative amplitude, phase and a
combination of both at O1 and O2 create
the FV for the self regulation task. The
magnitude of the centre frequencies
associated with the stimuli above a
threshold were used in the multiple stimuli
task
Individual threshold and amplitude ratio
criteria were determined for each operator
by a calibration process.
Penny et al.
[61] 2000
Single-trial, imagined
movement related
potentials (MRPs)
Two 11-electrode
arrays over the left
and right
sensorimotor
cortex.
AR features
The AR features are classified using a
logistic regression model trained using the
Bayesian evidence framework
Birbaumer et
al. [62-64] 2000 Slow cortical potentials
(SCP)
EEG over frontal
cortex
The FV represented the amplitude of SCP
waveform averaged over sliding window
Linear classification with heuristic
threshold
Kennedy et
al. [126] 2000 Active control of neural
group firing rate
Two electrodes
implanted within
hand area of
primary motor
cortex
The FV represented the neural group
firing rate extracted from both signal
sources
Increases in neuronal firing rate resulted
in increases in output level. Decreases
resulted in a zero output.
Mason &
Birch [71] 2000
Single-trial, imagined
movement related
potentials (MRPs)
EEG over SMA and
primary motor
cortex
The FV was calculated from windowed 1-
4Hz EEG (over 1/8 second periods) using
a custom spatiotemporal transform
One-nearest neighbour (1-NN)
classification, using reference vectors
selected with LVQ
Cheng et al.
[100,116] 2002
Multiple stimuli attention
selection SSVEP
paradigm
EEG from O1 and
O2 electrodes
The FV consisted of the spectral
magnitude at the stimuli frequencies and
their first harmonic.
A threshold based classifier was
employed. The threshold for detection
was twice the mean value of the amplitude
spectrum between 4 and 35 Hz.
Graimann et
al, [103,105] 2003
Active control of single
trial imagined movement
related oscillatory activity
(ERD/ERS)
EEG from 34
electrodes
predominantly over
the sensorimotor
cortex
ICA was performed on all channels to
remove artifacts and increase SNR.
ERD/ERS maps spanning 6-36Hz were
calculated for all ICs. ICs with prominent
ERD/ERS activity were selected for wave
packet analysis for feature extraction. The
selection and combination of the most
important features for detecting oscillatory
activity was done by a genetic algorithm
(GA)
Threshold based detector of the 1-D GA
transformed FV.

Chapter 3
55
3.6.1. Categorisation
Previously in this chapter, BCIs were divided into those using the Pattern Recognition approach
and those using the Operant Conditioning approach. However, BCIs can be categorized in a
number of ways depending on various different BCI aspects or methodologies employed. This sub-
section aims to highlight a number of ways to describe or characterize a BCI system while at the
same time identifying and explaining the various options.
1) Invasive or non-invasive: As highlighted in section 2.1.1, electrical currents produced by
synchronized synaptic currents within the brain can be measured by (list by order of
increasing invasiveness) scalp recorded EEG, using epidural electrodes, and using
intracortical electrodes known as electrocorticography (ECoG). Scalp recorded EEG based
BCIs are most common because they are non-invasive and cheap. Intracortical electrodes
achieve higher spatial resolution at the expense of spatial coverage and significant increase
in cost and risk. Single neuron cortical activity has been successfully applied in BCI
systems [103,105,126-128]. Aside from the practical issues such as cost, invasiveness and
comfort, the choice of invasive versus non-invasive recordings depends on the volume of
cortical tissue producing useful information, the ability of the intracortical electrode to
locate the appropriate tissue masses, and on the ability of the scalp EEG to produce stable,
robust, intentional signals that can be controlled by the user.
2) Online or offline: The fundamental aspect to a BCI is that it can be implemented in real-
time to facilitate actual direct user control. Offline systems are for theoretical simulations
of an actual BCI system to facilitate exploratory investigations of the BCI components.
This makes it possible to examine, for example, different electrode positions, pre-
processing and feature extraction methods, classifiers etc. Offline systems quote a
predicted or simulated accuracy by employing unbiased methods for separating training
and test data, for example cross-fold validation. The performance can be comparable with
a similarly implemented online BCI without feedback provided that all the recorded EEG
data is used, i.e. no EEG data is rejected containing EOG or EMG artifacts. As most
training data during an offline investigation has rejected artifact corrupted trials, the
performance could be very different to an actual online real-life implementation where
artifacts and EEG inter-trial variability could cause significant feature outliers that would
result in poor control classifications. Online systems require the signal processing
components of the BCI framework to be done in real-time. Real-time implemented
systems make it possible to provide feedback to the user. As feedback is such an integral

Chapter 3
56
part of a BCI framework, particularly for the operant conditioning approach, online
systems are the only true indicator of a BCI performance.
3) Synchronous or asynchronous: As discussed above in section 3.3, a cued and an un-cued
approach to BCI design exists.
4) Universal or individual: Universal BCIs assume that by gathering EEG data from
multiple users it is possible to find features and a classification function that will be valid
in general for every user. In individual BCI design, the system is tailored to the individual
and the fact that no two individuals are the same both physiologically and psychologically.
Adaptive systems such as the Adaptive Brain Interface project [129,130] boast the
adaptability of the system to user, time and psychological variations. A universal BCI
design that is too general will have poor performance.
5) Independent or dependent: Dependent BCIs rely on upon ocular activity to generate a
specific EEG pattern, i.e. a visual evoked potential (VEP) associated with the direction of
visual attention [35,97,98,100,131]. If a person has the use of their eye muscles, there exist
a number of eye-tracking or eye-blinking based methods of communication that offer
better performance than BCI systems. Independent BCIs do not require any muscular
intervention of any kind to generate the command-related EEG activity. This approach is
more closely linked to the definition of a BCI system set out in [58].
6) Paradigm: BCIs can be categorized according to what kind of imagery or mental tasks the
users are required to perform in order to generate the command-related EEG activity. This
choice is closely linked with the type of brain activity or neuromechanism that the BCI
designer wishes to exploit. Motor imagery is one of the most common methods of EEG
elicitation that has been used in many BCIs [38,45,46,94,96,101,132]. It is used to
generate sensorimotor activity. Mental tasks such as arithmetic or spatial relations have
also been used [61,122]. Visual related tasks have been heavily exploited in the area of
P300 and VEP elucidation [98-100,133,134]. BCIs based on the Operant Conditioning
approach may leave the choice of imagery or mental strategy up to the user [62-
64,70,123].
7) EEG Neuromechanism Input: The most common method of categorizing a BCI is based
on the mechanism exploited to generate the characteristic and distinguishable brain
activity for the BCI input. These include: SCPs, µ or ß rhythms, P300, MRP, VEPs and the
firing rate of a single cortical neuron. The systems listed in Table 3-1 are real-time
implemented systems that are described in peer-reviewed articles. The subjects of these
systems controlled a device and immediately witnessed the results of the control selection.

Chapter 3
57
Table 3-1: A summary of implemented BCI systems by various researchers and grouped according to the neuromechanism or characteristic EEG activity that was employed.
Neuromechanism Input BCI Researchers Year Ref.
Visual Evoked Potentials
Vidal JJ. Sutter EE. Middendorf M, McMillan G, Calhoun G, Jones KS. Cheng M, Gao X, Gao S, Xu D.
1977 1984 2000 2002
[1] [35,97] [36,135] [100,116]
Slow Cortical Potentials
Elbert T, Rockstroh B, Lutzenberger W, Birbaumer N. Birbaumer N, Birbaumer N, Kübler A, Ghanayim N, Hinterberger T,
Perelmouter J, Kaiser J, Iverson I, Kochoubey B, Neumann N, Flor H.
1980 1999 2000
[136,137] [62,64]
[63]
P300 Evoked Potentials
Farwell LA, Donchin E. Donchin E, Spencer KM, Wijesinghe R.
1998 2000
[117] [59]
Sensorimotor related activity
Wolpaw JR, McFarland DJ, Neat GW, Forneris CA. Pfurtscheller G, Flotzinger D, Kalcher J. McFarland DJ, Lefkowicz AT, Wolpaw JR. Guger C, Schlogl A, Walterspacher D, Pfurtscheller G. Wolpaw JR, McFarland DJ, Vaughan TM Pfurtscheller G, Neuper N, Guger C, Harkam W, Ramoser H,
Schlogl A, Obermaier B, Pregenzer M. Kostov A. and Polak M. Penny WD, Roberts SJ, Curran EA, Stokes MJ.
1991 1993 1997 1999 2000 2000
2000 2000
[66] [114] [138] [139] [68] [121]
[123] [61]
Single cortical neuron activity
Kennedy PR. and Bakay RA. Kennedy PR, Bakay RA, Moore MM, Adams K, Goldwaithe J.
1998 2000
[128] [126]
8) Translation Algorithms: The signal processing methodologies for feature
extraction and classification that facilitate the translation of characteristic EEG activity
into a control decision are important in BCI design. The many different signal processing
algorithms allow further categorization of BCI systems and reflect the BCI designers
approach.
9) Biofeedback: The employment of direct audio or visual biofeedback has a significant
psychological effect on the user. The simultaneously (continuous feedback) or
subsequently (discrete feedback) recorded EEG activity reflects this effect. The use or lack
of biofeedback can distinguish the BCI system approach. As discussed earlier, feedback is
an important aspect to the successful adaptation and development of the user’s interaction
with a BCI system.
10) Intended application: The type of application and the target users can further categorize
the type of BCI system. Most applications are targeted at the severely disabled as an
augmentative control and communication device. The applications can vary from spelling
programs, limited phrase generators, simple environmental condition controllers etc.

Chapter 3
58
3.6.2. Principal BCI research groups
In June 2002, the Second International Meeting of Brain-Computer Interfaces was held in
Rensselaerville, NY. Organised by the Wadsworth Center of the New York State Department of
Health, the meeting drew ninety-two researchers representing 38 different BCI research groups
from the US, Canada, Europe and China. Appendix A lists some of the BCI research groups from
around the globe, almost all of which attended this meeting. The most significant groups on the list
are highlighted in bold and will be referred to repeatedly in this chapter. These are summarised in
Table 3-2. In recent years, the Alberta group has scaled down their interest in BCI research since
the death of their principal researcher, Alexandar Kostov. The Tübingen, Graz and Wadsworth
groups are significantly better funded, staffed and experienced in the field of BCI research
compared with any of the other institutions and generate many more peer-reviewed articles as a
consequence.
Table 3-2: A summary of the principal BCI research groups and their approach
Research
laboratory
Group director
and principal
researchers
BCI
name Ref
OC
/
PR
Summary of main BCI approach
Alberta M. Polak - [123,1
40] PR
Scalp EEG (C3, C4, P3, P4), online, synchronous, independent, cursor
movement paradigm with self-chosen mental strategy, sensorimotor EEG
input, 4th order AR features, adaptive logic network (ALN) classifier,
continuous feedback (cursor), 2-D cursor control application, classifier
output every 50 ms
FIRST K-R Müller, B.
Blankertz
Berlin-
BCI
(BBCI)
[74,14
1,142] PR
Scalp EEG (over primary motor cortex), offline, synchronous, self-paced
voluntary finger movements, predict the laterality of upcoming finger
movement to offer control, spatio-temporal feature extraction based on hit /
no-hit MRP feature, regularized Fisher Discriminant classification, no
feedback, applications targeted at able bodied population, output every 1-2
seconds (equivalent to a momentary-on two-position switch). Classification
accuracy of 85% with FP < 2%. 6-15 bits/min transfer rate.
Graz
G. Pfurtscheller,
C. Neuper, A.
Schlögl, B.
Graimann, G.
Müller
Graz-BCI [52,12
0,121] PR
Scalp EEG (29 channels), online, synchronous, independent, detection of
ERD / ERS patterns of the mu and beta rhythms during motor imagery,
imagination of left, right and foot movement initiated by auditory and visual
stimulus, logarithm of the band power in 4s window for 5 bands (7-10, 10-
13, 16-20, 20-24 Hz), one-nearest neighbour (1-NN) classification, discrete
feedback after trial, environment control application, classifier output after
8 s trial. The channel capacities ranged from 0.42-0.81bits/trial.

Chapter 3
59
Oxford S. Roberts, W.
Penny -
[61,12
2] PR
Bipolar scalp EEG (C3 and C4), online, synchronous, independent, motor
imagery vs. math task for an up-down cursor movement, 8th order AR
model of 1/3 second segments, Bayes logistic classifiers with latent-space
smoothing and a classification reject option, continuous feedback, 1-D
cursor control application, classifier output every 1/12 second (83 ms).
Accuracy of 86 % (hard rejection) and 54% for no latent space smoothing
or rejection classification.
Neil Squire
F.
G. Birch, S.
Mason, Z.
Bozorgzadeh LF-ASD
[102,1
43,144
]
PR
Scalp EEG (6 bipolar linkages, F1-FC1, Fz-FCz, F2-FC2, FC1-C1, FCz-Cz,
and FC2-C2), online, asynchronous, low-frequency asynchronous switch,
self-paced imagined left-right hand movement, spatio-temporal features
from the bipolar channels filtered below 4 Hz, LVQ3 implemented to select
optimum features, one-nearest neighbour (1-NN) classification, discrete
feedback showing switch state, environment control and game application,
output every 1/16th second (equivalent to a momentary-on two-position
switch). Movement attempts every 4 s. Classification accuracy of >94 %
Tsinghua G. Shangkai, G.
Xiaorong, M.
Cheng -
[43,10
0,116] PR
Scalp EEG (O1 & O2), online, asynchronous, dependent, virtual button
selective attention paradigm, SSVEP based EEG input, frequency power
feature, threshold-based classifier, discrete biofeedback, phone dialler
application. Average transfer rate across 13 subjects was 27.15 bits/min. No
training required.
Tübingen N. Birbaumer, A.
Kübler TTD [63,64] OC
Scalp EEG (Cz), online, asynchronous, independent, self-regulation of
SCPs, magnitude of the SCP, user-chosen mental strategy to control up-
down cursor movement, threshold based classifier, continuous feedback,
language support (spelling) application, classifier output every 63 ms, trial
length 4.5 s. Transfer rate of a letter every two mins. Extensive training
required.
Wadsworth J. Wolpaw, T.
Vaughan Wadswort
h - BCI [68,69] OC
Scalp EEG (64 channels), online, asynchronous, independent, self-
regulation of the µ (8 -12 Hz) and ß (13-28 Hz) rhythms, topographical,
spectral and temporal features of µ and ß rhythm from a linear translation of
200ms segments from several (1-4) EEG channels (mainly an AR power
spectral estimate in the bands), initially motor imagery (hand movements) is
used as the mental task to control up-down movement, Threshold based
classifier, continuous feedback, 1- and 2-D cursor control application,
classifier output every 100 ms. Classification accuracy of >95 % and bit
rates of 20-25 bits/min. Demanding training requirements.
3.6.3. Performance metrics
The BCI state-of-the-art review above lacks a comparative analysis of performance. Unfortunately,
comparisons are extremely difficult to make due to the many different approaches and applications
of the implemented systems. The most important metrics for success in BCI system design
reported in the literature are accuracy and speed. These are however unfortunately interdependent
and result in inevitable trade-offs. For most applications targeted at the completely disabled,
accuracy is often prioritised over speed and user-friendliness.

Chapter 3
60
The methods of reporting accuracy in the literature has included correct classification
rates20, confusion matrices21, hit rates22 and rejection rates23. Even the presentation of these results
can be misleading due to some systems rejection of trials due to artifacts or uncertain
classifications. The system methodologies, such as artifact rejection or offline simulation, need to
be explicitly stated alongside accuracy measures because they are closely linked. They can
dramatically alter classification performance and produce misleading results. Information transfer
rate or bit-rate is one of the most appropriate measures to compare the signal output of different
BCIs in terms of speed and accuracy. This standard communication measure offers the amount of
information communicated per unit time. However, other measures may be more suitable when
comparing how efficiently an application takes advantage of the user’s bandwidth. For example, a
typing application with predictive word completion can be compared using the metric of words per
minute.
Performance measures are predominantly focused on information transfer capabilities at
this premature stage of BCI development. As BCI technology evolves and the bit rates are boosted,
there will be a much wider range of general performance metrics for a BCI system. These may
include for example the following;
1) Channel dimensionality
2) Bit rate of data transfer (channel capacity) – determined by accuracy and speed
3) Degree of bidirectional control (feedback)
4) Short- and long-term reliability
5) Cost effectiveness
6) User-friendliness (comfort, portability, ease-of-use)
7) Training requirements
8) Staff and service requirements (required assistance)
One of the most important yet subjective performance metrics involves a measure of the
quality-of-life improvement for the user. The target population’s lack of conventional
20 Correct classification rate – is the percentage of correct classifications 21 Confusion matrices – presents not only the correct classification rates of each class but also in which classes the false classifications
were classified 22 Hit rate – indicates how many times a user succeeds in hitting a target. Typically used in the operant conditioning approach where a
certain number of steps are required to reach a target (e.g. move a cursor). It is a poor indicator of performance. 23 Rejection rate – indicates the percentage of trials that result in uncertain classifications and are subsequently rejected. It is typically
used in conjunction with a correct classification rate.

Chapter 3
61
communication ability makes it initially difficult to quantify this metric but perhaps in the future,
this will be the ultimate performance metric.
There is much talk in the literature for a standardised framework to facilitate the direct
performance comparison of BCI systems and their individual components [72]. The development
of benchmarks would be extremely valuable, enhancing the BCI research community’s ability to
objectively compare BCI technologies. It is important however not to hinder potential innovative
approaches to BCI design by imposing a model framework or prototype on the research
community.
3.7. Summary
This chapter began by introducing the concept and purpose of BCI technology. It
highlighted the various different components, design methodologies and approaches behind a BCI
implementation before performing a state of the art review of work in the field. Particular attention
was focused on the principal BCI research groups and the work they are involved in. Sections
3.6.1 and 3.6.3 present methods of categorising and evaluating the performance of BCI systems
In summary, a current BCI system can provide for locked-in subjects the ability to
communicate at transfer rates of up to 25 bits/min that facilitate the following applications;
1) Answer simple questions (yes or no answer every 2-3 s)
2) Control the environment (e.g. television remote, lights, heating, call for assistance)
3) Perform slow word processing (By incorporating predictive text, 25 bits/min can
translate to 2 words/min on average)
4) Operate a neuroprosthesis (Hand grasp as demonstrated by [57,65,70]
This chapter has concluded without examining the future potential of EEG based BCIs and
the issues that need to be addressed by the research community to move from demonstrations to
actual marketable applications. The next two chapters present two very different BCI approaches
and potential applications. Each chapter has a self-contained discussion of the BCI system and it’s
potential. The final chapter of this thesis will predominantly focus the future prospects of EEG-
based BCI technologies for the disabled and the wider population.

Chapter 4
62
Chapter 4 Study 1: MRP based BCI system
This study was inspired by the BCI competition 200324 [141,142,145,146] in which the author took
part. The BCI competition was organised by a number of BCI researchers and their respective
research groups such as Niels Birbaumer (Tübingen)25, Jonathan R. Wolpaw (Albany)26, Gert
Pfurtscheller and Alois Schlögl (Graz)27, Klaus-Robert Müller and Benjamin Blankertz (Berlin)28,
and Gabriel Curio (Berlin)29. Each group proposed their own datasets which focused on various
BCI neuromechanisms such as the self-regulation of slow-cortical potentials (SCPs), self-
regulation of mu- and/or central beta-rhythm, P300 speller paradigm, motor imagery and self-
paced finger pressing, as reviewed in chapter three. Each data set consisted of a number of single-
trials of spontaneous EEG activity, one part labelled (training data) and another part unlabeled (test
data). The goal was to correctly label the test data by using a classifier developed by from training
data that maximizes the performance measure for the true test labels. Applicants got to choose the
dataset and subsequent experimental paradigm with which to work on and submit their results.
Due to the ease with which we could replicate the experimental paradigm and thus acquire
additional data, the author chose to work on the self-paced typing paradigm data from the
Fraunhofer-FIRST group. The dataset consisted of 316 training and 100 test trials recorded from
28 EEG channels according to the 10-20 placement standard. Each trial was a half second in
duration that ended 130 ms prior to the key press. The training trials were labelled 0 for left and 1
for right. These labels had to be successfully inferred for the unknown 100 test trials by employing
feature extraction and pattern classifications methods on any number of the electrode channels.
Due to the offline nature of this competition, one had the opportunity to run lengthy simulations to
recursively train a classifier to converge at the test labels. It was the hope of the author to
implement a BCI system based in real-time and thus it was deemed futile to explore inefficient
signal processing methods to label the test data.
24 BCI Competition 2003 - http://ida.first.fraunhofer.de/~blanker/competition/ 25 University of Tübingen, Institute of Medical Psychology and Behavioral Neurobiology - http://www.medizin.uni-
tuebingen.de/institute/med_psych_inst/index.html 26 Wadsworth Center, NYS Department of Health - http://www.wadsworth.org/ 27 Department of Medical Informatics, Institute for Biomedical Engineering, Graz University of Technology - http://www-dpmi.tu-
graz.ac.at/ 28 Fraunhofer-FIRST, Intelligent Data Analysis Group - http://ida.first.fhg.de/ 29 Freie Universität Berlin, Department of Neurology, Neurophysics Group - http://nroweb.ukbf.fu-berlin.de/Neuro

Chapter 4
63
This chapter will firstly present the aim of this study and then the origins and properties of
movement related potentials (MRPs) that are exploited as the input mechanism. A brief overview
is then presented of the BCI framework that could incorporate such a neuro-control mechanism. In
section 4.4 the methodology behind decoding the neurological signals and translating them into a
control signal is discussed. The next section provides a summary of the results associated with the
channel selection, feature extraction and classification stages of this study. The chapter concludes
with a discussion, which apart from reviewing the study discusses the future work possibilities to
extend this BCI framework to the imagined limb movement paradigm that can facilitate its use for
individuals with neuromuscular disabilities.
4.1. Aim
The aim of this study was to classify upcoming left/right self-paced voluntary finger movement
from single trial EEG epochs time-locked to key-pressing events. The BCI competition was used
as an initial milestone to achieve an insight into the practicalities of this aim. From the competition
data, the goal was to predict the laterality of upcoming finger movements (left vs. right hand)
solely from EEG trials a half second in duration that ends 130 ms before the key press and
recorded from 28 electrodes.
The objective was to not only submit a satisfactory entry to the competition but also to
replicate the experiments within the laboratory in UCD to investigate various aspects to EEG
acquisition and signal processing for the purposes of BCI implementation. By recording our own
data, we could experiment with various trial lengths and even attempt to asynchronously
distinguish left/right finger movements from continuous EEG recordings as opposed to the time-
locked trials. The project was fundamentally inspired by the desire to offer a basic means of
communication and control for people who suffer from neuromuscular disorders.
4.2. Introduction
The earliest efforts to record and explore MRPs were performed by Bates [147] in the early 1950’s
using a cathode-ray tube (CRT) and photographic plates. He did not however find any potential
variations prior to movement due to the short time constant of the superposition method he
employed. It was not until the mid 1960’s that Kornhuber and Deecke [148,149] extensively
investigated MRPs and discovered the existence of pre-movement potential variations. This
inspired further investigations into the origins of the neurological command signals that govern the
desire and execution of limb movement. It gave rise to the big question: Can we predict movement
before movement onset?

Chapter 4
64
Deecke, Kornhuber et al. [150] characterised the MRP into a number of components,
particularly for the pre-motor movement potential variations. The entire MRP is conventionally
regarded to consist of three parts as shown in Figure 4-1; the Bereitschaftspotential (BP) [149], the
motor potential (MP) (motor cortex potential (MCP) as defined by [151]) and the post-movement
activity (PMA).
1) Deecke et al. defined the BP, or ‘readiness potential’ as a slowly ‘rising’30 negative
potential that occurs 1-2 seconds prior to volitional self-initiated movements. It is related
to the preparatory process prior to limb movement.
2) The MP consists of an initial sharp negative deflection that follows the BP’s more gradual
negativity. It is related to motor activity. At movement onset (at t=0 as shown Figure 4-1),
there exists a sharp positive inflection that peaks at around 200ms after the movement
onset. Cerutti et al. [151] believed this P200 to be a positive potential evoked by the visual
stimulation that prompted movement. The paradigm employed here however was self-
paced movement within a darkened room. Papakostopoulos et al. [152] considered it
however as an index of somatosensory reafferent activity coming from the skin, joints and
muscle receptors. While this is plausible it is yet unsubstantiated. This period is typically
contaminated with EMG artifacts.
3) The PMA is the potential change ~200ms after the movement onset whereby the brain
resynchronises and resumes ‘normal’ activity.
Figure 4-1 presents an averaged MRP template typical to such experiments [153-157] that
illustrates these distinguishable periods in the MRP. A review of MRPs from a psycho-
physiological viewpoint is performed in [158] to offer an insight into the brain’s response to the
desire and execution of limb movement.
For the purposes of this study, i.e. to establish the laterality of finger movements from
time-locked EEG epochs prior to movement, the rest of this chapter focuses on the BP component
of the MRP. As defined in [150], the BP consists of an early component (BP1) that lasts from the
very beginning of the BP (starting 1-2s or more prior to movement onset depending on the
complexity of the movement) to approximately 0.5s before movement onset and the late
component (BP2) occurs for the last half second before onset (see Figure 4-1). BP2 has a steeper
negative slope than BP1 as can be seen in Figure 4-1. For unilateral movement, BP1 is not
lateralised about the motor cortex while BP2 is larger (more negative) over the contralateral
30 Clinical Electroencephalographers use a reversed axis polarity convention. This resulted from the fact that increased negative signals
picked up on the surface of the scalp is as a result of increased cortical activation in that area (i.e. increased activity in that part of the
brain ).

Chapter 4
65
hemisphere. This is evident in Figure 4-1 for the last ~200 ms prior to finger press at time t=0. The
electrode C4 is positioned on the right side of the head and for the left finger movement as shown
exhibits a more negative potential on average than the contra-laterally placed C3 electrode. This
supports the fundamental EEG theory that potential negativity can be related to activity of the
cortical areas whereas positivity is related to inactivity [159]. Since the limbs of the human body
are controlled by the contralateral side of the brain it stands to reason that there should be more
activity and hence ‘negativity’ on the contralateral side.
-1 -0.5 0 0.5 1
-1
-0.5
0
0.5
1
Grand Average for Vol-L (918 Events) Paradigm - v
Rel
. Pot
entia
l (µV
)
time (s)
34
BP (BP2) MP PMABP (BP1)
Figure 4-1: An example of an averaged MRP recorded for 918 left finger movement trials (onset at t=0) at C3 (channel 3, blue) and C4 (channel 4, green). The main components of a MRP as highlighted by [151,153,160] are indicated. The difference between C3 and C4 in the BP2 will be addressed later in the chapter
The BP1 principal generator is the mesial prefrontal cortex including the supplementary
motor area (SMA) and probably also the cingulate motor area (CMA), while the BP2 principal
generator is the primary motor cortex (MI, precentral gyrus or ‘motor strip’) [160]. The reader is
referred to [160-162] for a greater insight into the physiological dynamics within the motor region
in response to the desire to perform movement and during the actual execution itself. In summary,
the time-domain characteristics of the MRP prior to movement (more specifically the BP) as
identified by Deecke et al. [163-165] are as follows:

Chapter 4
66
a pronounced contralateral negativity over the precentral and parietal areas starting about 500 to
200ms prior to movement
a small positive deflection beginning around 90ms prior to movement
a smaller negative potential starting about 50ms prior to movement over the primary motor cortex
It is the first brain pattern characteristic that will be exploited later in the attempt of classifying a
left or right finger movement.
In terms of characteristic frequency domain activity, there also exist some notable features
associated with the MRP. Oscillatory activity in the brain occurs when populations of neurons
form complex networks involving feedback loops. Sensory stimulation, motor behaviour, and
mental imagery can change the functional connectivity within the cortex that results in an
amplitude suppression [Event Related Desynchronization (ERD)] or an amplitude enhancement
[Event Related Synchronization (ERS)] of the mu (10-12Hz) and central beta rhythm (15-20Hz)
[38,46,166]. Pfurtscheller et al. found that the mu band exhibits an ERD starting 2.5s before index
finger movement onset at the contralateral central (C) area and whose magnitude increases steadily
right up to movement initiation and then subsequently decreases. Also an ERS in the 36-40Hz
section of the gamma band was seen at the same location. Like the BP, the ERD is more
pronounced on the contralateral sensorimotor area. Given this phenomenon, other potential
features for characterizing left versus right finger movement could include the power in these
frequency bands (mu and beta) and how they change in time over the trial. To this end, short-time
spectral density estimates will be reviewed later in section 4.4.5 as a feature extraction method.
4.2.1. Elucidation of MRP on single-trial basis
The difficulty in the analysis of event-related potentials (ERPs) is that they are hidden
amidst unrelated background EEG activity, regarded as neuronal noise. The magnitude of an ERP,
specifically an MRP, is of the order of 1µV compared with 10-50µV for the background EEG
activity. This results in a highly undesirable negative signal-to-noise ratio (SNR). Visual evoked
potentials (VEPs) are characterized by a typical SNR of around 0dB. However, MRPs among other
ERP types, may have a lower SNR ranging from -10dB to -30dB. There exist numerous methods
in the literature that attempt to improve the SNR and elucidate the underlying ERP for detection
[151,153,155,167-170]. Typically ensemble averaging of repetitively performed trials time-locked
to the stimulus (movement onset in this case) is employed as an estimate of the ERP. This assumes
that the background EEG activity behaves as additive white noise which averages out during
synchronised averaging to expose the persistent ERP. This approximation to a true ERP offers no
phasic information. It provides however a useful knowledge of the ‘mean’ properties of ERPs
[171] based on the well known hypothesis of signal and noise additive superposition and

Chapter 4
67
uncorrelation, provided that the signal is stationary and the noise has zero mean. A common
challenge in ERP studies involves methods of improving the single-trial SNR to better highlight
the characteristic EEG activity associated with the event-related brain function. The absence of a
reference signal for the ERP increases the difficulty of evaluating performances of any kind of
method designed to improve the single-trial SNR: the results could be comparable among
themselves, or even with an ensemble averaged template, but not with the ‘true’ single-trial ERPs,
that are, in fact, unknown [172]. Approaches based on averaging are unable to account for the
variability among trials associated with ERPs. An interesting review of the methods for single-trial
analysis is presented in [173]. Parametric modeling methods will be reviewed in section 4.4.5
where we attempt to extract the MRP from the recorded EEG activity on a single-trial basis in
order to attribute features that will identify left or right hand finger movement.
4.3. Overview of the system
This section highlights the experimental environment and processing stages utilised in this study to
investigate the possibility of predicting upcoming finger movements from EEG scalp-recorded
signals. For investigation and exploratory purposes, this system was performed offline. Figure 4-2
presents an overview of the system developed in this study.
FeatureExtraction
Time & Freq
DetrendingBaseline activity
D/A
Acquisition
Offline BCI Simulation
C3
C4
Amplifierand filters
ComputerStorage
SegmentationTime-locked Epochs
LDAClassificationN-fold Cross-validation
Can wepredict
upcomingfinger
movements?Triggers
Figure 4-2: Overview of offline MRP based BCI system using self-paced voluntary finger movements
4.4. Methodology
This section describes the methods to facilitate the characterisation of voluntary finger movement
laterality. The procedural steps, from acquiring the EEG data to processing the recorded signals,
are presented.

Chapter 4
68
4.4.1. Experimental protocol
The self-paced left/right typing exercise paradigm was employed to attempt to classify
voluntary finger movement from single-trial EEG epochs. Each subject was seated upright on a
firm chair in a shielded room with their arms resting on a table and their fingers resting in the
standard typing position over the home keys of a keyboard (see Figure 4-3). The subject was then
asked to press a left or right home key with their index finger (see Figure 4-4) in a self-chosen
order, inter-trial duration (>2 secs) and frequency. The subject was asked not to move or blink
throughout the exercise in order to minimise motion, electromyograhic (EMG) and
electrooculographic (EOG) activity artifacts. No visual or auditory feedback was given to the
subject.
Nine right-handed healthy subjects, all male, aged between 22 and 27 years with no
reported history of neurological disorders or nervous system abnormalities, took part in the
experiment in order to acquire data first-hand in addition to the competition and other data. Each
session lasted about 10 minutes with all subjects performing a second session after a break of
approximately five minutes. A total of 180 minutes of data was collected with key presses
occurring on average every 3-4 seconds, resulting in a total of approximately 2500 left/right trials
with equiprobable occurrence.
The EEG was acquired in a shielded room from two Ag-AgCl scalp electrodes placed at
C3 and C4 (see Figure 4-5), according to the 10-20 International electrode-positioning standard
[174], situated on the scalp above the left and right primary motor cortex respectively. Skin-
electrode junction impedances were maintained below 5kΩ. The vertical EOG was recorded from
the left eye to aid in blink artifact removal (see Figure 4-6). Each channel, referenced to the right
Figure 4-3: Sitting position of subject with arms comfortably resting on a table.
Figure 4-4: Hands resting over the home keys. Subjects were asked to press one of the home keys at a time on either side with their respective index fingers.
Figure 4-5: Measuring of the C3 and C4 electrode positions according to the 10-20 standard.

Chapter 4
69
ear lobe on bipolar leads, was amplified (20K), 50Hz line filtered and band-pass filtered over the
range 0.01-100Hz by Grass Telefactor P511 rack amplifiers. The key presses were recorded as two
additional channels to allow the continuous EEG recordings to be segmented into left and right
fixed length time-locked epochs. All signals were digitised at a sampling frequency of 512Hz
4.4.2. Pre-processing
The data was low-pass filtered up to 50Hz and then down-sampled to 128Hz to generate a lower
resolution version of the original data. The continuous EEG recordings were broken up into
left/right trial epochs of 1500ms length, ending 130ms before the keystroke, thus avoiding EMG
contamination that could later masquerade as control signals. The BP inspired the selection of this
fixed length time-window. Each trial was de-trended by removing the mean baseline activity,
during a period of relative motor inactivity in the brain (assumed > 1.4 sec preceding the onset of
movement). The mean of a 0.5s window, 2s prior to the press was subtracted from each trial. For
each subject, an ERP template was generated, specific to each channel and event, by ensemble
averaging over all the subjects’ relevant trials.
4.4.3. Electrode selection
This section applies to the Fraunhofer FIRST [141] data that consisted of 28 channels based on the
32 channel 10-20 electrode-positioning standard [174]. Electrode placement or selection is the
most basic form of optimising the neurological information (spatial filtering). It is important to
assess which electrodes carry significant information and which do not. To some extent each
electrode, assuming good contact, carries information about the underlying brain activity.
However, a trade-off exists between using an increased number of channels to improve the
resolution of the underlying neuronal signal and introducing redundancy due to the volumetric
smearing effect. Too many channels will result in increased feature vector dimensionality yielding
the typical problem of classifying vectors in a high dimensional space. Increased computation and
poor classification due to the additional noise and redundant information will result. Therefore it is
preferable to determine which electrodes carry most information in a feature extraction strategy.
A cross-correlation method was employed as a simple technique to investigate how each
channel varied from a left and right trial on average in the hope to yield channels with maximal
difference between left and right finger press. The background EEG is assumed to be white noise
whose autocorrelation is ideally zero. A cross-correlation between any two single-trials for any
two electrodes would expect to yield a value close to zero due to the predominance of the neuronal
noise in single-trial recordings. The contributions of background EEG activity are assumed to have
an even effect on each channel across a large number of trials. It was envisaged that the average of
the cross-correlation values across a large number of trials would elucidate the channels that differ

Chapter 4
70
more on average above the common noise variations, thus highlighting the optimum channels to
distinguish between Erg’s resulting from left and right presses respectively.
The method consisted of cross-correlating each trial from a given channel with each trial
from a contralateral press for the same channel and then averaging over all left (J) and right trials
(K), see equations 5 and 6. The )(xΘ value is an overall indication of how dissimilar an
electrodes' ERP is for left and right movement and hence will be suggestive of the optimum
electrode positions for feature extraction. The results in Table 4-1 clearly indicate the optimum
channels for finger movement correspond to the electrode positions above the primary motor
cortex thus confirming the widely accepted physiological fact as proven explicitly by Crone et al.
[175] and his countless predecessors. Note that the contra-laterally placed electrodes have similar
results and those sites such as the frontal and occipital lobes distinguish little between left/right
motor movements as expected.
∑∑= =
=ΘJ
l
K
r RL
LR
xrxlxrlC
JKx
0 0 ),(),(),,(1)(
σσ (5)
∑∑ −=N
n
N
k
xb
xaAB knBnA
NxbaC ][][1),,( (6)
trial-single a oflength smaple theindicates:lyrespective lsright tria andleft theofindex theindicates:,
lyrespectivemovement right andleft for is trial that theindicates:,lyrespective lsright tria andleft ofnumber total theis:,
trial-single ingcorrespond theof channel electrode therepresents: electrodefor (L)movement left afor trial-single ofdeviation standard:),(
trialsall across channel electrodefor t coefficienn correlatio average theis :)( where
NrlRLKJ
xxlxl
xx
LσΘ
Electrode )(xΘ
C1 0.03197 C2 0.03301
FC6 0.03311 C6 0.03327
FC4 0.03358 C3 0.03427
CP5 0.03428 C5 0.03443 C4 0.03481

Chapter 4
71
M M
F1 0.05314 F2 0.0734 Fz 0.09187
Table 4-1: Results of cross-correlative comparison for Left/Right press Vs electrode position. The closer the value is to the one the more similar the ERP is for a left and right for the electrode position.
4.4.4. Artifact rejection
An automatic threshold-based rejection of trials was employed in this study for the purposes of
simplicity and to ensure ideal training data. Vertical EOG (vEOG) was recorded from the left eye
to aid in the artifact identification and rejection (see Figure 4-6). Initially, the threshold was
empirically decided by visually scoring the rejected trials to ensure its effectiveness. On average,
less than 8% of subjects’ left/right trials were rejected resulting in around 200 out of the 2500 trials
recorded being rejected.
Figure 4-6: Vertical EOG (vEOG) recording performed on the left eye to aid in artifact identification and rejection.
Every trial has to be accounted for and cannot be rejected for an online implementation of
such a BCI system. The author anticipates further investigation into an efficient and effective
artifact removal technique as summarised in section 3.5.3 in order to develop a robust real-time
version of this BCI system.
4.4.5. Feature extraction
The goal of this section is to extract features which represent the brain activity associated with
upcoming left or right volitional movement and can maximally distinguish between the two brain
states. This task is at the kernel to the development of a robust BCI. Feature extraction was the
most time demanding stage in this study for this reason. It involved the exploration and
investigation into many time and frequency representations of the single-trial EEG to facilitate the
extraction of pertinent features without the influence of the neuronal noise or inter-trial variability.
It was chosen to fix the classifier to facilitate comparison of the feature extraction methods. To this

Chapter 4
72
end, an LDA classifier with 20 shuffles by 10-fold cross-validation was uniformly applied
throughout this study as will be discussed in section 4.4.6.
The underlying time-course characteristic that we wish to elicit in this experiment is an
event-related potential known as the Bereitschaftspotential (BP) [19] : a gradually rising negative
potential occurring about 1000ms preceding the onset of movement largely localised around the
sensorimotor area. Figure 4-7 illustrates the grand ensemble averages across all subjects for C3
and C4 recordings during left and right finger flexions. A very noticeable contralateral negativity
occurring 500 ms before the onset of movement at time 0=t is noticeable across all subjects.
Figure 4-7: Ensemble averaged trials for Left and Right finger presses for electrode positions C3 and C4. The underlying ERP, the Bereitschaftspotential, is seen as expected with the more negative potential on the contralateral side. The BP1 and BP2 components of the BP are also noticeable.
The physiological occurrence of ERD/ERS is recognised in the frequency domain by
power variations in the mu and beta bands preceding the onset of motor movement [48]. Figure
4-8 illustrates the average of PSD estimates of trials across all subjects for C3 and C4 recordings
during left and right finger flexions. There is a distinguishable decrease in power (ERD) in the mu
band on the contralateral side 300ms prior to finger press (t=0).

Chapter 4
73
4.4.5.1. Parametric modeling
Parametric modeling is a technique whereby a mathematical model is optimally fitted to a time
series. It involves trading off parameter dimensionality and computational efficiency with the
accuracy of the model (precision of the representation). EEG signals are non-stationary, i.e. its
statistical characteristics such as frequency spectrum, vary with time. EEG recordings can however
be assumed to be locally stationary over a short time period. This is a prerequisite for satisfactory
modeling. Mc Ewen et al. [176] showed that 80-90% of EEG segments of duration 4-5 seconds
can be modelled as being Gaussian, and wide-sense stationary. EEG segments of length 1-2 secs
are presumed to be stationary in the literature. Autoregressive (AR) and AR with exogenous input
(ARX) are two parametric modelling methods which will be presented in this section.
Autoregressive models attempt to fit a polynomial based on previous samples to optimally
predict the next sample in the time-course as will be explained later. The coefficients of the
polynomial that best fit the time-course can then be used as features to distinguish one time-series
from another. AR models are a very common method for the evaluation of the spectra of short data
segments due to the improved resolution. The fact that it is all-pole filter means it can represent
sharp peaks in the frequency domain. It offers the advantage that the spectrum can be estimated
based on Maximum entropy (MESE) [177].
For the model identification, the parametric modelling parameters have to be identified.
There exist several methods in the literature for estimation of the parameters in various stationary
and adaptive modeling approaches. These include the Yule-Walker, Burg [178] and the least-
mean-squares (LMS) [179] method for AR models. Methods like the recursive-least-squares (RLS)
Figure 4-8: Grand ensemble average of STFT Time-Frequency PSD plots for electrodes C3 (top) and C4 (bottom) during left and right finger movement (left and right side respectively). The time window is 500ms prior to press (x-axis) over an extended mu frequency band (9-13Hz).
Left Presses Right Presses

Chapter 4
74
[177,180] are used for Adaptive AR (AAR) models. AAR models tend to offer better results
compared with segmentation methods [169,181,182].
AR
ERPs are usually concealed in the ongoing background EEG as explained above in section 4.2.1.
The approach of using an Auto-Regressive (AR) model to emulate the background EEG activity
for ERP elicitation is well known, see [167,183] for a review, and has been successfully applied in
BCI systems [61,184]. This all-pole modelling technique lends itself well to producing the
dominant frequencies occurring in the EEG [61]. The AR model can be intuitively rephrased in the
frequency domain as a white noise source driving a spectral shaping network )(1 zA− .
A-1 (z)n(t) y(t)
Figure 4-9: AR model
)()()1()(ˆ 1 tentatyaty an +−−−−−= K (7)
where e(t) is the noise and ia are the coefficients of the an order model. In the ideal case, )(tn is
a purely random (white noise) process with zero mean and variance 2nσ . )(tn is uncorrelated with
the signal, and the cross-covariance * ktt NY −Ε is zero for every k.
ARX
ARX modeling has been used in event-related potential identification and SNR improvement by
Lange et al. [153,155,185-187], Cerutti [151] and Liberati [188-190] amongst others. Less widely
explored is the novel approach of using ARX model filter coefficients as features in a
classification strategy. Unlike most of these other papers that are dedicated to the development of
the methodologies of parametric single-trial information (or ERP) enhancement, parametric
modeling is used here to extract features that can identify with the hidden ERP to distinguish a left
and right trial.
ARX, an extension of AR modelling, involves the introduction of an exogenous input
assumed to be a contributory signal to the overall signal being modelled. Its pole-zero filtered
contribution and the AR noise estimate combine to form the forward prediction estimate of the
overall recorded EEG signal. Using an AR Moving Average (ARMA) as the Exogenous input has
proved to better model the underlying event-related potential amidst the background EEG offering
improved classification rates [92,191]. It makes the distinction between the ERP and background

Chapter 4
75
neuronal activity contributing to the single trial EEG recording. Cerrutti et al. have successfully
applied ARX modelling for filtering the continuous EEG in order to extract the underlying ERP.
However in this study the ARX filter coefficients are used as input features to characterise the
single-trial EEG. The ARX method of modeling both the signal (underlying Bereitschaftspotential)
and the noise (background EEG) is more physiologically reasonable than modelling the noise
alone as ongoing EEG contributions from neighbouring neural populations contribute mostly to the
background noise [19]. Ensemble averaging over a large number of trials exposes the underlying
event-related potential (BP) that is hidden amidst background EEG by averaging out this random
neuronal noise [19]. These ensemble average templates, specific to each channel and event, form
the input to an ARMA model. Assuming a common denominator for the ARMA and AR filter
results in the ARX model as illustrated in Figure 4-10.
The EEG activity in this experimental paradigm can be expressed by means of the
following equation (assuming a linear relationship):
Tttatntsty ≤≤++= 0)()()()( (8)
where: )(ty is the scalp recorded EEG response prior to the onset of movement, )(ts is the useful
signal corresponding to the event-related Bereitschaftspotential attained by ensemble averaging
across preceding trials [19], )(tn is the background EEG and )(ta is the component generated by
a combination of all possible artifacts. T is the duration of each fixed length trial epoch
(T=1500ms, 130ms prior to finger press). For our purposes with the subjects asked to remain still
and employing our threshold based rejection of EOG corrupted trials it is assumed in our model
that 0)( →ta .
Alternatively, the ARX model can be extended for artifact filtering by introducing
additional noise modelling stages to filter the acquired signal )(ty , resulting in increased
exogenous inputs. This method was employed successfully by Filligoi et al. [22] to satisfactorily
filter out blink and eye movement artifacts (BEMA) by feeding in an EOG channel as an input.
A-1 (z)
n(t)
y(t)+B(z)s(t)
Figure 4-10: ARX model structure
The basic ARX model, in terms of the shift operator q, and assuming a sampling interval of one
unit, is as follows

Chapter 4
76
)()()()()( tntsqBtyqA += (9)
The prediction is written as
)(
)(...)(
)(...)1()(ˆ
1
1
te
nktsbktsb
ntyatyaty
bn
an
b
a
+
−−++−+
−−−−−=
(10)
where na and nb are the model orders and k is the delay. Defining θ as the vector of model
parameters we can write the mean square prediction error as
∑=
=N
tte
NE
1
2 ),(1)( θθ (11)
where N is the number of samples and ),(ˆ)(),( θθ tytyte −= is the forward prediction error. To
fit the model to the data )(ty over a period t=1,…,N we choose θ such that it minimises )(θE in
equation 11 resulting in a least squares error minimisation problem producing the Yule-Walker
equations, which can be solved straightforwardly as reviewed in [167] . The single trial ERP
estimate, )(ˆ ts , can be interpreted as the BP template, )(ts , filtered by )(/)( zAzB [151]. Choice
of the model orders is an optimisation task but Akaike's Final Prediction Error (FPE) criterion
[192] can be used as a guide. The FPE penalizes higher order models and is given by
)(11)( θθ E
nnNnnNFPE
ba
ba
−−−+++
= (12)
where nb =0 for the case of a simple AR model. The filter coefficients that minimise the error then
form the feature vector. The filtered template, the models’ estimate of the single trial ERP
contributing to the EEG recording, is compared to left and right templates for the corresponding
channel to generate two cost functions per channel as additional parameters in the feature vector.
The cost function is a simple mean square error comparison as follows:
[ ]∑=
−=N
n
yx
yx
yx nsns
NMSE
1
2)()(ˆ1 (13)
where x represents the electrode channel (i.e. either C3 or C4) and y represents the event (i.e.
either left or right L, R). Thus for a left movement we would expect the LCMSE 3 and L
CMSE 4 to
have a low value while the RCMSE 3 and R
CMSE 4 to have a high value and vice versa.
Coefficients of the AR and ARX models are used as features in the classification. For the
ARX case, we define four template signals: an ensemble average of ERPs for a left movement
from C3 and C4 and similarly for a right movement. This generates four sets of ARX coefficients
for classification per trial. This feature extraction technique is impractical for a large number of

Chapter 4
77
electrodes due to the resultant large feature vector dimensionality and resulting computational
demands.
4.4.5.2. Time-frequency analysis
Preparation and planning of self-paced hand movement results in a short-lasting desynchronization
(ERD) of rolandic mu (10-12 Hz) and central beta rhythms (14-20Hz) on the contralateral side to
the movement beginning around 600ms prior to the press [38]. It is this frequency domain
characteristic we hope to extract features from in order to distinguish between left and right
movement at the classification stage.
Firstly the time-locked epochs are selected over the range 630ms to 130ms prior to the
press and are Hanning windowed to preserve the frequency characteristics from smearing when
taking short sample windows. The FFT was then taken over the epoch to provide an estimate of
power over the frequency range. The power estimates in the mu and beta bands are then extracted
and used as features.
Performing a Short-time Fourier Transform (STFT) or time-frequency analysis was an
obvious extension of this approach that permits an insight into the ERD by analysing the power
variation with respect to time. The difficulty with identifying time-frequency features is the
inherent trade-off between the time and frequency resolution.
“The more accurately we try to determine the spectrum as a function of time, the less accurately we determine it as a function of frequency, and vice-versa.”….[193]
It is impossible to achieve a high degree of resolution in both the time and frequency domain of the
short EEG segments and thus the domain of the feature that maximally identifies with the left or
right trial must be prioritised. Due to the short epochs utilised in this system, the resolution in
either domain was severely compromised. However, to ensure consistency from one trial to the
next and to prevent over training the classifier we do not wish to have a high level of resolution in
either domain. The STFT was estimated at 250ms windows in time with a 33% overlap. This
limited the lowest detectable frequency to 4Hz. The frequency resolution was optimally chosen as
1Hz trading off classifier generality and overtraining. Using the mu and beta bands resulted in a
feature vector with dimension 42 (7 frequency bins per band for 3 time windows). ERD/ERS can
be recognised better using a large selection of electrodes localized above the sensorimotor cortex.
Using simply C3 and C4 over short epochs would limit the derivation of distinguishable frequency
domain features. This will be later seen in the results section.

Chapter 4
78
4.4.6. Classification
Linear Discriminant Analysis (LDA) is employed for the feature vector classification task in this
study. LDA requires less training and computation compared with neural network based classifiers
but as a trade-off requires more discriminatory feature vectors to distinguish successfully between
the classes [119]. LDA consists of estimating k discriminant functions to construct k, n-space,
hyper-planes that optimally distinguish the k classes using n features. Optimisation of the model is
achieved through direct calculation and is extremely fast relative to other neural network based
models. It is very efficient thus making a real-time implementation possible.
When implementing a classifier it is important to be able to estimate the expected
performance of the classifier on data not used in training. To this end, the available data is divided
into independent training and testing sets. There exist a number of schemes for achieving this such
as the Jack-Knife method [119] which involves the exclusion of a small subset of data for testing
on the classifier trained with the rest of the data. The most suitable approach that optimises the use
of all available data while at the same time maintaining an unbiased estimate is n-fold cross-
validation [194]. This scheme randomly divides the available data into n approximately equal
sized, mutually exclusive “folds”. For an n-fold cross validation run, n classifiers are trained with a
different fold used each time as the testing set, while the other n-1 folds are used for the training
data. The choice of n influences the ratio of data used for training/testing with an optimal value of
n in the range 5-20. Cross validation estimates are generally pessimistically biased, as training is
performed using a sub-sample of the available data. The randomising process was “stratified” so
that all the folds contained the same relative proportions of both classes (lefts and rights). Studies
have shown that stratification of the folds decreases both the bias and the variance of the
performance estimate. Cross validation is highly variable and depends on the division of the data
into folds. A decrease in the variance of the performance estimate may be achieved by averaging
results from multiple runs of cross validation where a different random split of the training data
into folds is used for each run.
In the results section of this study, unless stated otherwise, the reported classification
accuracy is the percentage of total cases correctly classified repeated and averaged across M-
shuffles for an N-fold cross-validation and then finally averaged across all subjects.

Chapter 4
79
4.5. Results
This section presents the experimental findings associated with this study. The results will be
briefly introduced but will be discussed in greater detail in the ensuing discussion section.
In order to ensure an unbiased and reasonable estimate of classification accuracy based on
training data, a N-fold cross-validation procedure was employed [119]. The data consisting of
feature vectors compiled from the feature extraction stage is first randomly shuffled and
subsequently stratified (evenly divided based on class) into N distinct segments. N-1 segments are
used to train an LDA classifier and the remaining segment is used as the test set. This process is
repeated for each N possible sets and the mean test set accuracy is computed. Finally, the complete
process is repeated M times with a new random shuffle to yield a mean accuracy. All the data was
uniformly processed with N=10 and M=20. In the following sub-sections the results for various
feature extraction techniques are reviewed.
4.5.1. Parametric modeling
AR
Before blindly applying the well documented AR approach to single-trial EEG modelling, the
author wished to get an intuitive feel for how the model performed and changed relative to any
system changes, i.e. model order and input. The first step was to visually see how well the model
performed by filtering white noise using the estimated model parameters. It was found that the
frequency spectrum of the model output was consistently very similar to that of the single-trial
being modelled whereas it differed slightly in the time domain. The initial few white noise samples
would determine the initial shape of the time-domain waveform. To get a better time-domain
representation, an Adaptive AR (AAR) approach would have to be taken but at the cost of the
dimensionality dramatically increasing.
Figure 4-11 shows plots which demonstrate how the percentage of unexplained output
variance changes with respect to the model order. This is an indication of how well the model is
capable of representing the original signal which, in this case, is an EEG single-trial. Notably the
plot on the right, representing the modelling of a particular trial with no filtering, is a better fit
(lower percentage) as the model order is increased. The opposite is the case for the downsampled
and filtered trial on the left. The best fit is represented in red which occurs at model order 5 for the
filtered version and 40 for the original single-trial. Trading off computation and model accuracy,
the optimum model order range to represent the single-trial is in the range 6-12.

Chapter 4
80
Figure 4-11: Plot of an AR model fit versus the number of parameter’s for the downsampled and filtered version of the data (fs=100Hz, LPF fc=40Hz) (left) and the original high-resolution data (fs=1000Hz). Note the greater percentage of unexplained output variance for the filtered signal.
The next step was to investigate how well these estimated parameters could distinguish between
two different single-trials, i.e. for left and right trials, based on the number of model parameters
utilised. Table 4-2 shows the classification accuracy averaged across all subjects versus model
order for various parameter estimation methods.
Table 4-2: AR feature extraction classification accuracy averaged across subject 1 versus model orders for various parameter estimation methods.
Parameter Estimation
Method Least-Squares Forward-
Backward Yule-Walker Burg
Model Order
Session 1
Session 2
Session 1
Session 2
Session 1
Session 2
Session 1
Session 2
6 54.16 51.54 60.16 47.73 60.46 46.89 60.08 48.90
8 54.31 48.24 60.54 49.84 60.92 52.27 60.84 49.91
10 58.77 51.91 60.31 49.83 58.31 49.49 59.92 47.39
12 56.62 50.84 58.08 50.42 56.92 49.33 57.10 50.58
The Yule-Walker offered the best classification accuracies of 61% and 53% for the first and
second session respectively using a model order of 8. Notably, the second session has
approximately a 10% less classification accuracy compared with the first session across the model
order range of interest (6-12). Also, the methods consistently have their optimum accuracies for
both sessions at the same model order. Table 4-3 shows the variation of accuracy versus model
order for a wider range using the Yule-Walker method.

Chapter 4
81
Table 4-3: AR feature extraction classification accuracy for subject 1 versus model orders for the Yule-Walker AR parameter estimation method. The parameters were used as the features and classified using 20 shuffle by 10-fold cross validation. Note: 50% represents an equiprobable occurrence.
Model Order Session 1 Session 2 2 50.38 40.42 4 49.84 44.11 6 60.46 46.89 8 60.92 52.27
10 58.31 49.49 12 56.92 49.33 14 56.69 51.78 16 54.23 52.94 18 55.07 53.69 20 52.76 53.61 22 53 53.19 24 56.76 53.27 26 56.07 52.60 28 54.61 49.66 30 53 53.10
Table 4-4 presents the overall classification accuracy for the AR feature extraction strategy across
all 10 subjects for both sessions. This is then depicted in Figure 4-12. Classification by chance is
represented by a 50% accuracy. The performance accuracy for most subjects is close to this
indicating that the AR method is poor at predicting upcoming left or right volitional movements. A
pure guess would offer the same chances of accurate classification.
Table 4-4: Classification accuracy across 10 subjects using the AR feature extraction method with a chosen model order of na=7
Session 1 2 Subject % %
1 60.92 52.27 2 44 48.3 3 51.847 56.111 4 50.602 49.167 5 47.969 52.063 6 42.292 55.614 7 56.319 55.952 8 56.075 44.563 9 53.864 47.48
10 41.779 52.711 Average 51.3667 51.4231

Chapter 4
82
AR Accuracy across all subjects
40
45
50
55
60
65
1 2 3 4 5 6 7 8 9 10
Subject number
% A
ccur
acy
Session 1Session 2
Figure 4-12: Plot of classification accuracy for each subject using the AR feature extraction method. Note that a random event is 50%

Chapter 4
83
ARX
Figure 4-13 presents an example of the input and output signals for the modelling of a random left
trial (see Figure 4-10 for explanation). This demonstrates how the ARX model estimates the
underlying ERP amidst the neuronal noise in any given single-trial. The estimated ERP or BP is
produced by the filtered contribution of the ensemble averaged template. As can be seen, the
estimate closely resembles the averaged template. In this case the averaged template and single-
trial input happen to be for left finger movement. The BP estimate tends not to be similar to the
template when using opposite movement related single-trials and templates.
0 200 400 600 800-4
-2
0
2BP Averaged template
0 200 400 600 800-4
-2
0
2BP Estimate
0 200 400 600 800-20
0
20
40sample white noise signal
0 200 400 600 800-40
-20
0
20Background EEG noise Estimate
0 200 400 600 800-20
0
20ST EEG trial
0 200 400 600 800-40
-20
0
20ST Estimate
0 200 400 600 800-20
0
20
40Diff of ST Estimate
0 200 400 600 800-2
-1
0
1Diff of BP Estimate
Figure 4-13: Representation of inputs and outputs of ARX modelling for a specific left trial
An important part of ARX modelling, similar to AR, is the estimation of the model
parameters. Many simulations are required to analyse the variation of classification accuracy with
respect to the many possible system criteria. These include model orders for the ARMA and AR
filter stages, the exogenous input used in the model and the parameter estimation method. Table
4-5 presents the ARX model orders versus the classification for a single subject. The Yule-Walker
method was employed to estimate the parameters and the exogenous input was an ensemble
average of all that subjects appropriately suited trials (i.e. same electrode location and movement)
)(ts )(ˆ ts
)(tn )(ˆ)(ˆ tsty −
)(ty )(ˆ ty
yy ˆ− )(ˆ)( tsts −

Chapter 4
84
except for the current trial being modelled. The optimum accuracy is 66.8% which occurs for the
model orders na=4 and nb = 4.
Table 4-6 presents the overall classification accuracy for the ARX feature extraction
strategy across all 10 subjects for both sessions. In addition, all trials from both sessions were
merged in order to see how the number of trials used to generate the input template would affect
the accuracy. The performance is also depicted in Figure 4-14. The average classification accuracy
across all subjects is approximately 60%. This indicates that the ARX method offers a bias for the
accurate prediction of left versus right finger movement and thus is a superior method than the AR
approach.
Table 4-5: ARX model orders versus the classification accuracy for subject 1. The optimum accuracy occurs for model orders na=4 and nb=4 as highlighted.
na \ nb 2 3 4 5 6 7 8 2 52.895 55.752 53.722 59.737 60.391 55.827 54.398 3 63.571 60.338 63.293 58.835 62.023 55.977 61.444 4 56.429 62.594 66.805 58.985 61.248 58.083 58.158 5 62.444 62.068 55.188 63.82 63.519 57.932 62.466 6 55.15 59.286 52.88 57.857 56.504 58.383 56.429 7 59.361 53.947 52.729 55.677 52.444 54.774 57.331 8 57.932 57.03 51.09 57.481 53.496 54.248 54.098
Table 4-6: Classification accuracy across 10 subjects using the ARX feature extraction method with an optimally chosen model order of na=4 and nb=4
Session 1 2 Merged Subject % % %
1 68.053 58.917 67.119 2 62.556 54.921 63.082 3 56.481 48.078 63.465 4 59.118 54.917 57 5 68.088 67.735 68.023 6 53.162 54.193 52.61 7 59.715 63.207 61.202 8 58.296 62.421 58.256 9 55.188 62.214 52.128 10 59.785 59.611 58.429
Average 60.0442 58.6214 60.1314

Chapter 4
85
ARX accuracy across all subjects
40
45
50
55
60
65
70
1 2 3 4 5 6 7 8 9 10
Subject number
% A
ccur
acy
Session 1Session 2Merged
Figure 4-14: Plot of classification accuracy for each subject using the ARX feature extraction method. Note that a random event is 50%
4.5.2. Time-frequency feature extraction
Figure 4-15 shows the grand averaged (for all subjects and trials) power spectrum estimate over
the range 6-30 Hz for the 500 ms time window prior to finger press. As can be seen, there is no
striking frequency characteristics to identify with either a left or right press. Figure 4-16 shows the
grand ensemble averaged Bereitschaftspotential for left versus right finger movements for
electrode positions C3 and C4 filtered over the frequency range of interest (2-25 Hz) for the 500ms
preceding movement onset. There is a distinctive difference in the time-domain between the two
possible states. Figure 4-17 shows the grand ensemble averaged short time power spectral density
(STPSD) plots for left and right trials for C3 and C4 electrode positions over the range 0-25Hz for
the 500ms preceding movement onset. The sliding time window for the STPSD was 125 ms with
25% overlap. For the finger movement paradigm it is expected to observe a decrease in power
(ERD) within the mu rhythm of the contralateral sensorimotor area. This is evident in Figure 4-18.
Table 4-7 presents the classification accuracy for the STFT time-frequency feature
extraction method that attempts to exploit the power differences between the contralateral and
ipsilateral side of the sensorimotor area in the mu and central beta band during left/right finger
movement.

Chapter 4
86
Figure 4-15: Grand ensemble averaged frequency spectrum power for left trials (left) and right trials (right) for C3 (blue) and C4 (green) electrode positions filtered over the range 6-30Hz for the 500ms preceding movement onset
-0.45 -0.4 -0.35 -0.3 -0.25 -0.2 -0.15 -0.1 -0.05 0
-30
-25
-20
-15
-10
Grand Average for Vol-L (922 Events) Paradigm - v
Rel
. Pot
entia
l (µV
)
t ime (s)
34
-0.45 -0.4 -0.35 -0.3 -0.25 -0.2 -0.15 -0.1 -0.05 0
-35
-30
-25
-20
-15
-10
-5
Grand Average for Vol-R (918 Events) Paradigm - v
Rel
. Pot
entia
l (µV
)
time (s)
34
Figure 4-16: Grand ensemble averaged ERP for left trials (left) and right trials (right) for C3 (blue) and C4 (green) electrode positions filtered over the range 2-25Hz for the 500ms preceding movement onset
Figure 4-17: Grand ensemble averaged short time power spectral density (STPSD) plots for left and right trials (respectively located) for C3 (top) and C4 (bottom) electrode positions over the range 0-25Hz for the 500ms preceding movement onset. The time window for the STPSD was 125 ms with 25% overlap
Left Presses Right Presses
Left Presses Right Presses
Left Presses Right Presses

Chapter 4
87
Figure 4-18: Grand ensemble average of STFT Time-Frequency PSD plots for electrodes C3 (top) and C4 (bottom) during left and right finger movement (left and right side respectively). The time window is 500ms prior to press (x-axis) over an extended mu frequency band (9-13Hz).
Table 4-7: Classification accuracy across 10 subjects using a time-frequency (STFT) feature extraction method. The feature consisted of an STFT in the bands 8-13Hz and 18-25Hz in 400 ms windows with 25 % overlap.
Session 1 2 Subject % %
1 58.053 56.917 2 52.556 51.921 3 46.481 48.078 4 49.118 51.917 5 58.088 57.735 6 53.162 44.193 7 54.715 53.207 8 52.296 52.421 9 55.188 52.214
10 55.785 49.611 Average 53.5442 51.8214
4.5.3. Competition Data
This section presents the results for the classification of the competition data (Berlin dataset) for
the aforementioned BCI Competition 2003. The competition data used in this study was
particularly constrained, both in the short time window leading up to the movement and by the
truncation of the data 130ms before the onset of movement. This made it difficult to harness time-
frequency features, for example, ERD [48,103], as additional features to aid in the classification
stage.
Table 4-8 shows the training and test set accuracies for four different feature extraction
methods. Cross-validation was performed on the training set to produce the training set accuracy
results. When the actual competition labels were posted after the submission deadline, the
performance of each method on the labelling of the test set was evaluated. It was found that the
training set performance was comparable to the test set, thus validating the cross-validation

Chapter 4
88
process of deriving an unbiased estimate of accuracy. It is slightly optimistically biased by
approximately 2-5 % for each method. This can be seen in Figure 4-19.
Table 4-8: Training and test set accuracy for the competition data
Feature Extraction Method Electrode Channels Used
Orders / Frequency Band / Time Resolution
Training Set Accuracy %
Test Set (unlabelled) Accuracy %
AR C1, C2
C3, C4
na=8
na=8
52.1
50.9
49
53
ARX C1, C2
C3, C4
na=4, nb=4
na=4, nb=4
64.2
68.1
59
63
Power Frequency Band Analysis
8,14,22,10,18,24,27,28 (localised around the motor cortex – as per competition )
8-16 and 17-25 Hz 73 68
Time-Frequency C3, C4
8-16 & 17-24 Hz 25 % overlapping
400 ms time windows
67 65
Training versus Test Results
0
10
20
30
40
50
60
70
80
1 2 3 4 5 6
Methods
% A
ccur
acy
TrainingTest
Figure 4-19: Plot of Performance Accuracy comparing the training and test results
The labels for the test data submitted as the author’s competition entry were attained by weighting
each of the labels classified using the ARX, power band and time-frequency feature extraction
methods according to their respective training set accuracies and then taking the closest class as
the resultant label. Due to the poor performance of AR for distinguishing between a left and right
press it was omitted and had no effect on the submitted labels.
Table 4-9 shows the official competition results as posted by the organisers Blankertz et
al. The winning entry for the Berlin left-right finger movement dataset used all 28 electrodes and a
multilayered perceptron neural network. The features extracted involved a combination of

Chapter 4
89
common subspace decomposition and Fisher discriminants. Considering the computational
complexity of the winning approach, it was felt the author’s submitted entry performed well.
Especially in light of the fact that for the most part, only the filtered and downsampled trials from
C3 and C4 were utilised and that the feature extraction and classification strategy employed was
computationally efficient making real-time processing possible.
Table 4-9: Official BCI Competition results table for dataset 4 (Berlin dataset) http://ida.first.fraunhofer.de/projects/bci/competition/results/index.html
# Contributor Error Research lab Co-contributors
1. Zhiguang Zhang 16% Tsinghua University, Beijing
Yijun Wang, Yong Li, Xiaorong Gao, Shangkai Gao, Fusheng Yang
2. Radford Neal 19% University of Toronto
9. Ray Smith 31% University College Dublin Richard Reilly
4.6. Discussion
This section is presented in two parts. The first part takes the form of a performance analysis for
this BCI study. It discusses the performance of the different feature extraction methods discussed
in this chapter by reviewing the results from the above section. It also goes further to highlight
potential problems or shortcomings with the various feature extraction methods.
Secondly, in Section 4.6.2, an analysis is done on the areas of the BCI design in this study
that requires additional work in order for it to be developed into a robust alternative
communication device for individual’s suffering from neuromuscular disorders.
4.6.1. Performance analysis
This section reviews the classification performance of the number of feature extraction methods
employed in this study that were presented in the results section above. It also briefly highlights
any important findings associated with using each method.
4.6.1.1. AR
Autoregressive modelling has been proven to provide a suitably accurate model of the background
EEG activity. As an AR model is intuitively a white noise source driving a spectral shaping
network, the background neuronal activity that behaves as random noise can be closely modelled.
The use of AR modelling to extract an ERP by subtracting the modelled background EEG signals
from the actual recordings has been proven to be quite poor. Many papers have claimed to have

Chapter 4
90
boosted the SNR of an ERP by this method but there exists no accurate means of quantifying it. It
was shown in this study that despite a wide-range of AR model orders, the average accuracy for
this method resulted in approximately chance (50%). Since a typical ERP has a really low SNR in
the order of -30dB, attempts to identify and distinguish between two very similar ERPs would be
near impossible using this method alone.
4.6.1.2. ARX
The ARX model was found to be very sensitive to the exogenous input used. The ensemble
averaged templates of single trial left/right epochs that represents the underlying ERP (BP) is used
as the exogenous input in our ARX model of single trial EEG. In order to generate these templates
a subject must perform a period of training whereby a series of labeled left/right trials are
recorded. Templates, specific to a given electrode position and function (left or right), are then
created by the average of the appropriate trials. The sensitivity arises due to the subject-specific
templates and through the variability of the number of trials a template is averaged over. It was
found that the system behaved optimally when approximately 100 trials were used to generate each
subject-specific template. The author pondered creating the ensemble averaged exogenous input
adaptively and questioned its ability to provide a more recent and accurate representation of the
underlying ERP. Perhaps an exponential weighting system could be employed to weight the more
recent trials in the template generation process.
It was shown in Table 4-5 that the classification accuracy performance varied widely over
the range 2-8 for each filter stage. Beyond this range, performance dropped significantly due the
additional noise and the greater classification dimensions. Simply taking the optimum model
orders of na=4 and nb=4 did not necessarily yield the optimum accuracy for each subject. Any
adaptive assessment of the appropriate model orders for each subject would however be highly
inefficient and not worth the slight improvement in accuracy.
It is shown in this study that the ARX method model goes further to model both the signal
and the noise which is found to be more effective than modelling the noise alone. This is an
intuitively satisfying result. This well published fact is reinforced by this study where
approximately a 10% improvement in classification accuracy is achieved on the AR approach.
Although an average classification accuracy of 60% is only achieved (65% for competition data),
the classification bias reinforces the existence of a distinguishable difference between an MRP
over the sensorimotor area for an upcoming left and right volitional finger movement.
ARX has proven its effectiveness and efficiency in the role of filtering and feature
extraction of single trial EEG. Further investigation into the creation and effect of the exogenous
input in conjunction with model order selection could further improve its potential. The author is

Chapter 4
91
skeptical about the ability of the ARX method to discern the subtle differences of ERPs with a
negative SNR. This casts a question mark over its ability to provide features to yield consistently
high classification accuracy for the purposes of BCI implementation. The author had applied this
method to VEPs which have an SNR >0dB and it yielded a much better identification
performance. This not only due to the improved SNR but also to the fact that the VEP is better
defined in terms of its morphology. The complex template used as the exogenous input is far more
distinguishable from the neuronal noise and thus yields comparatively better results than the ERPs
with their negative SNR and flat (low-frequency) morphology.
4.6.1.3. Time-Frequency
The time frequency, STFT based, feature extraction method failed to establish features to elucidate
the mu rhythm variations that occur on the contralateral side approximately 300 ms prior to a press
(as can be seen in Figure 4-18). Varying the time and frequency resolution could not yield any
improvement on the classification performance of this method as highlighted in Table 4-7.
The competition data yielded much better frequency domain features, particularly in the
case where a greater number of electrodes were used. The power frequency band analysis using 8
electrodes located above or near the motor cortex yielded approximately 70% accuracy. The STFT
time-frequency method for C3 and C4 yielded approximately 66% accuracy.
It is well publicised that time-frequency features distinguish best between the lateralisation
of hand or finger movement. It is evident in the literature and also proven here that increasing the
number of electrodes to an optimal number around the region of interest can help to maximise the
brain activity information into the system. Without the restriction of segmentation (breaking the
continuous EEG into short epochs), methods such as Pfurtscheller’s [48] Event Related
Desynchronization estimation method has been proven to yield good results.
4.6.2. Future Work
This section highlights some of the key areas to this study that need to be further researched in
order to develop this BCI approach into one that can be utilised by an individual with a severe
neuromuscular disorder for communication purposes.
The author feels that this study requires the use of a greater number of electrodes as is
typical in BCI research. By restricting ourselves to two electrodes as in this study the system relied
far too much on the consistency and integrity of the information contained therein. By using a
larger montage of electrodes about the motor cortex, it would improve the reliability of the event-
related information. A large number of electrodes facilitates not only a wider range of features to
be extracted but also the generation of spectral topographic plots to allow the BCI designer to

Chapter 4
92
visualize the origins of activity. The author would have liken additional time to look into Laplacian
based spatial filtering, ICA based source localisation and ERD/ERS features to develop better
results in this study.
There is a need to extend this paradigm to facilitate the classification of imagined limb
movement as opposed to actual movement. This would enable people with neuromuscular
disorders to utilise a BCI system based on this approach. This is discussed in greater detail in the
ensuing section.
4.6.2.1. Imagined limb movement paradigm
Motor imagery can modify the neuronal activity in the primary sensorimotor areas in a very
similar way as observable with a real executed movement [38]. Pineda et al. [96] studied the use of
the mu rhythm in BCI systems and similarly concluded that
“mu rhythm is not only modulated by the expression of self-generated movement but also by the
observation and imagination of movement”
It is broadly accepted that mental imagination of movements involves similar brain
regions/functions that are involved in programming and preparing such movements. According to
this view, the main difference between performance and imagery is that in the latter case,
execution would be blocked at some cortico-spinal level [95]. The aim is to further explore this
view by extending the above BCI system for imagined left/right hand movement. This section
discusses the potential imagined movement experimental paradigm.
The ultimate goal for a BCI is information transfer for a human without the use of the
‘normal pathways of peripheral nerves and muscles’. This poses a serious challenge for the design
and training of any BCI system. In order to elicit features from the continuous EEG recordings,
event-related feedback is required to know at what moment in time did the subject perform a
function and also what function i.e. imagine left or right movement. This sort of feedback is the
very goal we desire for our BCI. With the actual finger movement paradigm, there was direct
event-related feedback via the key presses due to motor movement. In the imagined paradigm we
have no such method of simultaneously and endogenously recording the imagined movement with
the EEG. The solution to this is to use a stimulus to trigger the desire for movement. This however
contravenes the experimental paradigm by generating an evoked-potential in response to the
stimulus which could mislead the classifier.

Chapter 4
93
4.7. Summary and Conclusion
This study successfully achieved the goal of submitting an entry into the BCI competition 2003. In
the process, the author succeeded in developing invaluable hands-on experience for recording,
processing and algorithmically manipulating EEG signals for the purposes of BCI.
A self-paced left/right typing BCI experimental paradigm was utilised in this study to
generate distinguishable brain activity for the purposes of predicting upcoming left or right finger
movements. The paradigm was devised to elucidate characteristic potential variations (MRP) in
the EEG recordings over the sensorimotor cortex associated with a left and right press. The time-
domain MRP characteristic that can distinguish between left and right finger movement is known
as the Bereitschaftspotential (BP). The BP2 component of the BP is more negative over the
contralateral side than the ipsilateral side during the 1000ms prior to the press. The frequency
domain feature is a short lasting desynchronization (ERD) in the mu and beta rhythms on the
contralateral side during the 600 ms prior to the press. Although these features can be easily
exposed on grand averages, it is much more challenging to extract these distinguishable
characteristics on a single-trial basis.
Three feature extraction methods were explored in this study to establish characteristic
features on a single trial that identify with a left or right press. The AR method behaved poorly and
it is the opinion of the author that the SNR of the underlying ERP is too low to establish
distinguishable AR parameters to achieve any classification above chance. ARX performed better
than AR by approximately 10% on average. It is however a very volatile method that is subject to
wide ranging results depending on the exogenous input used (ensemble averaged template) and the
model orders employed. Time-frequency features have been published in the literature to yield
much better classification results than parametric modelling methods, particularly if a large
number of channels are utilised. Frequency based features are less susceptible to artifacts and the
trial to trial variability of the EEG. The data in this study was particularly constrained by the short
time-windows prior to the finger press. This makes it difficult to harness, for example, Event
Related Desynchronization (ERD) as an additional feature in the classification. With this
considered, a poor classification accuracy of approximately 53% resulted using an STFT method.
The BCI considered in this study is a highly dependent one due to the requirement on the
user to have the ability to move his arms. Despite this fundamental BCI conceptual flaw, it was an
interesting study to investigate how a controllable mental ‘event’ could generate distinguishable
brain activity which in itself could support communication or control. This study was also a
convenient test bed for the goals of extending this paradigm to imagined limb movement due to the
similarly generated pre-movement potential variations (as discussed in section 4.6.2.1). It is the
author’s opinion that there exist better neuromechanism and experimental paradigms for BCI

Chapter 4
94
design that are capable of offering more robust communication with higher-transfer rates, such as
an SSVEP based visual attention paradigm as will be covered in the next study.

Chapter 5
95
Chapter 5 Study 2: SSVEP based real-time BCI
gaming system
This study was one of many as part of an ambitious collaboration between the DSP research group
at University College Dublin and the Mindgames research group at MIT Media Lab Europe (MLE)
to design and implement new biometrically controlled computer interfaces, specifically EEG based
BCIs. The Mindgames research group has enjoyed some media attention for their development of
biofeedback based applications such as Relax to Win31, Breathing Space and Still Life32. Their
research centres on the use of intelligent biofeedback and sensory immersive environments to
constructively affect a person’s state of mind. This collaboration has brought together people from
disciplines such as digital signal processing, hardware and graphic design in the hope of expediting
the process of developing EEG based non-clinical applications.
This chapter will initially present the aim of the project and give an introduction to the
origins and properties of visual evoked potentials that are exploited in this BCI study. This will
follow with an explanation of the experimental set-up and methodology behind the BCI framework
employed. The implementation of this BCI system into a real-time gaming environment using the
C# programming language is then discussed. The results associated with the development and final
stages of this study are presented in the ensuing section. The chapter concludes with a discussion
that reviews the success of this study, highlights some interesting findings and finally outlines
some future possibilities for such a BCI framework.
5.1. Aim
The objective of this study was to develop a system that utilizes brain activity to offer direct
control within a real time video gaming environment. The project was initially inspired by the
desire to develop a brain computer interface for people with limited motor movement capabilities.
The hope was then to implement a BCI system coupled with a simple video game to pose the
question;
31 Relax to Win©: UCD final year project that resulted in collaboration with MIT Media Lab Europe. It is a competitive
racing biofeedback game which is controlled by the players’ level of relaxation, as measured by their galvanic skin response. 32 Breathing Space© & Still-Life©: Mind Games Research Group, Media Lab Europe Dublin -
http://mindgames.mle.ie/projects.html

Chapter 5
96
‘Can an immersive bio-feedback game improve the speed and accuracy of a Brain Computer
Interface?’
Balance maintenance was the theme of the game envisaged. To this end, the Mind
Balance© game involves a tightrope-walking Scottish behemoth named Mawg (see Figure 5-2),
who the participant must assist by helping him maintain his balance, as he makes his way across an
interstellar tightrope. A participant at the helm of the Mind Balance© game has no muscular input
or video surveillance- only an electrode cap that non-invasively measures electrical signals from
the head.
Of the many BCI system approaches that exist in the literature, as reviewed in chapter
three, it was hoped to employ a simple yet effective method to realise this goal. The experimental
paradigm and the resulting characteristic brain wave pattern elucidation were crucial to the
deciding BCI control approach for the game. The steady-state visual evoked potentials (SSVEPs)
in the multiple visual stimuli selective attention paradigm was chosen due to its well publicized
success, computational efficiency and limited subject training requirements
[35,36,98,100,115,116,135,195]. In order to control the character’s balance, the participant would
be required to focus his attention to one of two stimuli flashing at different rates and positioned on
both sides of the character. For example, if the Mawg character begins to fall to the left the
participant should direct their visual attention to the right stimulus in order for the character to
regain balance. In order to captivate the participant’s game playing interest, it was imagined that
there would be a number of degrees of imbalance prior to the character falling.
Figure 5-1: Mind Balance© game logo Figure 5-2: Mawg©, the Scottish tightrope walking behemoth

Chapter 5
97
Having decided upon the distinguishable brain activity to offer the control in our BCI
approach, the next section will introduce and explain the VEP based neuromechanism as a
potential BCI control input.
5.2. Introduction
Visual evoked potentials (VEPs) are reflective of the electrophysiological mechanisms underlying
the processing of visual information in the brain. They originate from the many potential changes
within the occipital lobe in response to a visual stimulus change. The macroscopic potential
variations can then be picked up on the scalp surface at the back of the head. The signals evoked
by changes in the visual input have been shown to reflect certain properties of the stimulus [35]. A
static stimulus in the visual field does not result in any significant alteration in the EEG activity. A
transient (step-change) stimulus produces a VEP with a very characteristic waveform. It consists of
a trough-peak-trough complex with the very noticeable peak (referred to as P1) occurring at
around 100 ms after stimulus presentation. Figure 5-3 presents the time-locked ensemble averaged
response, from the electrode position Oz, to a checkerboard pattern alternating at a rate of 2 Hz.
P1
N2
N1
Figure 5-3: Ensemble averaged VEP response, from the electrode position Oz, to a checkerboard pattern alternating at a rate of 2 Hz. The N1, P1 and N2 trough-peak-trough occurs at 75, 110 and 140 ms respectively
A distinction is made in the literature between a transient VEP and a steady state VEP
(SSVEP) based on the visual stimulation frequency. The former arises when the stimulation
frequency is less than 2Hz. If the stimulus repetition rate is greater than 6 Hz, a periodic response
called the SSVEP will result. The resultant SSVEP is a complex symbiosis of a series of
components whose frequencies are integer multiples of the stimulus repetition frequency [100].
The amplitude and phase of the SSVEP are highly sensitive to stimulus parameters such as

Chapter 5
98
repetition rate, contrast or modulation depth, and spatial frequency [196]. The SSVEP was also
found to be strongly dependent on spatial attention, being substantially enlarged in response to a
flickering stimulus at an attended versus and unattended location [197]. The increased SSVEP
amplitudes reflect an enhancement of neural responses to a stimulus that falls within the range of
spatial attention. It is this fundamental idea that justifies the use of SSVEP as a method to identify
the visually attended target among a group of stimuli with sufficiently different flashing rates. For
a more detailed review of SSVEPs see [198,199].
6 8 10 12 14 16 18 20 22 24 26
0.02
0.04
0.06
0.08
0.1
0.12
0.14
Grand Average PSD Estimate for low freq stimulus
Freq (Hz)
PS
D (d
B/H
z)
6 8 10 12 14 16 18 20 22 24 26
0.1
0.2
0.3
0.4
Grand Average PSD Estimate for high freq stimulus
Freq (Hz)
PS
D (d
B/H
z)
O1O2
O1O2
F1
F1'
F1''
F2
Figure 5-4: Grand average PSD response for all subjects under the same conditions during visual focus to low freq stimulus F1=7 Hz
(top) and high frequency stimulus F2=13Hz (bottom)
Most of the early BCI designs, such as that of Vidal [1], used single-trial VEPs evoked by
a strobed checkerboard phase-reversal pattern and recorded over the occipital cortex to determine
direction of eye-gaze. Sutter [35], used SSVEPs evoked by six different flashing symbols on a
computer screen. The single-trial evoked potentials generated were correlated with ensemble
averaged time-locked templates for each symbol and a simple correlation threshold then translated
the feature to a classification. This time-domain template matching approach is reasonably
successful but is subject to significant trial-to-trial variability. A series of papers were
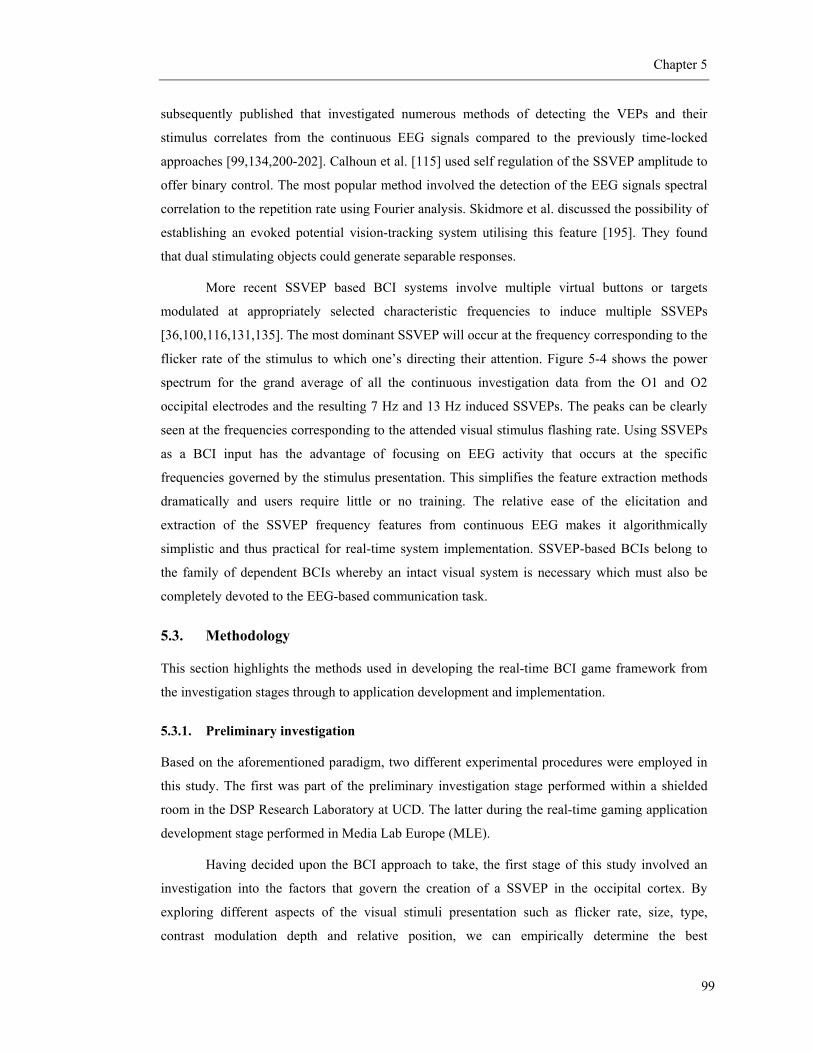
Chapter 5
99
subsequently published that investigated numerous methods of detecting the VEPs and their
stimulus correlates from the continuous EEG signals compared to the previously time-locked
approaches [99,134,200-202]. Calhoun et al. [115] used self regulation of the SSVEP amplitude to
offer binary control. The most popular method involved the detection of the EEG signals spectral
correlation to the repetition rate using Fourier analysis. Skidmore et al. discussed the possibility of
establishing an evoked potential vision-tracking system utilising this feature [195]. They found
that dual stimulating objects could generate separable responses.
More recent SSVEP based BCI systems involve multiple virtual buttons or targets
modulated at appropriately selected characteristic frequencies to induce multiple SSVEPs
[36,100,116,131,135]. The most dominant SSVEP will occur at the frequency corresponding to the
flicker rate of the stimulus to which one’s directing their attention. Figure 5-4 shows the power
spectrum for the grand average of all the continuous investigation data from the O1 and O2
occipital electrodes and the resulting 7 Hz and 13 Hz induced SSVEPs. The peaks can be clearly
seen at the frequencies corresponding to the attended visual stimulus flashing rate. Using SSVEPs
as a BCI input has the advantage of focusing on EEG activity that occurs at the specific
frequencies governed by the stimulus presentation. This simplifies the feature extraction methods
dramatically and users require little or no training. The relative ease of the elicitation and
extraction of the SSVEP frequency features from continuous EEG makes it algorithmically
simplistic and thus practical for real-time system implementation. SSVEP-based BCIs belong to
the family of dependent BCIs whereby an intact visual system is necessary which must also be
completely devoted to the EEG-based communication task.
5.3. Methodology
This section highlights the methods used in developing the real-time BCI game framework from
the investigation stages through to application development and implementation.
5.3.1. Preliminary investigation
Based on the aforementioned paradigm, two different experimental procedures were employed in
this study. The first was part of the preliminary investigation stage performed within a shielded
room in the DSP Research Laboratory at UCD. The latter during the real-time gaming application
development stage performed in Media Lab Europe (MLE).
Having decided upon the BCI approach to take, the first stage of this study involved an
investigation into the factors that govern the creation of a SSVEP in the occipital cortex. By
exploring different aspects of the visual stimuli presentation such as flicker rate, size, type,
contrast modulation depth and relative position, we can empirically determine the best

Chapter 5
100
experimental protocol to optimise the evocation of the SSVEPs to better discriminate between the
attention to one of two different visual stimuli and the subsequent control classes in our game. The
position of the subject relative to the monitor was also critically important in investigating the
effects of visual angle and the perceived stimulus size. Five subjects performed numerous EEG
recording sessions for this investigation. Each session was recorded from the O1 and O2 electrode
positions. The ideal visual stimulation properties and experimental set-up for each session was
progressively determined during this stage.
The use of the checker board phase reversal pattern is prevalent in the literature as the
preferred method of SSVEP generation [133,198]. The striking black and white reversing
checkerboard pattern is claimed to generate a SSVEP of the greatest magnitude. Some studies have
outlined the relationships of the SSVEPs to the size of the checkerboard pattern and the subjects
distance to the screen, or more specifically the percentage of the subjects’ field of view dominated
by the screen [199]. It was found that a single alternating checkerboard pattern (6 x 6 rectangles)
covering the entire screen did in fact generate a significant SSVEP at the corresponding frequency.
This was extended to two phase reversing checkerboard patterns of variable size, frequency and
separation. Our findings showed that when the subject was attending to one of the two different
stimuli that the SSVEP at the attended stimulation frequency was not as dominant as in the
previous case and that there was also some parasitic effects caused by the unattended stimulus
producing an SSVEP of lesser magnitude at the corresponding frequency. The attended stimulus
produced a much more significant spectral peak at the corresponding frequency compared with the
unattended thus proving the feasibility in distinguishing the attended from to the unattended
stimuli from the SSVEP alone.
Inspired by the desire to have the tightrope walking character holding a balance bar, it was
envisaged using spherical weights at either end of the balance bar to act as the differently flashing
stimuli. To this effect, simple visual demonstration was developed that contained two simple
yellow discs on the horizontal midline axis and evenly spaced about the vertical midline axis. The
diameter of the spheres, the horizontal distance from each other and the frequencies with which
they alternate from yellow to black where all variable parameters in this demonstration. This was
to facilitate an investigation into the optimum settings for the intended BCI gaming system. Early
findings proved that the discs performed similarly well as the checkerboard patterns for identifying
the attended stimulus. It was empirically found that the generated SSVEP was relatively
insensitive to the size of the discs in comparison to the effect of visual angle determined by the
horizontal separation and subjects distance from the screen. The greater the horizontal visual angle
between both stimuli (perceived horizontal separation) the greater the relative magnitude of the
SSVEP of the attended to the unattended stimulus. Similarly as the discs were made smaller, the

Chapter 5
101
visual impact of the unattended stimulus in the subjects’ field of vision and the subsequent
parasitic effects were reduced. As the optimum settings, it was empirically decided upon flashing
yellow-black discs of diameter one-fifth the screen size and horizontal separation of seven-tenths
the screen size from their respective centres. Based upon the screen size and subject location from
the screen, these can be converted in terms of visual angle as can be shown in Figure 5-5.
36.5 cm
26.5
cm
25.5 cm
Ø 7.3cm
25 °
60 cm
7 °18 °
Figure 5-5: Dimensions and visual angle of subject relative to CRT monitor during investigation stage
In both of the above investigatory experiments, the magnitude of the SSVEP was most
sensitive to the visual stimulation frequencies. There are a number of factors that must be
considered in the selection of stimulation rates for concurrently presented visual stimuli. The
frequencies must be chosen above 6 Hz, as defined by Ming et al. [100], to successfully generate a
SSVEP. The upper limits are affected by the fact that higher frequencies are more attenuated than
lower ones by the medium from the cerebral cortex to scalp [19]. This can readily be seen by the
almost asymptotic exponential decay of EEG signal power with frequency in an awake adult. In
the author’s opinion, it is even questionable if an SSVEP can be generated above 20 Hz as a result
of the general physical limitation of the visual processing system. In addition, the visual
presentation frequency is limited by the monitor refresh rate and the capability of the computer
graphics card. If a CRT monitor with a refresh rate of 80 Hz and a stimulus with a 50-50 duty-
cycle lasting 2 frames each (as is typical in the literature to alleviate demands on the presentation
computer), this would result in a theoretical limit of 20 Hz for the visual stimulation rate. Similarly
15 and 17.5 Hz are the upper limits for a 60 and 70 Hz monitor refresh rate respectively.
Considering the above, an approximate range of 6 – 16 Hz is available to us for the selection of the

Chapter 5
102
visual stimuli flicker rates. Within this range, the spontaneous EEG alpha rhythm can be most
corruptive to the SSVEP elucidation. As it is similarly located at the back of the head and is
typically in the range of 9-11 Hz, the alpha rhythm can particularly mask the presence of an
SSVEP on a small segment of continuous EEG. A dominant alpha peak caused by a consistent
alpha spindle, could masquerade as a potential SSVEP which could result in a misclassification in
our brain-computer control interface. Another crucially important factor that must be considered
when deciding the stimulation frequencies is the effect or presence of the SSVEP harmonics at
integer multiples of the stimulus flicker rate. For example, choosing one stimulus at 8 Hz will
generate SSVEP harmonics of progressively lesser magnitude at 16, 24 Hz etc. Therefore,
choosing another visual stimulus at either of these frequencies will result in spectral activity that
would masquerade as having originated from attention to an unattended stimulus and thus lead to a
misclassified control input. Only two visual stimuli were required for our basic two class BCI
control system. By taking all of the above into consideration in conjunction with some
experimentation, 7 and 13 Hz were decided upon to represent F1 and F2 for the left and right
flashing discs respectively due to their relative large difference in response to attended and
unattended stimuli. Section 5.5 highlights some of the results from this preliminary investigation
stage that helped decide upon the experimental protocol for our intended game application. The
next sub-section explains in explicit detail the finalised paradigm used in the online gaming
system.
Figure 5-6: Block diagram of SSVEP-based BCI system for Mind Balance© game control. Nicholas Negroponte, founder of the Massachusetts Institute of Technology's famed Media Lab successfully plays the game at the open-day.
Amplifierand filters
Monitor Audio /Visual
Biofeedback
FeatureTranslation
Data Buffer- 1sec of datasampled at
256 Hz
D/A
3-DGraphics
GameEngine
FeatureSelection
Freq. Powerratio
O1 & O2 channels
1024 PtFFT
PSD Estimate
Hammingwindow &zero pad to
1024 samples
Acquisition
Real-time signal processing C# .NET framework

Chapter 5
103
5.3.2. Game experimental protocol
Figure 5-6 shows a block diagram of the SSVEP-based BCI system used in this
experiment. Each participant was seated comfortably in an upright position in front of a large
vertically mounted projector screen with a refresh rate of 60 Hz (see Figure 5-7). Approximately
fifty subjects of varied demographics tested the game during the October 2003 Media Lab Europe
open-day.
1.428 m
1 m
1 m
Ø 30 cm
36 °
1.5 m
10°26°
Figure 5-7: Open day test environment illustrating projection screen and a user wearing an electrode cap
Figure 5-8: Dimensions and visual angle of subject relative to projector screen for finished gaming application
The game involves the tightrope walking character, Mawg, walking towards the
participant and randomly stumbling every 2-4 seconds to either side. The participant must
intervene to shift the creature’s balance so that it stays on the tightrope. To do this, users were
instructed to attend their visual focus to the disc on the opposite side of the screen to which Mawg
is losing balance and is beginning to fall (see Figure 5-10). The direction and frequency to which
the character loses his balance is random. There are two degrees of imbalance on both sides, after
which Mawg will fall without successful user aid. There is a delay of about 2 seconds between
each balance alteration stage to allow for the users visual focus and the resulting SSVEP to settle.
If the user does not accurately attend to the correct disc to control the character after he
initially loses balance (1st degree), the character will move to a worse (2nd) degree of imbalance
and similarly then to a 3rd degree where he falls. For correct user control Mawg will move up a
degree of balance until he is perfectly upright allowing him to proceed forward again. The game is
successfully completed by helping Mawg safely cross the interstellar tightrope. Audio-visual
feedback is given to the user to inform him of stability progress. The visual feedback is the degree

Chapter 5
104
of inclination in relation to the tight rope. The audio feedback is the character himself comically
reporting in his Scottish accent that he is about to fall or has successfully escaped plunging to his
death.
Figure 5-9: Training process: The user must attend to the flashing disc highlighted by the arrows in order to train the BCI to establish a classification threshold. The Mawg character remains inactive throughout.
Figure 5-10: Mawg character loosing his balance to the right requiring the user to attend to the left flashing disc for him to restore his balance
An electrode cap, Electro-Cap International System I33, was used to acquire EEG signals
from the O1 and O2 electrode positions according to the 10-20 system. Each channel, referenced
to the contra-lateral ear lobes, right and left for O1 and O2 respectively, was amplified (20K), 50
Hz line filtered and band-pass filtered over the range 0.01 – 100 Hz by Biopac34 biopotential
amplifiers. The signals were then digitized at a rate of 256 Hz using a National Instruments DAQ35
(Data Acquisition Hardware) to facilitate digital processing.
5.3.3. Feature extraction
The fundamental EEG waveform characteristic feature is based on the fact that the most dominant
SSVEP will occur at the frequency corresponding to the stimulus flicker rate to which one’s
attention is directed. It was hoped to extract frequency domain features to elucidate this fact. To
this end, a power spectral density estimate of the continuous EEG signals was required. Only a
pseudo-continuous spectral estimate can actually be achieved by basing it on estimates of short
segments from the continuous EEG recordings. There is a trade-off that exists between frequency
resolution and time resolution depending on the length of these segments. As we need the game
33 ElectroCap Inc., Electro-Cap International System I : http://www.electro-cap.com 34 Biopac Inc., Biopotential Amplifiers: http://www.biopac.com 35 National Instruments Inc., Data Acquisition Hardware: http://www.ni.com/dataacquisition

Chapter 5
105
input to be responsive, there is a need to keep the EEG segments short without jeopardising the
association of the frequency feature with its controlling class.
Every 200 ms (~51 samples), the last 1 second (256 samples) of continuous EEG from O1
and O2 is buffered. This produces a considerable overlap of 80% (800ms) from one data segment
to the next. It will be shown later that a number of EEG segments will be required to change from
one classification state to another during a change in the attended stimulus. To prevent the edge
windowing effects of short time segments in the frequency domain, a Hamming window of the one
second EEG segments is used. These are zero-padded to 1024 samples. Zero-padding in the time-
domain corresponds to interpolation in the frequency domain offering a higher estimated
frequency resolution than was previously available. In this case, the resolution improved from 1
Hz (256/256) up to 0.25 Hz (256/1024). A 1024 point Fast Fourier Transform (FFT) of the zero-
padded and windowed O1 and O2 EEG segments is then performed. A power spectral density
estimate of these one second windows is achieved by taking the square of the absolute value of the
FFT returned signal. Figure 5-11 shows the PSD estimate for two one second segments of
continuous EEG from O1 and O2 during the separate attention to the stimulus F1 and F2. The
peaks can be seen at 6.725 and 12.85 Hz corresponding to separate visual focus to the F1 and F2
stimuli. These peaks were expected to occur at 7 and 13 Hz but it was later found that during the
investigation stage the stimuli did in fact flicker at these rates. Noticeably from the graphs, the
peaks are not as pronounced as the grand ensemble averaged spectral estimate as shown in Figure
5-4.
6 8 10 12 14 16 18 20 22 24 26
20
40
60
80
100
120
140PSD Estimate for low freq stimulus Subject 3 session 1
Freq (Hz)
PS
D (d
B/H
z)
6 8 10 12 14 16 18 20 22 24 26
100
200
300
400
PSD Estimate for high freq stimulus Subject 3 session1
Freq (Hz)
PS
D (d
B/H
z)
O1O2
O1O2
Figure 5-11: Random single trial (1 second duration) for subject NF during visual focus to low freq stimulus F1=7 Hz (top) and high frequency stimulus F2=13Hz (bottom)

Chapter 5
106
Figure 5-12 summarises in a block diagram the signal processing employed to achieve the
power spectral estimate of the EEG segments from O1 and O2. These were then averaged to
produce a combined PSD estimate, X , to reduce feature vector dimensionality and any potential
bias based on visual location of the stimuli as will be explained later in the discussion.
Figure 5-12: DSP signal processing performed on the continuous O1 and O2 EEG recordings to produce a combined power spectral estimate
The intensity of the response for each stimulation frequency, defined as the sum of the
amplitudes of its’ fundamental frequency and the second harmonic, was used by Cheng et al. [100]
as the feature in their SSVEP based BCI. The threshold for detection was twice the empirically
determined mean value of the amplitude spectrum between 4 Hz and 35 Hz. Inspired by this
feature and the fact that the proposed BCI contained only two stimulation frequencies (F1 and F2)
and the associated two functional classes, it was decided to take the ratio of the PSD at the
frequencies F1 and F2 as a feature (F1/F2). It is necessary to logarithmically transform this ratio to
convert it to a linear scale and to ensure a more Gaussian distribution. This feature would then only
require a simple empirically determined threshold to classify the data. Unlike with Cheng et al.
[100], this feature offers relative power information for the frequencies, making it more robust.
Admittedly the extension of this relative power feature to an experiment with six functional classes
and the corresponding six more tightly selected frequencies as in Cheng et al. [100] is more
challenging. It would result in a feature vector of length 15 (6C2) or ( )26 to allow the relative power
ratios between the combinations at all six frequencies. This multidimensional feature vector would
then need to be classified using more complex means than threshold based methods.
In addition to this feature, a number of other simple PSD features were explored in an
attempt to find the most discriminatory feature or combinations thereof, to yield the optimum
classification performance between the two classes. The features investigated are listed as follows:
HammingWindow
256 samples
Zero-pad1024
samples
FFT1024 Point
Buffer256 samples
every 200msec
HammingWindow
256 samples
Zero-pad1024
samples
FFT1024 Point
Buffer256 samples
every 200msec
O1
O2X

Chapter 5
107
−−
))_2(min())_2(max())_1(min())_1(max(log:
rangefXrangefXrangefXrangefXMAXMIN (14)
))_2(())_1((log:
rangefXmeanrangefXmeanMEAN (15)
))_2(())_1((log:
rangefXstdrangefXstdSTD (16)
))_2(max())_1(max(log:
rangefXrangefXMAX (17)
)2()1(log:_
fXfXRatioPt (18)
)2()1(:_ fXfXDiffPt − (19)
fxfxfxrangefx
X
toingcorrespondindex frequency FFT theis: aroundBW bandwidth ofindex rangefrequency FFTan is:_
O2 and O1for estimatepower spectral average theis : where
5.3.4. Classification
During the early investigatory stages of this study, linear discriminant analysis (LDA) using an
approximation to Bayes’ theorem was employed as the pattern classifier. This approach identifies
the features or combinations thereof that better discriminate between the SSVEPs of the attended
from the unattended stimuli and the corresponding control selection. See section 3.5.7 for a review
of this feature translation method.
For the purposes of simplicity it had been envisaged to use a threshold based approach to
prevent the need to perform a computationally intensive covariance matrix inversion as required in
LDA. Through investigation it was found that the RatioPt _ feature, i.e. the log of the ratio of
the PSD estimate at the frequencies F1 and F2, was a very robust feature on its own and that the
addition of others offered little improvement. Therefore a simple one-dimensional threshold based
classifier was employed on this sole feature to perform the pattern recognition. The brain wave
activity at O1 and O2 is effectively translated into a one-dimensional analog control axis that can
be used to decipher the participant’s control input and in this application to aid Mawg regain his
balance.
The investigation stage showed that the RatioPt _ feature value overlapped for less than
8% of the continuous EEG data segments during the attention to the two different stimuli. This

Chapter 5
108
causes a class ambiguity for the classifier and could lead to a potential misclassification. This
small percentage could be attributed to when the subject had recently changed his attended
stimulus and the SSVEP had not enough time to settle. It could also be due to the subject
temporarily adjusting his focus while attending to the same stimulus allowing the parasitic effects
of the unattended stimulus to dominate. To combat this problem, it was decided to average (low
pass filter) the feature value of the last one second of continuous data and that of the two previous
EEG segments, occurring 200 msec and 400 msec respectively prior to the current segment. It was
this feature value that is ultimately compared to the threshold to generate the deciding
classification. The averaging produced a smoother transition of the resultant feature value from
one side of the threshold to the other in response to an attended stimulus change. Although this
introduced an additional latency for the system to respond to the change (up to 400 msec ideally),
it made the classifier more robust to single erroneous EEG segment feature values. The overall
effective classification throughput of 400-600 msecs places a similar time restriction on the
characters responsiveness within the game. This is however overshadowed by the fact that the
EEG segments used for these classification results are of the last one second of continuous data.
There is therefore a need to wait for the majority of the last one second of EEG data to contain the
SSVEP with the dominant frequency associated to the visually attended stimulus. To allow users
enough time to readjust their focus and their resulting SSVEPs to settle, the BCI gaming system
evaluates the classifier output or control command every 1.5 seconds.
The performance improved dramatically, with the above alterations to the classifier. The
combined probability of misclassification was less than 1% for most subjects. This will be
discussed later in the results section.
5.3.5. Training
This section explains the benefits of the brief training session prior to a participant taking
part in the game. It was found during the investigation stage of this study that the RatioPt _
feature as mentioned above (log of spectral power ratio for F1 and F2) had Gaussian like
distributions in response to both the low and high frequency stimulus (see Figure 5-16 in section
5.5). The modes (max of distribution) for the different sessions are clearly separable confirming
the plausibility of its use as a class separating feature. However, the tail ends of the normal
distribution for each session overlap to cause a region (~8%) of values that will cause ambiguity
for the classification stage. The median value of the overlapping sections is typically chosen as the
optimum threshold to distinguish one distribution from another. This point represents an
equiprobable misclassification error for both classes. This optimum threshold was not located at
zero as would have been expected. It was also found to differ from subject to subject. Klimesch
[29] also published that the alpha rhythm reduces with age which could interfere with the SSVEP.

Chapter 5
109
There was therefore a need to establish this subject specific threshold for the classification stage in
order to decrease the overall probability of misclassification.
The training or calibration stage of the application required the subject to attend to each
stimulus for a period typically no longer than 30 seconds. This provided the system with sustained
periods of attention to each visual stimulus to facilitate the calibration of the optimum threshold
for the feature. Figure 5-13 depicts the signal acquisition and processing graphic user interface
(GUI) for an administrator to control during training. The analog linear slider bar that is visible on
the bottom shows the feature value for the most recent EEG data (averaged value for three 1 s
segments). This can be viewed by the administrator to visualize how the EEG and resulting feature
are responding to a user’s control attempt.
Figure 5-13: Signal Acquisition and Processing GUI that controls calibration and gaming modes
Due to the variability of the classification threshold from subject to subject, it was found
that the game performance similarly varied without the inclusion of the threshold calibration stage.
Classification was dramatically improved for some subjects through its use.
5.4. Real-time game development
This section highlights the programming and graphic interface framework behind the real-time
implementation of the BCI controlled video game application. The video game as described in
section 5.3.2 requires a sophisticated graphical and signal processing footwork for real-time
implementation. There are two important criteria to the real-time implementation. The first is that
the flickering visual stimuli must be reliably presented at the set frequencies in order to correctly
detect the SSVEP and the resulting control command associated with that frequency. To this end,
the flickering stimuli must be rendered at least a consistent 60 frames-per-second. Secondly, the

Chapter 5
110
signal processing of the continuous EEG signals as shown in Figure 5-6 and Figure 5-12 must be
efficiently performed to offer real-time control within the gaming environment. The C#
programming language as part of the .NET framework facilitates rapid and efficient
implementation of these needs.
In order to further expedite application development and decouple the signal acquisition
and processing steps from the actual game play, we used the Sponge signal processing framework
to offload signal processing to another PC. On the signal acquisition PC, the electrical signals are
acquired from the electrodes and the visual attention frequency feature is extracted. Then, the
simple 1-D feature is sent over the network to the computer controlling the animated Mawg
character and rendering the Mind Balance gaming environment.
5.4.1. C# and the .NET framework
The .NET platform is a development framework that provides a new way to create Windows
applications. It goes beyond traditional Windows programming to facilitate creating web
applications quickly and easily. The framework specifies how .NET programming constructs such
as intrinsic types, classes, and interfaces are implemented. The goal of C# is to provide a simple,
object-oriented, Internet-centric, high-performance language for .NET development [203]. It
includes all the support for structured, component-based, object-oriented programming that one
expects of a modern language built on the shoulders of C++ and Java. The C# language can be
used to develop three types of applications; Console applications, which display no graphics;
Windows applications, which use the standard Windows interface and Web applications, which
can be accessed with a browser. For a more detailed insight and tutorial into programming with
C#, the interested reader is advised to consult the book by Liberty [203].
In relation to this study, a programming engine and platform capable of rendering detailed
3-D graphics while at the same time processing continuous EEG data to control a sprite within the
game was required. Graphically impressive video games are quite demanding on computer
resources. Adding the additional requirement of maintaining a consistent high frame-rate for
stimulus presentation further stretches these computational demands. The C# graphics engine is
capable of rendering the stimuli, together with the animated character and environment, at over
100 fps36 on conventional hardware. With performance figures such as these, it would certainly be
possible to perform signal acquisition and processing on the same PC that is rendering the
graphics. The signal processing requirements of the feature extraction and classification stages are
relatively undemanding and thus can be easily implemented in C#.
36 fps: Frames per second

Chapter 5
111
5.5. Results and performance
This section presents the results and performance metrics for this study. The first stage involved an
investigation to determine the optimum experimental conditions to elicit clearly distinguishable
SSVEPs during attention to one stimulus over another. It was empirically found that the ideal
stimuli were two flashing discs that flashed from yellow-to-black at 7 and 13 Hz for left and right
respectively. In terms of visual angle, the discs were typically of diameter 7–10° and separation of
18-26°. The angles are guidelines to put the visual presentation in context. Subjects often moved
their eyes to help with directing their complete attention to only one stimulus.
The next stage involved the feature extraction methods to characterise visual attention to a
given stimulus from the EEG signals alone. As listed above in section 5.3.3, these methods were
performed during the investigation stages of this study to empirically discover the optimum
experimental protocol. For all five subjects, under the same aforementioned conditions, the
features were extracted for the continuous recordings. These features were classified using linear
discriminant analysis and employing an M-shuffle by N-fold cross validation to offer an unbiased
estimate of accuracy. Table 5-1 presents the grand averaged accuracies for each feature, a
combination of features 1, 2, 5 & 6 and finally a combination of them all.
Table 5-1: Classification results for various features or their combinations during the investigation stage
Feature Combination
Mean test accuracy (%)
Test standard deviation (%)
(1) MAXMIN 76.4779 0.1829
(2) MEAN 85.3553 0.1520
(3) STD 76.0350 0.1754
(4) MAX 83.3883 0.1539
(5) Pt_Ratio 88.7024 0.1194
(6) Pt_Diff 87.4253 0.1411
(1), (2), (5) ,(6) 89.8867 0.1737
All: (1) – (6) 89.9279 0.2318
Figure 5-14 represents the distribution plots for various features in a matrix grid. The
histograms of each feature are represented along the diagonal cells in the form of a 2-D
distribution for both classes. The off-diagonal cells represent the distribution of the features
relative to each other in the form of 2-D scatter plots. The tight diagonally linear scatter plots show
the features MAXMIN and STD (1, 3) are highly correlated. This suggests that they both contain
similar information. Due to the redundant information, inclusion of both will only add additional

Chapter 5
112
noise and could decrease classification performance. Similarly for the features MEAN and MAX
(2, 4). The ideal combination between the features would require the redundant features to be left
out, hence the investigation in Table 5-1 of features 1, 2, 5 and 6 together. Figure 5-14 shows that
the RatioPt _ and DiffPt _ features, which are themselves quite correlated, discriminate most
between the two control classes. Based on the performance of the RatioPt _ feature and the little
improvement offered with the addition of other features, it was decided to use just the single
dimension feature and employ a threshold based classifier. By not employing LDA as the
classifier, it alleviated the computational needs on the classification task.
Figure 5-14: Distribution plots for various features with themselves (diagonal cells) in the form of 1-D histograms and with other features (off diagonal cells) in the form of 2-D scatter plots
Figure 5-15 shows the RatioPt _ feature value for two continuous sessions while
attending a low frequency and high frequency stimulus separately. The mean feature values for
each run are clearly distinguishable. The mid point that would be suggestive of the ideal
classification threshold is noticeably located below 0 (approximately -0.3). This can be better
viewed from the histogram in Figure 5-16. This confirmed the need to train the classifier in order
to obtain the threshold that will offer optimum accuracy.

Chapter 5
113
The online experimentation of the finished gaming application performed extremely well
with all the subjects who participated capable of controlling the character Mawg by either ensuring
his safe passage across the tightrope and completing the game or forcing him to an early grave.
Figure 5-15: Plot of the Pt PSD Ratio for F1/F2 during attention to the low frequency stimulus (red) and high frequency stimulus (blue) in different runs. It can be seen that the former is predominantly greater than one while the latter is predominantly less than1 one.
5.6. Discussion
This section is presented in three parts. Firstly it analyses the success of this study by reviewing
the results and performance of the finished BCI gaming system. The second discusses some
interesting findings uncovered during this study. Finally, the future potential of this BCI gaming
framework is discussed, particularly focusing on areas of improvement for the Mind Balance game
to offer a greater gaming experience and gain insight into the effects of biofeedback.

Chapter 5
114
Figure 5-16: Histogram of Pt PSD ratio feature of F1/F2 during visual attention to low frequency stimulus F1 (blue) and high frequency F2 (red)
5.6.1. Performance analysis
The ease and accuracy of the online BCI implementation hinged on the efficient and robust feature
extraction methods of the SSVEPs. The RatioPt _ feature, log of the power ratio at the two
stimulation rates, was proven in the investigation stage to be more than adequate for distinguishing
between the two classes by offering 82.7% accuracy across all subjects for the entire range of
continuous data acquired. The later adjustment to average the last three one second EEG segments
spanning 600ms and then inputting that to the threshold classifier further improved accuracy to
87%. The realisation that the classifier threshold for this feature was not typically zero and in fact
varied between subjects, inspired the addition of the classifier training stage. Through its use,
online accuracy moved closer to 90%. The online performance metric focused on the participants’
ability to control the animated character Mawg. Every subject who took part successfully
completed the game by ensuring his safe passage across the tightrope. Very few subjects, unless
intentionally doing so, were unable to control Mawg after the first degree of imbalance but
ultimately everyone prevented him from falling. It is worth mentioning that certain subjects

Chapter 5
115
playing devil’s advocate intentionally managed to throw the character more quickly from the
tightrope by attending to the wrong stimulus (same side as which the character is falling).
In summary, the gaming application was an enormous success at the open day whereby
participant’s flawlessly controlled the character but more importantly enjoyed the gaming
experience.
5.6.2. Interesting findings
During the investigatory stages of this study, some interesting findings resulted from
experimentation and investigation. These can be summarised as follows:
1) The dominant SSVEP produces a sharp and precise frequency peak that is equal to the attended
stimulation rate.
2) 7 Hz stimulus generated a greater parasitic SSVEP than the 13 Hz stimulus.
3) Hemispheric bias of visual cortex activity related to contra-lateral spatial visual attention.
4) Magnitude of the SSVEP response to the 13 Hz stimulus was greater than the 7Hz stimulus
5) Not windowing the EEG segments yielded on overall improvement of 5 % accuracy across
all subjects for classifying the attended stimulus from 1s segments of continuous EEG data.
Refer to Figure 5-4 for the grand ensemble averaged frequency power estimate across all subjects
in relation to the discursive expansion of the above points.
(1) It was found that the dominant frequency in an SSVEP occurs very precisely at the
frequency with which the attended visual stimulus flickers. When the EEG data was zero-padded
to 2048 (interpolation) yielding an estimated frequency resolution of 0.125 Hz, it was observed
that even one FFT sample point either side of the attended stimulation frequency would result in
significantly missing most of the power that the nearby SSVEP peak actually contained. In some
cases, it was close to half the actual power allowing for the power of the SSVEP associated with
the unattended stimulus to dominate and potentially lead to a misclassification. Care is needed in
the feature extraction stage with high frequency resolution to correctly identify the FFT index of
the peak associated with the attended stimulus. Despite the limited range for selecting the
stimulation rates as discussed earlier, the precision and sharpness of the SSVEP frequency content
clearly highlights the potential of using a SSVEP based BCI system with a lot more stimuli with
closely packed stimulation rates to offer higher information transfer rates.
(2) It was found that the parasitic presence of an SSVEP related to the unattended
stimuli was more prevalent for the 7 Hz than the 13 Hz stimulus, i.e. while attending to the

Chapter 5
116
stimulus flashing at 13 Hz the slower stimulus of 7 Hz had a greater parasitic effect than in the
reverse case. It was strangely found that the parasitically induced unattended SSVEP for the 7 Hz
had a spectral peak on average at a lower frequency than when it is being attended (6.3 compared
to 6.725 Hz).
(3) It is well known that the functionality of the left side of the body affects the right
hemisphere of the brain and vice-versa (except for the olfactory senses). Similarly for the occipital
lobe with the generation of VEPs or SSVEPs, a visual stimulus change on one side of ones field of
view has a greater affect on the contra-lateral side of the occipital lobe. For example, a stimulus in
the right hemi field generates more brain activity on the left side than the right and subsequently
the recorded activity difference at O1 and O2 respectively. There was a greater difference between
O1 and O2 for the SSVEP response to the 13 Hz stimulus (where O1 was almost double that of
O2) compared with the 7 Hz one (where O1 and O2 were similar). To remove any bias from
knowing what stimulation rate is associated with a stimulus on a given side of the subjects’ field of
view, the spectral estimate for the EEG segments from O1 and O2 were averaged. It also helps cut
the feature vector dimensionality requirements in half.
(4) The magnitude of the SSVEP response to the 13 Hz stimulus is much greater than
the 7 Hz case. It was found to be typically double. This posed the question: ‘is the relative
magnitude of the SSVEP response associated with the chosen stimulation frequency and is it in
fact the case that the greater the frequency the bigger the response?’ It is the author’s opinion that
this is probably not the case and it is more closely linked with the non-linear superposition of
repetitive VEP components that amass to the SSVEP. It was noticed that the harmonics of the 7
(6.725) Hz frequency could be clearly distinguished at 13.45 and 20.175 Hz. This was not as
visible for the 13 (12.85) Hz stimulus.
(5) It was found that when the EEG segments were not windowed that the overall accuracy of
the system improved by 5 % across all subjects. We compared the effect of windowing and not
windowing the continuous EEG on the power spectral estimate averaged across an entire session.
The SSVEP for the attended stimulus had greater magnitude at the associated stimulation
frequency for the unwindowed EEG data compared with the Hamming windowed case. In review,
windowing prevents the edge effects caused by discontinuities that occur at the start and end of a
segment of continuous data. When converted into the frequency domain by means of an FFT, these
sharp step-like discontinuities introduce high frequency components and their harmonics into the
resulting overall spectral estimate. This is conventionally undesirable. In the case of the feature
extraction methods employed within this study whereby a power estimate at only two specific
frequencies (F1, F2) was required, windowing would appear unnecessary. This requires the
assumption that the additional frequency components introduced by the discontinuities do not

Chapter 5
117
occur at either of the stimulation frequencies (F1 or F2). To remove the discontinuities, windowing
has the effect of decreasing the variance in the start and end of the segment of data while at the
same time preserving the frequency content. If the segment of data has a dominant frequency
throughout the segment, as would be prevalent during this experiment for an SSVEP, windowing
would decrease the relative power at the start and end associated with that dominant frequency. It
is in the author’s opinion that this could account for the decrease in relative power at the attended
stimulus frequency for the windowed case as can be seen in Figure 5-17. Assuming that the
SSVEP can be represented by a single frequency sinusoid (~13 Hz), the effect of windowing on a
similarly created spectral estimate was investigated. It involved taking 256 samples of the
sinusoid, zero-padding to 1024 and then taking the square of the absolute of the FFT. It confirmed
that windowing reduces the sharpness and peak amplitude of the spectral estimate for the dominant
frequency as can be seen in Figure 5-18.
5.6.3. Future work
This intention of this study was to develop the BCI framework that could be extended to
offer improved more natural and involving control. It was envisaged that this test bed would
facilitate more rapid investigations into other neuro-control mechanisms and the effects of various
forms of biofeedback.
6 7 8 9 10 11 12 13 140
0.5
1
1.5
2
x 105
Frequency (Hz)
Pow
er
Ensemble Averaged PSD estimate for high freq. stimulus comparing the effect of windowing
RawHanning windowed
6 7 8 9 10 11 12 130
2
4
6
8
10
12
x 104
Frequency (Hz)
Pow
er
Ensemble Averaged PSD estimate for low freq. stimulus comparing the effect of windowing
RawHanning windowed
Figure 5-17: The effects of windowing the segments of continuous EEG on the power spectral estimate. It can be seen that the attended SSVEP has a greater response for the raw unwindowed case

Chapter 5
118
The figures of merit for any BCI are speed, accuracy and usability. The first two are
described under the same category of information transfer rate capability which is the ultimate goal
from the point of view of an alternative communication medium for locked-in patients. From a
computer gaming application, the ease of interaction, user friendliness and the engaging use of
biofeedback would be of equal importance in order to ensure an enjoyable gaming experience. The
use of games in a rehabilitative context, as is the specialty of the Mind Games team, must grab the
interest of the patient, particularly seeing as most rehabilitation sessions require the repetition of
tedious exercises and may involve children.
The hopes for future development of this project was to extend the game with the
additional controls of offering the forward and reverse control of the character as opposed to
simply shifting his balance. This would require four visual stimuli of different flashing rates.
Utilising the power ratio feature for all frequency combinations would result in a feature vector of
dimension 6 thus requiring the use of multi dimensional classification methods such as LDA. This
would offer the participant much more control over the character and hopefully as a result be more
engaging. It was hoped that one could introduce a sense of progressive achievement by introducing
levels of increasing difficulty. This would require an unresponsive band that separates the
functional classes’ distributions and widens with the progressive level. Therefore as the levels
advance, the participant would be required to be more attentive to the desired control stimulus in
order for the system to initiate the control. This could hopefully be used in a rehabilitative manner
for patients suffering from attention deficit hyperactivity disorder (ADHD) to encourage better
attention and focus. The gaming environment would offer the rewarding sense of achievement
associated with progressing to further levels.
Having explored the full potential of this system using SSVEPs, it was hoped that other
neuromechanisms such as the imagined limb movement paradigm as discussed earlier in chapter 4
0 50 100 150 200 250 300-1
-0.8
-0.6
-0.4
-0.2
0
0.2
0.4
0.6
0.8
1
0 10 20 30 40 50 600
0.02
0.04
0.06
0.08
0.1
0.12
0.14
Figure 5-18: Comparison of windowed (blue) and unwindowed (red) spectral estimate for a single frequency sinusoid. The time and frequency domain are represented in the left and right graphs respectively. The unwindowed has greater power at the given frequency than the windowed case.

Chapter 5
119
could be investigated using the same gaming framework. Although MRPs are more difficult to
elicit on a single-trial basis, it would bring to the game a more natural and involving method of
exerting control.
5.7. Summary and Conclusion
This study successfully achieved the goal of employing a BCI system to offer real-time control
within an immersive computer game application. The use of the SSVEPs in the multiple visual
stimuli selective attention paradigm is commonly used as an input control in the area of BCI
design. The power spectral correlate of the EEG activity with the attended visual stimulus, i.e. the
fact that the generated SSVEPs have a dominant frequency component at the stimulation rate,
facilitates the use of simple feature extraction and classification methods. The features concentrate
on very specific frequencies associated with the stimuli and hence are very robust on a single trial
basis amidst background EEG (acts as white noise). No such easily distinguishable characteristic
exists with other ERPs such as the readiness or pre-motor movement potential as discussed in
Study 1 (Chapter 4). In addition, the use of SSVEPs is computationally efficient and requires
limited training for the purposes of online implementation. This BCI approach is capable of
offering relatively high transfer rates compared with other implemented systems as quantified by
Ming et al. [100].
The use of SSVEP based BCI systems is not as straightforward for completely locked-in
patients who do not have the mobility of their eyes. The inability to move ones eyes seriously
inhibits the ability to direct ones attention and focus on a particular stimulus over another. This
would prevent the dominance of the desired SSVEP and ultimately will result in a control
misclassification. Paradoxically for an SSVEP based BCI system, if a subject has the mobility of
his eyes there exists eye-tracking means of communication with better speed, accuracy and
usability than the SSVEP based BCI approach. Despite the wide application of SSVEPs in BCI
designs, there remains much to understand regarding the dynamics of SSVEP creation.
It is with this in mind that the research collaboration hopes to use alternative
neuromechanisms such as the MRP associated with imagined limb movement as the means to offer
the control. The ultimate success of this study has been the development of a complete online BCI
gaming framework with which to further investigate the electrophysiological functionality of the
brain and develop more exciting applications.

Chapter 6
120
Chapter 6 Conclusions
The author hopes that this thesis will guide further BCI research and development within the DSP
laboratory at UCD. This chapter firstly summarises the conclusions of the MRP and SSVEP based
BCI studies as highlighted in sections 4.7 and 5.7 respectively. It then addresses the future of BCI
technology and focuses on some key areas that require further research attention.
6.1. Study 1 – MRP based BCI system
This study successfully submitted an entry into the BCI Competition 2003 with the goal of
optimally identifying upcoming left or right finger movements from the EEG alone. A self-paced
typing experimental paradigm was used within the laboratory in UCD to gather more experimental
data to help in the training of a classifier. The data consisted of EEG recordings from the C3 and
C4 electrode positions. The continuous recordings were segmented into epochs prior to the finger
press. Three feature extraction methods were employed separately to establish distinguishable
features that would identify with either a left or right movement. These included parametric
modelling methods such as AR and ARX which yielded a performance accuracy of 51% and 64%
on average. Frequency based features included spectral power band and STFT estimates which
yielded classification accuracies of 69% and 66% respectively. It is worth noting that the spectral
power band method used 8 channels from electrodes placed near motor cortex. LDA was
uniformly employed throughout in conjunction with cross-fold validation.
The author is sceptical about the ability of AR and ARX methods to identify and more
importantly distinguish the low SNR (~30dB) MRPs. Frequency and time-frequency based
features, such as ERD/ERS methods, derived from a large montage of electrodes offers the most
promising means of identifying actual and imagined limb movement on a single trial. There exist
alternative BCI approaches that can offer more robust communication with higher transfer rates,
such as in study 2.
6.2. Study 2 – SSVEP based BCI system
This study successfully implemented an online BCI system to offer control within an immersive
video gaming application. The robust nature of the control related brain activity feature and the
adaptive classifier offered consistently good performance (>95% classification accuracy). The
computationally efficient signal processing (feature extraction and classification) reduces the
demands on the host computer for an online implementation. Further research needs to be carried

Chapter 6
121
out to study the effects of the audio-visual neurofeedback offered by this BCI system. Video
gaming is a billion dollar industry. There is continuous research into new methods of interaction or
playing these games that includes joysticks, dance mats, cycling machines, skateboards, skis etc.
The BCI system in this study demonstrated an innovative method of controlling a video game.
This technology could provide an additional or replacement control input for the widespread
computer gaming community. Further development of BCI technology could result in tapping into
this lucrative industry.
The big discussion in the BCI research community is the level of dependence (as discussed
in section 3.61 point 5) of SSVEP systems. Many BCI researchers regard SSVEP systems as
‘dependent’, i.e. the user must have the ability to move their eyes to successfully utilize the
system. As there are many eye tracking communication systems that offer far higher information
transfer rates than BCI systems, the future of SSVEP based systems is often dismissed. Others
claim that it is possible to direct ones visual attention at different stimuli in the field of view
without eye movement. Muller and Hillyard [361, 362] and Gao [43] both suggest, but do not
substantiate, that subjects can modulate SSVEP amplitude without such gaze shifting.
SSVEP based BCI systems currently offer the highest information transfer rates (~27
bits/min Tsinghua BCI Group [100,116]). It is this author’s opinion that SSVEP BCI systems do
not require gaze control but further research is needed with locked-in patients to qualify this. There
may however be some adverse effects to ‘covert’ (out-of-focus) selective attention (.i.e. without
gaze shifting) such as producing a strain on the eyes that could result in headaches. The continued
research by Lalor et al. further investigates the use of SSVEPs not only in the field of BCI research
but also in the area of neurological rehabilitation.
6.3. Future of BCI technology
Current BCI systems can offer transfer rates of up to 25 bits/min. This is very limited in
comparison to conventional human-computer communication mediums. The innovative means of
communicating via thoughts alone has generated much research and media interest despite the
relatively poor information transfer capabilities. For locked-in subjects, this technology offers the
only possible means of communication. The social recognition of the needs of these people is the
biggest driving factor behind this field of research.
The field of BCI research is in its relative infancy compared with other communication
technologies such as internet, television, and mobile communications. In order for it to mature into
an established research field there is a need for the BCI research community to take the system
implementation stage out of the laboratory and integrate it into real-life situations. Only the

Chapter 6
122
Tübingen group’s TTD system, Kennedy’s implanted electrode system and the Graz group’s BCI
have been tested to the author’s knowledge outside of the laboratory.
To facilitate the further development of this technology in the future, the author has
highlighted a few key issues which must be addressed. These are discussed as follows:
1) Improved understanding of cognitive neurophysiology
Further investigation into the cognitive and psychological functionality of the human brain can
develop a better understanding that can be exploited to improve BCI systems. It is also important
to research the extent to which EEG activity control depends on the normal internal CNS structure
and function.
2) More stable, convenient and affordable acquisition process
The development of affordable, low-maintenance, less-invasive, and robust acquisition systems
will be required for the deployment of this technology to the public. For the future progression of
this technology, it is crucial that these systems can be set-up, maintained and cleaned by the
general public without the need for specialized or trained staff. It requires the involvement of
hardware specialists to attain these goals. Media Lab Europe has recently patented a wireless
electrode cap, Cerebus, to facilitate convenient acquisition for future applications targeted at the
general population. For the present however, the systems must first be of high quality and robust to
facilitate the optimum recording of EEG activity for BCI input signals.
3) Improved identification and elimination of artifacts:
Although the area of artifact removal is ripe, very few methods have been employed by current
BCI implementations to eliminate artifacts. Most of the investigations performed to date have been
performed offline due to the computational overheads. Artifacts are however a dramatic problem
for real-time BCI performance in real-life scenarios. Further investigation is needed to arrive at
methods of successfully removing artifacts such as EOG and EMG online and without
contaminating the EEG signals or the need to discard single-trials. This requires a significant
involvement from signal processors to develop the appropriate real-time algorithms.
4) Improved identification of features and the development of translation algorithms
Once an in-depth understanding of the neurophysiological origins of the controllable EEG activity
has been established, it is essential to derive signal features to robustly identify and distinguish the
command-related activity. It is important to establish the EEG activity that users are best able to
control, whether it is evoked potentials, spontaneous rhythms, or single-neuron firing rates. The
translation of these features into a device command underpins the success of a BCI system.
Adaptive algorithms are necessary in a BCI because the signals recorded change over time due to

Chapter 6
123
technical, biological and psychological factors. This is the kernel of the BCI design challenge that
requires the innovative involvement of engineers.
5) Development of standards to facilitate performance comparison
It is important to adopt standard methods for evaluating short-term and long-term BCI
performance to facilitate system comparisons within the community. To provide reliable and
useful systems for consumers, BCI methods and applications should be systematically evaluated in
target populations. Objective measurements are required to establish how successful individuals
with various disabilities actually employ a particular technology and to what extent the technology
has contributed to their communication and control abilities but more importantly on their quality
of life.
Setting standards can however have an adverse effect on this line of research. An
inevitable trade-off exists between encouraging innovation and finding an efficient method to
compare systems. Since BCI technology is an early stage of development it is critical that the
community does not constrict innovative advances by establishing too many standards and model
frameworks. However, the development of standard data sets for the comparison of processing
methods and algorithms is invaluable in the author’s opinion. Collaborative studies such as the
BCI competitions organized by the international BCI research community [141,142,146] is an
excellent idea to encourage innovative approaches to solving the signal processing challenges
involved in BCI design..
Although global standards may be useful in the future when the BCI field moves from
exploration to application driven, the present state of BCI research requires the investigation of
many alternative approaches to BCI design. It is too early to standardize BCI approaches as
investigators need the flexibility and innovation to be free to conceptualize in many different ways.
6) Development of applications to optimize the use of the limited bandwidth
We need to maximize bandwidth and to optimize how the limited bandwidth can be optimally
used. Similar to the system-specific applications developed for low-bandwidth technology such as
mobile phones, there is a need to develop applications tailored to the target population (currently
communication and control devices for the severely disabled) that optimally utilizes the available
bandwidth. Applications such as a spelling program with predictive word completion can make
efficient use of the bandwidth and improve performance.
7) Study of the psychological and behavioural effects of BCI systems on user
Research into the development of behavioural methods that can help users to gain and maintain
feature control would be extremely valuable. A deeper understanding of the psychological and

Chapter 6
124
behavioural affects of utilising a BCI system on the user would more importantly give an insight
into the origins of the EEG control feature and the extent to which it can be independent of
neuromuscular control.
8) Extension of goals to promote diverse application development
The goal of current BCI technology focuses on developing a replacement communication medium
for the severely disabled. If the systems can manage to boost the bit-rates then applications
targeted at the widespread population such as multimedia, behaviour monitoring and video gaming
applications may come to fruition. It is important that the community distinguish between the goal
of aiding people with disabilities and the development of BCI systems and related applications.
The undermining of BCI technology by incorporating it with partial muscular means of
communication to aid the disabled will ultimately hinder progress but should remain a topic of
research for the rehabilitation engineering field. The prime direction for BCI research for the
present and near future will remain the improvement of the communication and control capabilities
for people with severe neuromuscular disorders.
9) Recognition as an interdisciplinary challenge
BCI research is a multidisciplinary endeavour that requires a broad base of skills from fields such
as neuroscience, clinical rehabilitation, psychology, computer science, engineering and
mathematics. To expedite the development of BCI technology requires the successful collaboration
and promulgation of research from these disciplines. This realization has encouraged the
establishment of broad-skill based BCI research groups, such as the Graz BCI group for example.
The emphasis should be put more on peer-reviewed research publications and specialized
workshops (e.g. [58,125]) to disseminate knowledge amidst the research community and less on
sensationalised media hype.
Concluding remarks…
Several groups have now shown that rats and monkeys can learn 3-D robotic control from
the invasive recordings of groups of motor neurons [204,205]. A 2-D control system was
demonstrated with scalp recorded mu rhythms in [69] but the degrees of freedom required for
adaptive automation of cognitive tasks, prosthetics and complex robots was reported to lie beyond
the range of scalp recorded EEG activity and current BCI methodologies.
As BCI technology is in its infancy, no one neuromechanism or approach stands out as the
most likely to succeed. In most cases the different BCI approaches are tailored for different needs
and intended applications. It is the author’s opinion that the biggest hurdle for making a dramatic

Chapter 6
125
breakthrough in this field no longer resides with the signal processing. The author believes that a
better understanding of the neurophysiology and the development of novel methods for acquiring
the neuronal signals offers a greater potential of dramatically improving the information transfer
rates compared with manipulating or interpreting the conventionally acquired signals.
As the field develops it is hoped that transfer capabilities and user friendliness will
improve dramatically to open the door for innovative applications targeted not only at individuals
with neuromuscular impairments but also the general population. It is the hope of the author that
some day in his lifetime, one would be capable of engaging in multimedia applications such as
internet browsing or computer gaming via this technology. Can this technology advance to the
stages where our brain signals can be decoded to the extent that this medium may offer a means of
telepathy? Will it greatly benefit society? Although the author is extremely dubious of BCI
technology extending this far, history has a terrible habit of exposing narrow-minds in science and
hence the author concludes his work in this thesis with an optimistic view of the future of this
technology.

Bibliography
126
Bibliography
[1] Vidal, J. J. "Real-time detection of brain events in EEG." Proceedings of the IEEE, Vol. 65, Iss. 5, pp. 633-641. (1977).
[2] Berger, H. and Gloor, P. "Hans Berger on the electroencephalogram of man : the fourteen original reports on the human encephalogram." . (1969). Amsterdam ; Barking : Elsevier. 'Electroencephalography and Clinical Neurophysiology' supplement ; no.28.
[3] Bronzino, J. D. "The Principles of Electroencephalography." The biomedical engineering handbook. Vol. 2nd ed, pp. 201-212. (2000). Boca Raton, Fla. : CRC Press.
[4] Collura, T. F. "History and evolution of electroencephalographic instruments and techniques." Clinical Neurophysiology, Vol. 10, Iss. 4, pp. 476-504. (1993).
[5] Niedermeyer, E. and Lopes Da Silva, F. "Electroencephalography: Basic Principles, Clinical Applications and Related Fields." , Vol. 4. (1999). Baltimore, Lippincott Williams & Wilkins.
[6] Van Heertum, R. L. and Tikofsky, R. S. "Functional cerebral SPECT and PET imaging." , Vol. 3rd ed. (2000). Philadelphia, Pa. ; London : Lippincott Williams & Wilkins.
[7] Sato, S. "Magnetoencephalography." . (1990). New York : Raven Press. Advances in neurology ; v. 54.
[8] Jezzard, P., Matthews, P. M., and Smith, S. M. "Functional MRI : an introduction to methods." . (2001). Oxford : Oxford University Press.
[9] Carlson, N. R. "Foundations of physiological psychology." , Vol. 5th ed. (2002). Boston, Mass. ; London : Allyn and Bacon.
[10] Nunez, P. L. and Cutillo, B. A. "Neocortical dynamics and human EEG rhythms." . (1995). New York ; Oxford : Oxford University Press.
[11] Atwood, H. L. and MacKay, W. A. "Essentials of neurophysiology." . (1989). Toronto ; Philadelphia : B. C. Decker.
[12] Allison, B. "Brain computer interface systems." (1999) http://bci.ucsd.edu/
[13] Carlson, N. R. "Structure and Functions of the Nervous System." Foundations of physiological psychology. Vol. 5th ed, Iss. 3. (2002). Boston, Mass. ; London : Allyn and Bacon.
[14] Fisch, B. J. and Spehlmann, R. "Fisch and Spehlmann's EEG primer : basic principles of digital and analog EEG." , Vol. 3rd rev. and enlarged ed. (1999). Amsterdam ; Oxford : Elsevier.
[15] Jasper, H. H. "Report of the committee on methods of clinical examination in electroencephalography: The ten-twenty electrode system of the International Federation." Electroencephalography and Clinical Neurophysiology, Vol. 10, Iss. 2, pp. 371-375. (1958).
[16] Oostenveld, R. and Praamstra, P. "The five percent electrode system for high-resolution EEG and ERP measurements." Clinical Neurophysiology, Vol. 112, Iss. 4, pp. 713-719. (2001).
[17] Kondraske, G. V. "Neurophysical measurements." Bronzino, Joseph D. The Biomedical Engineering and Instrumentation. Vol. 2nd ed, pp. 138-179. (1986). Boston, PWS Publishing.

Bibliography
127
[18] Bickford, R. D. "Electroencephalography." Adelman, George. Encyclopedia of neuroscience. pp. 371-373. (1987). Boston : Birkhäuser, 1987.
[19] Misulis, K. E. "Spehlmann's Evoked Potential Primer." . (1994). MA, USA, Butterworth-Heinemann.
[20] Teplan, M. "Fundamentals of EEG Measurement." Measurement Science Review, Vol. 2, Iss. 2, pp. 1-11. (2002).
[21] Gratton, G., Coles, M. G., and Donchin, E. "A new method for off-line removal of ocular artifact." Electroencephalography and Clinical Neurophysiology, Vol. 55, Iss. 4, pp. 468-484. (1983).
[22] Filligoi, G. C., Capitanio, L., Babiloni, F., Fattorini, L., Urbano, A., and Cerutti, S. "Reduction of ocular artefacts in source current density brain mappings by ARX2 filtering." Medical Engineering & Physics, Vol. 17, Iss. 4, pp. 282-290. (1995).
[23] Hae-Jeong Park, Do-Un Jeong, and Kwang-Suk Park. "Automated detection and elimination of periodic ECG artifacts in EEG using the energy interval histogram method." Biomedical Engineering, IEEE Transactions on, Vol. 49, Iss. 0018-9294, pp. 1526-1533. (2002).
[24] Whitton, J. L., Lue, F., and Moldofsky, H. "A spectral method for removing eye movement artifacts from the EEG." Electroencephalography and Clinical Neurophysiology, Vol. 44, Iss. 6, pp. 735-741. (1978).
[25] Jung, T. P., Makeig, S., Westerfield, M., Townsend, J., Courchesne, E., and Sejnowski, T. J. "Removal of eye activity artifacts from visual event-related potentials in normal and clinical subjects." Clinical Neurophysiology: Official Journal of the International Federation of Clinical Neurophysiology, Vol. 111, Iss. 10, pp. 1745-1758. (2000).
[26] Makeig, S., Jung, T. P., Bell, A. J., Ghahremani, D., and Sejnowski, T. J. "Blind separation of auditory event-related brain responses into independent components." Proceedings Of The National Academy Of Sciences Of The United States Of America, Vol. 94, Iss. 20, pp. 10979-10984. (1997).
[27] Jung, T. P., Makeig, S., Westerfield, M., Townsend, J., Courchesne, E., and Sejnowski, T. J. "Analysis and visualization of single-trial event-related potentials." Human Brain Mapping, Vol. 14, Iss. 3, pp. 166-185. (2001).
[28] Jung, T. P., Makeig, S., Humphries, C., Lee, T. W., McKeown, M. J., Iragui, V., and Sejnowski, T. J. "Removing electroencephalographic artifacts by blind source separation." Psychophysiology, Vol. 37, Iss. 2, pp. 163-178. (2000).
[29] Klimesch, W. "EEG alpha and theta oscillations reflect cognitive and memory performance: a review and analysis." Brain Research Reviews, Vol. 29, Iss. 2-3, pp. 169-195. (1999).
[30] Niedermeyer, E. and Lopes da Silva, F. H. "Chapter 9." Electroencephalography: Basic Principles, Clinical Applications and Related Fields. Vol. 4th ed, Iss. 9, pp. 149-173. (1999). London, Philadelphis ; London : Williams & Wilkins.
[31] Klimesch, W., Doppelmayr, M., Russegger, H., Pachinger, T., and Schwaiger, J. "Induced alpha band power changes in the human EEG and attention." Neuroscience Letters, Vol. 244, Iss. 2, pp. 73-76. (1998).
[32] Gevins, A. S. and Remond, A. "Handbook of Electroencephalography and Clinical Neurophysiology : Methods of analysis of brain electrical and magnetic signals." . (1987). Amsterdam : Elsevier. Revised Series ; vol. 1.

Bibliography
128
[33] Birbaumer, N. "The thought translation device (TTD) for completely paralyzed patients." Rehabilitation Engineering, IEEE Transactions on [see also IEEE Trans.on Neural Systems and Rehabilitation], Vol. 8, Iss. 2, pp. 190-193. (2000).
[34] Sayers, B. M., Beagley, H. A., and Henshall, W. R. "Mechanism of auditory evoked responses." Nature, Vol. 247, pp. 481-483. (1974).
[35] Sutter, E. E. "The visual evoked response as a communication channel." Proc.IEEE / NSF Symp.Biosensors, pp. 95-100. (1984).
[36] Middendorf, M., McMillan, G. R., Calhoun, G. L., and Jones, K. S. "Brain-computer interfaces based on the steady-state visual-evoked response." Rehabilitation Engineering, IEEE Transactions on [see also IEEE Trans.on Neural Systems and Rehabilitation], Vol. 8, Iss. 2, pp. 211-214. (2000).
[37] Donchin, E. "The mental prosthesis: assessing the speed of a P300-based brain-computer interface." Rehabilitation Engineering, IEEE Transactions on [see also IEEE Trans.on Neural Systems and Rehabilitation], Vol. 8, Iss. 2, pp. 174-179. (2000).
[38] Pfurtscheller, G. and Neuper, C. "Motor imagery and direct brain-computer communication." Proceedings of the IEEE, Vol. 89, Iss. 0018-9219, pp. 1123-1134. (2001).
[39] Babiloni, F., Cincotti, F., Lazzarini, L., Millan, J., Mourino, J., Varsta, M., Heikkonen, J., Bianchi, L., and Marciani, M. G. "Linear classification of low-resolution EEG patterns produced by imagined hand movements." IEEE Transactions on Rehabilitation Engineering, Vol. 8, Iss. 2, pp. 186-188. (2000).
[40] Babiloni, F., Cincotti, F., Bianchi, L., Pirri, G., del, R. M., Mourino, J., Salinari, S., and Grazia Marciani, M. "Recognition of imagined hand movements with low resolution surface Laplacian and linear classifiers." Medical Engineering & Physics, Vol. 23, Iss. 5, pp. 323-328. (2001).
[41] Bozorgzadeh, Z. "The LF-ASD brain computer interface: on-line identification of imagined finger flexions in the spontaneous EEG of able-bodied subjects." IEEE Conference Proceeding, Vol. 6, pp. 2385-2388. (2000).
[42] Cincotti, F. "Brain computer interface: the use of low resolution surface Laplacian and linear classifiers for the recognition of imagined hand movements." IEEE Conference Proceeding, Vol. 1, Iss. 1094-687X, pp. 655-658. (2001).
[43] He Sheng Liu, Xiaorong Gao, Fusheng Yang, and Shangkai Gao. "Imagined hand movement identification based on spatio-temporal pattern recognition of EEG." IEEE Conference Proceeding, pp. 599-602. (2003).
[44] Ramoser, H. "Optimal spatial filtering of single trial EEG during imagined hand movement." Rehabilitation Engineering, IEEE Transactions on [see also IEEE Trans.on Neural Systems and Rehabilitation], Vol. 8, Iss. 2, pp. 441-446. (2000).
[45] Pfurtscheller, G. "Separability of EEG signals recorded during right and left motor imagery using adaptive autoregressive parameters." Rehabilitation Engineering, IEEE Transactions on [see also IEEE Trans.on Neural Systems and Rehabilitation], Vol. 6, Iss. 2, pp. 316-325. (1998).
[46] Pfurtscheller, G. and Neuper, C. "Motor imagery activates primary sensorimotor area in humans." Neuroscience Letters, Vol. 239, Iss. 2-3, pp. 65-68. (1997).
[47] Pfurtscheller, G. and Aranibar, A. "Event-related cortical desynchronization detected by power measurements of scalp EEG." Electroencephalography and Clinical Neurophysiology, Vol. 42, Iss. 6, pp. 817-826. (1977).

Bibliography
129
[48] Pfurtscheller, G. "EEG event-related desynchronization (ERD) and synchronization (ERS)." Electroencephalography and Clinical Neurophysiology, Vol. 103, Iss. 1, pp. 26. (1997).
[49] Pfurtscheller, G. and Lopes da Silva, F. H. "Event-related EEG/MEG synchronization and desynchronization: basic principles." Clinical Neurophysiology, Vol. 110, Iss. 11, pp. 1842-1857. (1999).
[50] Pfurtscheller, G. "Current trends in Graz brain-computer interface (BCI) research." Rehabilitation Engineering, IEEE Transactions on [see also IEEE Trans.on Neural Systems and Rehabilitation], Vol. 8, Iss. 2, pp. 216-219. (2000).
[51] Pfurtscheller, G. "Functional brain imaging based on ERD/ERS." Vision Research, Vol. 41, Iss. 10-11, pp. 1257-1260. (2001).
[52] Pfurtscheller, G. "Graz-bci: state of the art and clinical applications." Neural Systems and Rehabilitation Engineering, IEEE Transactions on [see also IEEE Trans.on Rehabilitation Engineering], Vol. 11, Iss. 2, pp. 177-180. (2003).
[53] O'Hair, D. E. "Biofeedback: Review, history and applications." (1998) http://members.cts.com/crash/d/deohair/psychoph.html
[54] Mills, G. K. and Solyom, L. "Biofeedback of EEG alpha in the treatment of obsessive ruminations: An exploration." Journal of Behavior Therapy and Experimental Psychiatry, Vol. 5, Iss. 1, pp. 37-41. (1974).
[55] Neumann, N., Kubler, A., Kaiser, J., Hinterberger, T., and Birbaumer, N. "Conscious perception of brain states: mental strategies for brain-computer communication." Neuropsychologia, Vol. 41, Iss. 8, pp. 1028-1036. (2003).
[56] Vernon, D., Egner, T., Cooper, N., Compton, T., Neilands, C., Sheri, A., and Gruzelier, J. "The effect of training distinct neurofeedback protocols on aspects of cognitive performance." International Journal of Psychophysiology, Vol. 47, Iss. 1, pp. 75-85. (2003).
[57] Wolpaw, J. R., Birbaumer, N., McFarland, D. J., Pfurtscheller, G., and Vaughan, T. M. "Brain-computer interfaces for communication and control." Clinical Neurophysiology, Vol. 113, Iss. 6, pp. 767-791. (2002).
[58] Wolpaw, J. R. "Brain-computer interface technology: a review of the first international meeting." Rehabilitation Engineering, IEEE Transactions on [see also IEEE Trans.on Neural Systems and Rehabilitation], Vol. 8, Iss. 2, pp. 164-173. (2000).
[59] Donchin, E., Spencer, K. M., and Wijesinghe, R. "The mental prosthesis: assessing the speed of a P300-based brain-computer interface." Rehabilitation Engineering, IEEE Transactions on [see also IEEE Trans.on Neural Systems and Rehabilitation], Vol. 8, Iss. 2, pp. 174-179. (2000).
[60] Keirn, Z. A. and Aunon, J. I. "A new mode of communication between man and his surroundings." Biomedical Engineering, IEEE Transactions on, Vol. 37, Iss. 12, pp. 1209-1214. (1990).
[61] Penny, W. D. "EEG-based communication: a pattern recognition approach." Rehabilitation Engineering, IEEE Transactions on [see also IEEE Trans.on Neural Systems and Rehabilitation], Vol. 8, Iss. 2, pp. 214-215. (2000).
[62] Birbaumer, N. "A spelling device for the completely paralyzed." Nature, Vol. 398, pp. 297-298. (1999).
[63] Birbaumer, N., Kubler, A., Ghanayim, N., Hinterberger, T., Perelmouter, J., Kaiser, J., Iversen, I., Kotchoubey, B., Neumann, N., and Flor, H. "The thought translation device (TTD) for completely

Bibliography
130
paralyzed patients." Rehabilitation Engineering, IEEE Transactions on [see also IEEE Trans.on Neural Systems and Rehabilitation], Vol. 8, Iss. 2, pp. 190-193. (2000).
[64] Birbaumer, N. "The thought-translation device (ttd): neurobehavioral mechanisms and clinical outcome." Neural Systems and Rehabilitation Engineering, IEEE Transactions on [see also IEEE Trans.on Rehabilitation Engineering], Vol. 11, Iss. 2, pp. 120-123. (2003).
[65] Neuper, C., Muller, G. R., Kubler, A., Birbaumer, N., and Pfurtscheller, G. "Clinical application of an EEG-based brain-computer interface: a case study in a patient with severe motor impairment." Clinical Neurophysiology, Vol. 114, pp. 399-409. (2003).
[66] Wolpaw, J. R., McFarland, D. J., Neat, G. W., and Forneris, C. A. "An EEG-based brain-computer interface for cursor control." Electroencephalography and Clinical Neurophysiology, Vol. 78, Iss. 3, pp. 252-259. (1991).
[67] Wolpaw, J. R. and McFarland, D. J. "Multichannel EEG-based brain-computer communication." Electroencephalography and Clinical Neurophysiology, Vol. 90, Iss. 6, pp. 444-449. (1994).
[68] Wolpaw, J. R. "Brain-computer interface research at the Wadsworth Center." Rehabilitation Engineering, IEEE Transactions on [see also IEEE Trans.on Neural Systems and Rehabilitation], Vol. 8, Iss. 2, pp. 222-226. (2000).
[69] Wolpaw, J. R. "The wadsworth center brain-computer interface (bci) research and development program." Neural Systems and Rehabilitation Engineering, IEEE Transactions on [see also IEEE Trans.on Rehabilitation Engineering], Vol. 11, Iss. 2, pp. 204-207. (2003).
[70] Kubler, A., Kotchoubey, B., Kaiser, J., Wolpaw, J. R., and Birbaumer, N. "Brain-Computer Communication: Unlocking the Locked In*1." Psychological Bulletin, Vol. 127, Iss. 3, pp. 358-375. (2001).
[71] Mason, S. G. "A brain-controlled switch for asynchronous control applications." Biomedical Engineering, IEEE Transactions on, Vol. 47, Iss. 10, pp. 1297-1307. (2000).
[72] Mason, S. G. "A general framework for brain-computer interface design." Neural Systems and Rehabilitation Engineering, IEEE Transactions on [see also IEEE Trans.on Rehabilitation Engineering], Vol. 11, Iss. 1, pp. 70-85. (2003).
[73] Millan, J., Franze, M., Mourino, J., Cincotti, F., and Babiloni, F. "Relevant EEG features for the classification of spontaneous motor-related tasks." Biol Cybern., Vol. 86, Iss. 2, pp. 89-95. (2002).
[74] Blankertz, B. "Boosting bit rates and error detection for the classification of fast-paced motor commands based on single-trial eeg analysis." Neural Systems and Rehabilitation Engineering, IEEE Transactions on [see also IEEE Trans.on Rehabilitation Engineering], Vol. 11, Iss. 2, pp. 127-131. (2003).
[75] Muller-Gerking, J., Pfurtscheller, G., and Flyvbjerg, H. "Designing optimal spatial filters for single-trial EEG classification in a movement task." Clinical Neurophysiology, Vol. 110, Iss. 5, pp. 787-798. (1999).
[76] Vigon, L., Saatchi, M. R., Mayhew, J. E. W., and Fernandes, R. "Quantitative evaluation of techniques for ocular artefact filtering of EEG waveforms." Science, Measurement and Technology, IEE Proceedings-, Vol. 147, Iss. 5, pp. 219-228. (2000).
[77] Rao, K. D. and Reddy, D. C. "On-line method for enhancement of electroencephalogram signals in presence of electro-oculogram artefacts using nonlinear recursive least squares technique." Med Biol Eng Comput, Vol. 33, Iss. 3 Spec No, pp. 488-491. (1995).

Bibliography
131
[78] Panych, L. P., Wada, J. A., and Beddoes, M. P. "Practical digital filters for reducing EMG artefact in EEG seizure recordings." Electroencephalography and Clinical Neurophysiology, Vol. 72, Iss. 3, pp. 268-276. (1989).
[79] Cardoso, J.-F. "Blind signal seperation: statistical principles." Proceedings of the IEEE, Vol. 9, Iss. 10, pp. 2009-2025. (1998).
[80] Lagerlund, T. D., Sharbrough, F. W., and Busacker, N. E. "Spatial filtering of multichannel electroencephalographic recordings through principal component analysis by singular value decomposition." J.Clin.Neurophysiol., Vol. 14, Iss. 1, pp. 73-82. (1997).
[81] Amari, S.-I., Hyvarinen, A., Lee, S. Y., Lee, T. W., and Sanchez, A. "Blind signal separation and independent component analysis." Neurocomputing, Vol. In Press, Corrected Proof. (1990).
[82] Hyvarinen, A. and Pajunen, P. "Nonlinear independent component analysis: Existence and uniqueness results." Neural Networks, Vol. 12, Iss. 3, pp. 429-439. (1999).
[83] Parra, L. "Converging evidence of linear independent components in EEG." IEEE Conference Proceeding, pp. 525-528. (2003).
[84] Jung, T. P. "Removing electroencephalographic artifacts: comparison between ICA and PCA." IEEE Conference Proceeding, pp. 63-72. (1998).
[85] Lee, T. W. "Independent component analysis : theory and applications." . (1998). Boston ; London : Kluwer Academic.
[86] Hyvarinen, A. and Oja, E. "Independent component analysis: algorithms and applications." Neural Networks, Vol. 13, Iss. 4-5, pp. 411-430. (2000).
[87] Hyvärinen, A., Karhunen, J., and Oja, E. "Independent component analysis." . (2001). New York ; Chichester : Wiley, c2001. Adaptive and learning systems for signal processing, communications, and control.
[88] Stone, J. V. "Independent component analysis: an introduction." Trends in Cognitive Sciences, Vol. 6, Iss. 2, pp. 59-64. (2002).
[89] Jung, T. P., Makeig, S., Westerfield, M., Townsend, J., Courchesne, E., and Sejnowski, T. J. "Analysis and visualization of single-trial event-related potentials." Human Brain Mapping, Vol. 14, Iss. 3, pp. 166-185. (2001).
[90] Makeig, S., Westerfield, M., Jung, T. P., Enghoff, S., Townsend, J., Courchesne, E., and Sejnowski, T. J. "Dynamic brain sources of visual evoked responses." Science, Vol. 295, Iss. 5, pp. 690-694. (2002).
[91] Muller, T., Ball, T., Kristeva-Feige, R., Mergner, Th., and Timmer, J. "Selecting relevant electrode positions for classification tasks based on the electro-encephalogram." Med Biol Eng Comput, Vol. 38, Iss. 1, pp. 62-70. (2000).
[92] Kelly, S., Burke, D., deChazal, P., and Reilly, R. "Parametric Models and spectral analysis for Classification in Brain-Computer Interfaces." IEEE Conference Proceeding. (2002). 14th International Conference on Digital Signal Processing.
[93] Birbaumer, N. "Slow cortical potentials: Their origin, meaning and clinical use." Böcker, K. B. E., Boxtel, G. J. M., and Brunia Cornelis, Henri Marie. Brain and behavior : past, present, and future : proceedings of the symposium organized on the occasion of C.H.M. Brunia becoming professor emeritus, Tilburg, The Netherlands, June 20, 1997. (1997). Tilburg : Tilburg University Press.

Bibliography
132
[94] Pfurtscheller, G., Neuper, C., Flotzinger, D., and Pregenzer, M. "EEG-based discrimination between imagination of right and left hand movement." Electroencephalography and Clinical Neurophysiology, Vol. 103, Iss. 6, pp. 642-651. (1997).
[95] Jeannerod, M. and Frak, V. "Mental imaging of motor activity in humans." Current Opinion in Neurobiology, Vol. 9, Iss. 6, pp. 735-739. (1999).
[96] Pineda, J. A. "The effects of self-movement, observation, and imagination on /spl mu/ rhythms and readiness potentials (RP's): toward a brain-computer interface (BCI)." Rehabilitation Engineering, IEEE Transactions on [see also IEEE Trans.on Neural Systems and Rehabilitation], Vol. 8, Iss. 2, pp. 219-222. (2000).
[97] Sutter, E. E. "The brain response interface: Communication through visually-induced electrical brain response." Journal of Microcomputer Applications, Vol. 15, pp. 31-45. (1992).
[98] Cilliers, P. J. and Van Der Kouwe, A. J. W. "A VEP-based computer interface for C2-ouadriplegics." IEEE Conference Proceeding, pp. 1263. (1993).
[99] Liavas, A., Moustakides, G., Henning, G., Psarakis, E., and Husar, P. "On the detection of steady-state visually evoked potentials." IEEE Conference Proceeding, Vol. 3, pp. 946-947. (1996).
[100] Ming, C., Xiaorong, G., Shangkai, G., and Dingfeng, X. "Design and implementation of a brain-computer interface with high transfer rates." Biomedical Engineering, IEEE Transactions on, Vol. 49, Iss. 10, pp. 1181-1186. (2002).
[101] Costa, E. J. X. and CabralJr, E. F. "EEG-based discrimination between imagination of left and right hand movements using adaptive gaussian representation." Medical Engineering & Physics, Vol. 22, Iss. 5, pp. 345-348. (2000).
[102] Birch, G. E. "Initial on-line evaluations of the LF-ASD brain-computer interface with able-bodied and spinal-cord subjects using imagined voluntary motor potentials." Neural Systems and Rehabilitation Engineering, IEEE Transactions on [see also IEEE Trans.on Rehabilitation Engineering], Vol. 10, Iss. 4, pp. 219-224. (2002).
[103] Graimann, B., Huggins, J. E., Levine, S. P., and Pfurtscheller, G. "Visualization of significant ERD/ERS patterns in multichannel EEG and ECoG data." Clinical Neurophysiology, Vol. 113, Iss. 1, pp. 43-47. (2002).
[104] Bianchi, A. M. "Time frequency analysis and spatial filtering in the evaluation of beta ERS after finger movement." IEEE Conference Proceeding, Vol. 1, pp. 990-993. (2001).
[105] Graimann, B. "Detection of ERP and ERD/ERS patterns in single ECoG channels." IEEE Conference Proceeding, pp. 614-617. (2003).
[106] Pfurtscheller, G., Kalcher, J., Neuper, C., Flotzinger, D., and Pregenzer, M. "On-line EEG classification during externally-paced hand movements using a neural network-based classifier." Electroencephalography and Clinical Neurophysiology, Vol. 99, Iss. 5, pp. 416-425. (1996).
[107] Guger, C. "Real-time EEG analysis with subject-specific spatial patterns for a brain-computer interface (BCI)." Rehabilitation Engineering, IEEE Transactions on [see also IEEE Trans.on Neural Systems and Rehabilitation], Vol. 8, Iss. 4, pp. 447-456. (2000).
[108] Blum, A. L. and Langley, P. "Selection of relevant features and examples in machine learning." Artif.Intell., Vol. 97, pp. 245-271. (1997).
[109] Kwak, N. "Input feature selection by mutual information based on Parzen window." Pattern Analysis and Machine Intelligence, IEEE Transactions on, Vol. 24, pp. 1667-1671. (2002).

Bibliography
133
[110] Yom-Tov, E. "Feature Selection for the Classification of Movements From Single Movement-Related Potentials." IEEE Trans Neural Syst Rehabil Eng, Vol. 10, Iss. 3, pp. 170-176. (2002).
[111] Schroder, M. "Automated EEG feature selection for brain computer interfaces." IEEE Conference Proceeding, pp. 626-629. (2003).
[112] Keirn, Z. A. and Aunon, J. I. "Man-machine communications through brain-wave processing." Engineering in Medicine and Biology Magazine, IEEE, Vol. 9, Iss. 1, pp. 55-57. (1990).
[113] Pfurtscheller, G., Flotzinger, D., and Neuper, C. "Differentiation between finger, toe and tongue movement in man based on 40 Hz EEG." Electroencephalography and Clinical Neurophysiology, Vol. 90, Iss. 6, pp. 456-460. (1994).
[114] Pfurtscheller, G., Flotzinger, D., and Kalcher, J. "Brain-Computer Interface--a new communication device for handicapped persons." Journal of Microcomputer Applications, Vol. 16, Iss. 3, pp. 293-299. (1993).
[115] Calhoun, G. L. and McMillan, G. R. "EEG-based control for human-computer interaction." IEEE Conference Proceeding, pp. 4-9. (1996).
[116] Cheng, M. and Gao, S. "An EEG-based cursor control system." IEEE Conference Proceeding, Vol. 1, pp. 669. (1999).
[117] Farwell, L. A. and Donchin, E. "Talking off the top of your head: toward a mental prosthesis utilizing event-related brain potentials." Electroencephalography and Clinical Neurophysiology, Vol. 70, Iss. 6, pp. 510-523. (1988).
[118] Muller, K. "Linear and nonlinear methods for brain-computer interfaces." Neural Systems and Rehabilitation Engineering, IEEE Transactions on [see also IEEE Trans.on Rehabilitation Engineering], Vol. 11, Iss. 2, pp. 165-169. (2003).
[119] Duda, R. O., Hart, P. E., and Stork, D. G. "Pattern Classification." , Vol. 2. (2001). Wiley & Sons, Inc.
[120] Kalcher, J. "Graz brain-computer interface: an EEG-based cursor control system." IEEE Conference Proceeding, pp. 1264-1265. (1993).
[121] Pfurtscheller, G., Neuper, C., Guger, C., Harkam, W., Ramoser, H., Schlogl, A., Obermaier, B., and Pregenzer, M. "Current trends in Graz brain-computer interface (BCI) research." Rehabilitation Engineering, IEEE Transactions on [see also IEEE Trans.on Neural Systems and Rehabilitation], Vol. 8, Iss. 2, pp. 216-219. (2000).
[122] Roberts, S. J. and Penny, W. D. "Real-time brain-computer interfacing: a preliminary study using Bayesian learning." Med Biol Eng Comput, Vol. 38, Iss. 1, pp. 56-61. (2000).
[123] Kostov, A. and Polak, M. "Parallel man-machine training in development of EEG-based cursor control." Rehabilitation Engineering, IEEE Transactions on [see also IEEE Trans.on Neural Systems and Rehabilitation], Vol. 8, Iss. 2, pp. 203-205. (2000).
[124] McFarland, D. J., McCane, L. M., and Wolpaw, J. R. "EEG-based communication and control: short-term role of feedback." Rehabilitation Engineering, IEEE Transactions on [see also IEEE Trans.on Neural Systems and Rehabilitation], Vol. 6, Iss. 1, pp. 7-11. (1998).
[125] Vaughan, T. M. "Guest editorial brain-computer interface technology: a review of the second international meeting." Neural Systems and Rehabilitation Engineering, IEEE Transactions on [see also IEEE Trans.on Rehabilitation Engineering], Vol. 11, Iss. 2, pp. 94-109. (2003).

Bibliography
134
[126] Kennedy, P. R. "Direct control of a computer from the human central nervous system." Rehabilitation Engineering, IEEE Transactions on [see also IEEE Trans.on Neural Systems and Rehabilitation], Vol. 8, Iss. 2, pp. 198-202. (2000).
[127] Levine, S. P. "A direct brain interface based on event-related potentials." Rehabilitation Engineering, IEEE Transactions on [see also IEEE Trans.on Neural Systems and Rehabilitation], Vol. 8, Iss. 2, pp. 180-185. (2000).
[128] Kennedy, P. R. and Bakay, R. A. "Restoration of neural output from a pralyzed patient by a direct brain connection." Neuroreport, Vol. 9, pp. 1707-1711. (1998).
[129] Millan, J. R., Hauser, A., and Renkens, F. "Adaptive brain interfaces - ABI: simple features, simple neural network, complex brain-actuated devices." IEEE Conference Proceeding, Vol. 1, pp. 297-300. (2002).
[130] Millan, J. R. and Mourino, J. "Asynchronous BCI and local neural classifiers: an overview of the adaptive brain interface project." Neural Systems and Rehabilitation Engineering, IEEE Transactions on [see also IEEE Trans.on Rehabilitation Engineering], Vol. 11, Iss. 2, pp. 159-161. (2003).
[131] Mackay, A. M., Bradnam, M. S., and Hamilton, R. "Rapid detection of threshold VEPs." Clinical Neurophysiology, Vol. 114, Iss. 6, pp. 1009-1020. (2003).
[132] Cincotti, F. "The use of eeg modifications due to motor imagery for brain~computer interfaces." Neural Systems and Rehabilitation Engineering, IEEE Transactions on [see also IEEE Trans.on Rehabilitation Engineering], Vol. 11, Iss. 2, pp. 131-133. (2003).
[133] Hoffmann, K., Niedner, H., and Witte, H. "Identification of left and right hemifield checkerboard VEP by means of reduced numbers of averages and single sweeps." Electroencephalography and Clinical Neurophysiology, Vol. 103, Iss. 1, pp. 145. (1997).
[134] Davila, C. E., Srebro, R., and Ghaleb, I. A. "Optimal detection of visual evoked potentials." Biomedical Engineering, IEEE Transactions on, Vol. 45, Iss. 6, pp. 800-803. (1998).
[135] Jones, K. S., Middendorf, M., McMillan, G. R., Calhoun, G., and Warm, J. "Comparing mouse and steady-state visual evoked response-based control." Interacting with Computers, Vol. 15, Iss. 4, pp. 603-621. (2003).
[136] Lutzenberger, W., Elbert, T., Rockstroh, B., and Birbaumer, N. "Biofeedback of slow cortical potentials. II. Analysis of single event-related slow potentials by time-series analysis*1." Electroencephalography and Clinical Neurophysiology, Vol. 48, Iss. 3, pp. 302-311. (1980).
[137] Elbert, T., Rockstroh, B., Lutzenberger, W., and Birbaumer, N. "Biofeedback of slow cortical potentials. I*1." Electroencephalography and Clinical Neurophysiology, Vol. 48, Iss. 3, pp. 293-301. (1980).
[138] McFarland, D. J., Lefkowicz, A. T., and Wolpaw, J. R. "Design and operation of an EEG-based brain-computer interface (BCI) with digital signal processing technology." Behav.Res.Meth.Instrum.Comput., Vol. 29, pp. 337-345. (1997).
[139] Guger, C., Schlogl, A., Walterspacher, D., and Pfurtscheller, G. "Design of an EEG-based brain-computer interface (BCI) from standard components running in real-time under Windows." Biomedizinische Technik.Biomedical Engineering, Vol. 44, pp. 12-16. (1999).
[140] Polak, M. "Feature extraction in development of brain-computer interface: a case study." IEEE Conference Proceeding, Vol. 4, pp. 2058-2061. (1998).

Bibliography
135
[141] Blankertz, B., Curio, G., and Muller, K. R. "Classifying Single Trial EEG: Towards Brain Computer Interfacing." Diettrich, G., Becker, S., and Ghahramani, Z. Advances In Neural Information Processing Systems, Iss. 14. (2002). MIT Press.
[142] Sajda, P., Gerson, A., Muller, K. R., Blankertz, B., and Parra, L. "A data analysis competition to evaluate machine learning algorithms for use in brain-computer interfaces." Neural Systems and Rehabilitation Engineering, IEEE Transactions on [see also IEEE Trans.on Rehabilitation Engineering], Vol. 11, Iss. 2, pp. 184-185. (2003).
[143] Birch, G. E. "Brain-computer interface research at the Neil Squire Foundation." Rehabilitation Engineering, IEEE Transactions on [see also IEEE Trans.on Neural Systems and Rehabilitation], Vol. 8, Iss. 2, pp. 193-195. (2000).
[144] Birch, G. E. "Current trends in brain-computer interface research at the neil squire foundation." Neural Systems and Rehabilitation Engineering, IEEE Transactions on [see also IEEE Trans.on Rehabilitation Engineering], Vol. 11, Iss. 2, pp. 123-126. (2003).
[145] Blankertz, B., Muller, K. R., Curio, G., Vaughan, T. M., Schalk, G., Wolpaw, J. R., Schlogl, A., Neuper, C., Pfurtscheller, G., Hinterberger, T., Schroder, M., and Birbaumer, N. "The BCI competition 2003: Progress and perspectives in detection and discrimination of EEG single trials." IEEE Transactions on Biomedical Engineering, Vol. (accepted). (2004).
[146] Blankertz, B., Birbaumer, N., Wolpaw, J. R., Pfurtscheller, G., Schlogl, A., and Curio, G. "BCI Competition 2003." (2003) http://ida.first.fraunhofer.de/~blanker/competition/
[147] Bates, J. A. V. "Electrical activity of the cortex accompanying movements." Journal of Physiology (London), Vol. 113, pp. 240. (1951).
[148] Kornhuber, H. H. and Deecke, L. "Hirnpotentialänderungen beim Menschen vor und nach Willkürbewegungen, dargestellt mit Magnetbandspeicherung und Rückwärtsanalyse." Pflügers Arch, Vol. 281, Iss. 52. (1954).
[149] Kornhuber, H. H. and Deecke, L. "Hirnpotentialänderungen bei Willkürbewegungen und passiven Bewegungen des Menschen: Bereitschaftspotential und reafferente potentiale." Pflügers Arch, Vol. 284, pp. 1-17. (1965).
[150] Deecke, L., Scheid, R. P., and Kornhuber, H. H. "Distribution of readiness potential, pre-motion positivity and motor potential of the human cerebral cortex preceding voluntary finger movement." Experimental Brain Research, Vol. 7, pp. 158-168. (1969).
[151] Cerutti, S. "A parametric method of identification of single-trial event-related potentials in the brain." Biomedical Engineering, IEEE Transactions on, Vol. 35, pp. 701-711. (1988).
[152] Papakostopoulos, D., Cooper, R., and Crow, H. J. "Inhibition of cortical evoked potentials and sensation by self-initiated movement in man." Nature, Vol. 258, pp. 321-324. (1975).
[153] Lange, D. H. and Inbar, G. F. "A robust parametric estimator for single-trial movement related brain potentials." Biomedical Engineering, IEEE Transactions on, Vol. 43, Iss. 4, pp. 341-347. (1996).
[154] Augusto Chiarenza, G., Papakostopoulos, D., Giordana, F., and Guareschi-Cazzullo, A. "Movement-related brain macropotentials during skilled performances. A developmental study." Electroencephalography and Clinical Neurophysiology, Vol. 56, Iss. 4, pp. 373-383. (1983).
[155] Lange, D. H., Pratt, H., and Inbar, G. F. "Modeling and estimation of single evoked brain potential components." Biomedical Engineering, IEEE Transactions on, Vol. 44, Iss. 9, pp. 791-799. (1997).

Bibliography
136
[156] Kristeva, R., Keller, E., Deecke, L., and Kornhuber, H. H. "Cerebral potentials preceding unilateral and simultaneous bilateral finger movements*1." Electroencephalography and Clinical Neurophysiology, Vol. 47, Iss. 2, pp. 229-238. (1979).
[157] Deecke, L., Grozinger, B., and Kornhuber, H. H. "Voluntary finger movement in man: Cerebral potentials and theory." Biological Cybernetics, Vol. 23, pp. 99-119. (1976).
[158] Chiarenza, G. A., Cerutti, S., and Liberati, D. "Analysis of single trial movement-related brain macropotential." International Journal of Psychophysiology, Vol. 16, Iss. 2-3, pp. 163-174. (1994).
[159] Creutzfeldt, O. "Cortex cerebri : performance, structural, and functional organization of the cortex." . (1995). Oxford ; New York : Oxford University Press. Oxford science publications.
[160] Deecke, L., Lang, W., Uhl, F., Beisteiner, R., Lindinger, G., and Cui, R. Q. "Experiments in Movement Using DC-EEG, MEG, SPECT and FMRI." Current Progress in Functional Brain Mapping - Science andApplications, pp. 53-60. (2003). Smith-Gordon & Co Ltd,London.
[161] Cui, R. Q., Huter, D., Lang, W., and Deecke, L. "Neuroimage of Voluntary Movement: Topography of the Bereitschaftspotential, a 64-Channel DC Current Source Density Study." NeuroImage, Vol. 9, Iss. 1, pp. 124-134. (1999).
[162] Ikeda, A., Luders, H. O., Burgess, R. C., and Shibasaki, H. "Movement-related potentials associated with single and repetitive movements recorded from human supplementary motor area*1." Electroencephalography and Clinical Neurophysiology/Evoked Potentials Section, Vol. 89, Iss. 4, pp. 269-277. (1993).
[163] Deecke, L. and Kornhuber, H. H. "An electrical sign of participation of the mesial 'supplementary' motor cortex in human voluntary finger movement." Brain Research, Vol. 159, Iss. 2, pp. 473-476. (1978).
[164] Deecke, L., Shibasaki, H., and Lang, W. "Movement related evoked potentials." Electroencephalography and Clinical Neurophysiology, Vol. 87, Iss. 2, pp. 17-25. (1993).
[165] Deecke, L. "Cortical voluntary movement physiology." Electroencephalography and Clinical Neurophysiology/Electromyography and Motor Control, Vol. 97, Iss. 4, pp. S9. (1995).
[166] Florian, G. and Pfurtscheller, G. "Dynamic spectral analysis of event-related EEG data." Electroencephalography and Clinical Neurophysiology, Vol. 95, Iss. 5, pp. 393-396. (1995).
[167] Pardey, J., Roberts, S., and Tarassenko, L. "A review of parametric modelling techniques for EEG analysis." Medical Engineering & Physics, Vol. 18, Iss. 1, pp. 2-11. (1996).
[168] Birch, G. E., Lawrence, P. D., Lind, J. C., and Hare, R. D. "Application of prewhitening to AR spectral estimation of EEG." Biomedical Engineering, IEEE Transactions on, Vol. 35, Iss. 8, pp. 640-645. (1988).
[169] Schlogl, A. and Pfurtscheller, G. "Considerations on Adaptive Autoregressive Modelling in EEG Analysis." Ghassemlooy, Z. and Saatchi, M. R. Proceedings of First International Symposium on Communication Systems and Digital Signal Processing, 1998 : 6-8 April 1998, Sheffield - UK. pp. 367-370. (1998). Sheffield : Sheffield Hallam University Press Learning Centre.
[170] Ghaleb, I., Davila, C. E., and Srebro, R. "Prewhitening of background brain activity via autoregressive modeling." IEEE Conference Proceeding, pp. 242-245. (1997).
[171] Perry, N. W. and Childers, D. G. "The human visual evoked response : method and theory." . (1969). Springfield, Ill. : Charles C. Thomas.

Bibliography
137
[172] Gevins, A. S. "Analysis of the electromagnetic signals of the human brain: Milestones, obstacles, and goals." IEEE Transactions on Biomedical Engineering, Vol. BME-31, pp. 833-850. (1984).
[173] Childers, D. G., Perry, N. W., Fischler, I. S., Boaz, T., and Arroyo, A. A. "Event related potentials: A critical review of methods for single trial detection." CRC Crit.Rev.Bioeng., Vol. 11. (1986).
[174] Jasper, H. H. "The ten-twenty electrode system of the International Federation." Electroencephalography and Clinical Neurophysiology, pp. 371-375. (1958).
[175] Crone, N. E., Miglioretti, D. L., Gordon, B., Sieracki, J. M., Wilson, M. T., Uematsu, S., and Lesser, R. P. "Functional mapping of human sensorimotor cortex with electrocorticographic spectral analysis: Alpha and beta event-related desynchronisation." Brain, Vol. 121, pp. 2271-2299. (1998).
[176] McEwen, J. and Anderson, G. "Modeling the stationarity and guassianity of spontaneous electroencephalographic activity." IEEE Transactions on Biomedical Engineering, Vol. BME-22, pp. 361-369. (1975).
[177] Haykin, S. S. "Adaptive filter theory." , Vol. 4th ed. (2002). Upper Saddle River NJ : Prentice Hall.
[178] Wei, W. W. S. "Time series analysis : univariate and multivariate methods." . (1990). Redwood City, Calif. ; Wokingham : Addison-Wesley Pub.
[179] Widrow, B. and Stearns, S. D. "Adaptive signal processing." . (1985). Englewood Cliffs, N.J. ; london : Prentice-Hall. Prentice-Hall signal processing series.
[180] Haykin, S., Sayed, A. H., Zeidler, J. R., Yee, P., and Wei, P. C. "Adaptive tracking of linear time-variant systems by extended RLS algorithms." Signal Processing, IEEE Transactions on [see also Acoustics, Speech, and Signal Processing, IEEE Transactions on], Vol. 45, Iss. 5, pp. 1118-1128. (1997).
[181] Schlogl, A. "Using adaptive autoregressive parameters for a brain-computer-interface experiment." IEEE Conference Proceeding, Vol. 4, pp. 1533-1535. (1997).
[182] Schlogl, A., Flotzinger, D., and Pfurtscheller, G. "Adaptive autoregressive modeling used for single-trial EEG classification." Biomedizinische Technik.Biomedical Engineering, Vol. 42, pp. 162-167. (1997).
[183] Makhoul, J. "Linear Prediction: A Tutorial Overview." Proceedings of the IEEE, Vol. 63, Iss. 4, pp. 561-580. (1975).
[184] Guger, C. "Rapid prototyping of an EEG-based brain-computer interface (BCI)." Neural Systems and Rehabilitation Engineering, IEEE Transactions on [see also IEEE Trans.on Rehabilitation Engineering], Vol. 9, pp. 49-58. (2001).
[185] Lange, D. H. and Inbar, G. F. "Estimation of morphologically varying single evoked brain potentials." IEEE Conference Proceeding, pp. 217-218. (1994).
[186] Lange, D. H. and Inbar, G. F. "Parametric estimation of single morphologically varying evoked brain potentials." IEEE Conference Proceeding, pp. 1. (1995).
[187] Lange, D. H., Pratt, H., and Inbar, G. F. "Segmented matched filtering of single event related evoked potentials." Biomedical Engineering, IEEE Transactions on, Vol. 42, Iss. 3, pp. 317-321. (1995).
[188] Liberati, D. and Cerutti, S. "Bisensory Evoked Potentials: A Single-sweep Analysis Via Template Reference And Parametric Identification." IEEE Conference Proceeding, pp. 860-861. (1990).

Bibliography
138
[189] Liberati, D., Cerutti, S., Comi, G., and Locatelli, T. "Topographic mapping of single-sweep evoked potentials as a picture of the spatio-temporal dynamics in the brain." IEEE Conference Proceeding, pp. 721-722. (1989).
[190] Liberati, D., Cerutti, S., Pavesi, G., and Ventimiglia, E. "Single-sweep analysis of evoked potentials: definition of a reference signal." IEEE Conference Proceeding, pp. 976-977. (1988).
[191] Burke, D., Kelly, S., deChazal, P., and Reilly, R. "A Simultaneous Filtering and Feature Extraction Strategy for Direct Brain Interfacing." Proceedings of the 24th International Conference of the IEEE Eng.Med.and Biology. (2002).
[192] Akaike, H. "Fitting autoregressions for prediction." Ann.Inst.Stat.Math., Vol. 21, pp. 243-247. (1969).
[193] Priestley, M. B. "Spectral analysis and time series." , Vol. Repr. with corrections. (1981). London ; New York : Academic Press. Probability and mathematical statistics.
[194] Theodoridis, S. and Koutroumbas, K. "Pattern recognition." . (1998). San Diego, Calif. ; London : Academic Press.
[195] Skidmore, T. A. and Hill, H. W. "The Evoked Potential Human-computer Interface." IEEE Conference Proceeding, pp. 407-408. (1991).
[196] Regan, D. "Human brain electrophysiology : evoked potentials and evoked magnetic fields in science and medicine." . (1989). New York ; London : Elsevier.
[197] Morgan, S. T., Hansen, J. C., and Hillyard, S. A. "Selective attention to stimulus location modulates the steady-state visual evoked potential." Proceedings of the National Academy of Sciences, Vol. 93, Iss. 10, pp. 4770-4774. (1996).
[198] Burkitt, G. R., Silberstein, R. B., Cadusch, P. J., and Wood, A. W. "Steady-state visual evoked potentials and travelling waves." Clinical Neurophysiology, Vol. 111, Iss. 2, pp. 246-258. (2000).
[199] Mast, J. and Victor, J. D. "Fluctuations of steady-state VEPs: interaction of driven evoked potentials and the EEG." Electroencephalography and Clinical Neurophysiology, Vol. 78, Iss. 5, pp. 389-401. (1991).
[200] Liavas, A. P., Moustakides, G. V., Henning, G., Psarakis, E. Z., and Husar, P. "A periodogram-based method for the detection of steady-state visually evoked potentials." Biomedical Engineering, IEEE Transactions on, Vol. 45, Iss. 2, pp. 242-248. (1998).
[201] Davila, C. E. and Srebro, R. "Subspace averaging of steady-state visual evoked potentials." Biomedical Engineering, IEEE Transactions on, Vol. 47, Iss. 6, pp. 720-728. (2000).
[202] Davila, C. E., Abaye, A., and Khotanzad, A. "Estimation of single sweep steady-state visual evoked potentials by adaptive line enhancement." Biomedical Engineering, IEEE Transactions on, Vol. 41, Iss. 2, pp. 197-200. (1994).
[203] Liberty, J. "Learning C#." . (2002). Beijing ; Cambridge : O'Reilly.
[204] Taylor, D. M., Tillery, S. I. H., and Schwartz, A. B. "Information conveyed through brain-control: cursor versus robot." Neural Systems and Rehabilitation Engineering, IEEE Transactions on [see also IEEE Trans.on Rehabilitation Engineering], Vol. 11, Iss. 2, pp. 195-199. (2003).
[205] Donoghue, J. P. "Connecting cortex to machines: recent advances in brain interfaces." Nat.Neurosci., Vol. 5 Suppl, pp. 1085-1088. (2002).

I
Appendix A: List of BCI research groups worldwide
No. BCI Research Group and location Group Director / Principal
Researcher
1. Arizona State University, Neural Control Lab, AZ S. Tillery, D. Taylor
2. Brown University, Providence, RI Black, J. Donaghue
3. California Institute of Technology, Pasadena, CA M. Mojarradi
4. Colorado State University, Fort Collins, CO C. Anderson
5. Columbia University, New York L. Parra
6. DuPont Hospital for Children, University of Delaware Polikoff J.
7. EPFL, Federal Institute of Technology, Lausanne, Switzerland T. Ebrahimi, J-M Vesin
8. Florida International University A. Barretto
9. Georgia State University, Atlanta, GA M. Moore
10. Graz University of Technology, Institute for Biomedical Engineering, Department for
Medical Informatics, Graz, Austria G. Pfurtscheller, C. Neuper
11. Helsinki University of Technologie, Cognitive Science and Technology, Finland Mikko Sams
12. IDIAP, Dalle Molle Institute for Perceptual Artificial Intelligence, Switzerland Samy Bengio
13. Intelligent Data Analysis Group, Fraunhofer-FIRST, Berlin, Germany K.R. Müller
14. Joint Research Centre of the EU, Ispra, Italy. J. del R. Millan
15. NASA Ames Research Center, Moffett Field, CA L. J. Trejo
16. National Institute of Nervous System Disorders, Bethesda, MD W. J. Heetderks
17. National Chiao-Tong University, Taiwan Pei Chen Lo
18. Neil Squire Foundation, Vancouver, Canada G. Birch, S. Mason
19. Neuroprosthesis Research Organisation, Brooklyn, NY G. Gaal
20. Northwestern University and the Rehabilitation Institute of Chicago, Chicago, IL W. Z. Rymer
21. Oxford University, Great Britain S. Roberts, W. Penny
22. Reed Neurological Research Center, UCLA, Los Angeles, CA B. Dobkin
23. Rochester Institute of Technology, Rochester, NY J. Bayliss, D. Ballard
24. San Francisco Brain Research Institute and SAM Technology Inc, San Francisco, CA A. Gevins
25. Santa Lucia Foundation, IRCCS, Rome, Italy F. Cincotti
26. SUNY Health Science Center, Brooklyn, NY J. Chapin
27. Tsinghua University, Beijing, China G. Shangkai, G. Xiaorong, M. Cheng

II
28. Tulane University, New Orleans, LA P. Nunez
29. UCLA Computer Science Department J. Vidal
30. University College Dublin, Ireland A. de Paor, R. Reilly
31. University of Alberta, Edmonton, Canada M. Polak, A. Kostov
32. University of Bielefeld, Neuroinformatics Group, Germany H. Ritter
33. University of Illinois Urbana-Champaign, IL E. Donchin
34. Univerity of Tübingen, Germany N. Birbaumer, A. Kübler
35. University of California at Los Angeles, Department of Neurology, CA J. Pineda, B. Allison, B. Dobkin
36. University of California San Diego, Cognitive Neuroscience Lab. S. Makeig, B. Allison
37. University of Florida, Gainesville J. Principe
38. University of Geneva, FBML and CVML Pun, Michel
39. University of Malaga, Advanced Human Computer Interfaces, Spain L. Vazquez
40. University of Michigan, Ann Arbor, MI S. Levine, J. Huggins
41. University of Rome "Tor Vergata", Rome, Italy L. Bianchi
42. University of South Florida, Department of Psychology, Tampa, FL E. Donchin
43. Wadsworth Center, New York State Department of Health, Albany, NY J. Wolpaw, T. Vaughan

III
Appendix B: CD contents
SSVEP based video gaming application demonstration (Study 2 – Chapter 5)
SSVEP paper submitted
E. Lalor, S.P. Kelly, C. Finucane, R. Smith, R. Burke, R. B. Reilly, G. McDarby – “Steady-state
VEP-based Brain Computer Interface Control in an Immersive 3-D Gaming Environment ",
Journal of Applied Digital Signal Processing – Special issue on Brain Computer Interfaces. See
Appendix. (Submitted)

IV
Appendix C: Collaborative approach to our work in UCD
Prof. Ian H. Robertson
Trinity College Institute of Neuroscience (TCIN)
Dr. John J. Foxe
Nathan Kline Institute (NKI) for Psychiatric Research, NY
Dr. Richard Reilly
DSP Research Group, UCD
EEG team of 6 postgrads and postdocs
Dr. Sean Connolly, Neurophysiologist,
St. Vincent’s University Hospital
Dr. Gary Mc Darby
Media Lab Europe (MLE)
Dr. Nuala Brady
Dept. of Psychology, UCD
Dr. Gary Donohue
Dept. of Psychiatry, TCD
TCIN
NKI
UCD
MLE
ExperimentalProtocol
Acquisition
DSP
ApplicationDevelopment
NeurophysiologicalUnderstanding
Neurophysiology
Psychology
Rehabilitation
Engineering

V
Appendix D: Additional plots in MRP study

VI

VII

VIII
-0.45 -0.4 -0.35 -0.3 -0.25 -0.2 -0.15 -0.1 -0.05 0
-28
-26
-24
-22
-20
-18
-16
-14
-12
-10
Grand Average for Vol-L (922 Events) Paradigm - v
Rel
. Pot
entia
l (µV
)
time (s)
34
-0.45 -0.4 -0.35 -0.3 -0.25 -0.2 -0.15 -0.1 -0.05 0
-35
-30
-25
-20
-15
-10
Grand Average for Vol-R (918 Events) Paradigm - v
Rel
. Pot
entia
l (µV
)
t ime (s)
34
-0.45 -0.4 -0.35 -0.3 -0.25 -0.2 -0.15 -0.1 -0.05 0-0.8
-0.6
-0.4
-0.2
0
0.2
0.4
0.6
0.8Grand Average for Vol-L (922 Events) Paradigm - v
Rel
. Pot
entia
l (µV
)
t ime (s)
34
-0.45 -0.4 -0.35 -0.3 -0.25 -0.2 -0.15 -0.1 -0.05 0
-0.6
-0.4
-0.2
0
0.2
0.4
0.6
Grand Average for Vol-R (918 Events) Paradigm - v
Rel
. Pot
entia
l (µV
)
time (s)
34

IX
-0.45 -0.4 -0.35 -0.3 -0.25 -0.2 -0.15 -0.1 -0.05 0
-1
-0.8
-0.6
-0.4
-0.2
0
0.2
0.4
0.6
0.8
1
Grand Average for Vol-L (922 Events) Paradigm - v
Rel
. Pot
entia
l (µV
)
time (s)
34
-0.45 -0.4 -0.35 -0.3 -0.25 -0.2 -0.15 -0.1 -0.05 0
-1
-0.5
0
0.5
1
Grand Average for Vol-R (918 Events) Paradigm - v
Rel
. Pot
entia
l (µV
)
time (s)
34

X
-0.45 -0.4 -0.35 -0.3 -0.25 -0.2 -0.15 -0.1 -0.05 0
-0.3
-0.2
-0.1
0
0.1
0.2
0.3
Grand Average for Vol-L (922 Events) Paradigm - v
Rel
. Pot
entia
l (µV
)
time (s)
34
-0.45 -0.4 -0.35 -0.3 -0.25 -0.2 -0.15 -0.1 -0.05 0
-0.3
-0.2
-0.1
0
0.1
0.2
0.3
Grand Average for Vol-R (918 Events) Paradigm - v
Rel
. Pot
entia
l (µV
)
t ime (s)
34