electrodialytic remediation of two types of air pollution control ... · licenciada em ciências de...
TRANSCRIPT
Licenciada em Ciências de Engenharia do Ambiente
Cátia Joana Costa Magro
Electrodialytic remediation of two types of air pollution control
residues and their applicability in construction materials
Dissertação para obtenção do Grau de Mestre em
Engenharia do Ambiente
Perfil de Engenharia de Sistemas Ambientais
Orientador: Professora Doutora Alexandra de Jesus Branco
Ribeiro, CENSE, DCEA, FCT-UNL
Co-orientador: Professora Doutora Lisbeth Ottosen,
Universidade Técnica da Dinamarca
Júri:
Presidente: Professora Doutora Maria Júlia Fonseca de Seixas
Arguente: Professora Doutora Célia Maria Dias Ferreira
Vogais: Professora Doutora Alexandra de Jesus Branco Ribeiro
Mestre Paula Alexandra Rodrigues e Araújo Guedes
Março 2014


Orientador: Professora Doutora Alexandra de Jesus Branco
Ribeiro, CENSE, DCEA, FCT-UNL
Co-orientador: Professora Doutora Lisbeth Ottosen, Universidade
Técnica da Dinamarca
Júri:
Presidente: Professora Doutora Maria Júlia Fonseca de Seixas
Arguente: Professora Doutora Célia Maria Dias Ferreira
Vogais: Professora Doutora Alexandra de Jesus Branco Ribeiro
Mestre Paula Alexandra Rodrigues e Araújo Guedes
Março 2014
Electrodialytic remediation of two types of air pollution control
residues and their applicability in construction materials
]
[Título da Tese]
Dissertação para obtenção do Grau de Mestre em
Engenharia do Ambiente
Perfil de Engenharia de Sistemas Ambientais
Dissertação para obtenção do Grau de Mestre em
[Engenharia Informática]
Cátia Joana Costa Magro
[Nome completo do autor]
[Nome completo do autor]
[Nome completo do autor]
[Nome completo do autor]
[Nome completo do autor]
[Nome completo do autor]
[Nome completo do autor]
Licenciada em Ciências de Engenharia do Ambiente
[Habilitações Académicas]
[Habilitações Académicas]
[Habilitações Académicas]
[Habilitações Académicas]
[Habilitações Académicas]
[Habilitações Académicas]
[Habilitações Académicas]

Electrodialytic remediation of two types of air pollution control
residues and their applicability in construction materials
Copyright © Cátia Joana Costa Magro, Faculdade de Ciências e Tecnologia, Universidade Nova
de Lisboa.
A Faculdade de Ciências e Tecnologia e a Universidade Nova de Lisboa têm o direito, perpétuo
e sem limites geográficos, de arquivar e publicar esta dissertação através de exemplares
impressos reproduzidos em papel ou de forma digital, ou por qualquer outro meio conhecido ou
que venha a ser inventado, e de a divulgar através de repositórios científicos e de admitir a sua
cópia e distribuição com objetivos educacionais ou de investigação, não comerciais, desde que
seja dado crédito ao autor e editor.

Ao paizinho e à mãezinha.


iii
Acknowledgements
I could not forget to thank the ones that made this work possible. My gratitude is for you all.
My supervisor Professor Alexandra Ribeiro from Faculdade de Ciências e Tecnologia - Universidade
Nova de Lisboa (FCT-UNL), that over 5 years, was always an example of character, rigor and hard
work. The opportunity that provided me with this project, has changed some aspects of my life. Thank
you for the advices, guidance and sincerity in the several steps of this thesis. It was a pleasure working
with you. I would like to thank my co-supervisor, Professor Lisbeth Ottosen from Civil Engineering
Department - Technical University of Denmark (BYG-DTU) for her infinite patience with my questions
and for always believing in my skills, for the constant smile and an open door always for me. A very
special thanks goes to Ph.D. Gunvor Kirkelund who gave me the project and my beautiful ashes, for
helping me in so many doubts, for teaching me not to give up when adversity comes and for the strength
in seminars.
This work would have never been possible without the collaboration of FCT-UNL with BYG-DTU. My
four months staying at BYG-DTU was only possible due to an ERASMUS Student Placement Mobility,
and already ongoing research projects: ELECTROACROSS - Electrokinetics across disciplines and
continents: an integrated approach to finding new strategies for sustainable development (FP7-PEOPLE-
2010-IRSES-269289) and PTDC/ECM/111860/2009 - Electrokinetic treatment of sewage sludge and
membrane concentrate: phosphorus recovery and dewatering, that Professor Alexandra Ribeiro
coordinates and Professor Lisbeth Ottosen participates.
A big thanks goes for these two institutions who have watched me growing up and that made me who I
am today. In Departamento de Ciências e Engenharia do Ambiente (DCEA) of FCT-UNL, a huge thank
goes for to Dr. Paula Guedes who gave me so many hours of advices, corrections and encouragement.
Thanks for the precious help, caring and unquestionable kindness. I would also like to thank Ph.D.
Nazaré Couto for statistical explanations, Professor Graça Martinho from DCEA, FCT-UNL and Ph.D.
Célia Ferreira of CERNAS - ESAC for the help in legislation. At BYG - DTU a special thank goes to
Ph.D. Pernille Jensen, for her explanations and fast answers. At the group of Electrochemistry, thank
you for making me always fell at home and for the very helpful discussions on electrodialysis. A thank
to Ebba C. Schnell, for guidance in the laboratory and Sabrina Madsen for dealing with my analysis so
carefully. A sweet and special thanks to Louise Gammeltoft, dear friend, confidant and lab technician,
who helped me during the difficult times in the lab, and taught me so much.
I would also like to thank Helena Gomes, an example to follow. Thanks for the tips, for calming me
down, for the walks, friendship and companionship. A special thanks to my forever friend and sister
Cláudia Silva, for teaching me so much, for always believing in me and for being my biggest supporter.
Hours and hours that we spent on this journey, I think we did accomplish it.
Thanks to migos Rita, Sílvia, Sofia, Vanessa, Joana and Francisco. José, a special thanks, for being the
first in the reviews, and for your availability, sweet at all times. Gaspar my dear friend, thanks for caring
me, even in my constant absence. Thank you Rosemary, Ioannis, Kos and Saravana, for welcoming me
with a big smile during my 4 months in Denmark. My stay was great because of you. You were and are
my Danish family, always.
A special thank goes for my family, daddy, mummy, grandparents, uncles and cousin, for putting up
with my bad mood, and for always believing in me. And, finally, thank you João, for your constant
surprise with my work and for your enthusiasm and pride.
Obrigada.

iv

v
Sumário
Os resíduos de controlo de poluição do ar (CPA) provenientes da incineração de resíduos sólidos
urbanos são classificados como resíduos perigosos. No entanto, os mesmos podem conter potenciais
recursos. Tendo em conta os diferentes sistemas de limpeza de gases de combustão utilizados (húmido
ou semi-seco), os resíduos apresentam características químicas e físicas diversas, que por sua vez irão
influenciar o sucesso da remediação e a sua possível reutilização. O processo electrodialítico (ED) foi
aplicado a dois tipos de resíduos de CPA visando a sua possível remediação. Foram estudadas as
características iniciais destas duas cinzas e aplicadas diferentes condições experimentais (célula
electrodialítica de 2 e 3 compartimentos, 5 ou 50 mA de corrente elétrica e 3, 7 e 14 dias de tratamento).
Os resultados obtidos mostram que a remediação neste tipo de resíduos é bastante difícil, mas que a
utilização de uma corrente contínua de baixa intensidade promove a imobilização de metais pesados
presentes nos resíduos. A lixiviação do Pb, no resíduo do sistema húmido foi anulada, em algumas das
esperiências, enquanto que as restantes apresentaram valores abaixo da legislação dinamarquesa, com
algumas exceções. Este resultado foi bastante distinto dos resultados obtidos em estudos anteriores.
Apesar da dificuldade em remover os metais pesados estudados, as melhores eficiências de remoção
foram obtidas após 14 dias: 84% de Cd, 67% de Pb, 67% de Zn, 30% de Cu e 21% de Cr. Após a
remediação das cinzas, foi estudado a sua possível reutilização em materiais de construção,
nomeadamente em barras de argamassa. Assim, 5% de Cimento Portland Comum foi substituído por
resíduos de CPA com e sem pré-tratamento. A qualidade do material produzido foi avaliado tendo em
conta os seguintes parâmetros: porosidade, densidade, resistência mecânica, lixiviação de metais
pesados e quantidade de cloretos. Os resultados obtidos permitem concluir que, para o sistema húmido,
promover um pré-tratamento antes da reutilização em materiais de construção parece ser a melhor opção,
já que os valores de metais ficam menos lixiviáveis e os testes de resistência mecânica são comparáveis
ao material sem incorporação de cinzas. Todavia, para o sistema de limpeza semi-seca, um pré-
tratamento parece piorar os resultados de remediação, sendo portanto, uma opcção fazer a incorporação
do resíduo em bruto. Em conclusão, os resultados deste estudo sugerem possibilidade de reutilização de
resíduos CPA, o que apresenta grandes vantagens na gestão de resíduos, bem como na conservação.
Palavras-chave: Resíduos de controlo de poluição do ar, processo electrodialítico, barras de
argamassa, metais pesados

vi

vii
Abstract
Air pollution control (APC) residues from municipal solid waste incineration are classified as hazardous
waste and disposed of, although it contains potential resources. Due to the different fuel gas cleaning
system designs (wet or semi-dry), the APC residues present distinct chemical and physical
characteristics that influence the remediation success and their possible reuse. Electrodialytic (ED)
process was applied to two types of APC residues aiming their remediation. The characteristics of raw
residues and upgraded APC and a broad range of ED experimental conditions were studied (ED cell
with – 3 and 2 compartments; 5 or 50 mA of direct current; 3, 7 and 14 days of remediation time).
Obtained results showed that remediation was very difficult but the use of low level direct current
promoted the immobilization of the heavy metals. The leaching behaviour, for instance, of Pb was
avoided in wet system, while the remaining values were kept below the Danish regulation thresholds,
with a few exceptions. Still, after 14 days of ED process the best removal rates achieved were: 84% of
Cd, 67% of Pb, 67% of Zn, 30% of Cu and 21% of Cr. Thus, 5% of Ordinary Portland Cement was
replaced by APC residues in mortars, with or without ED pre-treatment. Porosity, density, compressive
strength, heavy metals leaching and chloride were tested. After analysing the parameters, it is possible
to say that for the wet gas cleaning systems use a pre-treatment before the reuse in building materials is
the best option, since the values for heavy metals leaching tests decrease after, and compressive strength
are comparable to material without residue. However, for semi-dry cleaning gas systems, the heavy
metals leaching after pre-treatment appears to increase, so for this type of APC it is thus possible to
aggregation only of the raw residue. The results of this study suggest new possibilities for this APC
waste reuse, presenting great advantages in the waste management system as well as for resource
conservation.
Keywords: Air pollution control residues, electrodialytic process, mortar bars, heavy metals

viii

ix
Abstrakt
Røggasrensningsaffald (RGA) fra affaldsforbrænding er klassificeret som farligt affald og deponeres,
selv om RGA indeholder potentielt brugbare ressourcer. Forskellige røggasresningssystemer (våd eller
semi-tør proces) resulterer i RGA med for meget forskellige kemiske og fysiske karakteristika som har
betydning for eventuel behandlingsmetode og genbrug. Elektrodialytisk rensning (ED) ble brugt til at
oprense de to forskellige typer RGA. Karakteristik af rå og elektrodialytisk renset RGA samt flere
elektrodialytiske rensningsforsøg (ED- celle med 3 eller 2 kamre; 5 eller 50 mA strømstyrke; 3,7 eller
14 dags rensningstid) blev udført. Resultaterne fra de elektrodialytiske rensningsforsøg viste at
oprensningsgraden var lav, men at strømmen kunne bruges til at immobilisere tungmetaller i RGA.
Udvaskningsforsøg viste at for våd RGA, var Pb udvaskning meget lav og for de fleste andre
tungmetaller blev de danske grænseværdier overholdt. Den højeste oprensning blev opnået efter 14
dages rensning hvor 84% af Cd, 67% af Pb, 67% af Zn, 30% af Cu og 21% af Cr blev fjernet. Derefter
blev 5 % af Portland cement erstattet af enten rå eller elektrodialytisk renset RGA til brug i mørtelprøver.
Porøsitet, densitet, trykstyrke og tungmetal og klorid udvaskning blev testet på mørtelprøverne. For våd
RGA, er det en fordel med elektrodialytisk rensning i forhold til erstatning i mørtel, da
tungmetaludvaskningen minimeres samt at trykstyrken for mørtel er sammenlignelig med
referenceprøver uden RGA. Modsat, for semi-tør RGA bliver udvaskningen af tungmetaller højere af
elektrodialytisk rensning, på denne baggrund vil rå semi-tør RGA være mere fordelagtig til mørtel.
Resultaterne fra dette projekt åbner for nye muligheder for RGA genbrug, som vil kunne føre til store
fordele i affaldshåndteringssystemer og ressourceforvaltning.
Søgeord: Røggasrensningsaffald, elektrodialytisk rensning, mørtelprøver, tungmetaller

x

xi
Abbreviations and symbols
2C - Two compartments
3C - Three compartments
3D - Three days
7D - Seven days
14D - Fourteen days
AN - Anion-exchange membrane
APC - Air pollution control
CAT - Cation-exchange membrane
DC - Direct current
DK - Denmark
ED - Electrodialytic
EDR - Electrodialytic remediation
FA - Fly ash
IC - Ion chromatography
ICP-OES - Inductively coupled plasma – optical emission spectroscopy
L/S - Liquid-to-solid
LOI - Loss on ignition
MSW - Municipal solid waste
MSWI - Municipal solid waste incineration
PAH - Polycyclic aromatic hydrocarbon
PCB - Polychlorinated biphenyl
PT - Portugal
REFA – I/S REFA, Waste-to-energy incineration plant
S/S - Solidification/stabilization
SEM/EDS - Scanning electron microscope/energy dispersive X-ray spectroscopye
Vest – I/S Vestforbrænding, Waste-to-energy incineration plant

xii

xiii
Table of contents
Acknowledgements ............................................................................................................................... iii
Sumário .................................................................................................................................................. v
Abstract ................................................................................................................................................ vii
Abstrakt ................................................................................................................................................. ix
Abbreviations and symbols.................................................................................................................. xi
List of figures ....................................................................................................................................... xv
List of tables ....................................................................................................................................... xvii
1. Introduction ................................................................................................................................... 1
2. Literature review ........................................................................................................................... 3
2.1 Waste management in Europe ................................................................................................. 3
2.1.1 Incineration ...................................................................................................................... 4
2.1.2 Air pollution control residues .......................................................................................... 6
2.1.2.1 Possible applications ....................................................................................................... 8
2.2 Heavy metals ........................................................................................................................... 9
2.3 Electrodialytic process – A remediation technique ............................................................... 15
2.3.1 Transports mechanisms ................................................................................................. 16
2.3.2 Electrodialytic treatment of FA and APC residues from MSWI ................................... 21
3. Material and methods ................................................................................................................. 25
3.1 Air pollution control residues ................................................................................................ 26
3.2 Characterization methods ...................................................................................................... 26
3.4 Mortar bars ............................................................................................................................ 29
4. Results and discussion ................................................................................................................. 31
4.1 Air pollution control residues characteristics ........................................................................ 31
4.2 Electrodialytic experiments ................................................................................................... 33
4.2.1 pH and conductivity ...................................................................................................... 33
4.2.2 Removal and mobilization of heavy metals .................................................................. 37
4.2.3 Leaching behaviour ....................................................................................................... 41
4.1.1 Removal of salts (Cl- and SO42-) .................................................................................... 44
4.2 Mortar bars ............................................................................................................................ 45
4.2.1 SEM/EDS ...................................................................................................................... 45
4.2.2 Porosity and density and compressive tests ................................................................... 47
4.2.3 Leaching behaviour ....................................................................................................... 49
4.2.4 Chloride ......................................................................................................................... 50
5. Conclusions .................................................................................................................................. 53

xiv
6. Future developments ................................................................................................................... 57
7. References .................................................................................................................................... 59
Annexes

xv
List of figures
Figure 2.1. Composition of MSW (adapted from Gentil et al., 2009 in Quina et al., 2011) .................. 3
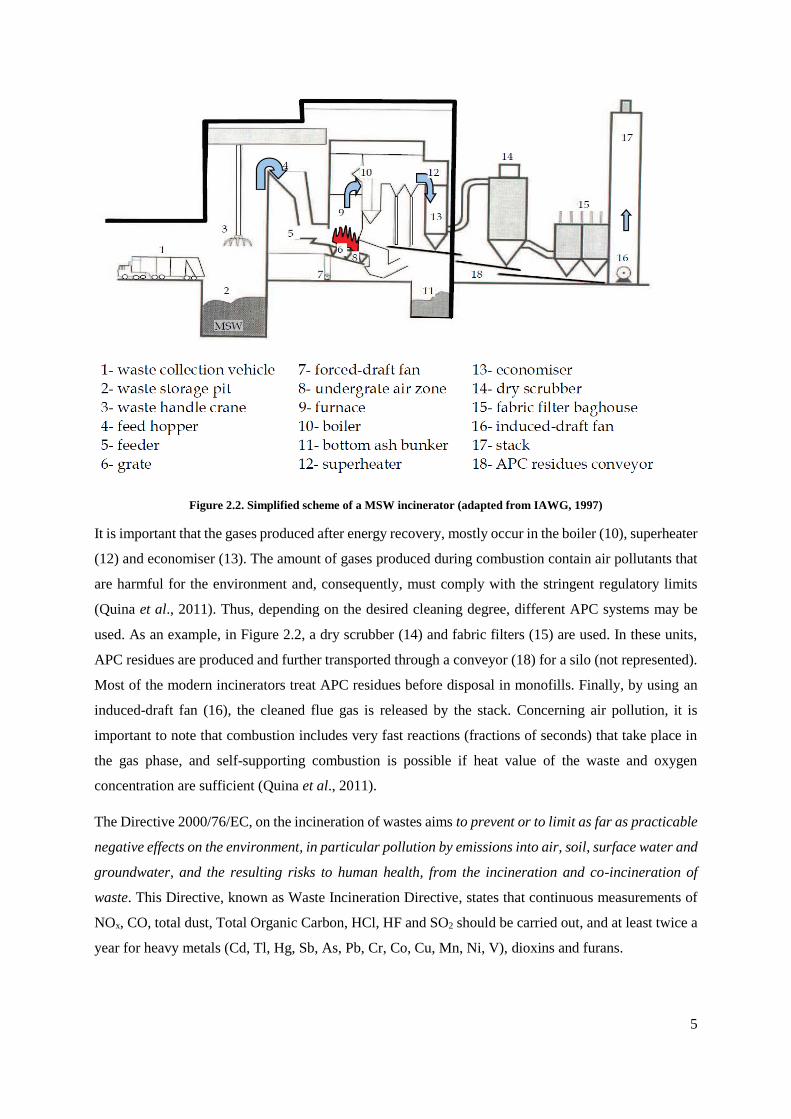
Figure 2.2. Simplified scheme of a MSW incinerator (adapted from IAWG, 1997) ............................. 5
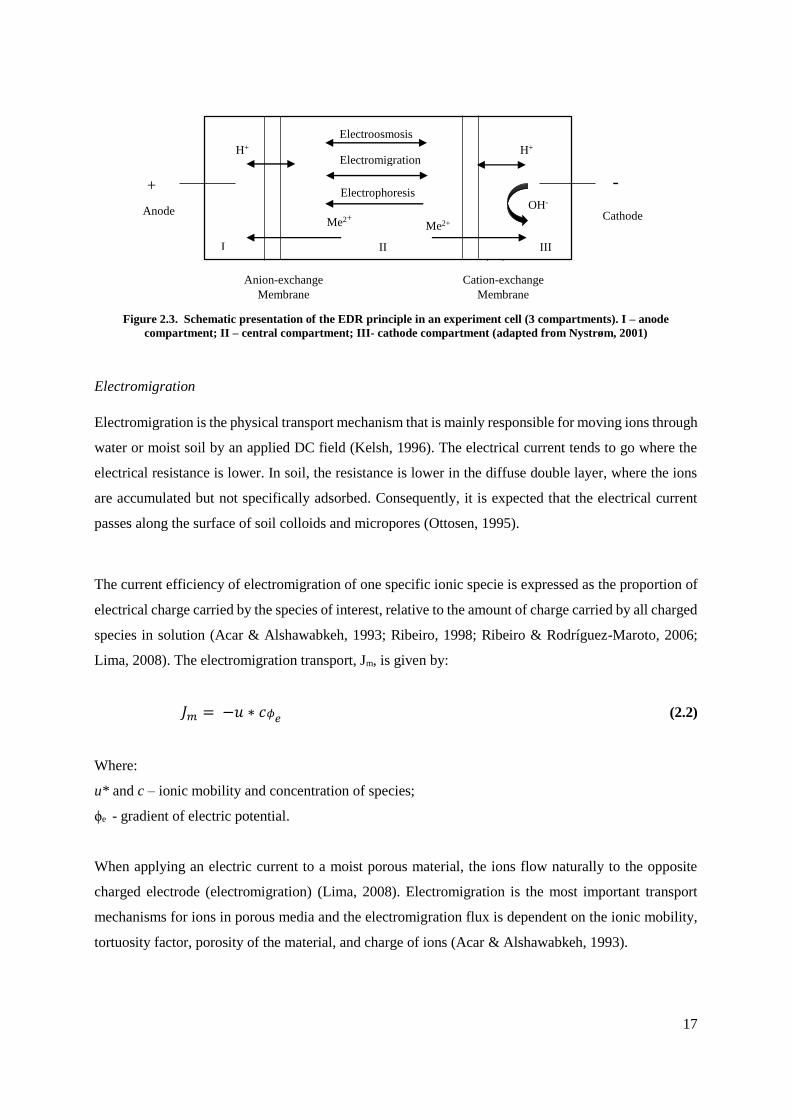
Figure 2.3. Schematic presentation of the EDR principle in an experiment cell (3 compartments). I –
anode compartment; II – central compartment; III- cathode compartment (adapted from Nystrøm, 2001)
............................................................................................................................................................... 17
Figure 2.4. Sketch of an ion-exchange membrane (Hansen, 1995) ...................................................... 19
Figure 3.1. Scheme of initial characterization, ED experiments and casting of specimens ................. 25
Figure 3.2. Schematic presentation the experimental ED cells. Both models developed at DTU,
Denmark: (a) 3 compartment cell, (b) 2 compartment cell. (AN = anion exchange membrane, CAT =
cation exchange membrane) .................................................................................................................. 27
Figure 4.1. Appearance of the APC residues under study – (a) REFA and (b) Vest ............................ 31
Figure 4.2. pH of the two- and the three-compartment ED cell experiments for the duration of 3, 7 and
14 days and 5 mA and 50 mA for Vest; (xC –x number of compartments, C compartments; xD – x
remediation time, D days; x mA- x intensity of DC) ............................................................................ 34
Figure 4.3. pH of the two- and the three-compartment ED cell experiments for the duration of 3, 7 and
14 days and 5 mA and 50 mA for REFA; (xC –x number of compartments, C compartments; xD – x
remediation time, D days; x mA- x intensity of DC) ............................................................................ 34
Figure 4.4. Conductivity of the two- and the three-compartment ED cell experiments for the duration
of 3, 7 and 14 days and 5 mA and 50 mA for Vest; (xC –x number of compartments, C compartments;
xD – x remediation time, D days; x mA- x intensity of DC) ................................................................ 35
Figure 4.5. Conductivity of the two- and the three-compartment ED cell experiments for the duration
of 3, 7 and 14 days and 5 mA and 50 mA for REFA; (xC –x number of compartments, C compartments;
xD – x remediation time, D days; x mA- x intensity of DC) ................................................................ 35
Figure 4.6. Best removal rates (%) for Cd, Cr, Cu, Pb and Zn during the ED experiments: (a) Vest and
(b) REFA ............................................................................................................................................... 37
Figure 4.7. Cadmium distribution after the 24 ED experiments: (a) Vest and (b) REFA. (Cathode –
electrode cathode, electrolyte(-) and cation-exchange-membrane; Anode – electrolyte(+) and anion-
exchange membrane; M – middle compartment; (xC –x number of compartments, C compartments; xD
– x remediation time, D days; x mA- x intensity of DC) ...................................................................... 38
Figure 4.8. Chromium distribution after the 24 ED experiments: (a) Vest and (b) REFA. (Cathode –
electrode cathode, electrolyte(-) and cation-exchange-membrane; Anode – electrolyte(+) and anion-
exchange membrane; M – middle compartment; (xC –x number of compartments, C compartments; xD
– x remediation time, D days; x mA- x intensity of DC) ...................................................................... 38
Figure 4.9. Cooper distribution after the 24 ED experiments: (a) Vest and (b) REFA. (Cathode –
electrode cathode, electrolyte(-) and cation-exchange-membrane; Anode – electrolyte(+) and anion-
exchange membrane; M – middle compartment; (xC –x number of compartments, C compartments; xD
– x remediation time, D days; x mA- x intensity of DC) ...................................................................... 39

xvi
Figure 4.10. Lead distribution after the 24 ED experiments: (a) Vest and (b) REFA. (Cathode – electrode
cathode, electrolyte(-) and cation-exchange-membrane; Anode – electrolyte(+) and anion-exchange
membrane; M – middle compartment; (xC –x number of compartments, C compartments; xD – x
remediation time, D days; x mA- x intensity of DC) ............................................................................ 40
Figure 4.11. Zinc distribution after the 24 ED experiments: (a) Vest and (b) REFA. (Cathode – electrode
cathode, electrolyte(-) and cation-exchange-membrane; Anode – electrolyte(+) and anion-exchange
membrane; M – middle compartment; (xC –x number of compartments, C compartments; xD – x
remediation time, D days; x mA- x intensity of DC) ............................................................................ 40
Figure 4.12. Leaching concentrations (mg L-1) of heavy metals from Vest in the raw APC residues and
after ED process: (a) Cd; (b) Cr; (c) Cu; (d) Pb and (e) Zn (The yy axis do not have the same scale); (xC
–x number of compartments, C compartments; xD – x remediation time, D days; x mA- x intensity of
DC) ........................................................................................................................................................ 42
Figure 4.13. Leaching concentrations (mg L-1) of heavy metals from REFA in the raw APC residues
and after ED process: (a) Cd; (b) Cr; (c) Cu; (d) Pb and (e) Zn (The yy axis do not have the same scale);
(xC –x number of compartments, C compartments; xD – x remediation time, D days; x mA- x intensity
of DC) .................................................................................................................................................... 43
Figure 4.14. Chloride concentration (mg L-1) in the raw APC residues and after 24 ED experiments: (a)
Vest and (b) REFA; (xC –x number of compartments, C compartments; xD – x remediation time, D
days; x mA- x intensity of DC) ............................................................................................................. 44
Figure 4.15. Sulphate concentration (mg L-1) in the raw APC residues and after 24 ED experiments: (a)
Vest and (b) REFA; (xC –x number of compartments, C compartments; xD – x remediation time, D
days; x mA- x intensity of DC) ............................................................................................................. 44
Figure 4.16. Images of SEM before ED treatment: (a) raw Vest and (b) raw REFA; After ED treatment
(7 days of duration time): Vest - (c) 2C 5 mA, (e) 2C 50 mA, (g) 3C 5 mA, (i) 3C 50 mA and REFA -
(d) 2C 5 mA, (f) 2C 50 mA, (h) 3C 5 mA, (j) 3C 50 mA; magnification: 1000x; (X) - glass particles,
(Y) - polycrystalline particles; (xC –x number of compartments, C compartments; xD – x remediation
time, D days; x mA- x intensity of DC) ................................................................................................ 45
Figure 4.17. Compressive strength of specimens after 28 days curing for mortar samples: reference;
substitution 5% of raw and upgraded APC residues from Vest and REFA as cement (mean values ±
standard error); (xC –x number of compartments, C compartments; xD – x remediation time, D days; x
mA- x intensity of DC) .......................................................................................................................... 48

xvii
List of tables
Table 2.1. Advantages and disadvantages of MSWI (Quina et al., 2011) .............................................. 6
Table 2.2. Typical ranges of heavy metals and chloride in different residue components (Chandler et
al., 1997) ................................................................................................................................................. 7
Table 2.3. Some chemical and physical characteristics of Cd, Cr, Cu, Pb and Zn
(https://www.ncbi.nlm.nih.gov/pccompound/?term=Iron) .................................................................... 12
Table 2.4. Advantages and disadvantages of ED treatments (adapted from Gardner, 2005) ............... 16
Table 2.5. Electrodialytic treatment of FA and APC residues from MSWI reported in literature (adapted
from Ferreira, 2005) .............................................................................................................................. 22
Table 3.1. Experimental conditions for the different EDR experiments .............................................. 28
Table 3.2. Experimental conditions of mortar bars-casting of specimens ............................................ 29
Table 4.1. Characteristics of APC residues from Vest and REFA (mean values ± standard error) ..... 32
Table 4.2. Recovery rates of Cd, Cr, Cu, Pb and Zn and final pH at the end of the ED experiments for
Vest and REFA APC residues; (xC –x number of compartments, C compartments; xD – x remediation
time, D days; x mA- x intensity of DC) ................................................................................................ 36
Table 4.3. Porosity and density of specimens: reference; substitution 5% of raw and upgraded APC
residues from Vest and REFA as cement; (xC –x number of compartments, C compartments; xD – x
remediation time, D days; x mA- x intensity of DC) ............................................................................ 47
Table 4.4. EEA landfill criteria for heavy metals leachability; Experimental data obtained by prEN
12457-1 on mortar: reference; substitution 5% of raw APC residues and upgraded APC residues from
Vest and REFA as cement; (xC –x number of compartments, C compartments; xD – x remediation time,
D days; x mA- x intensity of DC) ......................................................................................................... 50
Table 4.5. EN 206-1 European standard for concrete; Amount of chloride in mortar: reference;
substitution 5% of raw APC residues and upgraded APC residues from Vest and REFA as cement; (xC
–x number of compartments, C compartments; xD – x remediation time, D days; x mA- x intensity of
DC) ........................................................................................................................................................ 50

xviii
1
1. Introduction
Air Pollution Control (APC) residues are one of the waste products from flue gas cleaning in the
incineration facilities. There are different APC residues, depending on the design of the plant. They are
considered hazardous due to their contaminants content, namely heavy metals, salts and/or dioxins. Due
to their hazardousness and instability, APC residues constitute an environmental problem and,
consequently, stabilization prior disposal is required. In Portugal the APC residues are mixed with
cement to its inertization, and disposed of in landfills, in Denmark these residues are not allowed to be
landfilled due to the risk of groundwater contamination. They are exported to Germany or Norway,
where they are either backfilled into mines (Germany) or deposited in an old calcite quarry at an Island
in the Oslo Fiord – Langoya - after being mixed with sulphuric acid (Jensen, 2014). The methodology
is dependent on the soil characteristics of each country.
Although APC residues are considered hazardous waste, they have features that can be further reused,
if the contaminants are successfully removed they can be a valuable resource. For instance in the
production of concrete. Nevertheless, the reuse of such a waste should always be in accordance to the
precautionary principle and the uncertainty of the contaminants behaviour over time.
Objectives and research
Q1 - Is the Electrodialytic (ED) process an appropriate pre-treatment for APC residues?
Q2 - Can APC residues be incorporated in building materials, after ED process?
Within these main questions, there will be other targets such as, understand how two different gas
cleaning systems influence the overall characteristics of the generated APC residues and how they affect
heavy metals and salts removal. Electrodiatylic remediation (EDR) was applied to two types (wet and
semi-dry system) of APC residues and different conditions were tested. Two EDR cells were used: one
with three compartments and a recently patented cell with two compartments (Ottosen et al., 2014).
After, the ED process, the ashes were submitted to a stabilization/solidification (S/S) technique. These
APC residues were further studied and defined to be suitable and stable (porosity and density,
compressive strengths, leaching behaviour and chloride content) for reuse in building materials.
Legislation was used to verify if the residue were in conformity, both for leaching of heavy metals and
for anions.
Dissertation structure
This work is organized in 8 chapters:
1. Introduction - work scope and relevance, main objectives and structure;

2
2. Literature review - description of the central theme and relevant terms and previous work
developed;
3. Materials and methods - description of materials used, characterization analysis, identification
and data treatments methods;
4. Results and discussion- presentation of results, hypothesis formulation and their discussion;
5. Conclusions – main outcomes;
6. Future developments;
7. References;
8. Annexes.

3
2. Literature review
2.1 Waste management in Europe
Municipal solid waste (MSW) remains a major problem in modern societies, despite the significant
efforts to prevent, reduce, reuse and recycle it. Municipal solid waste normally contains a mixture of
organic wastes, fabrics, paper, oil, rubber, plastics, metal, glass, and wood, among others. Figure 2.1
shows the composition of MSW in different countries. In this figure is evident the difference between
different proportions of waste composition, showing that even if the technologies for management of
waste are equal, the waste will differ from country to country.
Figure 2.1. Composition of MSW (Adapted from Gentil et al., 2009 in Quina et al., 2011)
In Europe-27 Stat Members, MWS production in 2012 was 492 kg year-1 per capita, with an annual
decrease since 2003 (Eurostat, 2012). Although Portugal had a per capita production of 453 kg MWS
in 2012, the production of MWS in some countries was much higher, as in Denmark or Switzerland:
668 kg year-1 per capita and 694 kg year -1 per capita, respectively (Eurostat, 2012).
Since 1997 Portugal has been applying Strategic Plans of Urban Solid Wastes (Plano Estratégico para
os Resíduos Sólidos Urbanos - PERSU) which allow the country to give fundamental steps in waste
policies. In December 28, 2006, the Strategic Plan for MSW for the period 2007-2016 (PERSU II) was
approved. This plan aims at continuing the waste management policy taking into account the new
requirements formulated at national and community level. These new requirements were thought to
ensure diverting biodegradable municipal waste from landfill and recycling/recovery of packaging waste
while seeking to overcome the limitations of implementing PERSU I. In 2005, 21% of Portuguese solid

4
waste was incinerated, very near to the established value of 22% (Ministério do Ambiente, do
Ordenamento do Território e do Desenvolvimento Regional, 2007). The Portuguese Government has
decided to review the plan before the next Community Support Framework 2014-2020. As goals,
PERSU 2020 provides increased uptake of recyclable waste through selective collection (Ministério do
Ambiente, Ordenamento do Território e Energia, 2014). PERSU 2020 will distinct, for the first time,
goals for the 23 systems of waste management in the country, by population density and socio-economic
parameters of the region in which systems are inserted (Ministério do Ambiente, Ordenamento do
Território e Energia, 2014).
Nowadays modern systems embrace different methodologies aiming as much as possible to achieve
sustainable global solutions for waste management. Life Cycle Assessment tools have been used to
assess the potential environmental burdens of different waste management strategies from the
environmental, energetic and economic point of view (Quina et al., 2011). These calculations have
shown that landfilling, even if gas is recovered and leachate is collected and treated, should be avoided,
due to the fact that resources in the waste are inefficiently utilized (Sundqvist, 2005). Environmental
sound alternatives include incineration, material recycling, anaerobic digestion or composting (Lima,
2008).
2.1.1 Incineration
According to Directive 2000/76/EC of the European Parliament and Council, incineration plants
correspond to any stationary or mobile technical unit dedicated to the thermal treatment of wastes with
or without recovery of the combustion heat generated. This includes the incineration by oxidation of
waste as well as other thermal treatment processes such as pyrolysis or gasification in so far as the
substances resulting from the treatment are subsequently incinerated. This description includes the site
and the entire incineration plant counting:
Waste reception and handling (storage, on site pre-treatment facilities);
Combustion chamber (waste-fuel and air-supply systems);
Energy recovery (boiler, economiser, etc.);
Facilities for clean-up gaseous emissions, on-site facilities for treatment or storage of
residues and waste water, stack;
Devices and systems for controlling incineration operations, recording and monitoring;
Incineration conditions.
Figure 2.2 presents a scheme of a typical mass burning MSW incinerator, which includes the above
referred facilities.
5
Figure 2.2. Simplified scheme of a MSW incinerator (adapted from IAWG, 1997)
It is important that the gases produced after energy recovery, mostly occur in the boiler (10), superheater
(12) and economiser (13). The amount of gases produced during combustion contain air pollutants that
are harmful for the environment and, consequently, must comply with the stringent regulatory limits
(Quina et al., 2011). Thus, depending on the desired cleaning degree, different APC systems may be
used. As an example, in Figure 2.2, a dry scrubber (14) and fabric filters (15) are used. In these units,
APC residues are produced and further transported through a conveyor (18) for a silo (not represented).
Most of the modern incinerators treat APC residues before disposal in monofills. Finally, by using an
induced-draft fan (16), the cleaned flue gas is released by the stack. Concerning air pollution, it is
important to note that combustion includes very fast reactions (fractions of seconds) that take place in
the gas phase, and self-supporting combustion is possible if heat value of the waste and oxygen
concentration are sufficient (Quina et al., 2011).
The Directive 2000/76/EC, on the incineration of wastes aims to prevent or to limit as far as practicable
negative effects on the environment, in particular pollution by emissions into air, soil, surface water and
groundwater, and the resulting risks to human health, from the incineration and co-incineration of
waste. This Directive, known as Waste Incineration Directive, states that continuous measurements of
NOx, CO, total dust, Total Organic Carbon, HCl, HF and SO2 should be carried out, and at least twice a
year for heavy metals (Cd, Tl, Hg, Sb, As, Pb, Cr, Co, Cu, Mn, Ni, V), dioxins and furans.

6
Municipal solid waste incineration (MSWI) in waste-to-energy can be considered an environmentally
friendly solution and a common alternative to landfilling, while allowing to recover a large part of the
energy contained in MSW (Lima, 2008). Besides several advantages, this process also presents some
disadvantages that are reported in Table 2.1.
Table 2.1. Advantages and disadvantages of MSWI (Quina et al., 2011)
Advantages Disadvantages
Handle waste without pre-treatment
Originates hazardous waste (APC
residues), that require safe disposal
Reduce landfilling demand for MSW Originates slags (bottom ashes)
Reduce waste volume by 90% Originates huge volume of flue gases
Reduce waste weight by 70% High investment and operating costs
Possibility of recovering energy (electricity or
heat)
High maintenance costs
If well managed, low air pollution is released Requires suitable composition for auto-
combustion
Destroys potential pathogens and toxic organic
contaminants
Negative public perception
Can be located close to the centre of gravity of
MSW generation
Reduce cost of waste transportation
Require minimum land
Stack emissions are odour-free
Reduce organic materials mainly to CO2 instead
CH4 and other volatile organic compound
2.1.2 Air pollution control residues
Municipal solid waste incineration is a highly efficient technique for waste management, as it
significantly reduces the volume of waste (Quina et al., 2011). However, MSWI may cause
environmental problems, mainly related to the disposal of the produced fly ash (FA) considered
hazardous by CEN prEN 14899. There are different types of ash residues that result from cleaning
emissions from MSW incinerators, and it is important to differentiate between FA and APC residues.
Fly ash is the finer fraction of the particulate (< 200 µm) which is entrained in the flue gas and
subsequently trapped in an electrostatic precipitator filter before any further treatment of the gaseous
effluents. Fly ash can be recovered separately from the gas stream, or they can be incorporated into the
APC residues (Zacco et al., 2014).
Since APC residues include the particulate matter captured after the acid gas treatment units, the waste
may be a solid or a sludge, depending on the type of APC equipment used (dry, semi-dry or wet
processes), and is generally characterized by high concentrations of salts, heavy metals and trace organic
pollutants (Quina et al., 2007).

7
The composition of MSW varies over time and from country to country, due to the differences in
lifestyle and waste recycling process seasons. Also, chemical and physical characteristics of the FA
depend on the composition of the raw MSW, the operational conditions, the type of incinerator and APC
system design (Zacco et al., 2014). As the APC residues that will be further on studied are respectively
from an incinerator with a semi-dry system and another one with a wet system, is given an enlarged
description (Astrup, 2008):
Semi-dry residue systems – Slaked lime is injected into the gas, either in dry form or as a
slurry. This aims to neutralize acidic components in the flue gas, and is typically done before
removing the FA from the flue gas. Fly ash, reaction products, and unreacted lime is typically
removed in fabric filters. Activated coal may be injected for dioxin removal and removed
together with the FA. Dry and semi-dry systems typically generate a single residue;
Wet residue systems – Fly ash is typically removed before neutralizing acidic components.
After this, the flue gas is scrubber in one, two or multistage arrangement of scrubbers. The
scrubber solutions are then treated to produce sludge and gypsum. Wet systems typically
generate more than one residue.
These different methods will produce very distinct APC residues, and in order to select the most
appropriate method of treatment or application for any residue, its main characteristics, and particularly
chemical properties should be known. In some cases, some physical characteristics may also be very
important. The major elements present in the APC residues are Si, Al, Fe, Ca, Mg, K, Na and Cl-.
Regarding heavy metals, Cd, Cr, Cu, Hg, Ni, Pb and Zn are the most frequent, with Zn and Pb being
generally found in the largest amounts (Quina et al., 2007). Table 2.2 presents typical rates of heavy
metals and chloride in different residue components: FA, dry, semi-dry and wet processes.
Table 2.2. Typical ranges of heavy metals and chloride in different residue components (Chandler et al., 1997)
Content of APC (mg kg-1)
Elements FA Dry Semi-dry and wet
Cd 50 - 450 140 - 300 150 - 1400
Cr 140 - 1100 3 - 570 80 - 560
Cu 600 - 3200 16 - 1700 440 - 2400
Pb 5300 – 26 000 2500 – 10 000 3300 – 22 000
Zn 9000 - 70 000 7000 - 20 000 8100 - 53 000
Cl- 29 000 – 210 000 62 000 – 380 000 17 000 – 51 000

8
Trace quantities of very toxic organic compounds are also usually present in these residues, namely
polycyclic aromatic hydrocarbons (PAH), chlorobenzenes (CB), polychlorinated biphenyls (PCB) and
polychlorinated dibenzo-p-dioxins (PCDD) and furans (PCDF) (Quina et al., 2007). Whenever the
treatment, utilization or disposal of APC residues is considered, both Pb and Cl- are of particular concern
due to their leaching behaviour. Consequently, the natural pH of these residues is usually very high (12-
13 pH), which may constitute a problem for some applications. It should be noted that 12.5 is the pH
value of a saturated solution of Ca(OH)2 (Quina et al., 2007).
Due to the high concentration of several heavy metals, the reuse of APC residues as a secondary material
is forbidden in many countries, with the ever more stringent legislation. Therefore, taking into account
the potential environmental impact of these residues, the main problems that have to be solved concern
toxic heavy metals (e.g., Pb, Zn, Cd, Cr, Cu, Ni, Hg), the high concentration of soluble salts (e.g. NaCl,
KCl, salts of Ca), and organic micropollutants (e.g., dioxins, furans) (Quina et al., 2007). Consequently,
a technical remediation process is required before providing possible reuses to the APC residues. There
are two alternative ways of handling APC residues: landfilling after adequate treatment or recycling as
a secondary material after suitable inertisation
2.1.2.1 Possible applications
Appropriate treatments for APC residues, specifically regarding heavy metals, can be grouped into three
classes (Zacco et al., 2014):
i. Separation processes, for instance, electrochemical process;
ii. Solidification/stabilization process, for example cement based;
iii. Thermal methods, like microwave treatment.
A combination between separation processes and S/S processes will be further considered for this study.
Electrodialytic method will be explained in section 2.3, the S/S processes are considered in the following
paragraphs.
The S/S processes use additives or binders in order to physically and/or chemically immobilize
hazardous components initially present in waste (Wiles, 1996). Solidification involves the
transformation of a liquid or a sludge into a solid, and may not lead to a chemical interaction of the
constituent of concern with the solidifying agent. The process reduces the mobility of the contaminants
in the treated material through encapsulation, as a consequence of the reduced surface area and lower
permeability (Quina et al., 2007). On the other hand, the main goal of stabilization is to convert the
contaminants into less soluble or less toxic forms, with or without solidification (Quina et al., 2007). In

9
practice, the best approach to S/S technology involves initial chemical stabilization and then
solidification of the waste. Inorganic materials, such as cements or pozzolanic materials are the most
common binders (Quina et al., 2007). Solidification/stabilization methods consist of mixing the binders
with the waste and water, and sometimes with chemical additives (e.g. sodium silicate or soluble
phosphates). The quantities involved are optimized as a function of the performance required for the
final product (leaching behaviour, compressive strength, setting time, etc.), which may be either solid
massive (monolithic) or granular (Quina et al., 2007).
Van de Laar et al. (1994) show that with the exception of chlorides, the immobilization of most toxic
elements is possible through S/S processes. According to Quina et al. (2007) the most dynamic research
area is in the field of solidification with binders, using in particular Portland cement. In practice, at the
industrial level in Europe, this is indeed the most important method for treatment of APC residues
(Quina et al., 2007). Thus, to better understand the process, when water is added to cement a hydration
reaction takes place. The hydration products crystallize and create a three-dimensional structure that
binds together all the substances present into a hard mass. The reactions that occur are the basis for the
S/S process, applied world-wide for the treatment of hazardous waste. The 3-dimensional structure
formed, which comprises hydration products, water, small bubbles of air, and particles of sand or stone,
can also include small particles (< 150 µm). Air pollution control residues particles have a small grain
size and they could fill these spaces and become encapsulated inside the concrete matrix (Ferreira et al.,
2003a).
When Portland cement or similar binders are employed, the product is monolithic and a significant
increase in weight (almost double) and volume may occur, which affects shipping and landfill costs
(Ferreira et al., 2003a). Environmental costs should also be considered as resources such as soil and
raw materials are used. Another disadvantages of treatment with cement are related with low retention
of salts, which may leach out in the short term, the possible release of heavy metals in the medium to
long term, and finally the problem of the monolith formed at the landfill site that will hardly ever be
used again (Ferreira et al., 2003a). The main advantages come from the fact that this technology is well
established and low cost. According to Ferreira et al. (2003a) it is advisable to remove the salts before
adding the binders, whenever possible.
2.2 Heavy metals
Some metals that potentially exist in higher concentrations in APC residues may have a damaging action
to the environment. Like in nature, the incineration process does not destroy or form heavy metals. The
total quantity of metal entering the combustion chamber is just redistributed in the process effluent

10
(Quina, 2005). In literature, there are many studies about the behaviour of metals in the combustion
chamber incineration processes (Fernandez et al., 1992; Wey et al., 2001; Ferreira et al., 2003b). One
way to reduce the amount of heavy metals in MSW is the selective separation, mainly of batteries,
electronic components and plastics, which has been gaining importance particularly during last decade.
The potential negative effect to the environment of a metal is determined by its oxidation state, its
chemical form and its concentration. The possible toxic effects in humans are the occurrence of acute
toxicity effects, skin and eyes irritation, allergic reactions, systemic toxicity, organ toxicity,
carcinogenic, mutagenic and eventually teratogenic (reproductive toxicity) (Quina, 2005). According to
Evans (1989) the toxicity in plants and in animals can vary considerably but it still can be sorted as
follows:
Hg, Cd, Ag, Tl> Cu, Pb, Co, Sn, Be>In, Ba> Cr, Mn, Zn, Ni, Fe > Y, La> Sr, Sc> Cs, Li, Al
The main route through which metals can damage humans are inhalation and ingestion of liquids or
solids where they exist. Since the APC residues result from a thermal process, it is appropriate to classify
the various metals based on their volatility (Fernandez et al., 1992):
Non-volatile - elements with a high boiling point and hardly volatilize in the combustion zone:
Al, Ba, Be, Ca, Co, Fe, K, Mg, Mn, Si, Sr, Ti, Cu, Cr, Ni;
Semi-volatile - elements that volatilize during combustion and can condense on the surface of
the particles as the gas cools Pb, Cd, Se, Sb, Zn, In, As;
Volatile - Elements that can be released into the gas phase: Hg, Cl, Br.
The leaching process is one of the main mechanism by which the residue can damage the environment,
and humans in particular. In solution, metals can be found as free ions and/or complexed with organic
or inorganic compounds. There is a huge number of ligands that can cause metal complexes, in form of
soluble complexes generally connected to Cl-, OH- or organic matter, or many of which are conjugate
bases of weak acids (Quina, 2005). The extent of complexation mainly depends on the amount of metal
ions, complexing ligands and pH in solution. Thus, the total metal content of a solution is the sum of
free metals plus the sum of all the metal species that may form (Quina, 2005). Furthermore, the chemical
forms in which one element is in solution (speciation) can be decisive for the mobility in the
environment, bioavailability and ability to participate in reactions of precipitation and
adsorption/absorption (Kot & Namiesnik, 2000).
Youcai et al. (2002) reported that the concentration of metals in the FA is highly correlated with the
temperature of the boiling and melting points of the oxides, sulphates and chlorides, thus, lower these
temperatures lead to higher heavy metals concentrations at the ash. According to Sabbas et al. (2003),

11
the relevant metals to consider in waste incineration are: As, Al, B, Ba, Cd, Cr, Cu, Hg, Mn, Mo, Ni,
Pb, Sb, Se, Zn, and in terms of anions are the following: Br-, Cl-, CN-, F-, NH4+, NO3
-, NO2-, SO4
2-.
The chemical and physical characteristics that influence the behaviour of heavy metals during the
pollution control in incineration processes are of utmost relevance. Table 2.3 presents some
characteristics of Cd, Cr, Cu, Pb and Zn.

12
Table 2.3. Some chemical and physical characteristics of Cd, Cr, Cu, Pb and Zn (https://www.ncbi.nlm.nih.gov/pccompound/?term=Iron)
GENERAL PROPRIETIES PHYSICAL PROPRIETIES ATOMIC PROPRIETIES
Crystal
structure
Element
category
Thermal
conductivity
(W m−1 K−1)
Melting
point
(K)
Boiling
point
(K)
Heat of
vaporization
(kJ mol−1)
Oxidation
states
Ionization
energies
(kJ mol−1)
Electro
negativity
(Pauling scale)
Cd
Transition
metal 96.6 305 1040 99.87
2, 1 (mildly
basic
oxide)
1st: 867.8
2nd: 1631.4
3rd: 3616
1.69
Cr
Transition
metal 93.9 2173 2915 339.5
6, 5, 4, 3, 2,
1, -1, -2
(strongly aci
dic oxide)
1st: 652.9
2nd: 1590.6
3rd: 2987
1.6
Cu
Transition
metal 401.1 1356 2868 300.4
+1, +2, +3,
+4
(mildly basic
oxide)
1st: 745.5
2nd: 1957.9
3rd: 3555
1.90
Pb
Poor
metal 35.3 601 2013 179.5
4, 3, 2, 1
(Amphoteric
oxide)
1st: 715.6
2nd: 1450.5
3rd: 3081.5
1.87
Zn
Transition
metal 116 693 1180 123.6
+2, +1, 0
(amphoteric
oxide)
1st: 906.4
2nd: 1733.3
3rd: 3833
1.65

13
Specifying for the incineration process:
Cadmium
The percentage of Cd present in the FA from MSWI mostly comes from the batteries that still arrive at
municipal systems (Quina, 2005). Verhulst et al. (1996) reported that Cd is easily volatilized as chlorides
(CdCl2(g)), even in oxidizing conditions, like Cd(g) if temperatures are high (> 700 °C). The formation
of sulphate (CdSO4(g)) is also possible but it will be a dominant phenomenon for low temperatures (<
700 °C). In the S/S methods, for instance with cement, a strong reduction in the amount of leached Cd
can be observed due to the dilution effect element and incorporation of the mineral phase. The Cd can
be effectively adsorbed onto the surface of the iron oxide (Zacco et al., 2014).
Chromium
Chromium may come from several materials, and the major sources are glue, matches, scrap metal and
building materials (Abbas & Steenari, 2001). The behaviour of this element in the combustion chamber
is conditioned by the fact that both in the metallic form and in the form of various Cr compounds they
have a relatively low vapour pressure and it is consequently difficult to volatilize. However, Cr(VI) is
more likely is the oxidation state since it is solid and oxidized at high pH (Cai et al., 2003). In terms of
treatment, the Cr(III) is easier to treat as it is more immobile than Cr(VI). Additionally, the form (III)
and (VI) may be soluble in an alkaline medium, with the predominance of one form over the other
depending on the redox potential (Quina, 2005).
Copper
In the combustion chamber of the incineration processes it is thermodynamically possible that the total
volatilization of Cu occurs in the form of CuCl(g) and Cu3Cl3(g) or in complex oxides (CuO.Fe2O3,
CuO.Al2O3 and silicates). In practical terms, volatilization of Cu is normally low, and very dependent
on the chamber reduction conditions and amount of existing chlorides (Verhulst et al. 1996). Also the
volatilization in the form of sulphates is significant only at low temperatures (< 700 °C).
Lead
When there is no pre-sorting, the source of Pb can be any of the materials on which it is employed.
However, the materials with larger contribution are batteries, welding, wiring (Pb in metallic form),
crystal, fluorescent bulbs, paints and pigments present in several different materials (Quina, 2005).
These materials can provide about 120 g of Pb t-1 MSW, with a higher transfer to 33% for particles
entrained by the gases (Quina, 2005). Verhulst et al. (1996) stated that Pb easily volatilized as chlorides
(PbCl2(g) PbCl(g)), even in oxidant conditions, as well as PbO(g) and Pb(g), if the temperatures are
higher (> 700 ºC). The sulphates formation (PbSO4 (g)) is also possible but it will be a dominant
phenomenon only at low temperatures (< 700 °C). The Pb amount present depends on the particle size
14
distribution (Yuan et al, 2005). In terms of treatment of these wastes, Pb can be separated and recovered
(Pedersen, 2002b), stabilized through chemical additives and treated by S/S using, for example cement
(Zacco et al., 2014).
Zinc
Verhulst et al. (1996) referred that Zn partially volatilizes in the form of chloride (ZnCl2(g)), even in
oxidizing conditions, as well as ZnO(g) and Zn(g). To volatilize Zn, reducing conditions and excess
chlorides are favourable. The formation of sulphates (ZnSO4.2H2O(g)) is also possible but will be a
dominant phenomenon for low temperatures (< 500 °C). In the combustion chamber it can also form
stable compounds with Zn (ZnO.Fe2O3, silicates, silicoaluminates), significantly reducing its volatility.
The S/S treatments are generally suitable for this metal but it should be taken into account that Zn
exhibits amphoteric behaviour that, in some treatments, may unexpectedly lead to increased leached
amounts. Since the Zn concentrations are significant in waste incineration, some studies show that this
metal can be recovered (Pedersen, 2002b).
Anions (Cl- , SO42-)
Chloride has a considerable relevance in incineration processes, particularly at the level of the chemical
compounds formed during the process of APC. In fact, the MSW can contain significant amounts of
chloride, being its main source the plastics fraction (Quina, 2005). The presence of the chloride has
environmental disadvantages since HCl is its volatilization primarily form. The Cl2(g) formation is
thermodynamically unstable at more than 150 ºC (Verhulst et al., 1996). In addition, the presence of a
high amount of chloride significantly increases the volatilization of most metals (Marani et al., 2003).
This high chloride content in the waste is damaging at many levels, because it is easily leached and it is
poorly retained in the S/S treatment which after makes unfeasible to use this residue in material
production (Zacco et al., 2014). Giordano et al. (1983) showed that high concentrations of chloride in
the ash promote metals mobility in the soil since it works as an anion complexing agent. The CaOHCl
develops during the neutralization of HCl by excess lime, according to the reaction 2.1:
Ca(OH)2 + HCl CaOHCl + H2O (2.1)
The sulphates may be formed in the combustion of the incineration chamber from the sulphur present
in the MSW, and it can also influence heavy metals volatilization, although the effect is much smaller
than for chlorides (Quina, 2005).

15
Once the APC residues that will be further studied (section 4), will be also reused in future building
materials, it is important to understand how the metal leaching occurs and which are the factors that
influence it. The leaching processes are the main exposure ways for ecosystems and living beings. They
involve the contact a liquid with a solid material, resulting in a partial dissolution of particular
components. Leaching is the result of the occurrence of more or less complex chemical reactions, being
the chemical species mobilized by the processes of diffusion and/or convection (Quina, 2005).
According to Quina (2005), there are several physical, chemical and biological factors that may
influence the leaching processes. The most relevant factors are the physical size of particles subject to
leaching, the mineral phases homogeneity, the process time, the flow of leaching agent, the temperature,
the porosity of the solid matrix, the geometric shape and size of the material, the permeability matrix
and the hydrogeological conditions (Quina, 2005). The most important chemical factors are the chemical
equilibrium kinetics, the material pH, the possibility to occur complexation, redox conditions,
adsorption processes, ion exchange, surface complexation and electrostatic attraction (Quina, 2005).
The biological action may also impact the leaching processes that is directly related to the living beings’
ability to affect some of the physical and chemical aspects above mentioned (Quina, 2005).
Among all the factors that may affect the leaching processes, the pH is a decisive parameter for all the
phenomena involved. Thus, the metals leaching should always be indexed to the pH value present in the
solution. There are several processes that can have a strong influence in the leached amount. For
example, complexation with organic matter Dissolved Organic Carbon or Cl-, that can increase the
amount leached in the alkaline pH range (pH > 7) (Quina, 2005). In terms of pH, it should be
distinguished whether if the system is open or closed to the atmosphere, considering that in open systems
that variable can be strongly affected by absorption of CO2 from the air (Quina, 2005).
Summarizing up, the amount of metals may vary several orders of magnitude depending on the pH
range. In general, at less than pH 4, a plateau is reached that must be relatively close to the potentially
leachable amount (Quina, 2005).
2.3 Electrodialytic process – A remediation technique
The theoretical principle of electrokinetics has been studied throughout the years, since 1809 Reuss
(Lima, 2008), until recent journal publications, e.g. Suzuki et al. (2014). The ED process is a
combination of the electrokinetic principle with the use of ion-exchange membranes. The enhanced
electrochemical remediation technique was developed at the Technical University of Denmark (patent
PCT/DK95/00209) in 1990s for Ottosen & Hansen (1992), Hansen (1995) and Ottosen (1995).

16
However, the introduction of membranes to an electrochemical process was tried before by Carr et al.
(1962 in Lima, 2008).
The ED process has proved its efficiency on the removal of heavy metals from soil (Ottosen, 1995;
Ottosen et al., 1997; Hansen et al., 1997; Ribeiro & Mexia, 1997; Ribeiro, 1998; Ribeiro et al., 2005;
Ribeiro & Rodríguez-Maroto, 2006; Jensen et al., 2007; Sun, 2013), as well as from quite a few other
solid matrices with high removal efficiencies, such as harbour sediments (Nystroem, 2005), impregnated
waste wood (Ribeiro et al., 2000; Christensen et al., 2006), mine tailings (Hansen et al., 2005), sludge
(Ottosen et al., 2007) or different ash residues (Ferreira, 2005; Lima, 2008; Lima et al., 2012; Kirkelund
et al., 2013). Table 2.4 presents advantages and disadvantages of ED process.
Table 2.4. Advantages and disadvantages of ED treatments (adapted from Gardner, 2005)
Advantages Disadvantages
There are currently no other viable in-situ
methods for treating contaminants in
porous media simultaneously;
Ionic contaminants are absorbed to
sediment particles and are often not
available for removal by the simple
flushing action of water. The pH shift
produced by the electrolysis of the water
effectively desorbs contaminating ions;
The process is competitive in cost and
remediation effectiveness to other
methods currently in use;
The ED process is limited by the
solubility of the contaminant and
contaminants desorption from the soil
matrix. Heavy metals in metallic states
are difficult to dissolve and separate from
soil samples. The process is also not
efficient when the target ion
concentration is low and non-target ion
concentration is high;
Acidic conditions and corrosion of the
anode may create difficulties in in-situ
efforts.
2.3.1 Transports mechanisms
The ED process is a remediation technique, applied to contaminated porous matrices being particularly
suitable for the remediation of fine-grained soils, due to the presence of diffuse double layer. The main
principle used in the EDR is that ions (including heavy metal ions) move under the influence of an
electric field. When an electric field is applied to, e.g., a water saturated soil matrix, the current is carried
by ions in the soil pore water that move according to their charge (Christensen, 2004). A low level direct
current (DC) is applied to the cross section of the soil or other matrix between a pair (or multiple pairs)
of electrodes, producing a current density in the range of mA cm-2 (Ribeiro & Rodríguez-Maroto, 2006).
When the electric field is created, EDR has three main transport mechanisms taking place:
electromigration, electroosmosis and electrophoresis. Diffusion is also important since the concentration
gradient is built up by material transport. These transport processes are schematized in Figure 2.3.
17
Figure 2.3. Schematic presentation of the EDR principle in an experiment cell (3 compartments). I – anode
compartment; II – central compartment; III- cathode compartment (adapted from Nystrøm, 2001)
Electromigration
Electromigration is the physical transport mechanism that is mainly responsible for moving ions through
water or moist soil by an applied DC field (Kelsh, 1996). The electrical current tends to go where the
electrical resistance is lower. In soil, the resistance is lower in the diffuse double layer, where the ions
are accumulated but not specifically adsorbed. Consequently, it is expected that the electrical current
passes along the surface of soil colloids and micropores (Ottosen, 1995).
The current efficiency of electromigration of one specific ionic specie is expressed as the proportion of
electrical charge carried by the species of interest, relative to the amount of charge carried by all charged
species in solution (Acar & Alshawabkeh, 1993; Ribeiro, 1998; Ribeiro & Rodríguez-Maroto, 2006;
Lima, 2008). The electromigration transport, Jm, is given by:
𝐽𝑚 = −𝑢 ∗ 𝑐𝜙𝑒 (2.2)
Where:
u* and c – ionic mobility and concentration of species;
ϕe - gradient of electric potential.
When applying an electric current to a moist porous material, the ions flow naturally to the opposite
charged electrode (electromigration) (Lima, 2008). Electromigration is the most important transport
mechanisms for ions in porous media and the electromigration flux is dependent on the ionic mobility,
tortuosity factor, porosity of the material, and charge of ions (Acar & Alshawabkeh, 1993).
+ -
Cathode Anode
Me2+ Me2+
H+ H+
OH-
I III II
Electroosmosis
Electrophoresis
Anion-exchange
Membrane
Cation-exchange
Membrane
Electromigration

18
Electroosmosis
Electroosmosis is the movement of the pore water under the influence of an electric field (Ottosen,
1995). The removal of uncharged species or weakly dissociated organic contaminants, like phenols, is
predominant, where the soil has a finite zeta potential (Ribeiro et al., 1999). The flow-direction of
electroosmosis is, in the most cases, towards the cathode, but at low pH-values charge reversal of the
soil may occur, and cause of electroosmotic flow to change direction (Jensen, 2005). The electroosmotic
flux, Jeo, is described by the following equation:
𝐽𝑒𝑜 = −𝑘𝑒𝑐𝜙𝑒 (2.3)
Where:
ke – electroosmotic permeability of soil
c - concentration of species
ϕe - gradient of electric potential.
Electroosmotic flow differs from flow caused by a hydraulic gradient because it is mainly dependent on
the porosity and zeta potential of the soil, rather than pore size distribution and macropores (Sun, 2013).
The electroosmosis is efficient in fine-grained soils (Acar & Alshawabkeh, 1993). The electroosmotic
mobility (ke c) is generally 10 times lower than the ion mobility during electromigration (u* c) (Lageman
et al., 1989).
Electrophoresis
Electrophoresis is the opposite of electromigration and is the movement of larger units, as protein
molecules or colloidal particles, under a potential gradient. The charged particles are electrostatically
attracted to one of the electrodes and repelled by the other, where negatively charged clay particles move
towards the anode (Ribeiro, 1998). Electrophoresis is generally of limited importance in compacted soil
system (Probstein & Renaud, 1987 in Sun, 2014), and the process is rarely encountered in EDR (Jensen,
2005), but can be significant if an electric field is applied to a slurry (Acar & Alshawabkeh, 1993), as
well as in unconsolidated soils, the electrophoresis may play a role in their cementation (Ribeiro, 1998).
Diffusion
Diffusion is the movement of ionic species under a chemical concentration gradient. In free solutions,
is usually expressed by Fick’s law and in porous media as well. In the latter case, the effective diffusion
coefficient must be obtained correcting the diffusive coefficient, to take into account the porosity and

19
the tortuosity effects, which can decrease this transport in more than one order of magnitude (Ribeiro &
Rodríguez-Maroto, 2006). The diffusive flux in soil can be obtained by:
𝐽𝑑 = −𝐷∗𝛻𝑐 (2.4)
Where D* is the effective diffusion coefficient and ∇c is the concentration gradient. In general, in the
usual conditions for the electrokinetic treatment this is a secondary transport and can be important only
in some areas of soil where gradients are especially high, e.g., acid and basic fronts. (Ribeiro &
Rodríguez-Maroto, 2006).
Electrodialysis
Ion-exchange membranes are membranes made of polymers with charged surfaces that promote high
permselectivity, low electric resistance, good mechanical/form stability and high chemical and thermal
stability (Strathmann, 2004). Two types of membranes are the key to EDR: the cation-exchange
membrane and the anion-exchange membrane. The surface will attract dissolved ions, with the opposite
charge (counter-ions) from the pore water of the membranes. The counter-ions will be transported
through the membrane due to the electrical current and the co-ions (with the same charge as the surface
of the membrane) will be rejected (Figure 2.4).
Figure 2.4. Sketch of an ion-exchange membrane (Hansen, 1995)
However, ion-exchange membranes are not be 100% effective, which means that some co-ions can pass
the membrane together with the counter-ion, Hansen (1995) presents several advantages of the use of
membranes:
Allow the passage of ions from polluted media to the electrode compartments;
Fixed Groups
Counter-ion
Co-ion
Solvent

20
Prevent/prohibit the passage of ions from electrode compartments (I and III – Figure 2.3) back
to the contaminated media (II - Figure 2.3);
Maintain the ions removed from compartment II in the electrolytes (in compartments I or III);
Prevent the produced acid and base at the anode and the cathode, respectively, to enter into the
soil and be transported through the soil, thus saving energy.
The membranes allow the regulation of the ion fluxes, thus selecting the ions that reach the electrode
compartments. A concentration gradient is therefore essential for the flow of ions and water throughout
the system (Hansen, 1995).
Electrode reactions
In compartments (I) and (II) of the ED cell (Figure 2.3) the electrolytes are kept re-circulating in order
to avoid the build-up of concentration gradients in the vicinity of the electrodes and, at the same time,
remove the gasses produced by the electrode reactions (Lima, 2008). The pH in these solutions is varying
during the EDR, mainly due to the electrode reactions. Inert electrodes made of carbon, platinum or
titanium are used in ED soil remediation because they do not take part in the electrode reactions
(Nystrøm, 2001). The applied current leads to electrolysis of water at the electrodes, where the primary
reactions are the following:
2 H2O + 2e- H2 + 2 OH- (cathode) (2.5)
2 H2O O2 + 4H+ + 4e- (anode) (2.6)
Thus, acid is produced at the anode and base is produced at the cathode. When the metal concentration
in the electrolytes increase, precipitation of the metal at the electrode surface can occur:
H+ + e- 1
2 H2 (2.7)
Me n+ - ne- Me (2.8)
Me(OH)n + ne- Me + nOH- (2.9)
If chlorides are present in the electrolyte (anolyte), chloride gas is produced:
Anode: 2 Cl- Cl2(g) + 2e- (2.10)
Adjustments can be made to the earlier established ED cell treatment purpose depending on the final
objective. For example, the number of compartments can be reduced to two compartments and introduce

21
the anode directly into matrix compartment. This cell design was recently developed at Technical
University of Denmark and patented (Ottosen et al., 2014) by Lisbeth Ottosen, Pernille Jensen, Gunvor
Kirkelund and Benjamin Ebbers and, till now, no data has been published using this cell design. This
new approach uses the acid produced in the anode to promote the electromobilization of heavy metal
complexes from a liquid suspension to the cathode compartment, where they are concentrated. This new
approach primarily aims to increase the efficiency in mobilizing and separating heavy metals and other
elements in a 2C ED cell setup, opposed to a 3C setup.
2.3.2 Electrodialytic treatment of FA and APC residues from MSWI
The removal of heavy metals from MSWI fly ashes using ED treatment was first applied by Pedersen
(2002a), with a conventional ED cell. Difficulties during these initial experiments, like the precipitation
in electrolytes, poor control of the pH or long remediation times, revealed the need to agitate the matrix
in the cell. Pedersen et al. (2002a) introduced a stirring rod in the central cell compartment. After the
introduction of the stirrer, several studies about EDR of FA from MSWI were made, and the assisting
agents were introduced to further enhance the process. Beside the assisting agents, water was also used
for acidification.
Table 2.5 summarizes different removal rates obtained by several authors. The differences removal are
mainly due to two different reasons: the types of ash and the final pH of treated sample.

22
Table 2.5. Electrodialytic treatment of FA and APC residues from MSWI reported in literature (adapted from
Ferreira, 2005)
Type of ash
Current
Density
(mA cm-2)
Number of
ED cell
compartments
Time of
treatment
(week)
Assisting
agent
Removal
rates
(%)
Refs.
Fly ash: Collected
electrostatic
precipator before
exposure to flue gas
cleaning additive.
From: Nuuk,
Greenland.
0.8 3
10
0.5 M
ammonium
citrate in
2.5% NH3
Cd
Cr
Cu
Pb
Zn
44
2-3
18
8
73
(Pedersen, et
al., 2001)
0.8 3
10
0.5 M
ammonium
citrate in
2.5 NH3
Cd
Cr
Cu
Pb
Zn
40
2-3
31
2.5
24
(Pedersen, et
al., 2001)
0.8 3
3
0.25 M
ammonium
citrate in
1.25 NH3
Cd 70 (Pedersen, et
al., 2001)
Fly ash: Collected on
the electrostatic
precipitator and not
exposed to any flue
gas cleaning additive.
From:
Vestforbraending,
Denmark.
0.8
3
2 2.5% NH3
Cd
Cr
Cu
Pb
Zn
100
7
49
3.5
42
(Pedersen,
2002b)
0.8
3
2 Water Pb
Zn
12
25
(Pedersen,
2002b)
0.8
3
2 0.25 M
Na-citrate
Cd
Cr
Cu
Pb
Zn
15
15
37
12
39
(Pedersen,
2002b)
0.8
3
2
0.25 M
ammonium
citrate in
1.25 NH3
Cd
Cr
Cu
Pb
Zn
62
20
59
6
39
(Pedersen,
2002b)
Air pollution control
residues: Collected
in semi-dry air
pollution control
equipment.
From: Valorsul,
Portugal
0.8 3
3 Water
Cd
Cu
Pb
Zn
4
5
5
4
(Ferreira et
al., 2004)
0.8
3
3 3% Na-
gluconate
Cd
Cu
Pb
Zn
2
3
2
3
(Ferreira et
al., 2004)
4.0
3
3 22% Na-
gluconate
Cd
Cu
Pb
Zn
5
2
3
3
(Ferreira et
al., 2004)
4.0
3
3 22% Na-
gluconate
Cd
Cu
Pb
Zn
10
5
6
6
(Ferreira et
al., 2004)
0.8
3
2 3% Na-
gluconate
Cd
Cu
Pb
Zn
2
0.2
1
2
(Ferreira et
al., 2004)

23
(a) values read from graphics
Air pollution control residues, are a more complex FA, which results from the complete flue gas
treatment at the incineration unit. Air pollution control includes, in some cases, activated carbon, added
in the scrubber for adsorption of heavy metals. The activated carbon is an adsorption agent, and can
“hold” strongly to the metals (Ferreira, 2005). The final ash pH is a significant factor and the pH drop
that occurs during the ED process promotes the dissolution of oxides, hydroxides and carbonates, and
Table 2.5. (cont.) Electrodialytic treatment of FA and APC residues from MSWI reported in literature (adapted from
Ferreira, 2005)
Type of ash
Current
Density
(mA cm-2)
Number of ED
cell
compartments
Time of
treatment
(week)
Assisting
agent
Removal
rates
(%)
Refs.
Fly ash: Incinerator.
From: Valorsul,
Portugal
0.8
3
2 Water
Cd
Cr
Cu
Pb
Zn
86
44
81
20
62
(Pedersen et
al., 2005)
0.8
3
2 Water Cu
Pb
90
41
(Ottosen et
al., 2006)
Fly ash: Mixture of
residue collected
from boiler, APC
devices and sorbents
(e.g. lime).
From: Valorsul,
Portugal.
0.8
3
2 Distilled
Water
Cd
Pb
7.4
22.6
(Lima et al.,
2008a)
0.8
3
2
0.25 M
ammonium
citrate in
1.25
ammonia
Cd
Pb
40.1
3.7
(Lima et al.,
2008a)
Air pollution control
residues: Results
from the complete
flue gas treatment at
the incineration unit –
injection of ammonia
for NOx removal in
the boiler; addition of
lime in the scrubber;
collection of all the
formed particulates
(both electrically and
non-electrically
chargeable) in filters.
From: Valorsul,
Portugal
0.8
3
2 Distilled
Water
Cd
Cu
Pb
-17
-82
-17
(Lima et al.,
2010a)
0.8
3
2
0.25 M
ammonium
citrate in
1.25
ammonia
Cd
Cu
Pb
57
45
21
(Lima et al.,
2010a)
Air pollution control
residues: Collected
after treatment of flue
gas in electrostatic
filters.
From: Illulissat,
Greenland.
1 3
1
Distilled
Water
Cd
Cr
Cu
Pb
Zn
< 0.01
< 0.1
< 0.01
2
< 0.1(a)
(Kirkelund et
al., 2013)
1 3
2
Distilled
Water
Cd
Cr
Cu
Pb
Zn
1
< 0.1
1
4
1 (a)
(Kirkelund et
al., 2013)

24
helps to solubilise the heavy metals (Ferreira, 2005). After, that, metals can be mobilised under the
electric field and transported away from waste, more acidification better removals rates (Ferreira, 2005).

25
3. Material and methods
For a better understanding of the experimental work, Figure 3.1 presents the materials and methods used
in the work, initial characterization, ED experimental conditions, mortar bars conditions, performance
machines and which legislation was used in section 4 aims to verify if the residues were in conformity.
Figure 3.1. Scheme of initial characterization, ED experiments and casting of specimens
APC RESIDUES
Initial characterization
Electrodialytic Remediation Ion exchange membranes
L/S: 3.5 Different conditions:
Compartments – 3 and 2
Current -5 mA and 50 mA Duration of treatment – 3,7
and 14 days
Mortar Bars – Casting of specimens
5% APC before and after ED process
running for 7 days
In tap water for 28 days
Mortar tests after 28 days of curing:
Morphology (SEM/EDS)
(a)Porosity
(a)Density
Compressive strength
(b)Leaching
(c )Chloride
Wet system
Vest
Semi-dry system
REFA
Tests for Cd, Cr, Cu, Pb and Zn:
Concentrations (mg kg-1);
Leaching behaviour (mg L-1);
Tests for Chloride and Sulphate (mg L-1)
BEK 1662
(a)Building Materials
-Basic properties
(b)EEA landfill
criteria for Heavy
metals
(c)EN 206-1 for
standard concrete
With
PRE-TREATMENT
Without
PRE-TREATMENT

26
3.1 Air pollution control residues
Two types of APC residues from MSWI, were used in this study. Both were collected from two Danish
waste incineration plants: one collected after a semi-dry process from I/S REFA and a second one after
a wet flue gas cleaning process from I/S Vestforbrænding (Vest). I/S REFA collects and treats all kinds
of households in a total of approximately 200 000 t year-1, producing approximately 3 000 t year-1 of
APC residues. Vestforbrænding has total capacity of 600 000 t year-1, with a production of APC residues
of 15 000 t year-1.
3.2 Characterization methods
In all methods a series of three replicates were carried out. The APC residues characterization and
extraction experiments were carried out using dried ash at 105 ºC for 24 h. Total concentration of Cd,
Cr, Cu, Pb and Zn in the APC residues were measured by Inductively Coupled Plasma with optical
emission spectrometry (ICP-OES), after pre-treatment according to the Danish Standard DS 259, in
which 1 g of APC residue and 20 mL (1:1) HNO3 were heated at 200 kPa (120 ºC) for 30 min. After
digestion, the samples were vacuum filtered through a 0.45 µm filter and diluted till 100 mL. The units
used in this thesis are mg kg-1 for the concentration in dry matter.
The pH in the APC residues were measured with a Radiometer pH-electrode in 1 M KCl at L/S ratio of
2.5 and in deionised water at liquid to solid (L/S) ratio of 5, after 1 h of agitation at 190 rpm. The
conductivity was measured at the same time as the pH with deionised water, in a Radiometer Analytic.
Loss on ignition (LOI) was found after 30 min at 550 ºC. Water content was measured as weight loss
after 24 h at 105 ºC (calculated as weight loss over the weight of the wet sample). Water solubility: 100
g APC residues were suspended in 500 mL deionised water and agitated for 1 min. After settling, the
water was decanted. New 500 mL deionised water were added. This was repeated three times to ensure
that the APC residues were properly washed. The suspension was then filtered thought a 0.165 µm filter
and the APC dried residue (105 ºC) weighed. Carbonate content was determined using a Scheibler
apparatus, where a standard curve was first performed using different CaCO3 contents combined with
HCl. The APC residues were mixed with HCl and then the CaCO3 concentration was determined.
Leaching tests on the two APC residues were made according to CEN prEN 12457-1, with slight
modifications. The L/S ratio was 2, mixing 10 g of APC residue and 20 mL deionised water. The
suspension was shaken for 23 h on an end-over-shaker. The suspension pH was measured before vacuum
filtration through a 0.45 µm nucleo filter and the heavy metal concentrations in the filtrate were

27
determined by ICP-OES. Levels of chloride and sulphate were determined by Ion Chromatography (IC)
after extracting 10 g of APC residue with 50 mL of deionised water overnight.
Regarding particle size distribution (annex A.1) and specific surface area, these results were performed
by Laser Diffractometer. The statistics were performed using the programme GraphPad Prism 6. In order
to determine if the two APC residues were different, t-test A-NOVA was performed on the initial
characteristics.
3.3 Electrodialytic experiments
Twenty four ED experiments were performed with the APC residues, according to the experimental
conditions presented in Table 3.1. Twelve of them were performed in an ED cell with 3C, two electrodes,
two ion exchange membranes (cation and anion) and a central cell compartment. The other 12 were
carried out in an ED cell with 2C, two electrodes, one cation-exchange membrane and a central cell
compartment, where the contaminated media was placed (Figure 3.2).
Figure 3.2. Schematic presentation the experimental ED cells. Both models developed at DTU, Denmark: (a) 3
compartment cell, (b) 2 compartment cell. (AN = anion exchange membrane, CAT = cation exchange membrane)
All experiments were performed with 350 mL of deionised water and 100 g of the APC residue,
corresponding to a L/S ration of 3.5.
The ED cells were made of plastic (RIAS, Acryl XT), the internal diameter was 8 cm and the central
compartment length was 10 cm. Electrode compartments were separated from the central compartment
by an anion-exchange membrane AR204SZRA, MKIII, Blank and a cation-exchange membrane CR67,
MKIII, Blank, both from Ionics. In the 2 compartment cell, the separation was carried out only with a
cation-exchange membrane of the same brand. The surface area of the membrane corresponded to
approximately 50 cm2 each. The electrodes were made of platinum coated titanium wire (Ø = 3 mm)
made by Grønvold & Karnov A/S. A power supply (Hewlett Packard E3612A) was used, maintaining a
constant current of 5 mA and 50 mA, approximately 0.1 mA cm-2 and 1 mA cm-2, respectively,
depending on the experiment in hand. The APC residue suspension was placed on the central
(a) (b)

28
compartment, stirred by a flexible plastic flab, attached to a glass-stick and connected to an overhead
stirrer (RW11 basic from IKA) with a rotation velocity rate of 0-2000 L min-1. Initially, the suspension
reached about 3 cm below the hole where the stirrer was placed, but the height slightly differed during
the experiments.
Table 3.1. Experimental conditions for the different EDR experiments
Experiments APC residue
type
Current
density
(mA cm-2)
Duration
(day)
Number of
compartments
1
Vest
Wet treatment
0.1
3
3 2 7
3 14
4 3
2 5 7
6 14
7
1
3
3 8 7
9 14
10 3
2 11 7
12 14
13
REFA
semi-dry treatment
0.1
3
3 14 7
15 14
16 3
2 17 7
18 14
19
1
3
3 20 7
21 14
22 3
2 23 7
24 14
The anolyte and the catholyte used were 0.01 M NaNO3 with pH adjusted to 2 with HNO3 (1:1). In the
experiments with 3C, 500 mL of anolyte and 1000 mL of catholyte were used, while in the experiments
with 2C, only 500 mL of catholyte was used. The recirculation was made using “Pan World” magnetic
pumps from Plastomec Magnet Pump model P05, with a performance rate of 8 L min-1 Voltage and
electric current was read on weekdays during the remediation period, pH of the electrolytes and the pH
of the APC residue suspension were measured twice a day. pH in the electrolyte was adjusted with (1:1)
HNO3, if pH > 2. The conductivity was measured in the central compartment once a day.
At the end of the experiments the suspension in the central compartment was filtered through a 45 µm
filter at normal pressure. The APC residue was digested with acid according to the procedure described
in section 3.2. The membranes and stirrer were soaked in 1M HNO3 and the electrodes in 5M HNO3, in

29
order to release precipitated metals. The obtained aqueous phase of the membranes, the stirring, the
electrodes and the electrolytes were all analysed for heavy metals (Cd, Cr, Cu, Pb and Zn) by ICP-OES.
The pH, leaching and chloride and sulphate were also determined using the dry ash (105 ºC) according
section 3.2.
3.4 Mortar bars
The mortar bars were made using the raw APC residues (REFA and Vest) and those that were ED treated
for 7 days. The selection of the 7 day- remediation was based on the pH of the APC residue, which
should preferably be alkaline for a better aggregate with the cement. The type of cement used was an
alkali cement.
The morphology and element distribution analysis was performed by SEM/EDS (Scanning electron
microscope/energy dispersive X-ray spectroscopy). No sample pre-treatment was made. The
acceleration voltage of the SEM was 20-25 kV with large field detector, in low vacuum with a
magnification of 1000x.
The procedure used for the mortar samples was mixed according to DS/EN 196-7: 225 mL deionised
water, 450 g Ordinary Portland cement and 1350 g CEN standard sand (Ø < 2 mm), with a water/binder-
ratio of 0.5 and a sand/cement ratio of 3. Five percent of cement volume was replaced with APC residue.
Eleven experimental mortars were made, according to Table 3.2.
Table 3.2. Experimental conditions of mortar bars-casting of specimens
Reference Vest REFA
0% of APC
residue
Raw
Upgraded APC
residue
ED experiment: 2, 5,
8 and 11
Raw
Upgraded APC
residue
ED experiment: 14,
17, 20 and 23
Substitution of
cement with 5%
untreated APC
residue
Substitution of
cement with 5%
treated APC residue
Substitution of
cement with 5%
untreated APC
residue
Substitution of
cement with 5%
treated APC
residue
The moulding was carried out according to DS/EN 196-7. The mould consisted of three horizontal
compartments so that 3 prismatic specimens of 40 x 40 mm in cross section and 160 mm in length were
prepared, simultaneous for each mixture. Demoulding was carried out after 24 h and the samples were
cured horizontally in a tap water bath for 28 days. The ambient temperature was 20 - 21 ºC, as prescribed

30
in DS/EN 196-7 (20 ± 1 ºC). After curing in tap water for 28 days, the mortars were set curing for a
period of 28 days (20 days at 50 ºC and 8 days at ambient air temperature) and the porosity, density and
compressive strength were determined.
Aiming to determinate porosity and density, the mortars were placed in desiccators under vacuum for
3 h (100 N m-2). The set-up was filled with deionised water (1 h), and then opened to the air (24 h). The
mortars bars were weighed under the water with the accuracy of 0.1% to measure the porosity of the
mortar. Porosity and density were determined at the same time, using the following equation:
Porosity (%) = Vpå
𝑉 (3.1)
Density (kg m-3):
ρd = 𝑚105
𝑉 (3.2)
ρf = 𝑚105
(𝑉−𝑉𝑝å) (3.3)
Where:
Vpå = (𝑚𝑠𝑠𝑑−𝑚105)
𝜌𝑤 , (3.4)
mssd - weight after vacuum; m105 - weight without vacuum; ρw = 1000 kg m-3
V=(𝑚𝑠𝑠𝑑−𝑚𝑠𝑤)
𝜌𝑤, (3.5)
mssd - weight after vacuum; msw - weight after vacuum under the water; ρw = 1000 kg m-3
Compressive strength measurements were performed in each end of the prismatic mortar specimens
(with the end face of the prism overhanging the plate with 1 cm), as prescribed in DS/EN 196-1. The
plates were, however, 4 cm long, meaning that the actual pressure area was 40 x 40 mm. A Toni 3000
compression machine was used. From this procedure a double determination of the compressive strength
for each mortar recipe was obtained.
Mortar bars were then crushed and tested for heavy metal leachability and chloride content. The leaching
proceeding was carried out as described in section 3.2, but for chloride determination the mortars
procedure was the following: 5g of crushed mortars were mixed with 50 mL deionised water and 10 mL
concentrated HNO3. After the solution was filtered, approximately 90 mL deionised water was added.
The final solution was 150 mL and the chloride determination was performed by Metrohm 727 RI Stand,
by titration.

31
4. Results and discussion
4.1 Air pollution control residues characteristics
In wet systems, like Vest, the APC residue is removed before the neutralization of acidic components.
On the other hand, in semi-dry systems, like REFA, the APC residue is removed from fuel gas after the
injection of slaked lime into the gas. These different systems imply different ash characteristics, which
a simple visual analysis can detect (Figure 4.1). Their colour and their weight are very different, being
the Vest much heavier than REFA, similar to sand. However, they both, show similarities, such as a fine
to medium grain fine matrices.
Figure 4.1. Appearance of the APC residues under study – (a) REFA and (b) Vest
Statistical analysis of the ash characteristics was carried out using GrafPad Prims 6 software. T-test was
chosen because it is one-sided, since the objective was to compare each individually parameter. This
test showed that the two types of APC residues are significantly different, with 99% and 95% confidence
levels with some exceptions, such as water solubility and water content (Table 4.1).
Both APC residues are highly alkaline being the conductivity and carbonate content, higher for REFA
than for Vest. The heavy metals present in higher concentrations were Pb (2.71 g kg-1 and 3.11 g kg-1)
and Zn (22.40 g kg-1 and 19.44 g kg-1) for Vest and REFA respectively, which are typical for APC
residues. Lima et al. (2010b) present similar results for their studied fly ashes: 3 g Pb kg-1 to 9 g Pb kg-
1 and 5 g Zn kg-1 to 27 g Zn kg-1.
Cadmium concentrations increase significantly with decreasing ash precipitation temperature. The
capture of Cd into FA particles is mainly a physical adsorption at relative low temperatures but, at higher
temperatures, FA chemisorption between Cd and aluminosilicates may take place, forming complex Cd-
aluminosilicates (Lima, 2008). I/S REFA presents 88.7 mg Cd kg-1 and Vest 97.6 mg Cd kg-1. According
(a) (b)

32
to Lima et al. (2008b) the flue gas stream temperature also influences the concentration of Cd in FA.
Therefore, the differences between Cd concentrations of the two ashes may be related to the temperature
factor as Vest ash was being subjected to a lower flue gas temperature (230 ᵒC) compared to REFA ash
(400 ᵒC).
Table 4.1. Characteristics of APC residues from Vest and REFA (mean values ± standard error)
Parameter APC residue
Vest REFA
pHH2O (L/S=5)a 12.46 ± 0.02 12.03 ± 0.00
pHKCl (L/S=2.5)a 12.42 ± 0.00 12.24 ± 0.02
Conductivity (mS cm-1) a 55.33 ± 1.11 75.24 ± 1.82
Water content (%) 0.36 ± 0.00 0.87 ± 0.25
Water solubility (%) 0.76 ± 0.06 0.66 ± 0.06
Loss on ignition (%) a 0.76 ± 0.14 4.07 ± 0.04
Carbonate content (%) a 8.37 ± 0.06 14.55 ± 0.12
Specific surface area (cm2 g-1) 215.5 ± 2.5 284.0 ± 217.0
Cd (mg kg-1) b 97.6 ± 0.4 88.7 ± 2.0
Cr (mg kg-1) a 99.0 ± 1.1 73.1 ± 0.9
Cu (mg kg-1) a 749.1 ± 7.0 551.2 ± 20.7
Pb (g kg-1) 2.71 ± 0.30 3.11 ± 0.11
Zn (g kg-1) a 22.40 ± 0.41 19.44 ± 0.37
Leaching
pH
12.4 ± 0.0
11.8 ± 0.0
Cd (mg L-1) n.d. n.d.
Cr (mg L-1) 0.02 ± 0.00 0.03 ± 0.00
Cu (mg L-1) a 0.01 ± 0.00 0.27 ± 0.02
Pb (mg L-1) a 41.9 ± 2.3 450.0 ± 9.6
Zn (mg L-1) a 2.41 ± 0.23 12.70 ± 0.39
Cl- (g L-1) a 12.11 ±0.18 25.60 ± 0.15
SO42- (g L-1) a 4.30 ± 10.06 0.01 ± 0.00
a Significantly different ( p < 0.01)
b Significantly different ( p < 0.05)
n.d. not detected
Both ashes present high level of Cr, 73.1 mg kg-1 for REFA and 99 mg kg-1 for Vest. However, total Cr
concentration does not necessarily indicate hazardousness of Cr, being necessary to distinguish between
Cr(III) and Cr(VI). Chromium(VI) from chromates, which is highly toxic compared to Cr(III). Oxidation
of Cr(III) into Cr(VI) may occur when Cr2O3 is burned in the presence of oxygen or when Cr(OH)3 and
MnO2 interact in moist aerobic conditions (prevented if sulphides are present) (Lima et al., 2008b).

33
Leaching of Cr in alkaline wastes is typically in the form of Cr(III) (Quina, 2005) and in REFA and Vest
the leaching is low, and not statistically significant different.
Lead presented high leaching, particularly for REFA APC residue, and this parameter does not depend
on the total concentration of metal. Regarding the salts, REFA present a higher chloride and a less
sulphate content, due to the type of APC system.
The low LOI obtained for Vest indicates a complete and efficient combustion during the incineration
process, which means that a higher incineration temperature was achieved. Regarding carbonate content,
REFA presents a high value, which was expected as in the gas cleaning process (semi-dry) lime (CaO)
is one of the additives used. Once CaO is exposed to moderate amounts of water, hydration occurs
forming Ca(OH)2 that may later react with carbon dioxide forming calcium carbonate according to
equation 4.1.:
Ca(OH)2 (aq) + CO2(aq) CaCO3 (cr) + H2O (4.1)
The carbonate of an ash may be a relevant parameter, as CaCO3 absorbs a range of metals in soils (Lima,
2008).
4.2 Electrodialytic experiments
4.2.1 pH and conductivity
The pH and conductivity in the APC residues suspension during the EDR experiments is shown for Vest
in Figures 4.2 and 4.4, and for REFA in Figures 4.3 and 4.5. The applied current of 5 mA and 50 mA
could be maintained during all experiments. When 5 mA were applied, the voltage drop was between
1.3 - 2.6 V and between 1.3 - 5 V for the APC residues of Vest and REFA, respectively. The voltage
drop for 50 mA was 2.5 - 7 V for Vest, and 2.8 - 7.6 V for REFA. As the current was kept constant, an
increase in voltage means that there was an increase in suspension resistivity, according to Ohm’s law,
probably due to the decrease in the amount of ions in the ash suspension. Membrane fouling may also
have contributed for it.
The pH of experiments with Vest ash suspensions decreased faster over time, this had a direct relation
of more time, more acidification and more heavy metals removal. In REFA, the pH after 7 days was still
alkaline (pH > 11), and after 14 days of treatment time, all of the experiments were alkaline. In some
cases, the pH increased after 12 days (Figure 4.3). This was probably due to the amount of ash used and
the higher buffering capacity. REFA presented a higher CaCO3, and this characteristic, increases the

34
ashes buffer capacity and, due to this fact, the pH does not change easily. With Vest, the pH lowered
faster in the 2C setup. On the other hand, for REFA the different setup did not change the pH behaviour.
The decrease in pH can be explained due to a combination of two reactions. During the ED treatment
different hydroxides are dissolved, OH- is removed from central compartment and water splitting may
occur at the anion exchange membrane, resulting in acidification of the medium in the central cell
compartment. When a neutral pH in the final ash amount is observed, it may indicate that the hydroxides
have been dissolved and OH- removed (Ottosen et al., 2006). But, the acidic level cannot be explained
this way. For this, H+ ions must have been supplied to the central compartment, and the water separation
at the anion exchange membrane probably played the central role.
Figure 4.2. pH of the two- and the three-compartment ED cell experiments for the duration of 3, 7 and 14 days and 5
mA and 50 mA for Vest; (xC –x number of compartments, C compartments; xD – x remediation time, D days; x mA-
x intensity of DC)
Figure 4.3. pH of the two- and the three-compartment ED cell experiments for the duration of 3, 7 and 14 days and 5
mA and 50 mA for REFA; (xC –x number of compartments, C compartments; xD – x remediation time, D days; x
mA- x intensity of DC)
0
2
4
6
8
10
12
14
0 2 4 6 8 10 12 14
pH
Days
2C 3D 5 mA 2C 3D 50 mA 2C 7D 5 mA 2C 7D 50 mA 2C 14D 5 mA 2C 14D 50 mA
3C 3D 5 mA 3C 3D 50 mA 3C 7D 5 mA 3C 7D 50 mA 3C 14D 5 mA 3C 14D 50 mA
0
2
4
6
8
10
12
14
0 2 4 6 8 10 12 14
pH
Days
2C 3D 5 mA 2C 3D 50 mA 2C 7D 5 mA 2C 7D 50 mA 2C 14D 5 mA 2C 14D 50 mA
3C 3D 5 mA 3C 3D 50 mA 3C 7D 5 mA 3C 7D 5 mA 3C 14D 5 mA 3C 14D 50 mA

35
The initial electrical conductivity was significantly high in all 24 experiments, especially for REFA. In
all the ED experiments voltage never exceeded 7.6 V. Higher voltage was usually observed at the end
of the experiments when the electrical conductivity was lower (Figure 4.4 and 4.5). The ideal
remediation time should be when the electrical conductivity is low in the liquid suspension, as it means
that small amounts of ions are present and able to be removed. In this study, Vest presented the lower
electrical conductivity values, and despite the difficult characteristics of this residue, the voltage seems
to be sufficient to remove some ions in solution. However, when REFA was used electrical conductivity
increased in some of the experiments (Figure 4.5). This suggests that the applied current density was
not sufficient for removing all ions in the experiments with this L/S ratio (3.5). Furthermore, the low
voltage shows that there were no problems due to membrane fouling.
Figure 4.4. Conductivity of the two- and the three-compartment ED cell experiments for the duration of 3, 7 and 14
days and 5 mA and 50 mA for Vest; (xC –x number of compartments, C compartments; xD – x remediation time, D
days; x mA- x intensity of DC)
Figure 4.5. Conductivity of the two- and the three-compartment ED cell experiments for the duration of 3, 7 and 14
days and 5 mA and 50 mA for REFA; (xC –x number of compartments, C compartments; xD – x remediation time, D
days; x mA- x intensity of DC)
0
10
20
30
40
50
60
70
80
90
0 2 4 6 8 10 12 14
Con
du
ctiv
uty
(m
S c
m-1
)
Days
2C 3D 5 mA 2C 3D 50 mA 2C 7D 5 mA 2C 7D 50 mA 2C 14D 5 mA 2C 14D 50 mA
3C 3D 5 mA 3C 3D 50 mA 3C 7D 5 mA 3C 7D 50m A 3C 14D 5 mA 3C 14D 50 mA
0
10
20
30
40
50
60
70
80
90
0 2 4 6 8 10 12 14
Con
du
ctiv
uty
(m
S c
m-1
)
Days
2C 3D 5 mA 2C 3D 50 mA 2C 7D 5 mA 2C 7D 50 mA 2C 14D 5 mA 2C 14D 50 mA
3C 3D 5 mA 3C 3D 50 mA 3C 7D 5 mA 3C 7D 50m A 3C 14D 5 mA 3C 14D 50 mA

36
The mass balances for the elements showed high variability for all experiments (Table 4.2). An
inhomogeneous distribution of metals in the ash and as a result imperfect mass balances are expected
when working with this type of samples. Finally, although careful handling of all samples precipitation
of insoluble compounds may occur for instance in set-up tubing. The mass balance rate should be
between 90-110% in the best situation or, on a broader scale between 85-120%. However as Table 4.2
data, it was not always the case. Recoveries below the rate can be due to some solution leakage from
central cell compartment during the experiments. These losses may occur due to the rapid passage of
ions or excess ash in the ED cell. During the experiments, volume decrease in the electrolytes occurred
and this may be due to a faster velocity of the electrolyte entering the anode/cathode compartment
comparing to the output velocity. This passage presses the membrane and the electrolyte can pass into
the central compartment, causing an increase of the central solution volume, therefore the solution may
exit through the agitator hole.
An incomplete extraction of the heavy metals in the initial ash may have resulted in mass balances ratios
above 120%. The extraction was carried out using the DS 259 standard in which nitric acid is used. For
a complete heavy metal extraction acid digestion could have been performed using much powerful
mixtures such as: hydrofluoric acid or aqua regia.
Table 4.2. Recovery rates of Cd, Cr, Cu, Pb and Zn and final pH at the end of the ED experiments for Vest and
REFA APC residues; (xC –x number of compartments, C compartments; xD – x remediation time, D days; x mA- x
intensity of DC)
Due to the imperfect mass balances, and in order to keep all the results, the removal percentages were
calculated by dividing the amount of heavy metals that remained in the ash after the ED process, by the
Recovery (%)
pH in the
APC residues Cd Cr Cu Pb Zn
Experiment Vest REFA Vest REFA Vest REFA Vest REFA Vest REFA Vest REFA
2C 3D 5 mA 11.0 12.8 90 93 91 86 94 91 99 67 81 115
2C 3D 50 mA 10.3 12.8 154 86 95 65 123 69 148 89 115 116
2C 7D 5 mA 10.8 12.9 90 118 94 113 103 113 110 92 91 88
2C 7D 50 mA 8.9 12.8 131 131 131 127 137 123 116 125 91 99
2C 14D 5 mA 10.6 12.8 95 82 105 77 103 79 111 85 99 100
2C 14D 50 mA 6.4 10.9 101 104 120 98 90 106 78 102 45 147
3C 3D 5 mA 11.1 12.9 99 43 100 40 117 42 129 54 117 54
3C 3D 50 mA 10.6 12.9 100 58 113 53 112 56 68 59 138 76
3C 7D 5 mA 10.7 12.9 75 116 76 113 82 109 91 88 89 87
3C 7D 50 mA 11.2 13.0 119 120 112 110 105 113 38 103 80 87
3C 14D 5 mA 10.6 10.1 95 61 95 57 95 61 118 70 97 83
3C 14D 50 mA 8.2 11.7 120 75 113 69 122 75 66 87 105 103

37
sum of the amounts of heavy metals detected in all cell compartments at the end of the experiments.
Thus, obtained the percentages that are still in the ash.
4.2.2 Removal and mobilization of heavy metals
The best heavy metals removal for the APC residue with wet and semi-dry cleaning system are presents
in Figure 4.6.
Figure 4.6. Best removal rates (%) for Cd, Cr, Cu, Pb and Zn during the ED experiments: (a) Vest and (b) REFA
For 24 ED experiments, removal percentages are in annex (T.1 and T.2), with Cu presenting the worst
values. Lima et al. (2010b) proved that ash type, duration and dissolution were the most significant
variables on heavy metal migration during the ED experiments. Increasing remediation time leads to
higher removal efficiencies, while increasing the dissolution of the ash during EDR implies in lower
removal efficiencies. Figures 4.7 – 4.11 present the final distribution of Cd, Cr, Cu, Pb and Zn in the
two types of ash including not only the electrolytes, but also heavy metals found at the membranes,
electrodes and in the middle solution, as well as the residual amounts left in the ash. The anode
compartment only makes sense in experiments with 3C.
Figure 4.7 illustrates the distribution of Cd in the cell at the end of the 24 ED experiments. The best
results occurred when a significant fraction of Cd was removed towards the cathode side, probably as
Cd2+. According to Lima et al. (2008b), better separation of Cd should be achieved when the soluble
chlorides are removed prior to the ED treatment. When pH decreases in ash suspensions, reduction of
chloride content occurs due to electromigration, and Cd will be more easily removed towards the
cathode. In some ED experiments, although most of the metal was removed to the cathode side, there is
still an important amount that remained in the ash suspension. This indicates that the removal process
was still not finished, probably or due to the presence of uncharged complexes (CdCl20), which do not
electromigrate under the influence of an electric field (Lima et al., 2008b). The mobilization for Vest
84
17
30
5
67
Cd Cr Cu Pb Zn
Rem
oval
rat
es (
%)
7
21
2
67
1
Cd Cr Cu Pb Zn
Rem
oval
rat
es (
%)
(a) (b)

38
was higher than in REFA. In REFA, after the ED treatment, a majority of the Cd was still found in the
ash and only a small amount was removed to the electrolytes.
Figure 4.7. Cadmium distribution after the 24 ED experiments: (a) Vest and (b) REFA. (Cathode – electrode cathode,
electrolyte(-) and cation-exchange-membrane; Anode – electrolyte(+) and anion-exchange membrane; M – middle
compartment; (xC –x number of compartments, C compartments; xD – x remediation time, D days; x mA- x intensity
of DC)
Most of the Cr was found in the suspension liquid or remained in the ashes, even in the experiments
with the best removal percentages (Figure 4.8). This observation may be attributed to the two oxidation
states of Cr in an acidic aqueous medium, Cr(III) and Cr(VI). Ionic complexes that are negatively
charged are the most abundant form with Cr(III) found, for example, on oxalates (Cr(C2O4)33-) or
positively charged as Cr(VI).
Figure 4.8. Chromium distribution after the 24 ED experiments: (a) Vest and (b) REFA. (Cathode – electrode
cathode, electrolyte(-) and cation-exchange-membrane; Anode – electrolyte(+) and anion-exchange membrane; M –
middle compartment; (xC –x number of compartments, C compartments; xD – x remediation time, D days; x mA- x
intensity of DC)
0%
10%
20%
30%
40%
50%
60%
70%
80%
90%
100%
2C
3D
5m
A
2C
3D
50
mA
2C
7D
5m
A
2C
7D
50
mA
2C
14D
5m
A
2C
14D
50m
A
3C
3D
5m
A
3C
3D
50
mA
3C
7D
5m
A
3C
7D
50
mA
3C
14D
5m
A
3C
14D
50m
A
Cathode M Ash Anode(a)
0%
10%
20%
30%
40%
50%
60%
70%
80%
90%
100%
2C
3D
5m
A
2C
3D
50
mA
2C
7D
5m
A
2C
7D
50
mA
2C
14D
5m
A
2C
14D
50m
A
3C
3D
5m
A
3C
3D
50
mA
3C
7D
5m
A
3C
7D
50
mA
3C
14D
5m
A
3C
14D
50m
A
Cathode M Ash Anode(b)
0%
10%
20%
30%
40%
50%
60%
70%
80%
90%
100%
2C
3D
5m
A
2C
3D
50
mA
2C
7D
5m
A
2C
7D
50
mA
2C
14D
5m
A
2C
14D
50m
A
3C
3D
5m
A
3C
3D
50
mA
3C
7D
5m
A
3C
7D
50
mA
3C
14D
5m
A
3C
14D
50m
A
Cathode M Ash Anode(a)
0%
10%
20%
30%
40%
50%
60%
70%
80%
90%
100%
2C
3D
5m
A
2C
3D
50
mA
2C
7D
5m
A
2C
7D
50
mA
2C
14D
5m
A
2C
14D
50m
A
3C
3D
5m
A
3C
3D
50
mA
3C
7D
5m
A
3C
7D
50
mA
3C
14D
5m
A
3C
14D
50m
A
Cathode M Ash Anode(b)

39
Figure 4.9 shows Cu removal percentages obtaining for the 24 ED experiments. They were low in both
ashes. These probably occurred because of the very large amount of Cu in the raw ash. Still a low
removal is mostly found in the cathode side, probably as Cu2+. For Cu the ED experiments need some
adjustments, e.g. longer experiments, as over time the medium becomes acidified. Above pH 6, hydrated
ion Cu2+ is progressively hydrolysed, which allows a larger and stronger adsorption to ash constituents
(Ribeiro, 1992). For pH above 7, much of the Cu in the ash solution is complexed with the organic
matter (Ribeiro, 1992). Although the matrix is ash, the LOI was high particulaly for REFA.
Figure 4.9. Cooper distribution after the 24 ED experiments: (a) Vest and (b) REFA. (Cathode – electrode cathode,
electrolyte(-) and cation-exchange-membrane; Anode – electrolyte(+) and anion-exchange membrane; M – middle
compartment; (xC –x number of compartments, C compartments; xD – x remediation time, D days; x mA- x intensity of DC)
The mobilization of Pb was particularly successful in the ash from REFA, contrary to Vest ash. This
may be due to the different characteristics that are dependent on the gas cleaning system (as previously
referred). In wet systems the amount of sulphates in the final residue is higher, since they are taken
before neutralizing acidic components. According to Ferreira et al. (2008), due to the presence of SO42-
, PbSO4 complexes, which are relatively insoluble can be formed and, this makes Pb solubilisation more
difficult in Vest residue. Figure 4.10 shows that Pb is mobilized for both sides, cathode and anode.
Again, according to Ferreira et al. (2008), Pb may be present in the form of Pb(CO3)2 2- migrating to the
anode side, and as Pb2+ being mobilized towards cathode. About the setup, in REFA the use of 2C seems
to be less successful, although for the 14 days experiments and high current strength, the mobilization
occurs.
0%
10%
20%
30%
40%
50%
60%
70%
80%
90%
100%
2C
3D
5m
A
2C
3D
50
mA
2C
7D
5m
A
2C
7D
50
mA
2C
14D
5m
A
2C
14D
50m
A
3C
3D
5m
A
3C
3D
50
mA
3C
7D
5m
A
3C
7D
50
mA
3C
14D
5m
A
3C
14D
50m
A
Cathode M Ash Anode
0%
10%
20%
30%
40%
50%
60%
70%
80%
90%
100%
2C
3D
5m
A
2C
3D
50
mA
2C
7D
5m
A
2C
7D
50
mA
2C
14D
5m
A
2C
14D
50m
A
3C
3D
5m
A
3C
3D
50
mA
3C
7D
5m
A
3C
7D
50
mA
3C
14D
5m
A
3C
14D
50m
A
Cathode M Ash Anode(a) (b)

40
Figure 4.10. Lead distribution after the 24 ED experiments: (a) Vest and (b) REFA. (Cathode – electrode cathode,
electrolyte(-) and cation-exchange-membrane; Anode – electrolyte(+) and anion-exchange membrane; M – middle
compartment; (xC –x number of compartments, C compartments; xD – x remediation time, D days; x mA- x intensity of DC)
For REFA ash the best Zn removal rate was not significant (1%), which be due to pH. Ferreira (2005)
studied that the pH influences the mobilization of some heavy metals being this parameter very
important, particularly for Zn. The pH in all of the ED experiments with REFA (Figure 4.2) remained
above pH 7, and in basic pH Zn is immobile as Zn5(OH)6(CO3)2. In some experiments with Vest, pH
was below 7 and almost the whole amount of Zn that was removed was found in cathode side, probably
as Zn2+ (Figure 4.11). For the experiment with 2C (7 and 14 days of duration) and 3C (7 days of
duration), with high current (Annex T.1), a good mobilization was achieved.
Figure 4.11. Zinc distribution after the 24 ED experiments: (a) Vest and (b) REFA. (Cathode – electrode cathode,
electrolyte(-) and cation-exchange-membrane; Anode – electrolyte(+) and anion-exchange membrane; M – middle
compartment; (xC –x number of compartments, C compartments; xD – x remediation time, D days; x mA- x intensity
of DC)
0%
10%
20%
30%
40%
50%
60%
70%
80%
90%
100%
2C
3D
5m
A
2C
3D
50
mA
2C
7D
5m
A
2C
7D
50
mA
2C
14D
5m
A
2C
14D
50m
A
3C
3D
5m
A
3C
3D
50
mA
3C
7D
5m
A
3C
7D
50
mA
3C
14D
5m
A
3C
14D
50m
ACathode M Ash Anode(a)
0%
10%
20%
30%
40%
50%
60%
70%
80%
90%
100%
2C
3D
5m
A
2C
3D
50
mA
2C
7D
5m
A
2C
7D
50
mA
2C
14D
5m
A
2C
14D
50m
A
3C
3D
5m
A
3C
3D
50
mA
3C
7D
5m
A
3C
7D
50
mA
3C
14D
5m
A
3C
14D
50m
A
Cathode M Ash Anode(b)
0%
10%
20%
30%
40%
50%
60%
70%
80%
90%
100%
2C
3D
5m
A
2C
3D
50
mA
2C
7D
5m
A
2C
7D
50
mA
2C
14D
5m
A
2C
14D
50m
A
3C
3D
5m
A
3C
3D
50
mA
3C
7D
5m
A
3C
7D
50
mA
3C
14D
5m
A
3C
14D
50m
A
Cathode M Ash Anode
0%
10%
20%
30%
40%
50%
60%
70%
80%
90%
100%
2C
3D
5m
A
2C
3D
50
mA
2C
7D
5m
A
2C
7D
50
mA
2C
14D
5m
A
2C
14D
50m
A
3C
3D
5m
A
3C
3D
50
mA
3C
7D
5m
A
3C
7D
50
mA
3C
14D
5m
A
3C
14D
50m
A
Cathode M Ash Anode(a) (b)

41
4.2.3 Leaching behaviour
More important than the total amount of heavy metals left in the ash, is the amount that is in an easily
leachable fraction, since it poses the highest environmental risk. If the leaching is low, it can be a great
advantage and the beginning for thinking about a potential reuse. The reduced leaching also means that
the mobile parts of the metals were removed during the electro-remediation, even though the total metal
concentrations increased due to ash dissolution.
The leaching behaviour allowed to identify main problems in these types of residue - the high amounts
of heavy metals (mainly Pb and Zn), which can be released into the environment, as well as high soluble
fraction (mainly associated with Cl- or SO42-). In fact, the main negative environmental impact of APC
residues results from leaching processes which produce solutions with toxic characteristics for living
beings.
The pH is directly related to the amount of leached metals. At a more acidic pH, it is expected a higher
mobility of metals, and consequently more leaching. Figures 4.12 and 4.13 are related to pH and
leachable amount for Vest and REFA ash, respectively, subjected to ED process. The figures also
compare the quantities of each metal leached with the limitations imposed by BEK 1662/ 2010 - use of
waste products in construction industry – which include the classes C1 and C3. C1 has a free use and
C3 has a restricted use. The ideal scenario would be to have all metals in category C1. Experiments with
* indicate zero values for metal leaching. The results showed significantly reduced leaching of heavy
metals from upgraded APC residue from Vest, even with higher total heavy metal content. Looking at
Cd, the experiments with several durations, and consequently with different acidification solution,
increase the leaching behaviour of this metal. The leached Cr concentration was however increased in
upgraded ash of all experiments compared to the raw ash, and this should be investigated, since it is
difficult and important to stabilize Cr in mortars. In this study, it was not investigated if Cr was present
as Cr(IV) or Cr(III), but it is important to include in future studies. Section 4.2.2 showed that Cu was
very stable in the ash suspension, with a high amount, but without mobilization, whereas leached Cu
showed that all of the values were below C3 after treatment. Lead presents a very soluble amount
fraction, and for the upgraded ashes from Vest it was particularly successful compared to the other
studies: 3.8 mg Pb L-1 (Kirkelund et al., 2010). Regarding Pb, values of zero were it obtained for
leaching, and only 2 upgraded ashes below C1 but almost all the ED experiments were below C3. Zinc
presents increased leaching after experiments with 14 days and high current (50 mA).
Summarizing, the worst leaching results were obtained for 2 and 3 cell compartments for 14 days of ED
process, as well as 7 days of ED treatment with a 2C. The best removal rates, obtained with lower pH,
present higher values for leaching. Chromium, is the only heavy metal which after EDR, increased all
their leaching values, compared to the raw residue.
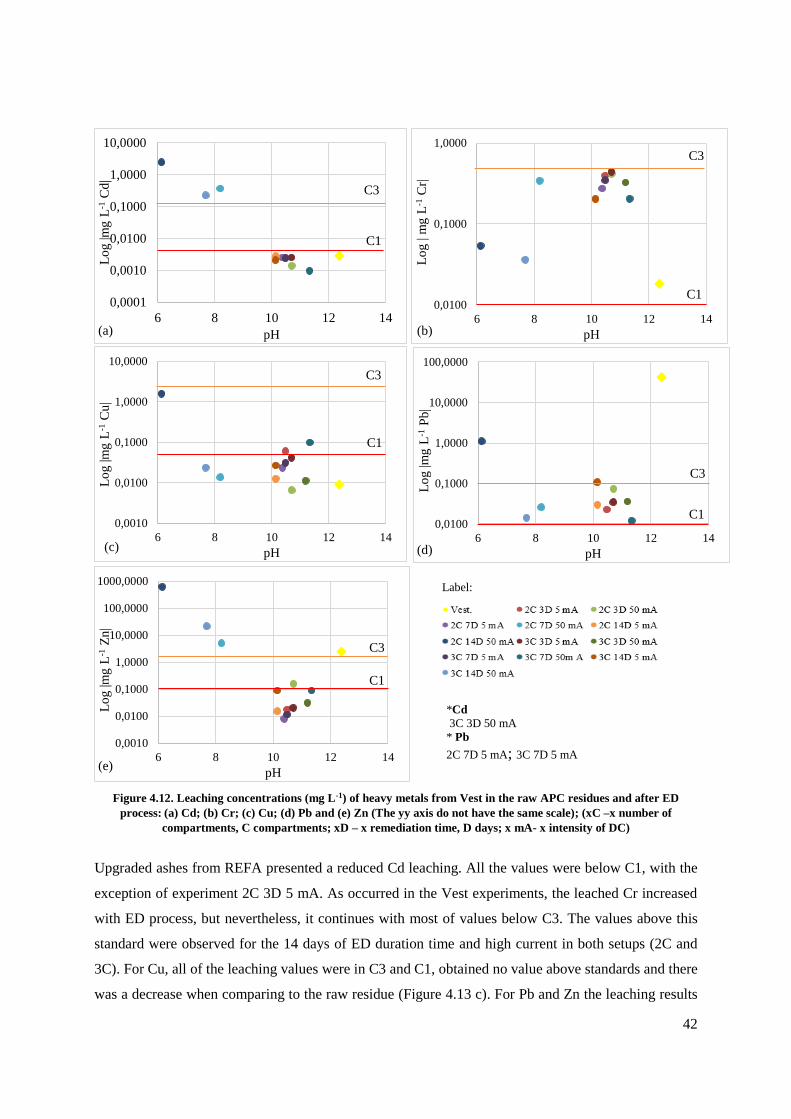
42
Figure 4.12. Leaching concentrations (mg L-1) of heavy metals from Vest in the raw APC residues and after ED
process: (a) Cd; (b) Cr; (c) Cu; (d) Pb and (e) Zn (The yy axis do not have the same scale); (xC –x number of
compartments, C compartments; xD – x remediation time, D days; x mA- x intensity of DC)
Upgraded ashes from REFA presented a reduced Cd leaching. All the values were below C1, with the
exception of experiment 2C 3D 5 mA. As occurred in the Vest experiments, the leached Cr increased
with ED process, but nevertheless, it continues with most of values below C3. The values above this
standard were observed for the 14 days of ED duration time and high current in both setups (2C and
3C). For Cu, all of the leaching values were in C3 and C1, obtained no value above standards and there
was a decrease when comparing to the raw residue (Figure 4.13 c). For Pb and Zn the leaching results
C1
C3
C1
C3
Label:
*Cd 3C 3D 50 mA * Pb 2C 7D 5 mA; 3C 7D 5 mA
0,0001
0,0010
0,0100
0,1000
1,0000
10,0000
6 8 10 12 14
Lo
g |m
g L
-1C
d|
pH
C3
C1
(a)
0,0100
0,1000
1,0000
6 8 10 12 14
Lo
g |
mg L
-1C
r|
pH
C3
C1
(b)
0,0010
0,0100
0,1000
1,0000
10,0000
6 8 10 12 14
Lo
g |m
g L
-1C
u|
pH
C1
C3
(c)
0,0100
0,1000
1,0000
10,0000
100,0000
6 8 10 12 14
Lo
g |m
g L
-1P
b|
pH
C1
C3
(d)
0,0010
0,0100
0,1000
1,0000
10,0000
100,0000
1000,0000
6 8 10 12 14
Lo
g |m
g L
-1Z
n|
pH
C3
C1
(e)
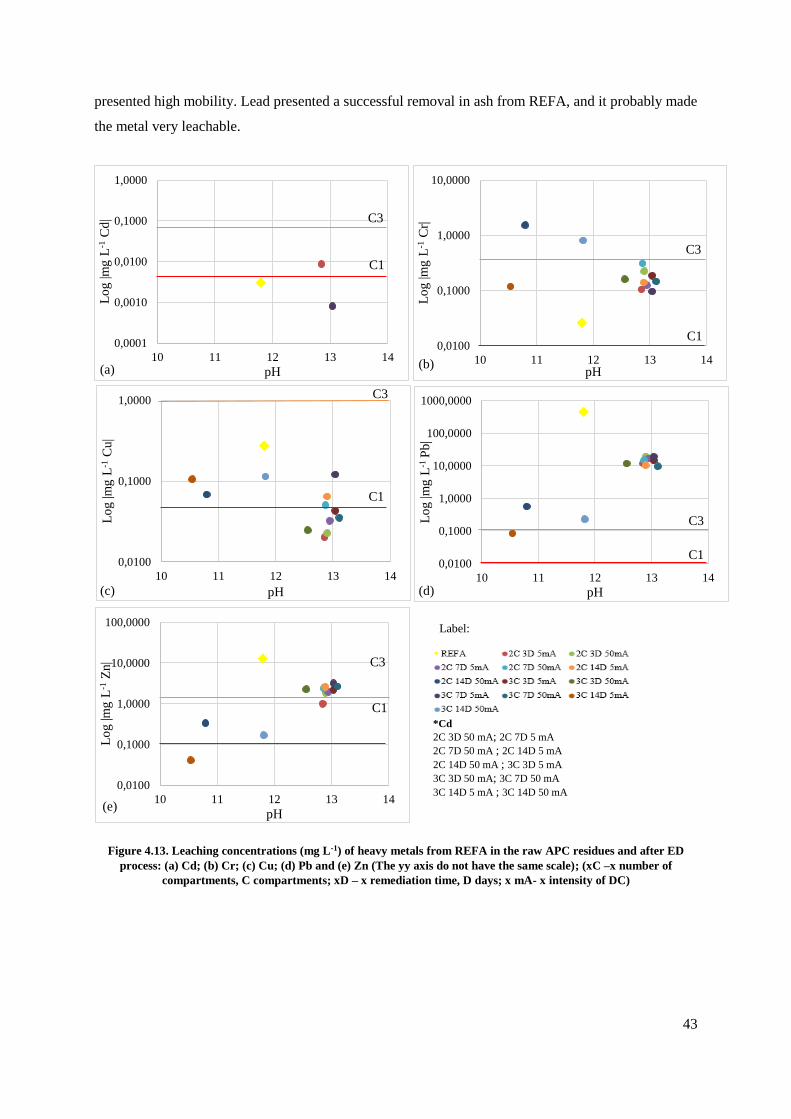
43
presented high mobility. Lead presented a successful removal in ash from REFA, and it probably made
the metal very leachable.
Figure 4.13. Leaching concentrations (mg L-1) of heavy metals from REFA in the raw APC residues and after ED
process: (a) Cd; (b) Cr; (c) Cu; (d) Pb and (e) Zn (The yy axis do not have the same scale); (xC –x number of
compartments, C compartments; xD – x remediation time, D days; x mA- x intensity of DC)
Label:
*Cd
2C 3D 50 mA; 2C 7D 5 mA
2C 7D 50 mA ; 2C 14D 5 mA
2C 14D 50 mA ; 3C 3D 5 mA
3C 3D 50 mA; 3C 7D 50 mA
3C 14D 5 mA ; 3C 14D 50 mA
0,0100
0,1000
1,0000
10,0000
100,0000
1000,0000
10 11 12 13 14
Lo
g |m
g L
-1 P
b|
pH
C3
C1
(d)
0,0100
0,1000
1,0000
10,0000
10 11 12 13 14
Lo
g |m
g L
-1C
r|
pH
C3
C1
(b)
0,0001
0,0010
0,0100
0,1000
1,0000
10 11 12 13 14
Lo
g |m
g L
-1C
d|
pH
C3
C1
(a)
0,0100
0,1000
1,0000
10,0000
100,0000
10 11 12 13 14
Lo
g |m
g L
-1Z
n|
pH
C3
C1
(e)
0,0100
0,1000
1,0000
10 11 12 13 14
Lo
g |m
g L
-1C
u|
pH
C3
C1
(c)

44
4.1.1 Removal of salts (Cl- and SO42-)
In raw residues REFA presented more chloride than Vest ash. Figure 4.14 shows that with the ED
process for Vest ash the Cl- tend to lower to values below C1, and in all experiments below C3, which
opens a great perspective for future reuse. In the case of REFA, the chloride quantity decreased, but still
above C1 in all of the ED experiments.
Figure 4.14. Chloride concentration (mg L-1) in the raw APC residues and after 24 ED experiments: (a) Vest and (b)
REFA; (xC –x number of compartments, C compartments; xD – x remediation time, D days; x mA- x intensity of DC)
Regarding sulphates in the raw APC residue of Vest, it presented a very high content because of the wet
process that originates it. Analysing Figure 4.15, the ED treatments, led to an increase amount of
sulphates, which became more leachable than in raw ash from REFA. This may occur because, in the
beginning, the sulphates are complexed, free or in a mineral form. After ED process the metals were
removed, the sulphate ion became in a soluble form.
Figure 4.15. Sulphate concentration (mg L-1) in the raw APC residues and after 24 ED experiments: (a) Vest and (b)
REFA; (xC –x number of compartments, C compartments; xD – x remediation time, D days; x mA- x intensity of DC)
1
10
100
1000
10000
Ves
t
2C
3D
5m
A
2C
3D
50
mA
2C
7D
5m
A
2C
7D
50
mA
2C
14D
5m
A
2C
14D
50m
A
3C
3D
5m
A
3C
3D
50
mA
3C
7D
5m
A
3C
7D
50
mA
3C
14D
5m
A
3C
14D
50m
A
Log
|m
g L
-1S
O42- |
1
10
100
1000
10000
RE
FA
2C
3D
5m
A
2C
3D
50
mA
2C
7D
5m
A
2C
7D
50
mA
2C
14D
5m
A
2C
14D
50m
A
3C
3D
5m
A
3C
3D
50
mA
3C
7D
5m
A
3C
7D
50
mA
3C
14D
5m
A
3C
14D
50m
A
Log
|m
g L
-1S
O42- |
C3 C3
C1 C1
(a) (b)
1
10
100
1000
10000
100000
RE
FA
2C
3D
5m
A
2C
3D
50
mA
2C
7D
5m
A
2C
7D
50
mA
2C
14D
5m
A
2C
14D
50m
A
3C
3D
5m
A
3C
3D
50
mA
3C
7D
5m
A
3C
7D
50
mA
3C
14D
5m
A
3C
14D
50m
A
Lo
g |m
g L
-1C
l- |1
10
100
1000
10000
100000
Ves
t
2C
3D
5m
A
2C
3D
50
mA
2C
7D
5m
A
2C
7D
50
mA
2C
14D
5m
A
2C
14D
50m
A
3C
3D
5m
A
3C
3D
50
mA
3C
7D
5m
A
3C
7D
50
mA
3C
14D
5m
A
3C
14D
50m
A
Lo
g |m
g L
-1C
l- |
C3 C3
C1 C1
(a) (b)

45
4.2 Mortar bars
4.2.1 SEM/EDS
The morphology of the raw APC residues and upgraded (7 days of duration ED treatment) APC residues
from Vest and REFA, which were used in mortar bars preparation, is presented at the SEM/EDS images
of Figure 4.16. A visual analysis of incineration residue can itself give an indication of the efficiency of
combustion, as well as any process required to give the material a final destination. Figure 4.16 shows
that the APC residues particles are mostly of a small shape, of two different type: particles of type (X)
are formed in the combustion chamber having a spherical shape, composed of aluminosilicate matrices
(glass particles), although deposited on their surface as they are entrained by the gases and particles of
type (Y) appear highly polycrystalline from the processes of condensation as the gases cool down.
According to Quina (2005) the smaller particles are composed of Si and Al, intermediate particles are
fewer in number and comprises Pb and Hg, and the larger particles contain higher amounts of Fe, Cr
and Ni. Iretskaya et al. (1999) observed that by leaching the microporosity of the particles increased,
due to the removing salts. They also noted that small particles could remain adsorbed on the surface of
the largest particles. Furthermore, Le Forestier & Libourel (1998) observed particles from different
origins (scrubbers, for instance) and found various forms such as flakes, prisms, needle shaped, sintered
pellets and spheres. Eighmy et al. (1995) found out that after leaching processes existence of spherical
particles was evident which were composed of aluminum silicates, deposited on volatile elements such
as Cl, K, Zn, Na, S and Pb. In Figure 4.16 changes are clear from the form of raw residue to residue
upgraded. The largest changes in shape occurred for experiences with 2C cell design (Figure 4.16 c, d,
e and f).
(
Figure 4.16. Images of SEM before ED treatment: (a) raw Vest and (b) raw REFA; After ED treatment (7 days of
duration time): Vest - (c) 2C 5 mA, (e) 2C 50 mA, (g) 3C 5 mA, (i) 3C 50 mA and REFA - (d) 2C 5 mA, (f) 2C 50 mA,
(h) 3C 5 mA, (j) 3C 50 mA; magnification: 1000x; (X) - glass particles, (Y) - polycrystalline particles; (xC –x number
of compartments, C compartments; xD – x remediation time, D days; x mA- x intensity of DC)
(Y)
(Y)
(a) (b)

46
~
,klfd
~
Figure 4.16. (cont. 1) Images of SEM before ED treatment, (a) raw Vest and (b) raw REFA; After ED treatment (7
days of duration time): Vest - (c) 2C 5 mA, (e) 2C 50 mA, (g) 3C 5 mA, (i) 3C 50 mA and REFA - (d) 2C 5 mA, (f) 2C
50 mA, (h) 3C 5 mA, (j) 3C 50 mA; magnification: 1000x; (X) - glass particles, (Y) - polycrystalline particles; (xC –x
number of compartments, C compartments; xD – x remediation time, D days; x mA- x intensity of DC)
(Y)
(Y)
(X)
(c) (d)
(Y)
(Y)
(X) (X)
(e) (f)
(Y)
(Y)
(g) (h)

47
Figure 4.16. (cont. 2) Images of SEM before ED treatment: (a) raw Vest and (b) raw REFA; After ED treatment (7
days of duration time): Vest - (c) 2C 5 mA, (e) 2C 50 mA, (g) 3C 5 mA, (i) 3C 50 mA and REFA - (d) 2C 5 mA, (f) 2C
50 mA, (h) 3C 5 mA, (j) 3C 50 mA; magnification: 1000x; (X) - glass particles, (Y) - polycrystalline particles; (xC –x
number of compartments, C compartments; xD – x remediation time, D days; x mA- x intensity of DC)
4.2.2 Porosity and density and compressive tests
Table 4.3 presents the porosity and density values obtained for the tests on mortar bars after 28 days of
curing time. According to Gottfredsen & Nielsen (2008) the reference values given for the cement is
20%. Comparing with 20%, porosity decreases with the addition of ashes. Comparing with reference
mortar, with 0% of APC residues the porosity increase. According to tests done by Frutuoso (2013)
porosity is directly related to the amount of water. Thus, having an increased amount of water will
increase the porosity. The increase in porosity may be explained due to the heterogeneity of the waste
in relation to the cement particles. The porosity will increase when the particle size of ash is higher than
the dimensions of the voids created by the bars particles, thus not fulfilling the existing voids and
increasing porosity. Table 4.3 shows that the experiments more similar to the reference were the
experiences with 2C to Vest and one 3C 50 mA for REFA.
Table 4.3. Porosity and density of specimens: reference; substitution 5% of raw and upgraded APC residues from
Vest and REFA as cement; (xC –x number of compartments, C compartments; xD – x remediation time, D days; x
mA- x intensity of DC)
Specimens
Reference Raw
Vest
Vest
2C
5mA
Vest
2C
50mA
Vest
3C
5mA
Vest
3C
50mA
Raw
REFA
REFA
2C
5mA
REFA
2C
50mA
REFA
3C
5mA
REFA
3C
50mA
Porosity
(20%) 16 18 17 17 18 18 18 18 18 18 17
ρd
(2100 kg m-3) 2146 2085 2113 2118 2119 2109 2115 2133 2110 2102 2129
ρf
(2650 kg m-3) 2558 2544 2541 2579 2547 2557 2553 2592 2571 2574 2587
(Y)
(Y)
(i) (j)

48
Compressive streght is relevant to define the mortar (Figure 4.17), determining its strength capacity. In
literature, compressive streght measured after 28 days shows resistance: ≥ 32.5, 42.5 or 52.5 MPa
(Quina, 2005). According to Frutuoso (2013) the higher value, less deformable the mortar will be. The
compressive strength is related to the porosity of the material, which increases with the decreasing of
the latter. The compressive strength generally increases with longer curing times. The ED experiments
Vest APC residue with 50 mA and 2C has a higher mechanical strength than the reference, regarding
that the reference shows a lower porosity value. This may be related to the origin and form of the
aggregate, since this type of aggregate has a great heterogeneity in its composition and particles size.
The same happens with the raw REFA APC residue, which can be explained due to the coarser
aggregates that contributes to an increased mechanical strength of mortars. According to Figure 4.17 the
two higher compression values, are found in Vest APC residue with 2C and 50 mA, and the raw REFA.
According to Cenni et al. (2001) high Cl- content accelerates hardening, at the same time that free Cl-
induces in steel corrosion. That was probably what happened, mainly for REFA, because at the
beginning this APC residue presented a very high Cl- content. In MSWI APC residue is regarded,
sulphate content an important factor to lower compressive strengths when added in mortars due to crack
formation (Lima et al., 2012). On experiments with ash from REFA, it was possible that this happened
because after ED treatment the amount of sulphates significantly increased.
Figure 4.17. Compressive strength of specimens after 28 days curing for mortar samples: reference; substitution 5%
of raw and upgraded APC residues from Vest and REFA as cement (mean values ± standard error); (xC –x number
of compartments, C compartments; xD – x remediation time, D days; x mA- x intensity of DC)
10
20
30
40
50
60
Co
mp
ress
ive
stre
ng
th (
MP
a)
Reference Raw
Vest Vest 2C
5mA
Vest 2C
50mA
Vest 3C
5mA
Vest
3C
50mA
Raw
REFA REFA
2C
50mA
REFA
2C
5mA
REFA
3C
5mA
REFA 3C
50mA

49
4.2.3 Leaching behaviour
Concrete’s high pH is believed to immobilize heavy metals. However, due to FA high specific surface,
some of the heavy metals are placed there and prone to leach (Pedersen, 2002b). According to Wiles
(1996) heavy metals such as Pb, Cu and Cd are susceptible of leaching from MSW fly ashes. There is
no legal regulation limiting the leachability of heavy metals from regular concrete in Denmark. Then,
like Lima et al. (2012) proposed, in this study it will be used the European Environment Agency (EEA)
criteria for landfill deposition of waste and leachability values of the mortars after prEN 12457-1. This
gives an overview of the increase on metal leachability from the blended mortar. Table 4.4 presents the
values of leached heavy metals for the reference, raw APC residues and the upgraded APC residues.
Not only for the reference value as for other specimens, leached Cd was zero, which is quite different
from literature values (0.07 mg L-1) Lima et al. (2012). According to Shih et al. (2005), Cr and Cu are
almost totally trapped/incorporated into clinker, not presenting a threat to leach. However, heavy metals
speciation may play an important role on their leachability. The reference values are in some cases
higher than those of both raw residues. Vestforbrænding appears to be particularly successful in upgrade
of its APC residue, and the new setup (2C) combined with low current, show the best results (Table 4.4).
Yu et al. (2005) found that leaching of heavy metals depends on the type of solidified ash, but does not
depend on the initial concentrations. Table 4.4 shows that in the case of adding 5% of ash from Vest, Cr
did not increase leaching, in experiments 2C with 5 and 50 mA and residue without ED treatment. Yu
et al. (2005), also concluded that Cr(VI) soluble species are effectively immobilized by the cement base
material and can be found adsorbed or precipitated with silicates or calcium compounds, as
Ca2CrO5.3H2O or in C-S-H gel, where SiO44- is substituted by CrO4
2-.
It should be stressed that in this study, only a small percentage of APC residue was included in the
mortars and consequently low concentrations of heavy metals were measured in the leachates. So, there
is an immobilization of contaminants, and these results are very promising. Although there are some
cases in which there is an increased leaching of metals after EDR, only one value exceeded the
established EEA standard landfill criteria for metals leachability. For upgraded residue from REFA, the
amounts of leached metals increases, with some exceptions. May be for REFA ash, the incorporation
of raw residue to be the most appropriate choice, the amounts of leached some heavy metals increases
in relation to residue without ED treatment.

50
Table 4.4. EEA landfill criteria for heavy metals leachability; Experimental data obtained by prEN 12457-1 on
mortar: reference; substitution 5% of raw APC residues and upgraded APC residues from Vest and REFA as
cement; (xC –x number of compartments, C compartments; xD – x remediation time, D days; x mA- x intensity of
DC)
Specimens with 5% of APC residues
EEA landfill criteria
(mg L-1)
Vest REFA
7 days of ED treatment 7 days of ED treatment
Class 1
Reference
Raw
2C
5mA
2C
50mA
3C
5mA
3C
50mA
Raw
2C
5mA
2C
50mA
3C
5mA
3C
50mA
Cd ≤ 0.1 0 0 0 0 0 0 0 0 0 0 0
Cr ≤ 0.5 0.04 0.03 0.03 0.03 0.09 0.07 0.05 0.09 0.08 0.07 0.06
Cu ≤ 2 0.01 0.01 0.01 0.01 0.01 0.01 0.00 0.01 0.01 0.02 0.01
Pb ≤ 0.5 0.08 0.05 0.04 0.05 0.15 0.02 0.03 0.01 0.04 0.02 0.07
Zn ≤ 4 0.03 0.02 0.01 0.01 0.06 0.02 0.05 0.07 0.10 0.09 0.05
pH
5.5 - 12
12.4
12.4
12.4
11.6
12.4
11.1
12.4
12.4
12.3
12.4
12.7
4.2.4 Chloride
The chloride ion promotes the oxidation of iron in the form of rust, causing not only a reduction of the
section of the armature, but also an expansion due to iron oxide formation, which ultimately result in
the disintegration of concrete, accelerating the corrosion process (Frutuoso, 2013). Corrosion process
happened because soluble salts present a weak interaction with cement matrices. The biggest difficulty
of S/S process is related with high amount of soluble salts content. Decreasing this amount may pass to
washing the APC residue before incorporation in cement (Quina, 2005). Table 4.5, showed the results
of chloride contents in the reference and in the specimens previously described.
Table 4.5. EN 206-1 European standard for concrete; Amount of chloride in mortar: reference; substitution 5% of
raw APC residues and upgraded APC residues from Vest and REFA as cement; (xC –x number of compartments, C
compartments; xD – x remediation time, D days; x mA- x intensity of DC)
Amount of Cl- in specimens
Reference Raw
Vest
Vest
2C
5mA
Vest
2C
50mA
Vest
3C
5mA
Vest
3C
50mA
Raw
REFA
REFA
2C
5mA
REFA
2C
50mA
REFA
3C
5mA
REFA
3C
50mA
mg kg -1 1.9 4.2 2.3 2.2 2.1 2.4 6.5 7.1 2.9 2.5 2.1
EN 206-1
(0.2%) 0.2 % 0.4 % 0.2 % 0.2 % 0.2 % 0.2 % 0.7 % 0.7 % 0.3 % 0.3 % 0.2 %

51
The results are in conformity to EN-206-1, European Standard for Concrete – Specification,
performance, production and conformity, section 6.2.7 expressing the percentage of chloride ions by
mass of cement. The amount of chloride increases after the including of 5% ash in cement, but the values
for upgraded Vest ash showed a similarity with reference. For upgraded ash from REFA the values were
higher, with an exception in 3C 50 mA experiment (Table 4.5). Valorsul a Portuguese incinerator
presents a semi-dry treatment for cleaning flue gas, like REFA, so some of conclusions can be applied
to this plant, with some concerns, since the characteristics of the APC residues are influenced by several
factors, including the country where they are from.

52

53
5. Conclusions
This study aimed to understand if the ED process is an appropriate pre-treatment for further reuse of
APC residues in mortar bars. This subject is a challenging one, because this type of waste usually
presents of high amounts of heavy metals and salts. Thus, two APC residues were studied: one resulting
from the treatment of a wet cleaning fuel gas from the incinerator plant Vest; and another from a semi-
dry gas cleaning from incinerator plant REFA, both in Denmark. In Portugal, Valorsul incinerator which
serves Lisboa, presents a semi-dry treatment for flue gas, so some of conclusions of this study can be
extended to this plant. As mentioned, the ash characteristics, are influenced by several factors related to
each plant, such as the composition of the waste that is burned. Therefore, further studies should be
made in order to reach more conclusions
With the fundamental aim of analysing the environmental impact regarding a second use of the APC
residues, a battery of 24 ED experiments with Vest and REFA APC residues was carried out and a series
of variables (current, duration of treatment, and cell compartments) were defined. The successful
removal of heavy metals and reduction of their leaching behaviour from these residues is important for
their further possible application, e.g. in building materials. Reducing the amount of heavy metals and
noticing their mobility, may lead to a safer use, as understanding their behaviour when mixed with
cement can lead to a reduced impact in the environment and consequently to humans.
A statistical method (t-test) was used to analyse the initial characteristics of two APC residues, reaching
the conclusions that these ashes were statistically significant different for 99% or 95% of confidence
levels, in almost all parameters. Flue gas cleaning treatments do influence the ashes characteristics and
their behaviour when submitted to ED treatment. Therefore, this is a main conclusion and each waste
must be individually treated its characteristics, being each case a different one.
In ED process, pH seems to be the most important factor in the heavy metals removal rates success.
Other factors such as treatment duration and electric current intensity also influence the mobility of
metals in the ash. For the longest tested duration (14 days) the ED treatment showed highest removal
rates for these types of ash. The chlorides and sulphates also influence, once heavy metals tend to
complex with these species. The number of ED cell compartments present have different results, 2C was
efficient in the ash from Vest, and unlike the ash from REFA 3C shows a higher metal removal rate.
Cadmium, Zn and Pb presented the highest remediation rates, even if at the end if the ED treatment,
their values where above C3. Thus, the ED process may not be the solution for a successful remediation
of APC residues, when the criterion is only based on the total concentrations. However, for a second use
of the material, is leaching one of the criteria that has more relevance and the ED treatment was
successful in many cases.

54
Thus, for Vest APC residue, leaching was promising since. The application of low DC presented values
below C1 and gets two values of zero for Cd and Pb. 10% of the ED experiments showed an increase
on heavy metals leaching, 43% of at C1 values and 47 % at C3 values, according to BEK 1662 standards.
However, for REFA APC residue leaching presented remaining heavy metals levels above C3, with the
exception of Cd that obtained values of zero in almost all ED experiments. It even occurred that leaching
was increased after some ED treatment. Conformity assessment allowed to identify the most problematic
species from the residue: Pb, Zn and Cl-.
Finally, a specific reuse was studied for the two APC residues: mortar manufacture. The suitability for
this reuse was defined by four parameters: porosity and density, compressive strength, heavy metals
leachability and chloride content. It was concluded that the material obtained from S/S treatments
incorporating 5% of APC residue from Vest met the requirements for the studied heavy metals. The use
of upgraded waste as building materials while protecting the environment regarding compounds released
by leaching was than a success.
Leaching tests proved that adding 5% of APC residues to cement based material affects the leachability
of heavy metals, and sometimes in a positive way. Experiments with the raw residue and residue
upgraded with 2C ED cell presented the best results. Regarding REFA APC residue, the use of ED as a
pre-treatment did not seem appropriate, since the amounts of leached heavy metals increases in relation
to residue without pre-treatment. In both cases Cd removal soluble fraction presented an efficiency of
100%. The compressive strength showed that in some cases the strength is increased with the addition
of APC residue.
Furthermore, adding this type of APC residue might present a threat for steel corrosion in reinforced
concrete structures due to the highly soluble Cl- content. The soluble salts have a weak interaction with
cement matrices. In the case of Vest ash in most of performed tests Cl- remained compared to the
reference, but the same did not happen with REFA ash.
The problem of Cl- in REFA ash, can only be overcome if its content is reduced. Yet insulation measures
for the building material will always be required. In fact, one of the biggest difficulties in treating this
residue relates to its high content of soluble salts, which does limits its application of further products.
Decreasing the amount of Cl- may pass by a washing process before the incorporation of this APC
residues in cement.
The stabilization of APC residue is difficult, once its characteristics may float according to the waste
that is burned as well as burning conditions. A consequence, it is hard to work out a standard for MWSI
APC residue for concrete. Vest ash appears to be an appropriate choice for this with a pre-treatment with
ED process. For REFA ash, further treatment adjustments are required and more studies is envisaged
for reuse must be carried out before this.

55
Our society is based on consumption. Although some authors already talk about de-growth, there is still
a great deal of waste to be handled. In this context, it is relevant to study methods for its reduction and
recovery aiming preservation and ecosystems protection. This study aimed to contribute for the
treatment and reuse of APC residues.

56

57
6. Future developments
At the end of this study, some issues were unsolved, and so proposals arise for further developments in
respect to the ED treatment and the S/S process for APC residues upgraded residues. Some suggestions
are following given to complement the investigation:
Electrodialytic Remediation Process
Chemical speciation of heavy metals in the system would contribute to understand their
behaviour;
Perform a washing process before ED process, in order to reduce the problem of soluble salts,
identified as the most problematic aspect in replacing ash on mortar bars;
Use an acidifying agent as it would possibly increase acidification process, and thus increase
the removal efficiencies for heavy metals and salts from APC residues;
Change the L/S ratios- especially for REFA ash: the space of the cell seemed to be insufficient
for stirring the solution in the central cell compartment. Increasing the L/S ratio would help to
increase metals mobility. Another alternative would be to do an experiment with ED cells on a
larger scale which being tested now at Technical University of Denmark.
S/S treatment
Extend the investigation for incorporation of the washed residue, possibly to the REFA APC
residue, as the washing may remove the high amount of chlorides. Thus, a viable further reuse
as aggregate in building materials could be tested;
Analyse the potential increase of sulphates in the aggregates due to the incorporation of
upgraded APC residues and the eventual increase in gaseous emissions regarding SOx;
Further study the effect of aging processes, evolution heat and effect on the elasticity of the
material, after replacement of cement with varying percentages of upgraded ash.
General developments
Evaluate not only heavy metals, but also organic micropollutants in APC residues. The issue of
dioxins and furans as well as PCBs and PAHs;
Consider the recovery of studied pollutants (heavy metals), particular by focus in which are
present in higher amounts (Pb and Zn), conduct studies aiming at heat treatment of APC residues
(vitrification, sintering or fission, for instance);
Using statistical studies and mathematical models for the optimization of methods. Actually,
with the high numbers of experimental results that were performed in this study, it is justified
to use a deeper level of statistical and mathematical modelling.

58

59
7. References
Abbas, Z., Steenari, B-M. (2001). A study of Cr(VI) in ashes from fluidized bed combustion of
municipal solid waste: leaching, secondary reactions and the applicability of some speciation methods.
Waste Management 21: 725-739.
Acar, Y.B., Alshawabkeh, A.N. (1993). Principles of electrokinetic remediation. Environmental
Science and Technology 27: 13.
Astrup, T. (2008). Management of APC residues from W-t-E plants. Report. Technical University of
Denmark, Lyngby, Denmark.
BEK 1662. (2010). Bekendtgørelse om anvendelse af restprodukter og jord til bygge- og anlægsarbejder
og om anvendelse af sorteret, uforurenet bygge- og anlægsaffald. Danish Ministry of the Environment
and Energy (in Danish).
Cai, Z., Chen, D., Lundtorp, K., Christensen, T.H. (2003). Evidence of Al-Cr interactions affecting Cr
-leaching from waste incineration ashes. Waste Management 23(1): 89-95.
Cenni, R., Janisch, B., Spliethoff, H., Hein, K.R.G. (2001). Legislative and environmental issues on the
use of ash from coal and municipal sewage sludge co-firing as construction material. Waste Manage 21:
17 -31.
Chandler, A.J., Eighmy, T.I., Hartlen, J., Hjelmar, O., Kosson, D.S., Sawell, S.E., van der Sloot, H.A.,
Vehlow, J. (1997). Municipal solid waste incineration residues. Elsevier. Studies in Environmental
Science 67, Amsterdam.
Christensen, I. V. (2004). Electrodialytic remediation of CCA-treated waste wood. Ph.D. Thesis.
Technical University of Denmark, Lyngby, Denmark.
Christensen, I. V., Pedersen, A.J., Ottosen, L.M.., Ribeiro, A.B. (2006). Electrodialytic remediation of
CCA-treated waste wood in a 2 m3 pilot plant. Science of the Total Environment 364: 45-54.
Comité Européen de Normalisation, CEN BS EN 12457-1. (2002). Characterisation of waste leaching -
compliance test for granular waste materials and sludges. Brussels.
Comité Européen de Normalisation, CEN BS EN 14899. (2004). Characterization of waste. Brussels.
Danish Standard 259 (2004). Vandundersøgelse - Bestemmelse af metaller i vand, jord, slam og
sedimenter - Almene principper og retningslinjer for bestemmelse ved atomabsorptionsspektrofotometri
i flame. Danish Ministry of the Environment and Energy (in Danish).
Directive 2000/76/EC of The European Parliament and the Council of 4 December 2000, on the
incineration of waste.
Directive 2008/98/EC of The European Parliament and the Council of 19 November 2008 on waste and
repealing certain Directives.
EEA – European Environmental Protection. (2005). Guidance on sampling and testing of wastes to meet
landfill waste acceptance procedures.
Eighmy, T.T., Eusden, J., Krzanowski, J., Domingo, D., Stampfli, D., Martin, J., Erickson, P. (1995).
Comprehensive Approach toward Understanding Element Speciation and Leaching Behavior in
Municipal Solid Waste incineration Electrostatic Precipitator Ash. Environmental Science Technology
29(3): 629-646
European standard 206-1. (2000). Concrete - Part 1: Specification, performance, production and
conformity Specification, performance, production and conformity. Brussels.

60
European standard 196-1. (2005). Methods of testing cement — Part 1: Determination of strength.
Brussels.
European standard 196-7. (2005). Methods of testing cement — Part 7: Methods of taking and preparing
samples of cement. Brussels.
Eurostat (2012). Environmental statistics and accounts in Europe, Eurostat Statistical books, European
Commission. Accessed in March 2014.
<http://epp.eurostat.ec.europa.eu/portal/page/portal/eurostat/home/>
Evans. L.J. (1989). Chemistry of metals retention by soils. . Environmental Science Technology 23(9):
1046-1056.
Fernandez, M.A., Martinez, L., Segarra, M., Garcia, J.C., Espiell, F. (1992). Behaviour of heavy metals
in the combustion gases of urban waste incinerators. Environmental Science Technology 26(5): 1040-
1047.
Ferreira, C., Ribeiro, A.B., Ottosen, L.M. (2003a). Possible applications of municipal solid waste fly
ash. Journal of Hazardous Materials 96(2-3): 201-215.
Ferreira, C., Ribeiro, A. B., Otossen, L.M. (2003b). Heavy metals in MSW incineration fly ashes.
Journal Physique IV France 107: 463-467
Ferreira, C., Jensen, P.E., Ottosen, L.M., Ribeiro, A. B. (2004). Removal of selected heavy metals from
MSW fly ash by electrodialytic process. Engineering Geology 77(3-4): 339-347.
Ferreira. C. (2005). Removal of heavy metals from municipal solid waste incinerator fly ash by an
Electrodialytic process. Ph.D. Thesis. Technical University of Denmark, Lyngby, Denmark.
Ferreira, C., Jesen, P., Otosen, L., Ribeiro, A. (2008). Preliminary treatment of MSW fly ash as a way
of improving electrodialytic remediation. Journal of Environmental Science and Health 43(8): 837-43.
Frutuoso, A. R. S. (2013). Influência de agregados provenientes de RCD e cinzas volantes não
conformes em argamassas de cal aérea. Master Thesis. Faculdade de Ciências e Tecnologia da
Universidade Nova de Lisboa, Portugal.
Gardner, K. (2005). Electrochemical remediation and stabilization of contaminated sediments. Final
report submitted to NOAA/UNH Cooperative Institute for Coastal and Estuarine. Environmental
Technology (CICEET). Civil Engineering Department, University of New Hampshire, Durham.
Giordano, P., Behel, A., Lawrence, J., Solleau, J., Bradford, B. (1983). Mobility in soil and plant
availability of metals derived from incinerated municipal refuse. Environmental Science Technology
17(4): 193-198.
Gottfredsen, F. R., Nielsen, A. (2008). Bygningsmaterialer - Grundlæggende egenskaber. 5th edition,
Polyteknisk Forlag.
Hansen, H.K. (1995). Practical and theoretical aspects concerning the use of ion exchange membranes
and resins in electrokinetic soil remediation. Ph.D. Thesis. Technical University of Denmark, Denmark.
Hansen, H.K., Ottosen, L.M., Kliem, B.K., Villumawn, A. (1997). Electrokinetic remediation of soils
polluted with Cu, Cr, Hg, Pb and Zn. Journal of Chemical Technology and Biotechonology 70: 67-73.
Hansen, H.K., Rojo, A., Ottosen, L.M. (2005). Electrodialytic remediation of copper mine tailings.
Journal oh Hazardous Materials 117: 179-183.
IAWG (1997). Municipal solid waste incinerator residues. The international ash working group.
Elsevier. Studies in environmental Science 67, Netherlands.

61
Iretskaya, S., Nzihou, A., Zahraoui, C., Sharrock, P. (1999). Metal leaching from MSW fly ash before
and after chemical and thermal treatments. Enviromental. Progress 18(2): 144-148.
Jensen, P.E. (2005). Application of microbial products to promote electrodialytic remediation of heavy
metal contaminated soil. Ph.D Thesis. Technical University of Denmark, Denmark.
Jensen, P.E., Ottosen, L.M., Ferreira, C. (2007). Electrialytic remediation of soil fines (<63 µm) in
suspension – Influence of current strength and L/S. Electrochimica Acta 52: 3412-3419.
Jensen, P. E. (2014). Personal communication, by e-mail dated 6 March 2014.
Kelsh, D.J. (1996). Electrokinetic soil remediation. Science Applications International Corporation
(SAIC), Gaithersburg, Maryland.
Kirkelund, G. M., Geiker, M. R., Jensen, P. E. (2010). Feasibility test of electrodialytically upgraded
MSWI APC residue utilization in mortar. Paper presented at the 3rd International Conference on
Engineering for Waste and Biomass Valorisation, 17-19 May, Beijing, China.
Kirkelund, G. M., Jensen, P. E., Ottosen, L. M. (2013). Electrodialytic extraction of heavy metals from
Greenlandic MSWI fly ash as a function of remediation time and L/S ratio. ISCORD: 87-96
Kot, A., Namiesnik, J. (2000). The role of speciation in analytical chemistry. TrAC Trends in Analytical
Chemistry 19(2-3): 69-79.
Lageman, R., Pool, W., Seffinga, G.A. (1989). Electro-reclamation: theory and practice. Chemistry and
Industry 18: 585-590.
Le Forestier, L., Libourel, G. (1988). Characterization of flue gas residues from municipal solid waste
combustors. Environmental Sciences Technology 32(15): 2250-2256.
Lima. A.T. (2008). Fly ashes contaminants removal-The electrodialytic process potentialities. Ph.D.
Thesis. Faculdade de Ciências e Tecnologia da Universidade Nova de Lisboa, Portugal.
Lima, A.T., Ottosen, L.M., Pedersen, A.J., Ribeiro, A.B. (2008a). A characterization of fly ash from bio
and municipal waste. Biomass and Bioenergy 32(8): 277-282.
Lima, A.T., Ottosen, L.M., Ribeiro, A.B., Jensen, P.E. (2008b). A study on the effect of electric current
of Cd and Pb removal from MSW fly ash through a membrane. Submitted in Journal of Chemical
Technology and Biotechnology. Ph.D. Thesis. Faculdade de Ciências e Tecnologia da Universidade
Nova de Lisboa.
Lima, A. T., Ribeiro, A. B., Rodríguez-Maroto, J. M., Mateus, E. P., Castro, A. M., Ottosen, L. M.
(2010a). Experimental and modeling of the electrodialytic and dialytic treatment of a fly ash containing
Cd, Cu and Pb. Journal of Applied Electrochemistry 40(9): 1689–1697.
Lima, A.T., Rodrigues, P.C., Mexia, J.T. (2010b). Heavy metal migration during electroremediation of
fly ash from different wastes – Modelling. Journal of Hazardous Materials 175: 366–37.
Lima, A.T., Ottosen, L.M., Ribeiro, A.B. (2012). Assessing fly ash treatment: Remediation and
stabilization of heavy metals. Journal of Environmental Management 95: 110-115.
Marani, D., Braguglia, C. M., Mininni G., Maccioni, F. (2003). Behaviour of Cd, Cr, Mn, Ni, Pb and
Zn in sewage sludge incineration by fluidised bed furnace. Waste Management 23(2): 117-124.
Ministério do Ambiente, Ordenamento do Território e do Desenvolvimento Regional. (2007). Plano
Estratégico para os Resíduos Sólidos Urbanos (2007-2016). Depósito legal nº255-244/07. ISBN: 978-
989.

62
Ministério do Ambiente, Ordenamento do Território e Energia. (2014). Plano Estratégico para os
Resíduos Urbanos – PERSU 2020, Proposta de plano. Versão de trabalho prévia à consulta pública e à
Avaliação Ambiental Estratégica
Nystroem, G.M., Ottosen, L.M., Villumsen, A. (2005). Electrodialytic removal of Cu, Zn, Pb and Cd
from harbour sediment – The influence of changing experimental conditions. Environmental Science
and Technology 39: 2906-2922.
Nystrøm, G. M. (2001). Investigations of soil solution during enhanced electrodialytic soil remediation.
Master Thesis. Technical University of Denmark, Denmark.
Ottosen, L.M., Hansen, H.K. (1992). Electrokinetic cleaning of heavy metals polluted soil. Internal
report. Fysisk-Kemisk Institut for Geologi og Geoteknik. Technical University of Denmark, Denmark.
Ottosen, L.M. (1995). Electrokinetic remediation – Application to soil polluted from wood preservation.
Ph.D. Thesis. Technical University of Denmark, Denmark.
Ottosen, L.M., Hansen, H.K., Laursen, S., Villumsen, A. (1997). Electrodialytic remediation of soil
polluted with copper from wood preservation industry. Environmental Science and Technology 31:
1711-1715.
Ottosen, L.M., Lima, A.T., Pedersen, A.J., Ribeiro, A.B. (2006). Electrodialytic extraction of Cu, Pb
and Cl from MSWI fly ash suspended in water. Journal of Chemical Technology and Biotechnology 81:
553-559.
Ottosen, L.M., Pedersen, A.J., Hansen, H.K., Ribeiro, A.B. (2007). Screening the possibility for
removing cadmium and other heavy metals from wastewater sludge and bio-ashes by an electrodialytic
method. Electrochimica Acta 52: 3420-3426.
Ottosen, L.M., Jensen, P.E., Kirkelund, G.M., Ebbers, B. (2014). Electrodialytic recovery and
purification of phosphorous from sewage sludge ash, sewage sludge and wastewater. Filed in 2013,
Denmark.
Pedersen, A.J., Ottosen, L. M., Villumsen, A. (2001). Electrodialytic removal of heavy metals from
municipal solid waste incineration fly ash. Journal of Hazardous Materials 100: 65-78.
Pedersen, A.J., (2002a). Electrodialytic removal of heavy metals from fly ashes. Ph.D. Thesis. Technical
University of Denmark, Denmark.
Pedersen. A.J. (2002b). Evaluation of assisting agents for electrodialyttic removal of Cd, Pb, Zn, Cu and
Cd from MSWI fly ash. Journal of Hazardous Materials 95: 185-198.
Pedersen, A.J., Ottosen, L.M., Villumsen, A. (2005). Electrodialytic removal of heavy metals from
municipal solid waste incineration fly ash using ammonium citrate as assisting agent. Journal of
Hazardous Materials 122: 103-109.
PubChem Compound. Accessed in March 2014.
<https://www.ncbi.nlm.nih.gov/pccompound/?term=Iron>
Quina, M. M. J. (2005). Processos de inertização e valorização de cinzas volantes - Incineração de
resíduos sólidos urbanos. Ph.D. Thesis. Faculdade de Ciências e Tecnologia Universidade de Coimbra,
Portugal.
Quina, M.J., Bordado, J.C., Quinta-Ferreira, R.M. (2007). Treatment and use of air pollution control
residues from MSW incineration: An overview. Waste Management 10: 10-16.
Quina, M.J., Bordado, J.C., Quinta-Ferreira, R.M. (2011). Air pollution control in municipal solid waste
incinerators - The impact of air pollution on health, economy. Environment and Agricultural Sources.
Dr. Mohamed Khallaf (Ed.). ISBN: 978-953-307-528-0, InTech.

63
Reuss, F.F. (1809). Sur un nouvel effet de l’electricité. Nouveaux Mémoires de la Société Impériale des.
Naturalistes de Moscou 2: 327-337.
Ribeiro, A.B. (1992). Contribuição para o estudo da contaminação de solos por metais pesados – caso
do cobre num regossolo psamítico. Master Thesis. Faculdade de Ciências e Tecnologia da Universidade
Nova de Lisboa. Portugal.
Ribeiro, A. B., Mexia, J.T., (1997). A dynamic model for the electrokinetic removal of copper from
polluted soil. Journal of Hazardous Materials 56: 257-271.
Ribeiro, A.B. (1998). Use of electrodialytic remediation technique for removal of selected heavy metals
and metalloids from soils. Ph.D Thesis. Technical University of Denmark, Denmark.
Ribeiro, A. B., Réffega, A. J. M., Villumsen, A., Bech-Nielsen, G. (1999). O processo electrodialítico
na remediação de solos contaminados por metais pesados. Paper presented at the 6th National Conference
on Environmental Quality performed, Lisbon, 20-22 Oct.
Ribeiro, A. B., Mateus, E. P., Ottosen, L. M., Bech-Nielsen, G. (2000). Electrodialytic removal of Cu.
Cr and As from chromated copper arsenate-treated timber waste. Environmental Science and
Technology 34(5): 784-788.
Ribeiro, A. B., Rodríguez-Maroto, J. M., Mateus, E. P., Gomes, H. (2005). Removal of organic
contaminants from soils by an electrokinetic process: the case of atrazine. Experimental and modelling
Chemosphere 59(9): 1229-1239.
Ribeiro, A. B., Rodríguez-Maroto, J. M. (2006). Electroremediation of heavy metalcontaminated soils.
Processes and applications. Cap. 18. Prasad, M.N.V., Sajwan, K.S., Ravi Naidu (Eds.), Trace elements
in the environment: Biogeochemistry. Biotechnology and Bioremediation. Taylor & Francis. CRC Press.
Florida, USA. ISBN: 341-368.
Sabbas, T., Polettini, A., Pomi, R., Astrup, T., Hjelmar, O., Mostbauer, P., Cappai, G., Magel, G.,
Salhofer, S., Speiser, C., Heuss-Assbichler, S., Klein, R., Lechber, P. (2003). Management of municipal
solid waste incineration residues. Waste Management 23(1): 61-88.
Shih, P.H., Chang, J.E., Lu, H.C., Chiang, L.C. (2005). Reuse of heavy metal-containing sludges in
cement production. Cement and Concrete Research 35: 2110 - 2115.
Strathmann, H. (2004). Ion-exchange membrane separation processes. Elsevier. Membrane Science and
Techology Series 9.
Sun, T. R. (2013). Effect of pulse current on energy consumption and removal of heavy metals during
electrodialytic soil remediation. Ph.D. Thesis. Technical University of Denmark, Denmark.
Sundqvist, J.O. (2005). How should municipal solid waste be treated – a system study of incineration-
material recycling, anaerobic digestion and composting. Report of Swedish Environmental Research
Institute.
Suzuki, T., Niinae, M., Koga, T., Akita, T., Ohta, M., Choso, T. (2014). EDDS-enhanced electrokinetic
remediation of heavy metal-contaminated clay soils under neutral pH conditions. Colloids and surfaces
A. Physicochemical and Engineering Aspects 440: 145-150.
Van de Laar, H.T.M., Slagter, J., Duzijn, R.F., De Zeeuw, J.H. (1994). Quality improvement of MSW
fly ash and APC residues from MSW incinerator Amsterdam-West using different immobilization
process. WASCON: 811–820.
Verhulst, D., Buekens, A., Spencer, P.J., Eriksson, G. (1996). Thermodynamics behaviour of metal
chlorides and sulphates under the conditions of incineration furnaces. Environmental Sciences
Technology 30: 50-56.

64
Wey, M.Y., Ou, W.Y., Liu, Z.S., Tseng, H.H., Yang, W.Y., Chiang, B.C. (2001). Pollutants in
incineration flue gas. Journal of Hazardous Materials 82(3): 247-262.
Wiles, C. (1996). Municipal solid waste combustion ash: State of theNknowledge. Journal of
Hazardous Materials 47(1-3): 325-344.
Yu, Q., Nagataki, S., Lin, J., Saeki, T., Hisada, M. (2005). The leachability of heavy metals in hardened
fly ash cement and cement-solidified fly ash. Cement and Concrete Research 35: 1056 - 1063.
Yuan, C-S., Lin, H-Y., Wu, C-H., Liu, M-H. (2005). Partition and size distribution of heavy metals in
the flue gas from municipal solid waste incinerators in Taiwan. Chemosphere 59(1): 135-145.
Youcai, Z., Lijie, S., Guojian, L. (2002). Chemical stabilization of MSW incinerator fly ashes. Journal
of Hazardous Materials 95(1-2): 47-63.
Zacco, A., Borgese, L., Gianoncelli, A., Struis, R.P.W.J., Depero, L.E., Bontempi, E. (2014). Review of
fly ash inertisation treatments and recycling. Springer International. Environmental Chemical 12: 153-
175.

Annexes
A.1. Results performance by Laser Diffractometer - Particle size distribution for raw APC
residues from Vest and REFA

T.1. Table of removal rates in 12 ED experiments from Vest APC residues; (xC –x number of compartments, C
compartments; xD – x remediation time, D days; x mA- x intensity of DC)
Vest % ED Remediation
Cd Cr Cu Pb Zn
2C 3D 5mA 0.5 2.8 1.7 0.9 0.8
2C 3D 50mA 2.5 17.1 0.9 2.8 0.3
2C 7D 5mA 0.3 6.3 0.4 5.4 0.3
2C 7D 50mA 53.2 7.3 1.2 1.4 15.6
2C 14D 5mA 1.8 11.9 4.6 4.9 1.9
2C 14D 50mA 83.9 10.9 29.9 1.3 43.9
3C 3D 5mA 0.3 3.2 0.6 0.3 0.4
3C 3D 50mA 2.6 12.5 1.0 2.1 0.7
3C 7D 5mA 1.1 4.3 1.0 1.2 0.9
3C 7D 50mA 1.4 4.2 1.6 3.4 1.7
3C 14D 5mA 4.2 6.0 2.5 2.3 3.2
3C 14D 50mA 73.9 1.2 4.2 3.2 66.5
T.2. Table of removal rates in 12 ED experiments from REFA APC residues; (xC –x number of compartments, C
compartments; xD – x remediation time, D days; x mA- x intensity of DC)
REFA % ED Remediation
Cd Cr Cu Pb Zn
2C 3D 5mA 0.2 0.3 0.4 6.4 0.2
2C 3D 50mA 0.4 0.6 0.3 26.6 0.2
2C 7D 5mA 0.3 0.4 0.6 14.5 0.4
2C 7D 50mA 0.2 5.2 0.8 24.3 0.5
2C 14D 5mA 0.4 0.5 0.8 50.9 0.5
2C 14D 50mA 0.9 21.0 0.6 23.1 0.3
3C 3D 5mA 0.3 1.2 1.2 47.5 0.5
3C 3D 50mA 0.5 0.8 0.6 38.8 0.3
3C 7D 5mA 0.2 0.4 0.5 16.2 0.4
3C 7D 50mA 0.2 0.9 0.6 31.6 0.4
3C 14D 5mA 7.4 6.2 1.9 30.4 0.9
3C 14D 50mA 0.4 4.4 1.3 67.4 0.6

F.1. The difference between pH in dry ash and pH in suspension in end of 12 ED experiments with APC residue from
Vest; (xC –x number of compartments, C compartments; xD – x remediation time, D days; x mA- x intensity of DC)
F.2. The difference between pH in dry ash and pH in suspension in end of 12 ED experiments with APC residue from
REFA; (xC –x number of compartments, C compartments; xD – x remediation time, D days; x mA- x intensity of DC)
0
2
4
6
8
10
12
14
2C 3D
5mA
2C 3D
50mA
2C 7D
5mA
2C 7D
50mA
2C 14D
5mA
2C 14D
50mA
3C 3D
5mA
3C 3D
50mA
3C 7D
5mA
3C 7D
50mA
3C 14D
5mA
3C 14D
50mA
Vest final ph in ash
Vest final pH in suspension
0
2
4
6
8
10
12
14
2C 3D
5mA
2C 3D
50mA
2C 7D
5mA
2C 7D
50mA
2C 14D
5mA
2C 14D
50mA
3C 3D
5mA
3C 3D
50mA
3C 7D
5mA
3C 7D
50mA
3C 14D
5mA
3C 14D
50mA
REFA final ph in ashREFA final pH in suspension
