electrocardiogram features of premature ventricular contractions
TRANSCRIPT

Ge et al. BMC Cardiovascular Disorders 2012, 12:112http://www.biomedcentral.com/1471-2261/12/112
RESEARCH ARTICLE Open Access
Electrocardiogram features of prematureventricular contractions/ventricular tachycardiaoriginating from the left ventricular outflow tractand the treatment outcome of radiofrequencycatheter ablationBei Ge1, Kang-Ting Ji1, Hai-Ge Ye2, Jia Li1, Yue-Chun Li1, Ri-Peng Yin1 and Jia-Feng Lin1*
Abstract
Background: Radiofrequency catheter ablation (RFCA) has been used for the ablation of premature ventricularcontractions (PVCs) or ventricular tachycardia (VT). To date, the mapping and catheter ablation of the arrhythmiasoriginating from the left ventricular outflow tract (LVOT) has not been specified. This study investigates theelectrocardiogram (ECG) feature of PVCs or VT originating from the LVOT. Moreover, the treatment outcome ofRFCA is analyzed.
Methods: Mapping and ablation were performed on the supravalvular or subvalvular aorta in 52 cases with PVCs/VT originating from the LVOT. The data were compared with those from 104 patients with PVCs/VT originating fromthe right ventricular outflow tract (RVOT). A differential procedure was prepared based on the comparison of theECG features of PVCs/VT originating from the RVOT, LVOT, and their different parts.
Results: Among 52 cases with PVCs originating from the LVOT, 47 were successfully treated by RFCA, with asuccess rate of 90.38%. Several differences among the 12-lead ECG features were observed from the RVOT andLVOT in the left and right coronary sinus groups, as well as under the left coronary sinus group (left fibrous trigone):(1) If the precordial leads transition <V3 plus the precordial leads transitional index >0 are considered as thediagnostic parameters of PVCs/VT originating from the LVOT, then the sensitivity, specificity, as well as positive andnegative predictive values are 94.12%, 93.00%, 87.27%, and 96.88%, respectively; (2) The analysis of differentsubgroups of the LVOT are as follows: (a) A mainly positive wave of r or m pattern was recorded in the lead I in72.73% of patients in the right coronary sinus group, versus 12.90% of patients in the left coronary sinus group, and0% in the under left coronary sinus group. (b) All patients in the right coronary sinus group presented waves ofRII>RIII and QSaVR>QSaVL, whereas most patients in the other two groups showed waves of RIII>RII and QSaVL>QSaVR.(c) Most patients in the under left coronary sinus group in lead V1 had a mainly positive wave (R) (77.78%), whereasthose in the right (81.82%) and left (62.50%) coronary sinus groups had mainly negative waves (rS).
Conclusions: RFCA is a safe and effective curative therapy for PVCs/VT originating from the LVOT. The 12-lead ECGfeatures of the LVOT from different origins exhibit certain distinctions.
Keywords: Electrophysiology, Ventricular arrhythmia, Left ventricular outflow, Catheter ablation, Radiofrequency current
* Correspondence: [email protected] of Cardiology, Second Affiliated Hospital of WenzhouMedical College, 109 Xueyuan Road, Wenzhou, Zhejiang, ChinaFull list of author information is available at the end of the article
© 2012 Ge et al.; licensee BioMed Central Ltd. This is an Open Access article distributed under the terms of the CreativeCommons Attribution License (http://creativecommons.org/licenses/by/2.0), which permits unrestricted use, distribution, andreproduction in any medium, provided the original work is properly cited.

Ge et al. BMC Cardiovascular Disorders 2012, 12:112 Page 2 of 11http://www.biomedcentral.com/1471-2261/12/112
BackgroundMost cases of idiopathic ventricular tachycardia (VT) andpremature ventricular contractions (PVCs) originate fromthe right ventricular outflow tract (RVOT) and the leftventricular postmedian septum. Only a few VT and PVCsoriginate from the left ventricular outflow tract (LVOT)and the vicinity of the atrioventricular wreath. In thepresent study, radiofrequency catheter ablation (RFCA)was performed on 52 cases of idiopathic PVCs/VT origin-ating from different parts of the LVOT. The electrocardio-gram (ECG) features of these cases were investigated andcompared with those of 104 cases of idiopathic PVCs/VToriginating from the RVOT. A differential procedure wasprepared based on the comparison and analysis.
MethodsStudy populationBetween July 2006 and December 2011, 553 patientswith idiopathic PVCs/VT were treated with RFCA inour hospital. Among the cases, 52 originated from theLVOT (9.40%), including 16 males and 36 females, aged60.58 ±14.81 (19–79), in the course of 3.08 ± 2.36 (0.5–14) years. All patients had different degrees of palpita-tions and tightness of the chest. Administration of twoto three types of antiarrhythmic drugs was ineffective,and this approach significantly affected their qualities oflife. Routine examination of biochemistry, chest X-rays,echocardiography, and other tests yielded no structuralheart disease in the 52 cases (except for mild enlargementof the left ventricular in four cases: the left ventricular end-diastolic internal diameter was between 57 and 62 mm,and their re-examination showed full recovery when thePVCs/VT were treated by ablation for half a year). Themean left ventricular end-diastolic internal diameter was47.82 ± 4.53 mm (range 42–62). All patients were exam-ined via dynamic cardiogram to monitor the quantity andonset feature of 24 h PVCs/VT. This test showed that thesum of PVCs/VT was 20,716 ± 11,052 (11,079–48,972)beats/24 h. Among the cases, 44 were simple PVCs withclinical manifestations, 7 were PVCs with paroxysmal VT,1 was sustained VT, and 2 showed a slightly reduced ejec-tion fraction of the left ventricular (52% and 49%). Allpatients were referred for ablation. The ECG features ofthe cases originating from the LVOT and RVOT werecompared. A total of 104 patients with PVCs/VT originat-ing from the RVOT in the same period were randomlyselected for the controlled analysis. These patients weresuccessfully treated with RFCA. Among these RVOTcases,36 were males and 68 were females, aged 48.33 ± 15.7(15–78), with 11 suffering from VTand 93 from PVCs.
Ethical approvalEthical approval was obtained from the Ethics Committeeof the Second Affiliated Hospital of Wenzhou Medical
College. All patients signed informed consent before par-ticipation in this study.
ECG examination and measurementExamination through 12-lead synchronous surface ECGshowed no T wave inversion of precordial leads and epsi-lon wave in all patients. Observation of the QRS complexmorphology in every lead at the onset of PVCs/VT ob-tained the following measurements: height of the R or rwave as well as the depth of the S or s wave in every lead;calculation of the R wave amplitude in V1–V2 leads(height of the R wave/depth of the S wave) and the R waveduration index [1] (measurement of R/QRS wave durationduring cardiac electrophysiology examination; paper speed100 mm/s); as well as consideration of the transitional re-gion and calculation of the transitional index in precordialleads during PVCs/VT and sinus rhythm (transitionalindex in precordial leads=transitional region in precordialleads during sinus rhythm-transitional region in precordialleads during PVCs/VT) [2]. This study focuses on the rela-tively tall amplitude wave (>0.5 mV) of Q, R, and S, as wellas the relative low amplitude wave (≤0.5 mV) of q, r, and s.
Intracardiac electrophysiologic examination andradiofrequency ablation treatmentAll patients discontinued the use of antiarrhythmic drugsfor at least five half lives before operation. A Judkins L3.5or R3.0 angiographic catheter was routinely placed at theostium of the left or right coronary artery from the radialartery. If necessary, a 2-pole or 4-pole mapping catheterand a 10-pole coronary sinus mapping catheter could beplaced at the right ventricular apex or at the right atriumand the coronary sinus. In addition, procedural and non-procedural stimuli, as well as mapping, were performed inbasal conditions. Isoproterenol was administered intraven-ously. Furthermore, a 7F arterial sheath was placed at theright femoral artery. Mapping and ablation were per-formed via intubation of a 4-pole ablation catheter into theLVOT (above or under the semilunar valve) directlythrough the sheath, according to the primary locationshowed by the surface ECG before operation.Mapping and ablation of spontaneous PVCs or of PVCs
induced by isoproterenol and pace stimulus mainly reliedon the activation sequence mapping and were supplemen-ted by pace mapping. The ventricle was paced at a slowrate of 120 to 140 per minute, according to the couplinginterval of the PVC. During pacing, 12-lead ECG andQRS waves of spontaneous PVCs were the same in at least11 leads. Alternatively, the ablation target site consideredas the QRS wave on the endocardial electrogram of theactivation sequence mapping was 25 ms ahead that ofPVCs, which was treated by ablation when the PVCs be-came frequent, following mapping and location through

Ge et al. BMC Cardiovascular Disorders 2012, 12:112 Page 3 of 11http://www.biomedcentral.com/1471-2261/12/112
electrophysiologic examination. The location link betweenthe target site and the coronary requires identificationthrough coronary angiography before ablation in allpatients. Ablation should cease upon noticing the cathetertransposition in continuing fluoroscopy of the ablation cath-eter. Repeat coronary angiography could be performed toobserve the status of the blood supply after a successful ab-lation. If the ideal target site is not mapped in the LVOT, theRVOT should be mapped. If no ideal target site is observed,mapping and ablation could finally be guided by the map-ping ablation catheter (quadripolar irrigated-tip catheterwith a 4-mm distal electrode) from the coronary sinus tothe distal great cardiac vein (if necessary, the mapping abla-tion catheter could be guided by coronary venography). Aablation catheter of temperature-controlled ablation wasgenerally selected. The preset temperature was 52°C to55°C, the preset energy was 30 W to 50 W, and impe-dance was 80 Ω to 140 Ω. However, saline-irrigated abla-tion catheter should be the priority when the mappingablation catheter is guided from the coronary sinus to thedistal great cardiac vein. In this case, the preset tem-perature was 43°C, the preset energy was 30 W to 35 W,and the saline-irrigated velocity must be adjusted to itsmaximum (60 ml/min). Ablation was attempted for 10 safter the temperature reached 50°C (temperature of thesaline-irrigated catheter was 43°C). The effective targetsite was defined as a point when PVCs disappeared within10 s after ablation, when VT terminated, or when frequentPVCs of the same form appeared with spontaneous PVCsand paroxysmal VT during ablation, then shortly disap-peared. After continuing ablation for 60 s to 180 s at theeffective target site and supplementing point ablationaround the site, monitoring continued for 30 min. Ter-minating the ablation was determined when PVCs disap-peared and when the initial induced PVCs/VT methods,such as power stimulus and intravenous administration ofisopropylarterenol, were not effective. Re-mapping of tar-get site is necessary if PVCs do not disappear after abla-tion for 10 s or if VT could not be terminated.
Follow-up methods(1) Routine ECG monitoring for 48 hours after ablationoperation; (2) patient re-examination once in threemonths after operation using echocardiogram plus dy-namic ECG to estimate the long-term effect; during thisperiod, all administration of anti-arrhythmia drugs shouldcease; (3) further and timely consultation for any specialcondition alterations during outpatient follow-up; (4)archival of each patient. Patients were followed up by tele-phone in 6, 12, and 18 months after the ablation proce-dure. ECG and 24-hour ECG monitoring were performedwhenever the patient had symptoms suggestive of recur-rence of PVCs/VT.
Definition of successful ablationThe standard of instant success are as follows [3]: whenPVCs disappear or when sporadic PVCs (≤1 beats/min)/VT cannot be induced after radiofrequency ablation; andwhen close observation for 30 min after operation revealsa reduction of the total number of PVCs to less than10(shape is completely similar to monomorphous PVCs be-fore operation). The standard of long-term success is whendynamic ECG monitoring for a full day within threemonths after operation show that PVCs disappeared, orwhen total number of PVCs decreased by over 75%. More-over, long-term success is achieved when the VT does notrecur and the uncomfortable symptoms are remarkablyimproved.
Statistical analysisMeasurement data are described as Mean ± Standard de-viation ( �x � s ). Independent samples were applied forcomparison among groups using the t-test, ANOVA ana-lysis, and the Q test. Enumeration data are described ascase numbers and percentages. The probability could bedirectly measured among groups through X-squared testsor Fisher’s exact test. P < 0.05 is considered as statisticallysignificant.
ResultsMapping and ablation results of PVCs/VT originating fromthe LVOTAll patients were treated with mapping and ablation appliedthrough temperature controlled catheter ablation. Success-ful ablation was achieved for 47 out of 52 patients (90.38%).Simple activation sequence mapping was performed on 34cases, among which 30 succeeded. Activation sequencecombined with pace mapping were performed on 18 cases,among which 17 succeeded (in these 17 cases, the QRScomplex of pacing from the effective target site and spon-taneous PVCs in 12-lead surface ECG were common in atleast 11 leads). The average operation time was 73.46 ±26.72 (35.00–120.00) min beginning from puncturing topulling out the sheath. The average X-ray exposure timewas 10.13 ± 4.12 (3.10–21.3) min. The average ablationtime was 258.05 ± 73.68 (90–360) s. The starting point ofthe ventricular potential of the effective target site was35.83 ± 6.38 (26–57) ms earlier than the onset of the QRSwave on PVCs of the surface ECG in 47 patients with suc-cessful ablation. Among these cases, six showed the peakfractionated potential in the ventricular potential of the ef-fective target site (at the terminal ventricular potential du-ring sinus rhythm and reversed during PVCs), and twoshowed mid-diastole potential. The effective target siteduring ablation manifested that PVCs in 39 cases disap-peared within 10 s after ablation and increased frequentPVCs with the same shape as spontaneous PVCs or parox-ysmal VT, which shortly disappeared in 8 cases. According

Ge et al. BMC Cardiovascular Disorders 2012, 12:112 Page 4 of 11http://www.biomedcentral.com/1471-2261/12/112
to the effective target site or the activation mapping of theearliest activation with X-ray image localization, thepatients were divided into three groups: (1) 32 cases in theleft coronary sinus group, of which 28 had successful abla-tion (87.50%); (2) All 11 cases in the right coronary sinusgroup had successful ablation (100.00%); (3) 9 cases in theleft fibrous trigone under the left coronary sinus group(abbreviated as under left coronary sinus group), amongwhich 8 cases had successful ablation (88.89%). In fivefailed cases, the left main coronary artery mapping in fourcases showed that the earliest ventricular potential timewas 25 ms to 33 ms earlier than the onset of the QRS waveon the PVCs of surface ECG. Ablation was then ceased. Inthe other case, under front left coronary sinus (about0.5 cm from the left coronary sinus) mapping showed thatthe ventricular potential time was up to 34 ms earlier thanthe onset of the QRS wave on the PVCs of surface ECG,and repetitive ablation was ineffective. All patients weremonitored by ECG for three successive days after ope-ration and were re-examined by dynamic ECG withinthree months after operation. The mean duration for fol-low up lasted 12.9 ± 10.4 (3–34) months. Two casesrelapsed. Tables 1 and 2 compare the general clinical sta-tus and the results of mapping and ablation in threegroups, respectively.Table 1 shows that no statistical difference in the general
clinical status among the three groups (p > 0.05). Table 2indicates no significant difference in the V-QRS time ofactivation mapping, operation time, X-ray exposure time,ablation time, and successful rate of ablation among thethree groups (p > 0.05). The number of cases with pacemapping of the effective target site in the left coronarysinus group was significantly less than that in the rightcoronary sinus and the under left coronary groups (bothwith p < 0.01). However, the number of ablations in theunder left coronary sinus group was significantly less thanthat in the left coronary sinus and the right coronary sinusgroups (p < 0.01, p < 0.05, respectively).
Comparison of the ECG features of PVCs/VT originatingfrom the RVOT and LVOTThe PVCs/VT in leads II, III, aVF, and V5–V6 presentedsingle-way R wave, regardless of origin. Table 3 compares
Table 1 Comparison of general clinical conditions among the
Group Sex(male%)
Age(years)
Duration(years)
PVCs total numb(number/24 h)
Left coronary sinus(n = 32)
9(28.13) 60.08 ±13.82
3.06 ± 2.37 20378 ± 9825
Right coronarysinus (n = 11)
4(36.36) 62.09 ±14.27
2.96 ± 2.52 21848 ± 11741
Under left coronarysinus (n = 9)
3(33.33) 60.52 ±17.72
3.28 ± 2.43 20537 ± 11374
*Abbreviation: NSVT non-sustained ventricular tachycardia, SVT sustained ventricula
the 12-lead ECG of the two groups and every subgroup ofPVCs/VT that originated from the LVOT.The main difference between the RVOT and LVOT
groups was in their right precordial leads. The RVOTgroup presented mainly an rS type of S wave in 95.19% oflead V1, whereas the LVOT group presented mainly R,RS, or Rs types of R wave in 43.14% of lead V1. Theformer had only 6.73% of precordial leads transitional area≤lead V2, whereas the latter had up to 71.15% (p < 0.01).In addition, only six cases had precordial leads transitionalindex >0 in the RVOT group (5.77%), whereas 49 caseswere observed in the LVOT group (94.23%). Significantdifferences between the two groups (p < 0.01) were ob-served. Analysis of the LVOT subgroups demonstrated thefollowing: (1) Most patients in the right coronary sinusgroup presented mainly r or m type of positive wave inthe lead I (72.73%) verus the left coronary sinus group(12.50%) and the under left coronary sinus group (0%)(both with p < 0.01). However, most of the patients in thelatter two groups (left coronary sinus and under left cor-onary sinus) had rs or rS type, accounting for 81.25% and66.67%, respectively, which were significantly more than9.09% in the right coronary sinus group (both withp < 0.01). (2) Although all patients in the three groups hadR type in leads II, III, aVF, and V4–V6, and then QS typein leads aVR and aVL, differences were observed in thedistribution of the height of the R wave and the depth ofthe QS wave. All patients in the right coronary sinusgroup had RII>RIII, QSaVR>QSaVL, whereas most patientsin the other two groups had RIII>RII, QSaVL>QSaVR (bothwith p < 0.01). (3) Differences were likewise observed inthe shape of the QRS complex in precordial leads amongthe three groups. Most patients in the under left coronarysinus group presented mainly R type of positive waves inlead V1 (77.78%), whereas most patients in the right co-ronary sinus (81.82%) and the left coronary sinus (62.50%)groups presented rS type of negative wave. (4) All patientsin the under left coronary sinus group had transition ofprecordial leads prior to V1, whereas those in the left andright coronary sinus groups were mainly in the V2–V3leads. (5) Most patients in the under left coronary sinusgroup had a notch on the descending branch of the R wavein inferior leads (88.89%), whereas none were observed
three groups
er Withhypertension
Withdiabetes
With left ventricularenlargement
NSVT(SVT)*
PVCs
12(37.50) 3(9.38) 2(6.25) 4(1) 28(87.50)
5(45.45) 2(18.18) 1(11.11) 2(0) 9(81.82)
3(33.33) 1(11.11) 1(11.11) 2(0) 8(77.78)
r tachycardia.
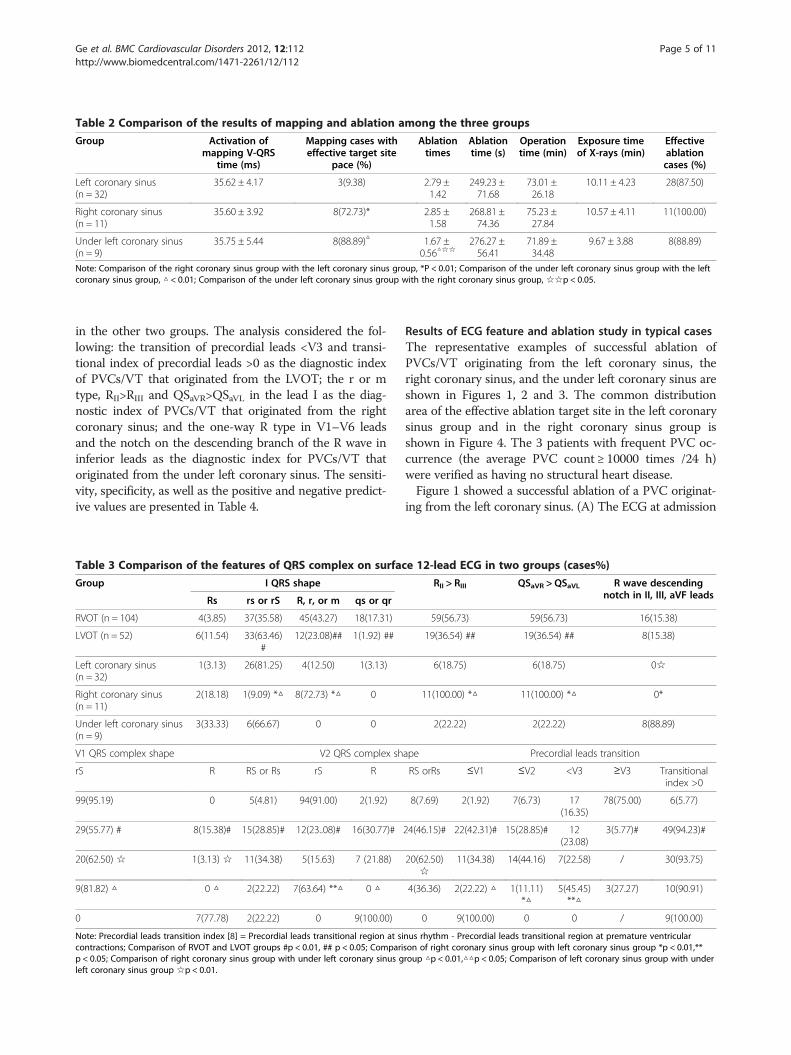
Table 2 Comparison of the results of mapping and ablation among the three groups
Group Activation ofmapping V-QRS
time (ms)
Mapping cases witheffective target site
pace (%)
Ablationtimes
Ablationtime (s)
Operationtime (min)
Exposure timeof X-rays (min)
Effectiveablationcases (%)
Left coronary sinus(n = 32)
35.62 ± 4.17 3(9.38) 2.79 ±1.42
249.23 ±71.68
73.01 ±26.18
10.11 ± 4.23 28(87.50)
Right coronary sinus(n = 11)
35.60 ± 3.92 8(72.73)* 2.85 ±1.58
268.81 ±74.36
75.23 ±27.84
10.57 ± 4.11 11(100.00)
Under left coronary sinus(n = 9)
35.75 ± 5.44 8(88.89)△ 1.67 ±0.56△☆☆
276.27 ±56.41
71.89 ±34.48
9.67 ± 3.88 8(88.89)
Note: Comparison of the right coronary sinus group with the left coronary sinus group, *P < 0.01; Comparison of the under left coronary sinus group with the leftcoronary sinus group, △ < 0.01; Comparison of the under left coronary sinus group with the right coronary sinus group, ☆☆p < 0.05.
Ge et al. BMC Cardiovascular Disorders 2012, 12:112 Page 5 of 11http://www.biomedcentral.com/1471-2261/12/112
in the other two groups. The analysis considered the fol-lowing: the transition of precordial leads <V3 and transi-tional index of precordial leads >0 as the diagnostic indexof PVCs/VT that originated from the LVOT; the r or mtype, RII>RIII and QSaVR>QSaVL in the lead I as the diag-nostic index of PVCs/VT that originated from the rightcoronary sinus; and the one-way R type in V1–V6 leadsand the notch on the descending branch of the R wave ininferior leads as the diagnostic index for PVCs/VT thatoriginated from the under left coronary sinus. The sensiti-vity, specificity, as well as the positive and negative predict-ive values are presented in Table 4.
Table 3 Comparison of the features of QRS complex on surfac
Group I QRS shape
Rs rs or rS R, r, or m qs or qr
RVOT (n = 104) 4(3.85) 37(35.58) 45(43.27) 18(17.31)
LVOT (n = 52) 6(11.54) 33(63.46)#
12(23.08)## 1(1.92) ##
Left coronary sinus(n = 32)
1(3.13) 26(81.25) 4(12.50) 1(3.13)
Right coronary sinus(n = 11)
2(18.18) 1(9.09) *△ 8(72.73) *△ 0
Under left coronary sinus(n = 9)
3(33.33) 6(66.67) 0 0
V1 QRS complex shape V2 QRS complex sh
rS R RS or Rs rS R
99(95.19) 0 5(4.81) 94(91.00) 2(1.92)
29(55.77) # 8(15.38)# 15(28.85)# 12(23..08)# 16(30.77)#
20(62.50) ☆ 1(3.13) ☆ 11(34.38) 5(15.63) 7 (21.88)
9(81.82) △ 0 △ 2(22.22) 7(63.64) **△ 0 △
0 7(77.78) 2(22.22) 0 9(100.00)
Note: Precordial leads transition index [8] = Precordial leads transitional region at sicontractions; Comparison of RVOT and LVOT groups #p < 0.01, ## p < 0.05; Comparip < 0.05; Comparison of right coronary sinus group with under left coronary sinus gleft coronary sinus group ☆p < 0.01.
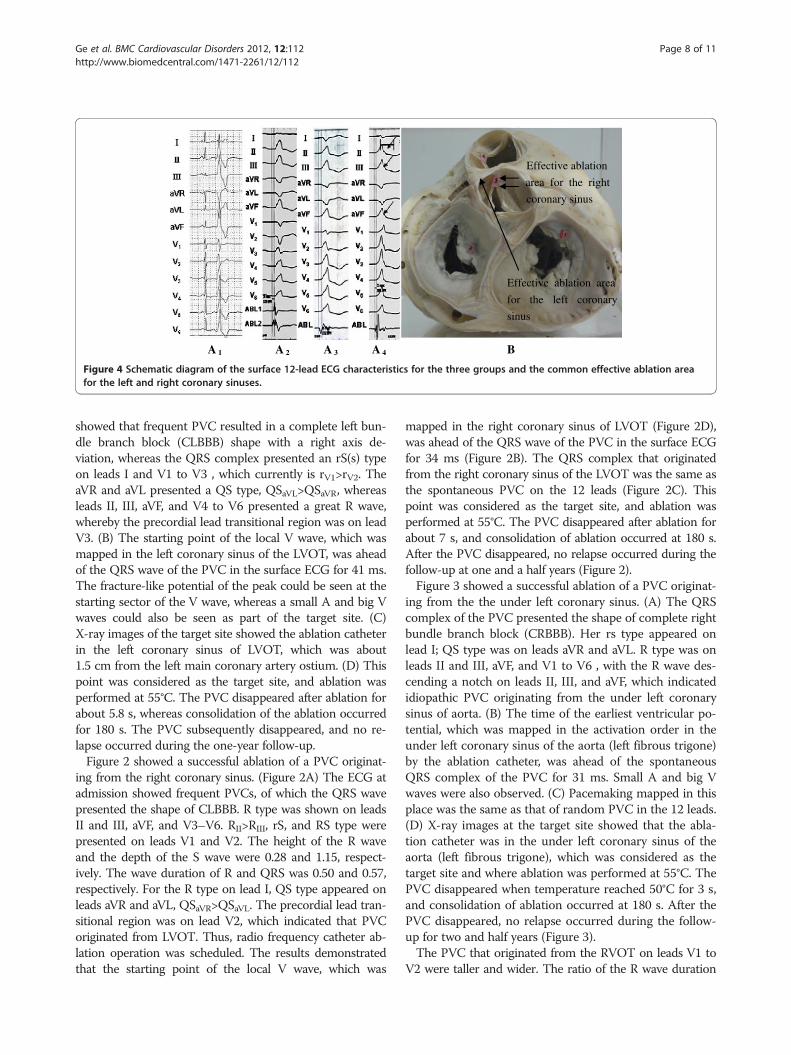
Results of ECG feature and ablation study in typical casesThe representative examples of successful ablation ofPVCs/VT originating from the left coronary sinus, theright coronary sinus, and the under left coronary sinus areshown in Figures 1, 2 and 3. The common distributionarea of the effective ablation target site in the left coronarysinus group and in the right coronary sinus group isshown in Figure 4. The 3 patients with frequent PVC oc-currence (the average PVC count ≥ 10000 times /24 h)were verified as having no structural heart disease.Figure 1 showed a successful ablation of a PVC originat-
ing from the left coronary sinus. (A) The ECG at admission
e 12-lead ECG in two groups (cases%)
RII > RIII QSaVR > QSaVL R wave descendingnotch in II, III, aVF leads
59(56.73) 59(56.73) 16(15.38)
19(36.54) ## 19(36.54) ## 8(15.38)
6(18.75) 6(18.75) 0☆
11(100.00) *△ 11(100.00) *△ 0*
2(22.22) 2(22.22) 8(88.89)
ape Precordial leads transition
RS orRs ≤V1 ≤V2 <V3 ≥V3 Transitionalindex >0
8(7.69) 2(1.92) 7(6.73) 17(16.35)
78(75.00) 6(5.77)
24(46.15)# 22(42.31)# 15(28.85)# 12(23.08)
3(5.77)# 49(94.23)#
20(62.50)☆
11(34.38) 14(44.16) 7(22.58) / 30(93.75)
4(36.36) 2(22.22) △ 1(11.11)*△
5(45.45)**△
3(27.27) 10(90.91)
0 9(100.00) 0 0 / 9(100.00)
nus rhythm - Precordial leads transitional region at premature ventricularson of right coronary sinus group with left coronary sinus group *p < 0.01,**roup △p < 0.01,△△p < 0.05; Comparison of left coronary sinus group with under

Table 4 Diagnostic value of different indexes for PVCs/VT originating from different sites of LVOT
Diagnosis index Sensitivity Specificity Positive predictivevalue
Negative predictivevalue
Precordial leads transition < V3+Precordial leads transitionindex >0 diagnosis of the origin of LVOT
49/52(94.23) 95/104(91.35)
49/58(84.48) 95/98(96.94)
I lead present as type r or m to diagnose the origin of the rightcoronary sinus
6/9(66.67) 37/41(90.24) 6/10(60.00) 37/40(92.50)
RII > RIII to diagnose the origin of the right coronary sinus 11/11(100.00)
33/41(80.49) 11/19(57.89) 33/33(100.00)
QSaVR > QSaVL to diagnosis the origin of the right coronary sinus 11/11(100.00)
33/41(80.49) 11/19(57.89) 33/33(100.00)
All V1–V6 present as one-way R wave to diagnose the origin of theunder left coronary sinus
8/9(88.89) 43/43(100.00)
8/8(100.00) 43/44(97.73)
Inferior leads descending a notch to diagnose the origin of theunder left coronary sinus
8/9(88.89) 43/43(100.00)
8/8(100.00) 43/44(97.73)
ABL1= ablation catheter in the left coronary sinus, ABL2= ablation catheter in RVOT
aVR
aVL
aVF
V1
V2
V3
V4
V5
V6
ABL
D
RFon
LAO45°° RAO30°
ABL1
ABL2
Figure 1 Surface 12-lead ECG feature of PVC that originated from the left coronary sinus, and mapping of the activation sequence ofthe effective target site, the X-ray image, and the effective feature of response during ablation.
Ge et al. BMC Cardiovascular Disorders 2012, 12:112 Page 6 of 11http://www.biomedcentral.com/1471-2261/12/112
ABL2=ablation catheter in the right coronary sinus, ABL1=ablation catheter in
RVOT, RCA=right coronary artery, RCS=right coronary sinus, LCS=left coronary
sinus, LMC=left main coronary, NCS=non-coronary sinus
A B C D
Figure 2 Feature of PVC on the surface 12-lead ECG that originated from the right coronary sinus, and the activation sequence of theeffective target site, pace mapping, and the feature of X-ray images.
LAO=left anterior oblique, RAO=right anterior oblique, ABL=ablation catheter
LCS=left coronary sinus, ULCS=under left coronary sinus
Cathet er
ABL
RAO30°
LCS
ULCS
LAO45°
D
Figure 3 Surface 12-lead ECG feature of the PVC that originated from the under left coronary sinus; effective target site pacing,activation sequence mapping, and the feature of X-ray images.
Ge et al. BMC Cardiovascular Disorders 2012, 12:112 Page 7 of 11http://www.biomedcentral.com/1471-2261/12/112
Effective ablation
area for the right
coronary sinus
Effective ablation area
for the left coronary
sinus
A 1 B A 2 A 3 A 4
Figure 4 Schematic diagram of the surface 12-lead ECG characteristics for the three groups and the common effective ablation areafor the left and right coronary sinuses.
Ge et al. BMC Cardiovascular Disorders 2012, 12:112 Page 8 of 11http://www.biomedcentral.com/1471-2261/12/112
showed that frequent PVC resulted in a complete left bun-dle branch block (CLBBB) shape with a right axis de-viation, whereas the QRS complex presented an rS(s) typeon leads I and V1 to V3 , which currently is rV1>rV2. TheaVR and aVL presented a QS type, QSaVL>QSaVR, whereasleads II, III, aVF, and V4 to V6 presented a great R wave,whereby the precordial lead transitional region was on leadV3. (B) The starting point of the local V wave, which wasmapped in the left coronary sinus of the LVOT, was aheadof the QRS wave of the PVC in the surface ECG for 41 ms.The fracture-like potential of the peak could be seen at thestarting sector of the V wave, whereas a small A and big Vwaves could also be seen as part of the target site. (C)X-ray images of the target site showed the ablation catheterin the left coronary sinus of LVOT, which was about1.5 cm from the left main coronary artery ostium. (D) Thispoint was considered as the target site, and ablation wasperformed at 55°C. The PVC disappeared after ablation forabout 5.8 s, whereas consolidation of the ablation occurredfor 180 s. The PVC subsequently disappeared, and no re-lapse occurred during the one-year follow-up.Figure 2 showed a successful ablation of a PVC originat-
ing from the right coronary sinus. (Figure 2A) The ECG atadmission showed frequent PVCs, of which the QRS wavepresented the shape of CLBBB. R type was shown on leadsII and III, aVF, and V3–V6. RII>RIII, rS, and RS type werepresented on leads V1 and V2. The height of the R waveand the depth of the S wave were 0.28 and 1.15, respect-ively. The wave duration of R and QRS was 0.50 and 0.57,respectively. For the R type on lead I, QS type appeared onleads aVR and aVL, QSaVR>QSaVL. The precordial lead tran-sitional region was on lead V2, which indicated that PVCoriginated from LVOT. Thus, radio frequency catheter ab-lation operation was scheduled. The results demonstratedthat the starting point of the local V wave, which was
mapped in the right coronary sinus of LVOT (Figure 2D),was ahead of the QRS wave of the PVC in the surface ECGfor 34 ms (Figure 2B). The QRS complex that originatedfrom the right coronary sinus of the LVOT was the same asthe spontaneous PVC on the 12 leads (Figure 2C). Thispoint was considered as the target site, and ablation wasperformed at 55°C. The PVC disappeared after ablation forabout 7 s, and consolidation of ablation occurred at 180 s.After the PVC disappeared, no relapse occurred during thefollow-up at one and a half years (Figure 2).Figure 3 showed a successful ablation of a PVC originat-
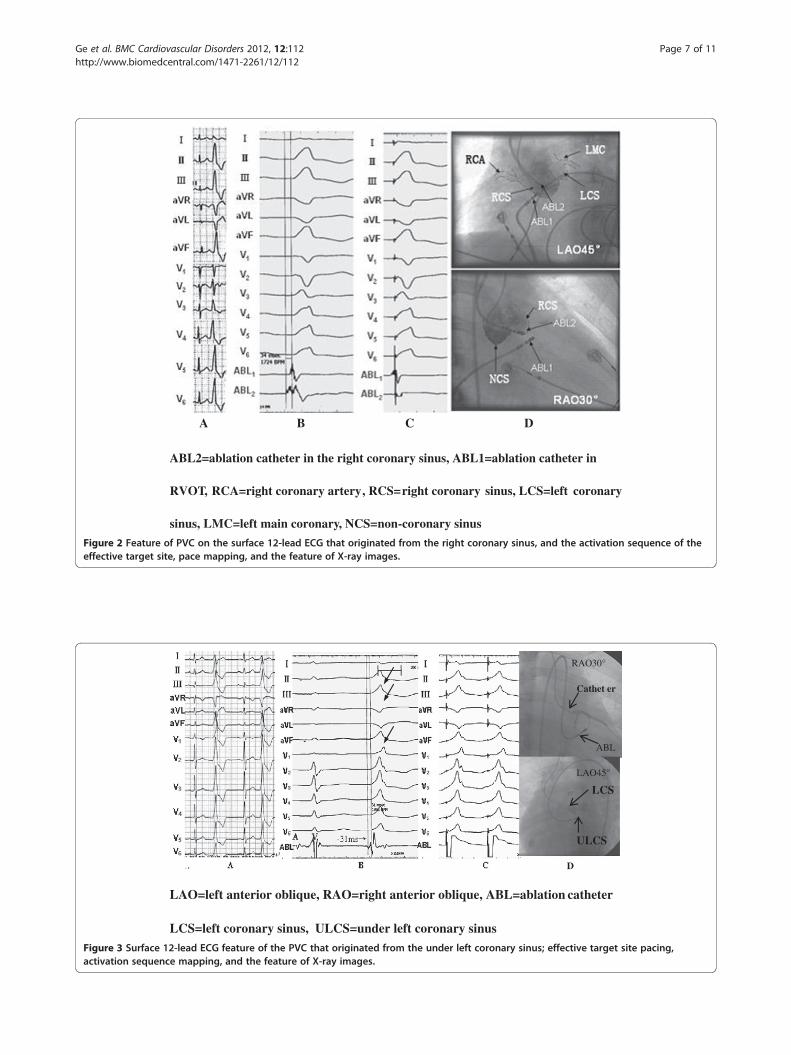
ing from the the under left coronary sinus. (A) The QRScomplex of the PVC presented the shape of complete rightbundle branch block (CRBBB). Her rs type appeared onlead I; QS type was on leads aVR and aVL. R type was onleads II and III, aVF, and V1 to V6 , with the R wave des-cending a notch on leads II, III, and aVF, which indicatedidiopathic PVC originating from the under left coronarysinus of aorta. (B) The time of the earliest ventricular po-tential, which was mapped in the activation order in theunder left coronary sinus of the aorta (left fibrous trigone)by the ablation catheter, was ahead of the spontaneousQRS complex of the PVC for 31 ms. Small A and big Vwaves were also observed. (C) Pacemaking mapped in thisplace was the same as that of random PVC in the 12 leads.(D) X-ray images at the target site showed that the abla-tion catheter was in the under left coronary sinus of theaorta (left fibrous trigone), which was considered as thetarget site and where ablation was performed at 55°C. ThePVC disappeared when temperature reached 50°C for 3 s,and consolidation of ablation occurred at 180 s. After thePVC disappeared, no relapse occurred during the follow-up for two and half years (Figure 3).The PVC that originated from the RVOT on leads V1 to
V2 were taller and wider. The ratio of the R wave duration
Ge et al. BMC Cardiovascular Disorders 2012, 12:112 Page 9 of 11http://www.biomedcentral.com/1471-2261/12/112
was ≥50%. The ratio of the R wave amplitude was ≥30%,and the precordial lead transition was between leads V1and V2. Whether the index agreed with the origin, theLVOT was determined according to the report by Ouyanget al. [1]. Close observation of the sinus rhythm showedthat R/S on lead V1 was equal to1, and the precordial leadtransition was on lead V1. Transitional index = 1–1.5 =−0.5, which conformed to the origin of RVOT. Finally, asuccessful catheter ablation of PVCs was performed in theupper interval of the RVOT (Figure 4A1). The PVC onleads V1 to V6 that originated from the under left coro-nary sinus had a single R wave characteristic with a notchon the descending branch on inferior wall leads(Figure 4A4) (PVC that originated from the right coronarysinus had r or m type on lead I, and the precordial transi-tion followed between leads V1 and V2, Figure 4A2). ThePVC that originated from the left coronary sinus had rstype (r<s) on lead I, and the precordial transition emergedprior to the right coronary sinus (between leads V1 andV2, Figure 4A3). The effective ablation area in the left cor-onary sinus is usually located on the aortic sinus wall infront of the left main coronary artery, whereas that in theright coronary sinus is usually located on the aortic sinuswall in front of the right coronary sinus or right coronaryvalve (Figure 4B).
DiscussionECG characteristics of the PVC that originated from LVOTLVOT refers to the inner area of the aortic sinus and theunder area of the aortic valve. The area under the aorticvalve, which extends from the anterior lower lobe marginof the left atrioventricular valve to the aortic valve, has alength of about 10 mm. Some scholars consider the me-chanism of PVC/VT that originate from this area as recur-rently triggered by delayed after-depolarization [4-6].The RVOT and LVOT are anatomically adjacent to each
other. PVC/VT from the outflow tract consistently pre-sented tall R waves in leads II, III, and aVF, unlike in otherleads. Generally, the dominant wave of the QRS complexof PVC/VT from RVOT is in a downward direction andpresents an rS type. The transition of the precordial leadswas in lead V3 or behind lead V3. Conversely, the domi-nant wave of the QRS complex from the LVOT in lead V1was in a downward or upward direction and presented rS,RS, or Rs type, whereas that in lead V2 was in an upwarddirection and presented an rs or Rs(r/s > 1) type, and thenthe transition area in the precordial leads was in or aheadof lead V2 [7]. Some patients presented rV1 > rV2, and thetransition area in the precordial leads was between leadsV2 and V3. In this circumstance, an observation can bederived from the time limit ratio of the R wave in leads V1and V2 (time limit of R wave in lead V1 or V2/time limitof QRS wave) and from the amplitude ratio of the R wave
(R wave amplitude in lead V1 or V2/ S wave amplitude). Ifthe time limit ratio of the R wave is >50% and its amplituderationis >30%, PVC originates from the left ventricle, andconversely, if the time limit ratio is <50% and the ampli-tude is <30%, the PVC originates from the right ventricle[1]. The ECG variation can be explained by the illustrationin Figure 4B. PVCs/VT that originates from the LVOT(aortic sinus) manifestes as a taller and longer r(R) wavethan that which originates from the RVOT, suggesting thatforward depolarization of the LVOT myocardial wasthicker and had longer depolarization time than that ofPVC/VT from the RVOT. Although the diagnostic stand-ard stated above had relatively higher sensitivity and speci-ficity for differentiating PVC/VT from the LVOT and thatfrom the RVOT, conditions can be easily misdiagnosed,such as thoracic deformity and heart transposition, or theposition of the ball aspirator for precordial leads can beslightly shifted during ECG examination. When judgingthe origin of PVCs/VTs, researchers should examine thePVC/VT and the configuration of the QRS in precordialleads during sinus rhythms. Betensky et al. [8] reportedthat if the precordial lead transition of VT emerges afterthat of the sinus rhythm, the origin of the LVOT can becompletely excluded. However, if the two elements areequal or the former emerges earlier, the transition ratio inlead V2 should be calculated by computing the percentageR-wave during PVC/VT (R/R+S) divided by the percentageR-wave in sinus rhythm (R/R+S). If the ratio is ≥0.6, 95%sensitivity and 100% specificity for predicting VT that ori-ginates from LVOTare manifested. Naoki Yoshida et al. [2]observed that the current criterion of judgment for thevalue of prediction in patients with heart transposition islimited. They developed the formula for the transitionalarea index, whereby the value of the lead is provided by thetransitional area in the lead. In addition, the transitionalarea index denotes the difference between the transitionalarea during sinus rhythm and that during VT. The transi-tional area index of >0 had 88% sensitivity of predictionand 82% specificity for those from the LVOT.In the present study, PVC/VT that originated from
LVOT was investigated in 52 cases that underwent electro-physiological mapping and/or ablation. According to theorigin of its effective target site or the first activation site,the patients in this study were divided into three groups:left coronary sinus, under left coronary sinus, and rightcoronary sinus group. The feature of the 12-lead surfaceECG that originated from different sites of the LVOT wasstudied, whereas PVC/VT that originated from the RVOTin 104 cases, as confirmed by radio-frequency ablationduring the same period of hospitalization, was analyzedand compared. With <V3 transition of precordial leadsand >0 transitional index of precordial leads as diagnosticindexes for PVC/VT that originated from LVOT, we mea-sured sensitivity as 94.23%, specificity as 91.35%, positive

Ge et al. BMC Cardiovascular Disorders 2012, 12:112 Page 10 of 11http://www.biomedcentral.com/1471-2261/12/112
predictive value as 84.48%, and negative predictive value as96.94%. Analysis of different subgroups of LVOT showedthat most patients in the right coronary sinus group mainlypresented r or m type on the positive waves in lead I(72.73%), which were significantly more than the 12.50% ofthe left coronary sinus group and none in the under leftcoronary sinus group (p < 0.01, both). However, accountingfor 81.25% and 66.67%, respectively, the other two sub-groups mainly presented rs or rS type, which were re-markably more than the 9.09% of the former subgroup(p < 0.01, both). Although all patients in the three groupspresented R type in leads II, III, aVF, and V4 to V6, QStype was evident in the aVR and aVL leads. Differenceswere observed in the distribution of height of the R waveand depth of the QS wave. All patients in the right coro-nary sinus group exhibited RII>RIII and QSaVR>QSaVL. Bycontrast, the other two subgroups mainly presentedRIII>RII and QSaVL>QSaVR (both p < 0.01). Differences werealso manifested in the shape of the QRS complex in theprecordial leads among the three groups. Most patients inthe under left coronary sinus group mainly presented Rtype in lead V1 on the positive wave (77.78%), while thosein the right coronary sinus group (81.82%) and the left co-ronary sinus group (62.50%) mainly presented rS type onthe negative wave. The transition of precordial leads forpatients in the under left coronary sinus group was priorto lead V1, while those in the left and in the right coronarysinus groups were mainly in V2 to V3. Most patients had anotch on the descending portion of the Rwave in inferiorleads in the under left coronary sinus group (88.89%),whereas no notch on the descending branch of the R wavein inferior leads in the other two groups was observed.PVC/VT from the LVOT can take place in the left, under
left, right, and non coronary sinus groups. Their occur-rence was clinically most common in the left coronarysinus group, followed by the right and the under left coro-nary sinus groups, whereas they were rarely seen in the no
Inferior and V5–V6 leads present as Rtype, p
V1–V6 all present as o
Under left coronary sinus
Yes
sup
Adjacent to the fiber connections of
aortic valve ring and mitral annulus
(Left fibrous trigone)
Yes
Rig
First step
PVCs/VT originate from L
Second step
Third step
Y
Figure 5 Differential procedure of PVC/VT in surface ECG originating
coronary sinus group. Clinically, patients who presentedwith the R type in the inferior and V5 to V6 leads and <V3transition of precordial leads with >0 transitional index ofprecordial leads, should first be considered to have an ori-gin in the LVOT. The differential procedure of PVC/VToriginating from the RVOT, LVOT, and from other regionsis shown in Figure 5.
Ablation and methods for PVC originating from the LVOTPVC/VT partly originated from the epicardium of theLVOT. Ablation was successfully performed in the struc-ture on the vicinity of the LVOT epicardium. The mostcommon application of epicardium for ablation was ap-plied through aortic Valsava sinus (left coronary sinus).This site is in the anatomic vicinity of the epicardium ofthe ventricular upper septal myocardium, which actuallyoriginates from the epicardium of the septal myocardium.When PVCs/VT are ablated in the left coronary sinus, theablation catheter should be carefully operated to avoid itsentrance into the left coronary. Coronary arteriographymust be routinely performed. If necessary, an angiographycatheter should be utilized as an indicator to avoid da-maging the coronary during ablation. Alteration of theintracardiac electrogram should also be observed carefullythrough the ablation catheter and by repeated intermittentX-ray exposure when the ablation is performed in the leftcoronary sinus. If the ablation catheter shifts, ablationshould be discontinued immediately. In the present work,the ablation method for PVCs/VT in the right and in theunder left coronary sinus was similar to that in the left cor-onary sinus. For PVCs/VTs that originate from the left cor-onary sinus, the ablation target site should be determinedbased on “activation sequence mapping.” This kind ofpacing mostly cannot activate the ventricle. However, forPVCs/VTs that originate from the right and the under leftcoronary sinuses, the target site should be based on the in-tegrity of the “activation sequence” and “pace mapping”
recordial leads transition V3 transitional index 0
ne-way R wave
ravalvular aorta
Left coronary sinus
No
Lead I present as r or m type, no s wave
ht coronary sinus
VOT
es No
No
PVCs/VT originate from RVOT
from RVOT and LVOT.

Ge et al. BMC Cardiovascular Disorders 2012, 12:112 Page 11 of 11http://www.biomedcentral.com/1471-2261/12/112
because pace mapping can be worked out for mostpatients. The effective ablation target site is usually underthe front of the ostium of the left main coronary artery inpatients with the left coronary sinus as the origin. Hence,coronary angiography should be performed after ablationto confirm post-ablation patency of the coronary artery.Furthermore, coronary angiography should be performedsubsequently after ablation to determine the condition ofthe blood supplement. In contrast, the effective ablationtarget site of patients with the right coronary sinus as theorigin is usually on the aortic sinus wall before the rightcoronary valve and not from the ostium of the right coro-nary. However, some patients can possibly suffer from anabnormal ostium of the right coronary. Therefore, coro-nary angiography should be conducted before ablation toensure the link of the location between the target site andthe coronary. The discussed mapping methods most im-portantly consider the origin of the PVC/VT. Further, theoccurrence feature of PVCs/VTs during operation canaffect the selected mapping method. For patients withmore PVCs during operation, the combination of “activa-tion sequence mapping” and “pace mapping” results in amore rapid and accurate method in finding the target site.“Activation sequence mapping” is firstly selected for pri-mary confirmation of the first areas of ventricular activa-tion. Careful mapping on the location is then performedthrough “pace mapping.” For patients with less PVC duringoperation, the common way to locate an ideal target site isto use “pace mapping” in the original area predicted by sur-face ECG. Ablation is difficult during frequent occurrenceof PVCs after the location is mapped by electrophysiologyexamination. Ablation should be discontinued if the PVC/VT is not terminated within 10 s during discharge. Other-wise, mapping should be performed again.In addition, PVCs/VTs that are less than 0.5 cm away
from the left main coronary artery or ostium of the maincoronary artery should not be ablated as the tunica intimain coronary arteries can be injured by ablation, whichwould result in acute embolism formation and acute myo-cardial infarction [9,10].
ConclusionsPVC that originates from LVOT is not uncommon. Mostpatients can safely and effectively apply mapping and abla-tion through routine mapping and catheter ablation withgeneral temperature control through the aortic reversalpath. Some differences in the 12-lead ECG of the LVOTwith different origins are observed. Therefore, familiaritywith these features is essential to determine initially pos-sible effective target sites, to shorten the operation time,and to reduce X-ray exposure prior to operation.
Competing interestsThe authors declare that they have no competing interests.
Authors’ contributionsLJF and GB designed the entire study, LJF, GB, JKT, LJ, LYC and YRPperformed the experiments, LJF, GB and YHG wrote the paper. All authorsread and approved the final manuscript.
AcknowledgementThis work is supported by the Wenzhou Municipal Science and TechnologyCommission, China (Grant No. Y2008086).
Author details1Department of Cardiology, Second Affiliated Hospital of WenzhouMedical College, 109 Xueyuan Road, Wenzhou, Zhejiang, China.2Department of Hematology, First Affiliated Hospital of Wenzhou MedicalCollege, Wenzhou, China.
Received: 15 June 2012 Accepted: 20 November 2012Published: 27 November 2012
References1. Ouyang F, Fotuhi P, Ho SY, Hebe J, Volkmer M, Goya M, et al: Repetitive
monomorphic ventricular tachycardia originating from the aortic sinuscusp: electrocardiographic characterization for guiding catheter ablation.J Am Coll Cardiol 2002, 39(3):500–508.
2. Yoshida N, Inden Y, Uchikawa T, Kamiya H, Kitamura K, Shimano M, et al:Novel transitional zone index allows more accurate differentiationbetween idiopathic right ventricular outflow tract and aortic sinus cuspventricular arrhythmias. Heart Rhythm Off J Heart Rhythm Soc 2011,8(3):349–356.
3. Jin-jun L, Cong-Xin H, Bo Y, Hong J, Qi-Zhu T, Xiu-Juan L, et al: Clinicalevaluation of radiofrequency catheter ablation for premature ventricularcontractions. Chin J Card Arrhyth 2005, 9(5):337–340.
4. Callans DJ, Menz V, Schwartzman D, Gottlieb CD, Marchlinski FE: Repetitivemonomorphic tachycardia from the left ventricular outflow tract:electrocardiographic patterns consistent with a left ventricular site oforigin. J Am Coll Cardiol 1997, 29(5):1023–1027.
5. Shimoike E, Ohba Y, Yanagi N, Hiramatsu SI, Ueda N, Maruyama T, et al:Radiofrequency catheter ablation of left ventricular outflow tracttachycardia: report of two cases. J Cardiovasc Electrophysiol 1998,9(2):196–202.
6. Yeh SJ, Wen MS, Wang CC, Lin FC, Wu D: Adenosine-sensitive ventriculartachycardia from the anterobasal left ventricle. J Am Coll Cardiol 1997,30(5):1339–1345.
7. Tada H, Nogami A, Naito S, Fukazawa H, Horie Y, Kubota S, et al: Leftventricular epicardial outflow tract tachycardia: a new distinct subgroupof outflow tract tachycardia. Jpn Circ J 2001, 65(8):723–730.
8. Betensky BP, Park RE, Marchlinski FE, Hutchinson MD, Garcia FC, Dixit S, et al:The V(2) transition ratio: a new electrocardiographic criterion fordistinguishing left from right ventricular outflow tract tachycardia origin.J Am Coll Cardiol 2011, 57(22):2255–2262.
9. Jian M, Fang-Zheng W, Pei-Zhen Y, Jin-Zhi W, Kui-Jun Z, Wei H, et al:Radiofrequency catheter ablation of nonsustained ventriculartachycardia and frequent ventricular premature contractions from leftventricular outflow tract. Chin J Card Arrhyth 1999, 2(3):126–129.
10. Ping-Zhen Y, Shu-Lin W, Chun-Bo C, Xian-Zhang Z, Hai-Jie L, Yu-Mei X, et al:Electrocardiographic characteristics and radiofrequency catheterablation of ventricular tachycardia and ventricular prematurecontractions originating from the Aortic cusp. Chin J Card PacingElectrophysiol 2005, 5(19):338–340.
doi:10.1186/1471-2261-12-112Cite this article as: Ge et al.: Electrocardiogram features of prematureventricular contractions/ventricular tachycardia originating from the leftventricular outflow tract and the treatment outcome of radiofrequencycatheter ablation. BMC Cardiovascular Disorders 2012 12:112.