electro-osmotic dewatering of sewage sludge: preliminary results · 2017-11-06 · act. sludge...
TRANSCRIPT
1
Electro-osmotic Dewatering of Sewage
Sludge: Preliminary Results
S. Visigalli, P. Gronchi, A. Turolla, A. Brenna, C. Colominas, G. G. Fuentes, R. Canziani

2Roberto CANZIANI 2/29
OBJECTIVES:
Achieving at least 40% dry solids (DS) instead of 20% would
halve wet sludge disposal
allow self-sustained combustion at 850 °C, avoiding thermaldrying (which would consume more energy)
QUESTIONS:
Can we reach at least 40% DS with EDW?
Do the lower disposal costs compensate the energy cost ofEDW?
AIM OF THE STUDY
3Roberto CANZIANI 3/29
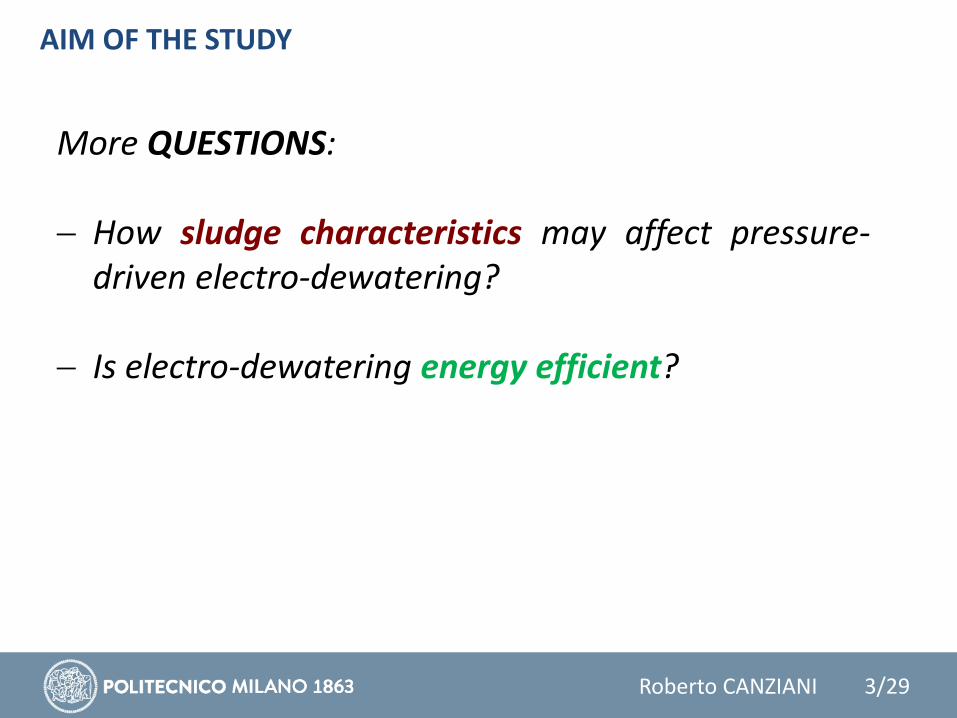
More QUESTIONS:
How sludge characteristics may affect pressure-driven electro-dewatering?
Is electro-dewatering energy efficient?
AIM OF THE STUDY

4Roberto CANZIANI 4/29
source: Mahmoud et al.. 2010. Wat. Res. 44 (8). 2381. modif.
𝑣𝑒𝑝 = 𝛾𝜀0𝜀𝑟𝜁𝐸
𝜂𝑑 ത𝑉
𝑑𝑡=𝜀0𝜀𝑟 𝜁
𝜂𝐸𝐴
electrochemical reactions
pressurepressure
ELECTRO-OSMOSIS DEWATERING OF SLUDGE

5Roberto CANZIANI 5/29
STATIC PISTON
– Cylindrical glass vessel (h=176 mm, Ø=80 mm)– Cooling water-jacket– Compressed air system (1-4.5 bar)– Double effect cylinder (200 mm stroke) SMC-CP96
– DC power supply (30 V-5 A)– Anode: DSA – Ti MMO– Cathode: stainless steel mesh (AISI 304)– Cloth: PTT (polytrimethyleneterephthalate)
LAB-SCALE DEVICE

6Roberto CANZIANI 6/29
EXPERIMENTAL CONDITIONS
Two steps for EDW tests:
filtration + compression (p = 300 kPa ): tP = 5 min
filtration + compression + electric fieldat 15 V/cm (p = 300 kPa): tE = 15-20 min
________________________________________________
Total duration of the test tT = 20-25 min

7Roberto CANZIANI 7/29
SLUDGE SAMPLES – 1
ParameterWWTP 1 - Activated sludge +
+ Aerobic stabilisation
Sample no. 1-A 1-B 1-C
pH 6.9 7.2 7.0
Conductivity (mS/cm) 1.1 1.7 1.7
DSo (%) 2.8 3.0 3.4
VS/DS (%) 69.7 73.1 68.3
CST (s)UC 22.1 34.0 27.0
CT - 11.7 12.0
TTF (min)UC 14.0 25.0 21.0
CT - 3.0 5.0
Zeta potential (mV)UC -13.1 -13.2 -13.2
CT - -9.9 -9.5
Turbidity (NTU) UC 80.4 - -
Polyelectrolyte dose (g/kgDS) - 5.7 5.1
Average DSDW WWTP 2013 – 2014 (%) after belt - press: 17 – 18%
8Roberto CANZIANI 8/29
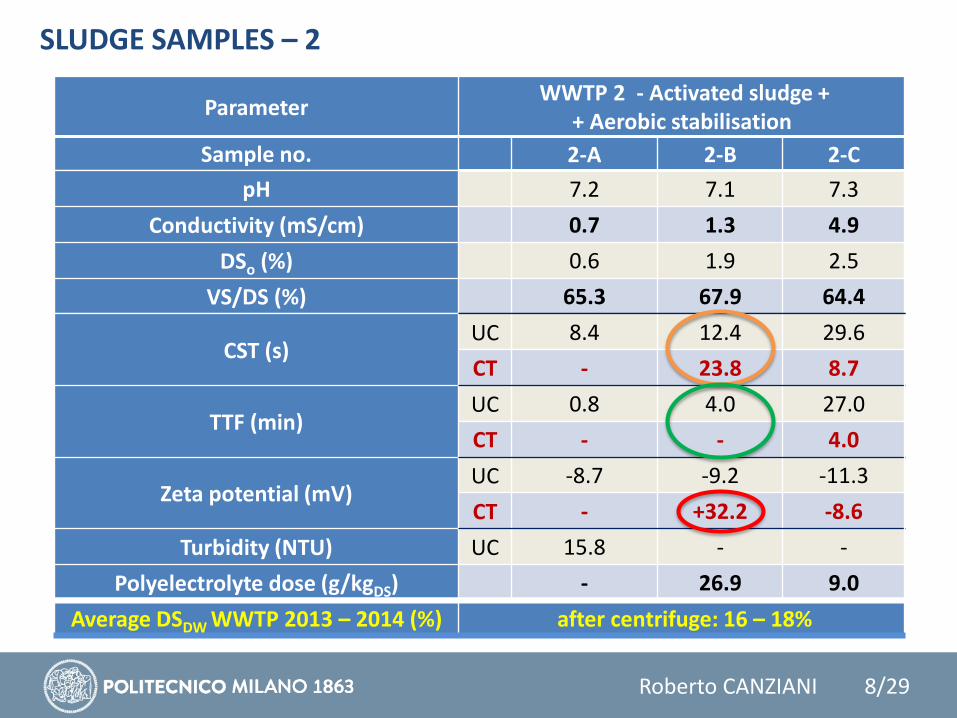
SLUDGE SAMPLES – 2
ParameterWWTP 2 - Activated sludge +
+ Aerobic stabilisation
Sample no. 2-A 2-B 2-C
pH 7.2 7.1 7.3
Conductivity (mS/cm) 0.7 1.3 4.9
DSo (%) 0.6 1.9 2.5
VS/DS (%) 65.3 67.9 64.4
CST (s)UC 8.4 12.4 29.6
CT - 23.8 8.7
TTF (min)UC 0.8 4.0 27.0
CT - - 4.0
Zeta potential (mV)UC -8.7 -9.2 -11.3
CT - +32.2 -8.6
Turbidity (NTU) UC 15.8 - -
Polyelectrolyte dose (g/kgDS) - 26.9 9.0
Average DSDW WWTP 2013 – 2014 (%) after centrifuge: 16 – 18%

9Roberto CANZIANI 9/29
SLUDGE SAMPLES – 3
ParameterWWTP 3 - MBR sludge + + Aerobic stabilisation
Sample no. 3-A 3-B 3-C
pH 7.1 7.0 6.9
Conductivity (mS/cm) 0.8 1.0 1.2
DSo (%) 1.9 1.4 2.2
VS/DS (%) 74.3 74.0 75.4
CST (s)UC 11.2 11.8 -
CT - 12.0 6.7
TTF (min)UC 4.0 6.0 -
CT - - 2.0
Zeta potential (mV)UC -11.6 -13.3 -
CT - +2.5 -9.1
Turbidity (NTU) UC 45.6 - -
Polyelectrolyte dose (g/kgDS) n.a. 9.0 n.a.
Average DSDW WWTP 2013 – 2014 (%) after belt - press: 16 – 18%

10Roberto CANZIANI 10/29
SLUDGE SAMPLES – 4
ParameterWWTP 4 - Activated sludge +
+ Anaerobic stabilisation
Sample no. 4-A 4-B 4-C
pH 7.1 7.2 7.1
Conductivity (mS/cm) 3.9 4.3 4.6
DSo (%) 2.8 3.0 3.2
VS/DS (%) 59.5 66.0 63.9
CST (s)UC 89.6 129.0 101.7
CT - 58.0 27.2
TTF (min)UC 88.0 91.0 96.0
CT - 53.0 16.0
Zeta potential (mV)UC -13.8 -15.2 -14.1
CT - -11.8 -12.1
Turbidity (NTU) UC 220.0 - -
Polyelectrolyte dose (g/kgDS) - 20.0 9.0
Average DSDW WWTP 2013 – 2014 (%) after centrifuge: 25 – 26%
11Roberto CANZIANI 11/29
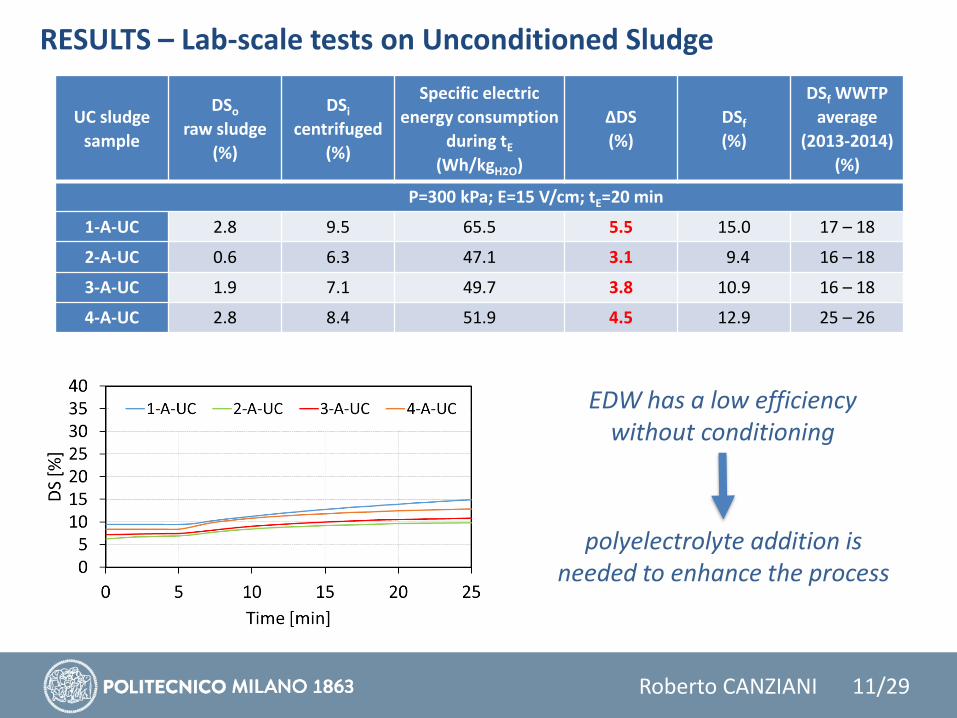
RESULTS – Lab-scale tests on Unconditioned Sludge
EDW has a low efficiency without conditioning
UC sludge
sample
DSo
raw sludge
(%)
DSi
centrifuged
(%)
Specific electric
energy consumption
during tE
(Wh/kgH2O)
ΔDS
(%)
DSf
(%)
DSf WWTP
average
(2013-2014)
(%)
P=300 kPa; E=15 V/cm; tE=20 min
1-A-UC 2.8 9.5 65.5 5.5 15.0 17 – 18
2-A-UC 0.6 6.3 47.1 3.1 9.4 16 – 18
3-A-UC 1.9 7.1 49.7 3.8 10.9 16 – 18
4-A-UC 2.8 8.4 51.9 4.5 12.9 25 – 26
polyelectrolyte addition is needed to enhance the process

12Roberto CANZIANI 12/29
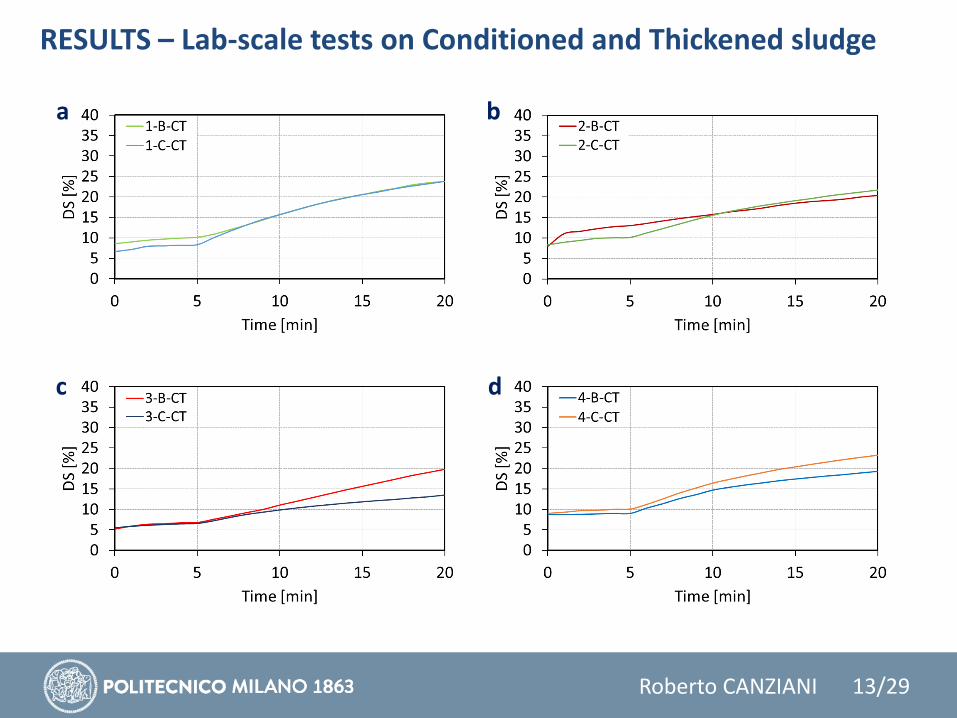
RESULTS –Lab-scale tests on Conditioned and Thickened sludge
CT sludge
sample
DSo
raw sludge
(%)
DSi
centrifuged
(%)
Specific electric
energy consumption
during tE
(Wh/kgH2O)
ΔDS
(%)
DSf
(%)
DSf WWTP
average
(2013-2014)
(%)
P=300 kPa; E=15 V/cm; tE=15 min
1-B-CT 3.0 8.6 48.3 15.2 23.817 – 18
1-C-CT 3.4 6.6 45.9 17.2 23.8
2-B-CT 1.9 8.0 69.6 12.4 20.416 – 18
2-C-CT 2.5 8.3 82.1 13.4 21.7
3-B-CT 1.4 5.2 58.5 14.6 19.816 – 18
3-C-CT 2.2 5.5 45.7 8.0 13.5
4-B-CT 3.0 8.6 74.7 10.6 19.225 – 26
4-C-CT 3.2 9.0 76.0 14.3 23.3
Polyelectrolyte dosage was too low to have a good EDW efficiency (MBR
sludge)
Best results in terms of ΔDS and specific energy consumption
13Roberto CANZIANI 13/29
RESULTS – Lab-scale tests on Conditioned and Thickened sludge
a b
c d

14Roberto CANZIANI 14/29
RESULTS – Lab-scale tests on Mechanically Dewatered sludge
DW sludge
sampleTreatment
DSi
(%)
Specific electric
energy
consumption
during tE
(Wh/kgH2O)
ΔDS
(%)
DSf
(%)
DSf WWTP
average
(2013-
2014)
(%)
P=300 kPa; E=15 V/cm; tE=15 min
1-B-DW Act. sludge
Aer. st.
Belt press
16.0 83.2 13.8 29.817 – 18
1-C-DW 16.6 83.7 11.0 27.7
2-B-DW Act. sludge
Aer. st.
Centrifuge
20.5 108.9 6.8 27.316 – 18
2-C-DW 18.1 95.4 9.5 27.6
3-B-DW MBR
Aer. st.
Belt press
16.0 90.1 9.1 25.116 – 18
3-C-DW 15.6 95.2 10.7 26.3
4-C-DW
Act. sludge
Anaer. dig.
Centrifuge21.8 99.7 14.7 36.5 25 – 26
highest DS increaselowest DS increasehighest energy consumption

15Roberto CANZIANI 15/29
RESULTS – Lab-scale tests on Mechanically Dewatered sludge
a b
c d
Water removal is still increasing at the end of the tests: longer test would lead to higher final DS
16Roberto CANZIANI 16/29
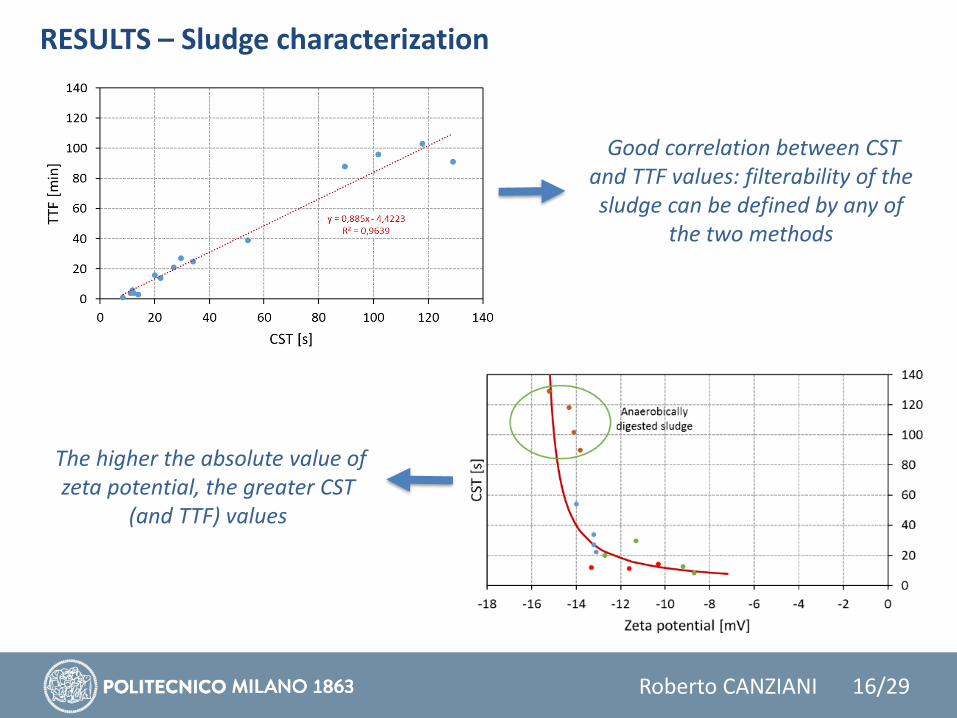
RESULTS – Sludge characterization
Good correlation between CST and TTF values: filterability of the sludge can be defined by any of
the two methods
The higher the absolute value of zeta potential, the greater CST
(and TTF) values

17Roberto CANZIANI 17/29
RESULTS – Sludge characterization
a b
• No correlation exists between CST and DSf or ΔDS (the same applies for TTF).
• A lab-scale EDW device would give better predictions.
• Mechanical dewatering and electro-dewatering efficiency may depend more on VS/DS ratio, conductivity and initial DS content, rather than CST and TTF.
18Roberto CANZIANI 18/29
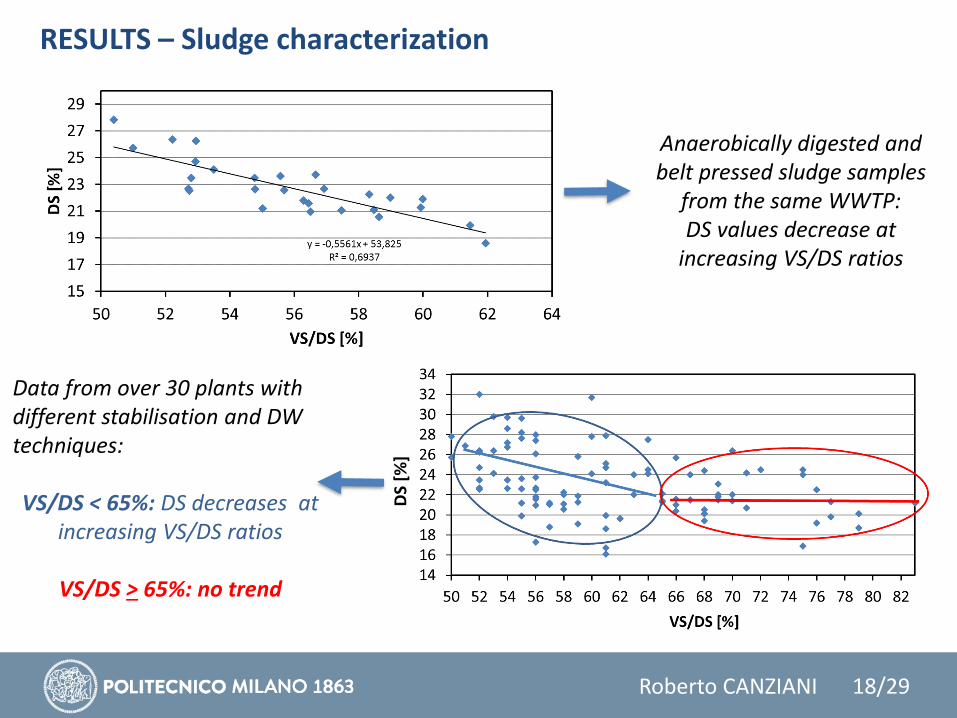
RESULTS – Sludge characterization
DS
[%]
Data from over 30 plants with different stabilisation and DW techniques:
VS/DS < 65%: DS decreases at increasing VS/DS ratios
VS/DS > 65%: no trend
Anaerobically digested and belt pressed sludge samples
from the same WWTP:DS values decrease at
increasing VS/DS ratios
19Roberto CANZIANI 19/29
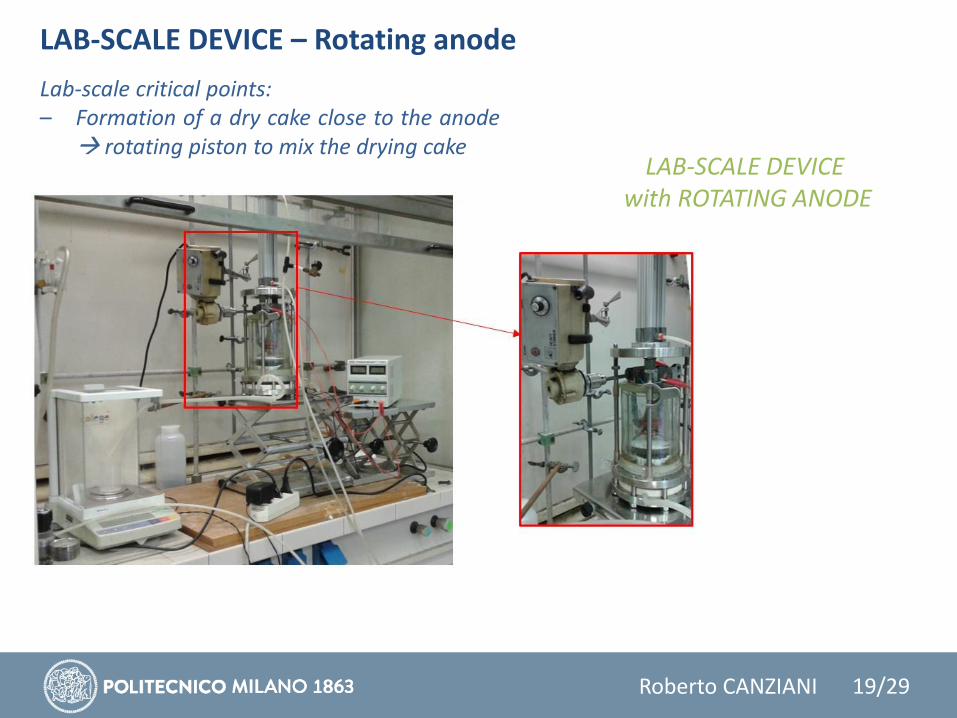
Lab-scale critical points:– Formation of a dry cake close to the anode
rotating piston to mix the drying cakeLAB-SCALE DEVICE
with ROTATING ANODE
LAB-SCALE DEVICE – Rotating anode

20Roberto CANZIANI 20/29
EXPERIMENTAL CONDITIONS
EDW tests with rotating anode
on mechanically dewatered sludge
samples “D” from the same four WWTPs
20 mm-thick sample
compression (300 kPa) + electric field (15 V/cm)
rotation 10 rpm
t = 20 min

21Roberto CANZIANI 21/29
SLUDGE SAMPLES – Characterisation of CT sludge (samples «D»)
Parameter WWTP
Sample no. 1-D 2-D 3-D 4-D
pH 6.9 6.8 6.9 7.1
Conductivity (mS/cm) 0.8 0.8 1.5 3.2
DSo (%) 2.5 1.9 1.9 4.3
VS/DS (%) 61.8 64.8 72.6 55.0
CST (s) 9.0 9.1 12.1 42.0
TTF (min) 1.5 2.1 NA 34.0
Zeta potential (mV) -11.0 -10.7 +16.0 -11.8
Polyelectrolyte dose (g/kgDS) 6.9 9.0 9.0 9.0
Overdose of polyelectrolyte: – zeta potential was positive – TTF could not be measured (filter paper broke)

22Roberto CANZIANI 22/29
RESULTS – Rotating anode compared with static anode tests
DW sludge
samples D
from 4
WWTPs
DSi
(%)
Specific electric
energy consumption
(Wh/kgH2O)
ΔDS
(%)
DSf
(%)
ΔDSf
(rotating -
static)
(%)
118.4
133.6 7.0 25.4+17.5
1 ROT 141.6 23.7 42.9
221.7
117.2 12.5 34.2+2.9
2 ROT 116.6 15.4 37.1
315.0
119.3 14.3 29.3+2.8
3-ROT 134.9 17.1 32.1
423.8
111.1 19.5 43.3+9.2
4-ROT 171.5 27.3 52.5
– Specific energy consumption of dynamic tests (rotating anode) is generally slightly higher, BUT
– We got a significant DSf increase with the rotating anode

23Roberto CANZIANI 23/29
a
RESULTS – Rotating anode
b
c d
1-D-DW
1-D-DW-rot
2-D-DW
2-D-DW-rot
3-D-DW
3-D-DW-rot4-D-DW
4-D-DW-rot

24Roberto CANZIANI 24/29
Patent WO 2011/161568 A1(Stradi et al. 2011)
EDW screw press prototype
25Roberto CANZIANI 25/29
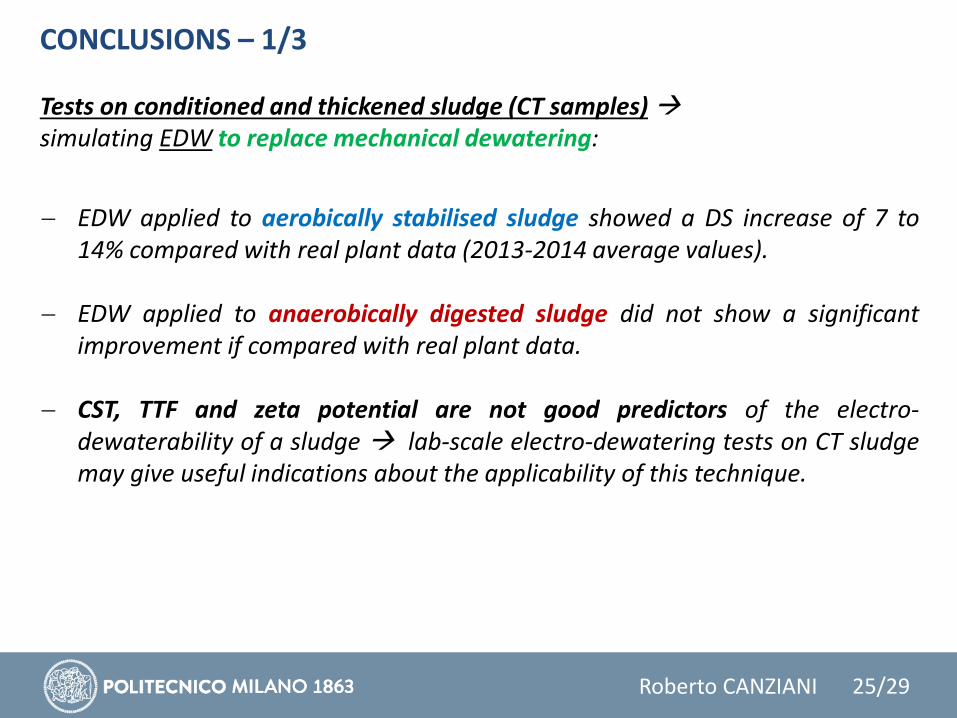
Tests on conditioned and thickened sludge (CT samples)simulating EDW to replace mechanical dewatering:
EDW applied to aerobically stabilised sludge showed a DS increase of 7 to14% compared with real plant data (2013-2014 average values).
EDW applied to anaerobically digested sludge did not show a significantimprovement if compared with real plant data.
CST, TTF and zeta potential are not good predictors of the electro-dewaterability of a sludge lab-scale electro-dewatering tests on CT sludgemay give useful indications about the applicability of this technique.
CONCLUSIONS – 1/3

26Roberto CANZIANI 26/29
Tests on conditioned and dewatered samples (DW)Simulating application of EDW after mechanical dewatering:
IN GENERAL with or without EDW, sludge with VS/DS < 65% can be dewateredbetter than sludge with VS/DS > 65%.
EDW of anaerobically digested DW sludge is more efficient than EDW ofaerobically stabilised DW sludge (typically DS = 12-15% compared to 8-10%)
EDW allows to get DS = 40% with tE = 20 min for anaerobically stabilisedsludge and tE > 30 min for aerobically stabilised sludge.
Electric energy consumption to get DS=10.7% ± 2.7% of DW sludge was 94.0± 9.1 Wh/kgH2O, less than 1/4 of the equivalent primary energy for thermaldrying, (Italian national factor of 0.47 kWhel/kWhth).
CONCLUSIONS – 2/3

27Roberto CANZIANI 27/29
Tests with ROTATING ANODE on DW sludge:
Rotating anode
• improves sludge mixing during the tests,
• delays the increase of electric resistance
• prevents the rising of temperature by Joule effect
• increases current densities improving water removal andleading to higher final DS values (3 to 17% higher than staticanode tests).
Specific primary energy consumption is 50 to 70% lower than inconventional thermal treatments.
Future work: improve the lab-scale device and build theprototype
CONCLUSIONS – 3/3
28Roberto CANZIANI 28/29
The LIFE14 project no. ENV/IT/000039 “ELECTRO-SLUDGE” has been partly funded with the contribution of the LIFE Programme of the European Unionwww.electrosludge.eu/ (under construction)
Sludgetreat Project no. 611593, co-funded by the European Commission within FP7 (2007–2013) Marie Curie Actions— Industry-Academia Partnerships and Pathways (IAPP)http://cordis.europa.eu/project/rcn/191799_it.htmlwww.sludgetreat.eu (under construction)
Partners:- AST (Modena, I)- Politecnico di Milano (I)- CAP Holding S.p.A. (Milano, I)
Partners:- AST (Modena, I)- Politecnico di Milano (I)- Flubetech (Barcelona, E)- AIN (Pamplona, E)
ACKNOWLEDGEMENTS

29Roberto CANZIANI 29/29
Thank you for your attention
Any questions?