electro kinetic phenomena - damtp · electro osmosis of counter ions surfaces i.e. particles are...
TRANSCRIPT

11/16/2012
1
http://www.damtp.cam.ac.uk/user/gold/teaching_biophysicsIII.html
Electro kinetic Phenomena
• Electro-osmosis
• Electrophoresis
• Gel electrophoresis, polymer dynamics in gels
http://www.damtp.cam.ac.uk/user/gold/teaching_biophysicsIII.html
Diffuse layer
Counter ions
Stern Layer
Outer Helmholtz layer
Pote
ntial
a diameter of hydrated counter ions
is the potential
Electric Double Layer
In aqueous solutions we have to deal with a situations where everything is usually charged. Not only the surface (proteins, metal or other surface) but also the water is charged at pH=7 due to the dissociation of water into H3O+ and OH-. The Coulomb interaction then gives rise to a structure of ions close to any charged surface known as the electric double layer. We will now discuss the origin and consequences of this important element for any polymer or biological molecule in solution.

11/16/2012
2
http://www.damtp.cam.ac.uk/user/gold/teaching_biophysicsIII.html
Full Electric Double Layer
Water molecules
Hydrated counter
ions in double layer
Adsorbed ions (vdW)
Partly dehydrated
Water molecules with aligned dipoles
Water molecules with aligned dipoles
Outer Helmholtz Layer
Inner Helmholtz Layer
One of the complications of the structure of the double layer is the complex structure of the polar water molecules which usually form a hydration shell around the ions in solution. However in close proximity to the surface other factors like the van der Waals hydrophic or even chemical interactions can give rise to a complex structure of the double layer. Although this is beyond the scope of this course it is useful to remember that in a realistic situation the exact structure of the electric double layer will be determined by all these interactions. The ions closest or adsorbed on the surface are often regarded as bound, however they are still in equilibrium with the surrounding medium.
http://www.damtp.cam.ac.uk/user/gold/teaching_biophysicsIII.html
Electrokinetic Effects
Counter ions
Charged colloid
Electrophoresis
Adsorbed ions
Movement due to
electrophoresis
Electro osmosis of
counter ions
Surfaces i.e. particles are usually charged in aqueous solutions. We will now discuss two closely related phonemona, electrophoresis and electro-osmosis, which are given rise by applying an electric field to the system. We will start with a discussion of electrophoresis as it is perhaps the more intuitive electrokinetic phenomenon.

11/16/2012
3
http://www.damtp.cam.ac.uk/user/gold/teaching_biophysicsIII.html
Optical Tweezers: Single particle electrophoresis In order to study the electrophoretic mobility, of a single particle, optical tweezers are ideal candidates as they not only allow to follow the movement of the particle in the elecric field but also can determine the forces acting on the particle. This is a unique feature allowing for a complete understanding of the system.
Otto (2008)
Here, we will more discuss an experimental realization that uses several of the approaches we discussed earlier in the course. The position of the particle will be monitored by single particle tracking with video microscopy, while the forces are determined by analysis of the power spectrum. The main trick employed here is to move the particle with an alternating field allowing to determine the motion of the particle even when the amplitude is smaller than Brownian fluctuations.
http://www.damtp.cam.ac.uk/user/gold/teaching_biophysicsIII.html
Microfluidic Cell Design * To make interpretation of the experimental results straight forward it is worth to discuss and rationalize the experimental geometry. We want to examine and determine the mobility in a homogeneous electric field of known magnitude. This can be achieved in practice by designing a long and relatively thin channel connecting two fluidic reservoirs on either end. A schematic is shown in the circle on the left. The advantage of this geometry is that we can easily calculate the electric field distribution.
In the extreme case of a very long channel we would expect that the applied voltage U over the channel leads to an electric field E given by
Where l is the length of the channel. Here we assume that the material surrounding the channels does not have a finite dielectric constant and ignore entrance effect.
UE
l

11/16/2012
4
http://www.damtp.cam.ac.uk/user/gold/teaching_biophysicsIII.html
Fluidic Cell Design – Field Distribution *
• Get homogeneous electric field E distribution and E is easily calculated
• Long channel connecting two reservoirs with electrodes
Using numerical simulations we can test our simple description. After applying a voltage U and calculating the electric field distribution in this channel with an aspect ration of 100, we find that the electric field is close to the expected value of E=4.2 V/cm. The main deviation is due to the electic field extending into the channel at the entrance.
http://www.damtp.cam.ac.uk/user/gold/teaching_biophysicsIII.html
Oscillation of charged particle in AC-field
For a typical measurement, the particle is subject to an electric field with applied voltages of up to 60 V. One annoying complication of these high voltages is the electrochemical decomposition of water into H2 and O2 at the electrodes. However, over short time scales (few seconds) the oscillatory motion of the particle due to the electrophoretic force can be detected giving rise to a nice oscillation. The Brownian fluctuations of the particle in the trap are readily visible even at these relatively high forces. We can detect forces around 1-2 pN easily.
The decomposition of water limits the applicability of high voltages in this type of measurement. One solution is to use again the frequency analysis using the Fourier transforms we discussed earlier in the context of force calibration.

11/16/2012
5
http://www.damtp.cam.ac.uk/user/gold/teaching_biophysicsIII.html
Electrophoretic Force depends linearly on Voltage
With this simple approach we can easily detect 50 femto Newton forces on the particles. One obvious expectation would be that the maximum force should depend linearly on the applied voltage (electric field) and this is exactly what we find. The reason for the high resolution despite the considerable Brownian fluctuations is that we average over many periods in our signal and thus see even smallest amplitudes in the amplitude spectrum.
Otto (2008)
http://www.damtp.cam.ac.uk/user/gold/teaching_biophysicsIII.html
Charge Inversion is Possible *
Another important parameter that we can get from this type of measurement is the sign of the charge of the particle. The phase of the motion with respect to the AC filed tells out the apparent charge of the particle. If we add highly charged ions to the solution we observe at certain concenratuions a reversal of the particle charge from being negative, as expected, to positive. This is known as charge inversion and is relevant for problems like DNA packing and condensation in viruses and even in cells.
La3+
12-
3+
3+
3+ 3+
3+
Particle can appear as oppositely charged

11/16/2012
6
http://www.damtp.cam.ac.uk/user/gold/teaching_biophysicsIII.html
EOF: Visualization of electro-osmotic flow
http://microfluidics.stanford.edu/Projects/Archive/caged.htm
Electro Osmotic Flow Pressure Driven Flow
http://www.damtp.cam.ac.uk/user/gold/teaching_biophysicsIII.html
Practical application: Gel Electrophoresis
After discussing electro kinetic effects briefly, we will now introduce gel electrophoresis. This is one of the most important techniques for the characterization of biomolecules (proteins, DNA, RNA) that is based on electrophoretic movement of polymers in a matrix of virtually uncharged molecules forming a gel. The main purpose is to sort molecules by their molecular weight employing their charge. Due to the presence of the gel we do not have to take into account complications arising from electro-osmotic flows as the gels fibers effectively stop any major fluid flows in the system.
http://Wikipedia.org http://www-che.syr.edu/faculty/boddy_group/pages/electrophoresis.jpg
11/16/2012
7
http://www.damtp.cam.ac.uk/user/gold/teaching_biophysicsIII.html
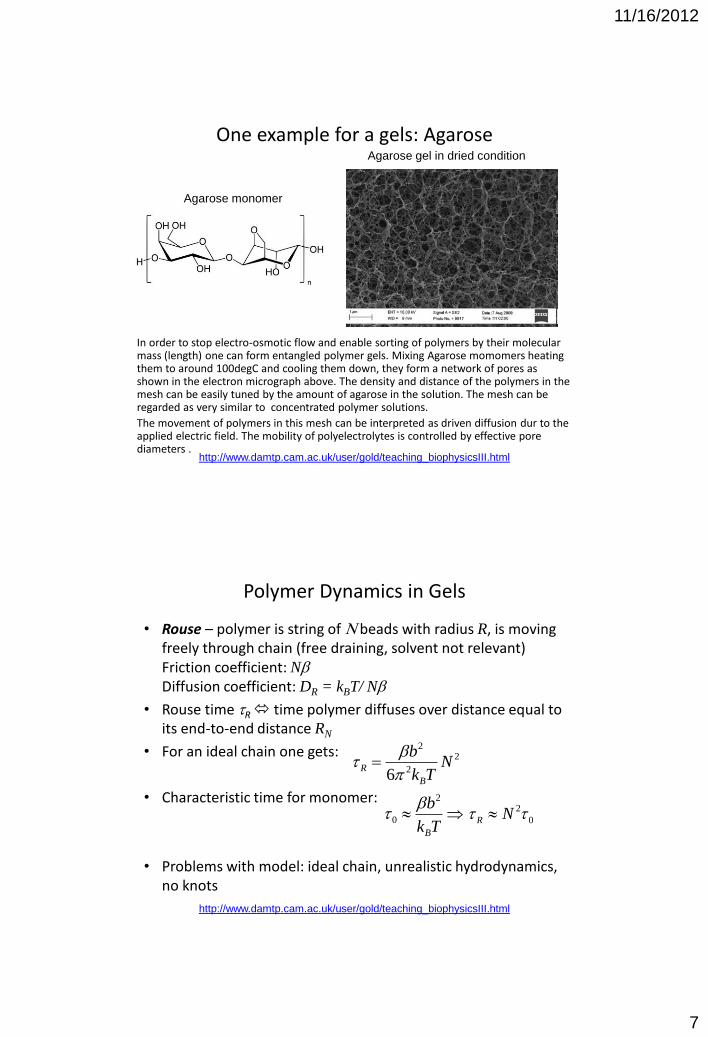
One example for a gels: Agarose
In order to stop electro-osmotic flow and enable sorting of polymers by their molecular mass (length) one can form entangled polymer gels. Mixing Agarose momomers heating them to around 100degC and cooling them down, they form a network of pores as shown in the electron micrograph above. The density and distance of the polymers in the mesh can be easily tuned by the amount of agarose in the solution. The mesh can be regarded as very similar to concentrated polymer solutions.
The movement of polymers in this mesh can be interpreted as driven diffusion dur to the applied electric field. The mobility of polyelectrolytes is controlled by effective pore diameters .
Agarose monomer
Agarose gel in dried condition
http://www.damtp.cam.ac.uk/user/gold/teaching_biophysicsIII.html
Polymer Dynamics in Gels
• Rouse – polymer is string of N beads with radius R, is moving freely through chain (free draining, solvent not relevant) Friction coefficient: Nb Diffusion coefficient: DR = kBT/ Nb
• Rouse time tR time polymer diffuses over distance equal to its end-to-end distance RN
• For an ideal chain one gets:
• Characteristic time for monomer:
• Problems with model: ideal chain, unrealistic hydrodynamics, no knots
2
2
2
6N
Tk
b
B
R
bt
Tk
b
B
2
0
bt 2
0R Nt t

11/16/2012
8
http://www.damtp.cam.ac.uk/user/gold/teaching_biophysicsIII.html
Polymer Dynamics
• Zimm – similar to Rouse model but solvent moves with chain (no slip on chain) so we have now typical size of segments r and viscosity of solvent h Stokes friction: Diffusion coefficient:
• Exponent n is depending on chain, n=0.5 ideal, n=0.5883/5 self avoiding chain (Flory exponent– see Cicuta Soft matter course)
• Zimm relaxation time tZ :
• Main difference to Rouse is the weaker dependence on N
nn thh
t 3
0
33
32
NNTk
bR
TkD
R
BBZ
Z
rhb
nhh bN
Tk
R
TkD BB
Z
http://www.damtp.cam.ac.uk/user/gold/teaching_biophysicsIII.html
Polymer Dynamics
with Npp
Np ,..,2,1
2
0
tt
• Sub-chains behave in the same way as the entire chain
• There are N relaxation modes of the chain
• Mean square displacement of a segment with p monomers:
• Mean square displacement of a monomer in chain with N >>1 for times t < tR
11/16/2012
9
http://www.damtp.cam.ac.uk/user/gold/teaching_biophysicsIII.html
Polymer Dynamics
• Now compare to free diffusion (Fick)
• Conclusion: Rouse mean-square displacement is sub-diffusive
• With Zimm model we get a slightly different answer in the exponent:
http://www.damtp.cam.ac.uk/user/gold/teaching_biophysicsIII.html
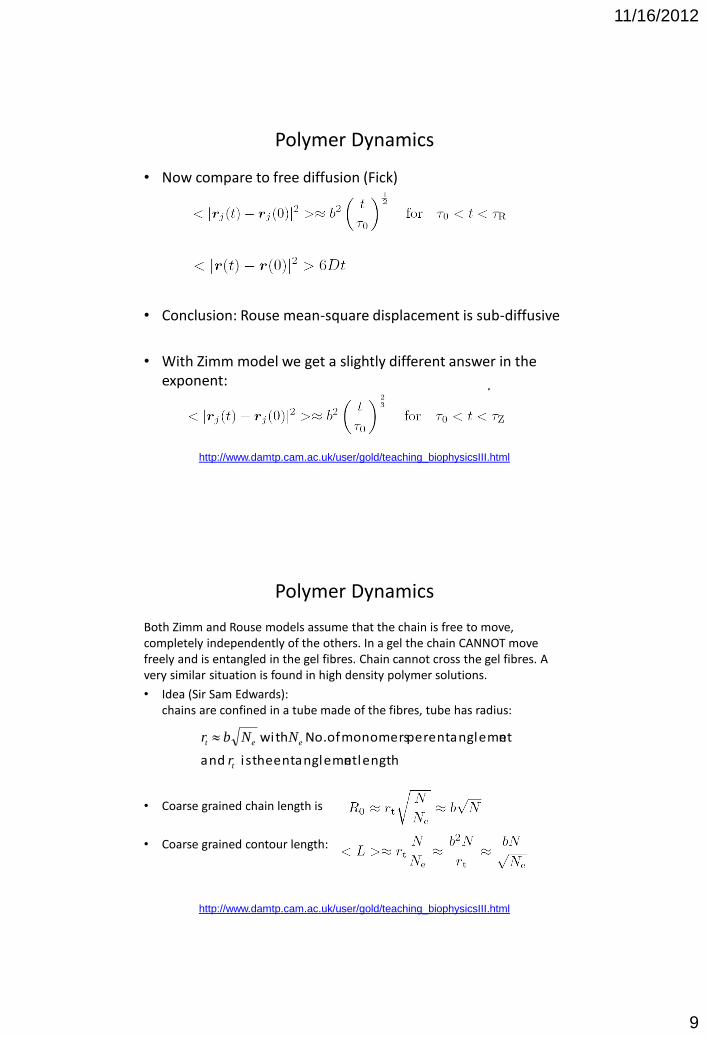
Both Zimm and Rouse models assume that the chain is free to move, completely independently of the others. In a gel the chain CANNOT move freely and is entangled in the gel fibres. Chain cannot cross the gel fibres. A very similar situation is found in high density polymer solutions.
• Idea (Sir Sam Edwards): chains are confined in a tube made of the fibres, tube has radius:
• Coarse grained chain length is
• Coarse grained contour length:
Polymer Dynamics
length ntentangleme the is and
ntentangleme per monomersof No. with
t
eet
r
NNbr

11/16/2012
10
http://www.damtp.cam.ac.uk/user/gold/teaching_biophysicsIII.html
Polymer Dynamics
length ntentangleme the is and
ntentangleme per monomersof No. with
t
eet
r
NNbr
• Simplified picture in gel:
L, contour length
R0, contour length in Edwards tube
2rt
http://www.damtp.cam.ac.uk/user/gold/teaching_biophysicsIII.html
Diffusion in Tube: “Reptation”
We can now use the models we discussed before to understand the diffusion in the gel. The diffusion coefficient in the tube is just Rouse DR =DC = kBT/ Nb
The reptation time is the time to diffuse along complete tube length
The lower time limit for reptation is given for Rouse mode N=Ne
b b
22
e
B
e NTk
bbt

11/16/2012
11
http://www.damtp.cam.ac.uk/user/gold/teaching_biophysicsIII.html
1. For t < te, Rouse diffusion:
2. For te < t < tR, motion confined in tube displacement only along the tube, this is slower than unrestricted Rouse motion (as expected) Tube itself is a random walk
Timescales in Gels
http://www.damtp.cam.ac.uk/user/gold/teaching_biophysicsIII.html
Timescales in Gels
3. For tR < t < trep, motion of all segments is correlated, polymer diffuses along the tube Random walk of tube is now
4. For t > trep, free diffusion is recovered
11/16/2012
12
http://www.damtp.cam.ac.uk/user/gold/teaching_biophysicsIII.html
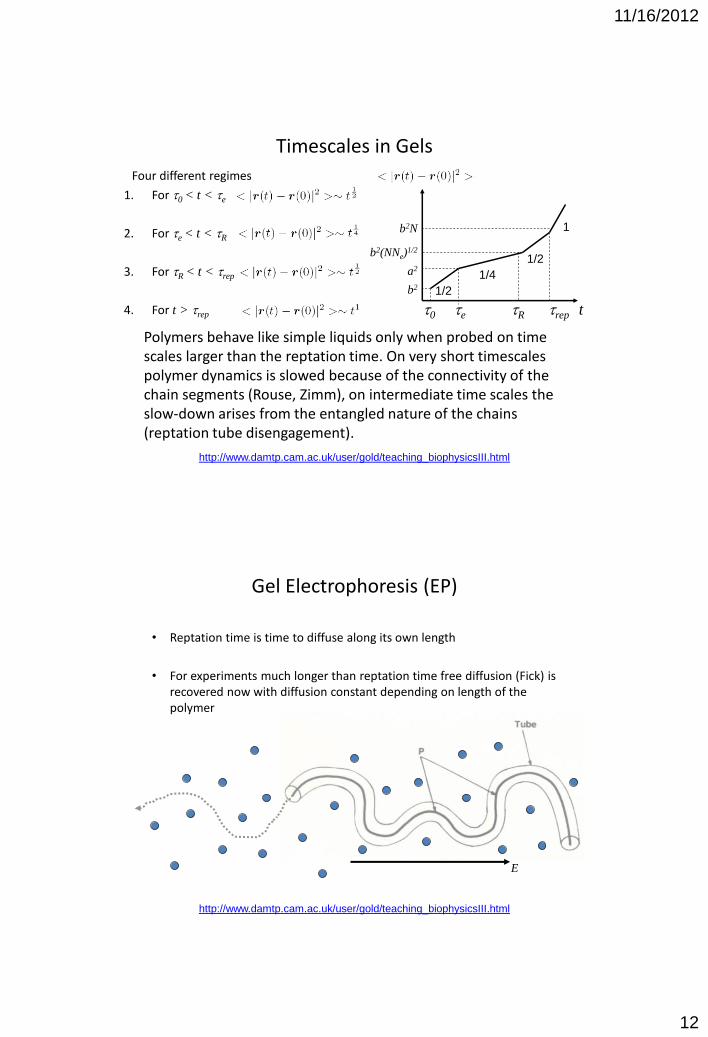
Timescales in Gels
t0 te tR trep
Four different regimes
1. For t0 < t < te
2. For te < t < tR
3. For tR < t < trep
4. For t > trep
b2N
b2(NNe)1/2
a2
b2
t
1/2
1/4
1/2
1
Polymers behave like simple liquids only when probed on time scales larger than the reptation time. On very short timescales polymer dynamics is slowed because of the connectivity of the chain segments (Rouse, Zimm), on intermediate time scales the slow-down arises from the entangled nature of the chains (reptation tube disengagement).
http://www.damtp.cam.ac.uk/user/gold/teaching_biophysicsIII.html
Gel Electrophoresis (EP)
• Reptation time is time to diffuse along its own length
• For experiments much longer than reptation time free diffusion (Fick) is recovered now with diffusion constant depending on length of the polymer
E

11/16/2012
13
http://www.damtp.cam.ac.uk/user/gold/teaching_biophysicsIII.html
(Zimm 1992)
DNA mobility in gel depends on length
After discussing the dynamics in a gel we can now look at the experimental data. We would expect that the mobility depends also on distance of gel fibres, which is clearly observed in the range of molecular weigths shown above. We would also expect that the drift velocity should inversely depend on the DNA length, which we find is true for this range of molecular weight.
Growing agarose content in [%]
http://www.damtp.cam.ac.uk/user/gold/teaching_biophysicsIII.html
Electric Field Dependence
At low elecric fields the mobility is almost independent of the magnitude of the field. However, for fields bigger than 1V/cm nonlinearities occur for longer DNA moelcules more pronounced than for shorter ones. In this regime the reptation Model breaks down due to “herniating” of the chains force on segments high enough to pull segments out of the reptation tube.
DNA length increases
(lines guides to the eye only)
(Zimm 1992 Viovy 2000)
“Hernia”
1Tk
Eqb
B
Condition for reptation model

11/16/2012
14
http://www.damtp.cam.ac.uk/user/gold/teaching_biophysicsIII.html
Validity of Reptation Model in Gel EP (Zimm 1992)
Increasing E-field
Mobility gets almost
Independent of DNA length
for both short and very long
DNA moelcules
The reptation model for gel electrophoresis works if the length of polymers is much longer than Debye screening length. Typically, the DNA should be longer than a several persistence lengths. Another important conditions is that the chains have to be longer than the typical pore diameter in the gel, otherwise they can freely move through the gaps. Finally, For very long polymers, thereptation model also breaks down as trapping and knots become very important for the mobility and a simple, driven diffusive motion is not a good description any more.
http://www.damtp.cam.ac.uk/user/gold/teaching_biophysicsIII.html
Entropic Forces and Single Molecules
Following our discussion of gel electrophoresis we briefly mentioned the trapping of long DNA molecules in voids in the gel. This is an interesting problem which can be studied in a more controlled geometry derived from nanotechnology, so called nanofluidic devices.
The aim is to follow the pathway of a single DNA molecule when it is partly trapped in a region with low entropy and at the same time is exposed to a region of high entropy as shown in the scheme on the right. This will aloow us to determine the entropic forces acting on the molecule.
(Craighead et al. 2002)

11/16/2012
15
http://www.damtp.cam.ac.uk/user/gold/teaching_biophysicsIII.html
Entropic Forces and Single Molecules (Craighead et al. 2002)
The „Nanofluidic“ device is made by „glueing“ two pieces of glass together with a distance of 60 nm. The pillars are separated by 160 nm, have a diameter of 35 nm diameter, which yields an effective distance of 115 nm, which is roughly equal to two presistence lengths of the DNA molecules. All surfaces are negatively charge to reduce sticking of the DNA to the surfaces.
http://www.damtp.cam.ac.uk/user/gold/teaching_biophysicsIII.html
Entropic Forces and Single Molecules (Craighead et al. 2002)
At the beginning of the experiment, DNA in solution is pulled into the pillar region by applying an electric field. The DNA is labeled with a fluorescent dye which makes it visible and easy to trace. The data shows that if part of the molecule is in the pillar-free region it recoils, otherwise it stays in the pillar region.

11/16/2012
16
http://www.damtp.cam.ac.uk/user/gold/teaching_biophysicsIII.html
Entropic Recoiling of DNA reveals Entropic Force
Following the trajectories of several molecules one can see that the curve follows a square root dependence. The spread in the data is what is expected for single molecule data in environments where kBT is the dominating energy scale.
These experiments allow to establish that entropy is a local quantity which affects the retraction only if a finite party of the molecule is in the high entropy region. However, the equilibrium position at infinite times would lead to all molecules ending up in the high entropy region. However, the diffusion in the pillar region is very slow on the time scale of the experiments and thus is not observed.
(Craighead et al. 2002)
http://www.damtp.cam.ac.uk/user/gold/teaching_biophysicsIII.html
Solid-State Nanopores
• Resistive-pulse technique
• DNA translocation dynamics
11/16/2012
17
http://www.damtp.cam.ac.uk/user/gold/teaching_biophysicsIII.html
Resistive-Pulse Technique (Bezrukov, 2000)
• Goal: counting particles in solution without labeling them by anything
• First proposed for the counting of blood cells in samples (1953 patent by Coulter)
• Idea: use orifice in glass with a diameter of tens of microns detecting particles down to several tenths of a micron by pressure driven flow
– Blood cell counting (1958)
– Baterial cell counting, cell-volume distributions
• Tenths of micron diameter capillary
• particles with dimensions down to 60 nm can be detected
– Virus counting
– Bacteriophage particles (1977)
http://www.damtp.cam.ac.uk/user/gold/teaching_biophysicsIII.html
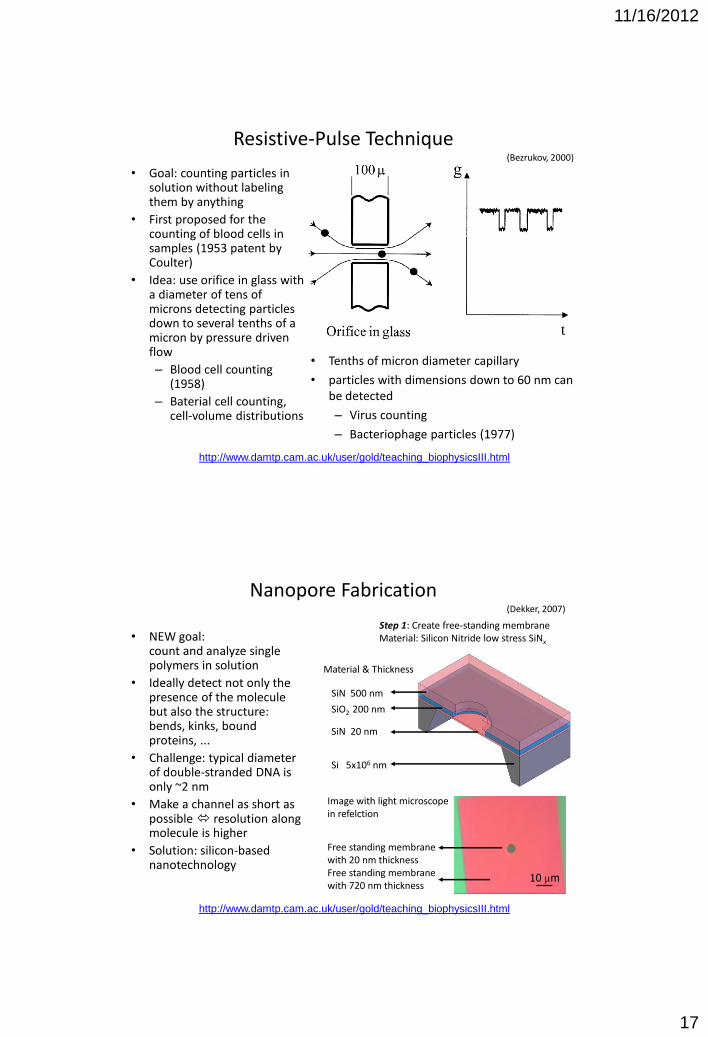
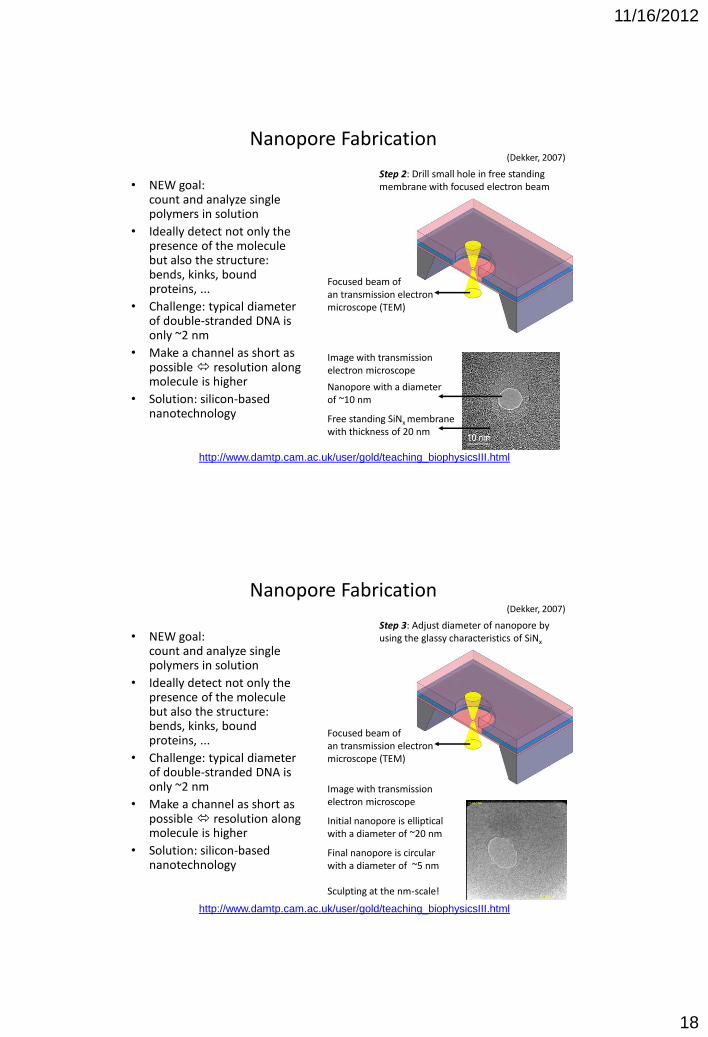
Nanopore Fabrication (Dekker, 2007)
• NEW goal: count and analyze single polymers in solution
• Ideally detect not only the presence of the molecule but also the structure: bends, kinks, bound proteins, ...
• Challenge: typical diameter of double-stranded DNA is only ~2 nm
• Make a channel as short as possible resolution along molecule is higher
• Solution: silicon-based nanotechnology
SiN 20 nm
SiO2 200 nm
SiN 500 nm
10 m
Step 1: Create free-standing membrane Material: Silicon Nitride low stress SiNx
Material & Thickness
Si 5x10⁶ nm
Image with light microscope in refelction
Free standing membrane with 20 nm thickness Free standing membrane with 720 nm thickness
11/16/2012
18
http://www.damtp.cam.ac.uk/user/gold/teaching_biophysicsIII.html
Nanopore Fabrication (Dekker, 2007)
• NEW goal: count and analyze single polymers in solution
• Ideally detect not only the presence of the molecule but also the structure: bends, kinks, bound proteins, ...
• Challenge: typical diameter of double-stranded DNA is only ~2 nm
• Make a channel as short as possible resolution along molecule is higher
• Solution: silicon-based nanotechnology
Step 2: Drill small hole in free standing membrane with focused electron beam
Image with transmission electron microscope
Focused beam of an transmission electron microscope (TEM)
Nanopore with a diameter of ~10 nm
Free standing SiNx membrane with thickness of 20 nm
http://www.damtp.cam.ac.uk/user/gold/teaching_biophysicsIII.html
Nanopore Fabrication (Dekker, 2007)
• NEW goal: count and analyze single polymers in solution
• Ideally detect not only the presence of the molecule but also the structure: bends, kinks, bound proteins, ...
• Challenge: typical diameter of double-stranded DNA is only ~2 nm
• Make a channel as short as possible resolution along molecule is higher
• Solution: silicon-based nanotechnology
Step 3: Adjust diameter of nanopore by using the glassy characteristics of SiNx
Image with transmission electron microscope
Initial nanopore is elliptical with a diameter of ~20 nm
Final nanopore is circular with a diameter of ~5 nm Sculpting at the nm-scale!
Focused beam of an transmission electron microscope (TEM)

11/16/2012
19
http://www.damtp.cam.ac.uk/user/gold/teaching_biophysicsIII.html
Nanopore Fabrication (Dekker, 2007)
Image with transmission electron microscope
Initial nanopore is elliptical with a diameter of ~20 nm
Final nanopore is circular with a diameter of ~5 nm Sculpting at the nm-scale!
• SiNx is a glassy material
• Electron beam deposits energy into the sample
• Local temparture is increased and material can start to flow
• Surface tension wants to minimize free energy
• Free energy gain DF is just
length pore
radius pore
tension surface
h
r
rrhAF
)(2 2DD
http://www.damtp.cam.ac.uk/user/gold/teaching_biophysicsIII.html
Resistance of Nanopores
• Cylinder filled with liquid will have resistance Rpore: h = membrane thickness r = nanopore radius s(T) = 1/r conductivity
• Apart from the resistance of the cylinder we have to take into account the access resistance –field lines into the pore
2
1
( )pore
KCl
hR
T rs
h
r2
2
2
1
( )
1 1 1 12
( ) 2 ( ) 4
1 1
( ) 2
pore
access
nanopore
KCl
KCl KCl
KCl
hR
T r
RT r T r
hR
T r r
s
s s
s
(Hille 2001)
(Hall 1975)

11/16/2012
20
http://www.damtp.cam.ac.uk/user/gold/teaching_biophysicsIII.html
Access Resistance
• Diffusive current I (particles per second) to a perfect spherical absorber with radius r is (C=0 at absorber and C0 at infinity)
• Thus for a hemisphere we get
• It is interesting to note here that the diffusive current is proportional to r and not to r2. The reason is that as r increases the surface increases as r2 but the gradient is getting smaller as 1/r
04I DrC
02I DrC
C=0 C0
r
http://www.damtp.cam.ac.uk/user/gold/teaching_biophysicsIII.html
Access Resistance
04I DrC
02I DrC
C=0
C0
C0 C=0
r
r • Diffusive current I (particles per second) to a perfect
disk like absorber with radius r is (C=0 at absorber and C0 at infinity)
• Diffusive current through a hole (perfect absorber) with radius r in a membrane of zero thickness is thus just half the above value
• Again, it is interesting to note here that the diffusive current is proportional to r and not to r2. Again, the reason is that as r increases the surface increases as r2 but the gradient is getting smaller as 1/r

11/16/2012
21
http://www.damtp.cam.ac.uk/user/gold/teaching_biophysicsIII.html
Diffusion constant and conductivity
• For a given aqueous solution the diffusion constant of the ionic species D+ and D-, for the positive and negative ions respectively, is directly linked to the conductivity of the salt solution: where + and - are the mobility for the respective ionic species
• Some diffusion constants for ions in aqueous solution (infinite dilution, T=25C, 10-9m2/s: K+ 1.957 Cl- 2.032 Na+ 1.334 F- 1.475 Li+ 1.029 Cs+ 2.056 H+ 9.311 OH- 5.273 Mg2+ 0.706
( ) ( )2
21( )
( ) B
z eT D D z e
T k Ts
r
(CRC Handbook 2000)
http://www.damtp.cam.ac.uk/user/gold/teaching_biophysicsIII.html
Access Resistance • For driven ionic currents through nanopores we are able to simply rewrite
the equations for the diffusion current on the preceding pages by changing concentration gradient into DV, diffusion constant D into ionic conductivity s(T) and thus write Resistance of a hemisphere: Resistance of a circular absorber: Resistance of a circular pore:
• This explains the additional term in the nanopore resistance, could be also interpreted as enhanced length of the nanopore with implications for the spatial resolution of sensing applications
1 ( )
2 ( ) 2
TR
T r r
r
s
1 ( )
4 ( ) 4
TR
T r r
r
s
1 ( )
2 ( ) 2
TR
T r r
r
s
2
1 1
( ) 2nanopore
KCl
hR
T r rs
11/16/2012
22
http://www.damtp.cam.ac.uk/user/gold/teaching_biophysicsIII.html
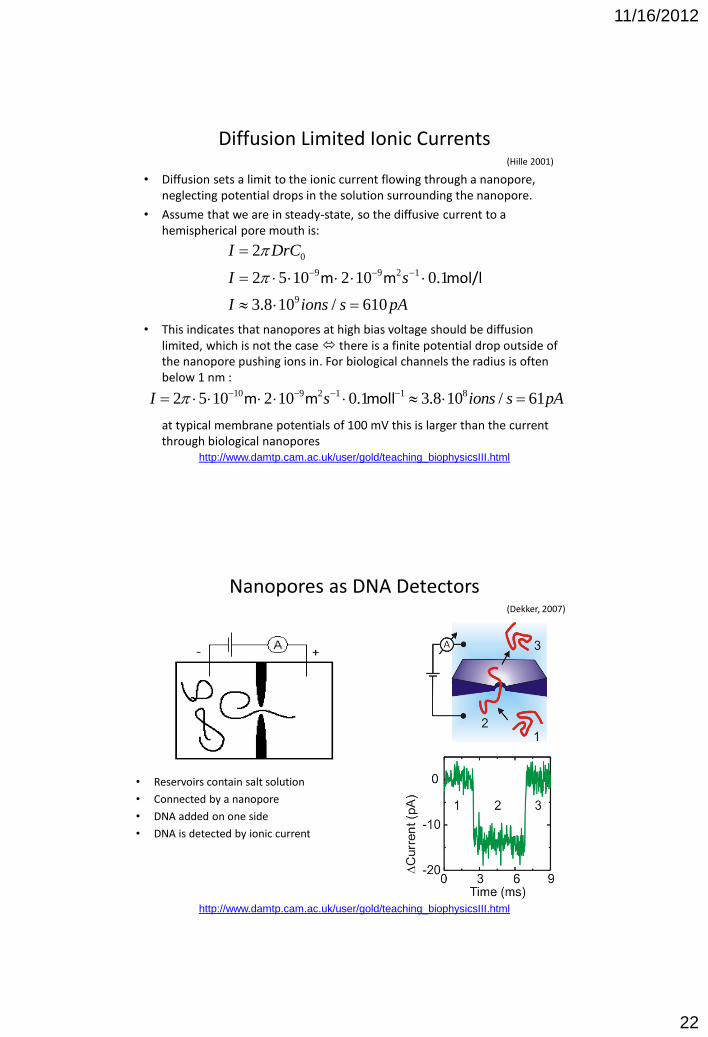
Diffusion Limited Ionic Currents
• Diffusion sets a limit to the ionic current flowing through a nanopore, neglecting potential drops in the solution surrounding the nanopore.
• Assume that we are in steady-state, so the diffusive current to a hemispherical pore mouth is:
• This indicates that nanopores at high bias voltage should be diffusion limited, which is not the case there is a finite potential drop outside of the nanopore pushing ions in. For biological channels the radius is often below 1 nm : at typical membrane potentials of 100 mV this is larger than the current through biological nanopores
0
9 9 2 1
9
2
2 5 10 2 10 0.1
3.8 10 / 610
m m mol/l
I DrC
I s
I ions s pA
(Hille 2001)
10 9 2 1 1 82 5 10 2 10 0.1 3.8 10 / 61m m mollI s ions s pA
http://www.damtp.cam.ac.uk/user/gold/teaching_biophysicsIII.html
Nanopores as DNA Detectors
• Reservoirs contain salt solution
• Connected by a nanopore
• DNA added on one side
• DNA is detected by ionic current
(Dekker, 2007)

11/16/2012
23
http://www.damtp.cam.ac.uk/user/gold/teaching_biophysicsIII.html
DNA Translocation
• DNA translocation measured in 1M KCl with nanopore of 10 nm diameter
• Current decreases, indicating DNA passing through the nanopore
• Microsecond time resolution allow for detection of event structure
0 1 2 3 4 5
7.4
7.6
7.8
8.0
Cu
rre
nt
(nA
)
Time (s)
Current (nA)
tdwell
Iblock
0 2 4 6 8 10
-0.3
-0.2
-0.1
0.0
Re
lative
Cu
rre
nt
Ch
an
ge
(n
A)
Time (ms)
'Type 1' event
http://www.damtp.cam.ac.uk/user/gold/teaching_biophysicsIII.html
Typical Events in Nanopores
• Linear translocation of the DNA through the nanopore
• Events are characterized by dwell time tdwell and averaged current blockade level Iblock
tdwell
Iblock
0 2 4 6 8 10
-0.3
-0.2
-0.1
0.0
Rela
tive C
urr
ent C
han
ge
(nA
)
Time (ms)
'Type 1' event‘Type 1’
(Smeets et al. 2006)

11/16/2012
24
http://www.damtp.cam.ac.uk/user/gold/teaching_biophysicsIII.html
Typical Events in Nanopores
0 2 4 6 8 10
-0.3
-0.2
-0.1
0.0
Rela
tive C
urr
ent C
han
ge
(nA
)
Time (ms)
'Type 1' event
• Doubling of the current blockade: DNA can be folded when going through the nanopore (diameter 10 nm)
0 2 4 6 8 10
'Type 2' event
Time (ms)
‘Type 1’ ‘Type 2’
(Smeets et al. 2006)
http://www.damtp.cam.ac.uk/user/gold/teaching_biophysicsIII.html
Typical Events in Nanopores
0 2 4 6 8 10
-0.3
-0.2
-0.1
0.0
Rela
tive C
urr
ent C
han
ge
(nA
)
Time (ms)
'Type 1' event
• Combination of both events are also observed
• DNA can fold in nanopores with diameters of several nm
0 2 4 6 8 10
'Type 21' event
Time (ms)
‘Type 1’ ‘Type 21’
(Smeets et al. 2006)

11/16/2012
25
http://www.damtp.cam.ac.uk/user/gold/teaching_biophysicsIII.html
Analyzing DNA Translocations
• Each point represents one single-molecule measurement
• High throughput analysis is easily possible
• ‘Type 2’ twice the blockade of ‘Type 1’ and half the dwell time
• ‘Type 21’ lies in between, as expected
• Tertiary structure of DNA can be detected folds and kinks, bound proteins, …
‘Type 21’
‘Type 1’
‘Type 2’
(Smeets et al. 2006)
http://www.damtp.cam.ac.uk/user/gold/teaching_biophysicsIII.html
0 2 4 6 8 10
-0.3
-0.2
-0.1
0.0
Rela
tive C
urr
ent C
han
ge
(nA
)
Time (ms)
'Type 1' event
AreadttIdwellt
0
)(
Area
Event area scales with DNA length
• Integrated charge scales linearly with length of translocating DNA
• Prove that DNA is actually going through the nanopore
(Storm 2005)

11/16/2012
26
http://www.damtp.cam.ac.uk/user/gold/teaching_biophysicsIII.html
Polymer physics with Nanopores
• Long DNA molecules are pulled through much faster than their Zimm relaxation time
• Translocation time for 16 micron long DNA (48 kbp) ~1 ms polymer coil should be detectable in translocation time?
(Storm 2005)
smNsm
2160)10100(001.0 588.03
392
3
0
33
32
Tk
NNTk
bR
TkD
R
B
Z
BBZ
Z
t
thh
t nn
http://www.damtp.cam.ac.uk/user/gold/teaching_biophysicsIII.html
Experimental results: fast translocations
• Fast translocation: dwell time t larger than Zimm time tZ,
• Polymer cannot reach a new equilibrium configuration during translocation of each segment b
• DNA length varied between 6.6 kbp and 96 kpb length increased by factor of 16, t increases 0.2 ms to 5 ms, factor of 25
(Storm 2005)

11/16/2012
27
http://www.damtp.cam.ac.uk/user/gold/teaching_biophysicsIII.html
Experimental results: fast translocations
• Translocation time scales with L2n with n ~0.588 the Flory exponent for dsDNA – very nice fit to calculations
(Storm 2005)
t~L1.27±0.03
http://www.damtp.cam.ac.uk/user/gold/teaching_biophysicsIII.html
Variation of Ionic Strength
• For salt concentrations larger than 400 mM ionic current through nanopore is DECREASED when DNA is in the nanopore
• For salt concentration smaller than 400 mM current through nanopore is INCREASED when DNA is in the nanopore
• DNA is a polyelectrolyte with charge and counterions
500 mM KCl
100 mM KCl
‘Type 1’ ‘Type 21’ ‘Type 2’ ‘Type 1’ ‘Type 21’ ‘Type 2’
(Smeets et al. 2006)

11/16/2012
28
http://www.damtp.cam.ac.uk/user/gold/teaching_biophysicsIII.html
Variation of Ionic Strength
500 mM KCl
100 mM KCl
‘Type 1’ ‘Type 21’ ‘Type 2’ ‘Type 1’ ‘Type 21’ ‘Type 2’
(Smeets et al. 2006)
500 mM KCl 100 mM KCl
http://www.damtp.cam.ac.uk/user/gold/teaching_biophysicsIII.html
Change in nanopore conductance DG
• Change in nanopore conductance DG due to DNA with diameter dDNA
• DNA pushes ions out of the nanopore
• DNA counter ions are brought into nanopore
• Opposite effects depending on bulk concentration of ions nbulk
• With K and DNA the mobility of counterions and DNA, respectively
*2 ( ) 2 2
4
DNAKDNA K Cl Bulk
pore
eG d n
L a a
D
Conductance reduction due
to DNA in Nanopore
Counter ions
on DNA
Conductance due to
the moving DNA
(Smeets et al. 2006)

11/16/2012
29
http://www.damtp.cam.ac.uk/user/gold/teaching_biophysicsIII.html
Change in nanopore conductance DG
• Our assumption: all of the counter ions are movable, however some have lower mobility
• Account for this by reducing DNA charge by “attaching” part of the potassium counter ions to the DNA backbone
• Mobility of potassium is higher than DNA mobility
,21( )
4
K eff DNA
DNA K Cl Bulk
pore
qG d n e
L a
D
*2 2 2
( )4
K DNADNA K Cl Bulk
pore
eG d n
L a
D
(Smeets et al. 2006)
http://www.damtp.cam.ac.uk/user/gold/teaching_biophysicsIII.html
71%
Change in nanopore conductance DG
• Simple model can be used to fit the data ena extract the line charge density of DNA q*l,DNA
• Bare DNA has a line charge density of 2e/bp
(Smeets et al. 2006)
( )2~4
DNA K Cl KClG d n
D
( ), ,~ K l DNA K l DNAG q q
D
, 0.58 0.02l DNAeq
bp

11/16/2012
30
http://www.damtp.cam.ac.uk/user/gold/teaching_biophysicsIII.html
Optical Tweezers and Nanopores
After discussing free DNA translocation experiments we can now Combine optical tweezers with nanopores and current detection we will now try to fully understand the physics governing the electrophoretic translocation through nanopores. The main variable we need for this is the force acting on the molecule in the nanopore. We will again employ optical tweezers, now in combination with a nanopore to measure translocation speed, force and position
(Keyser et al. 2006)
http://www.damtp.cam.ac.uk/user/gold/teaching_biophysicsIII.html
Two measurements: current and force
A single colloidal particle is coated with DNA and is held in close proximity to a ananopore in the focus of the optical trap. An applied electric potential will drive the DNA into the biased nanopore. When the DNA enters the nanopore we will see that both the ionic current through the nanopore as well as the position (force) or the particle will change at the same time: (1) the current changes (2) the bead position changes
(2)
(1)
(Keyser et al. 2006)

11/16/2012
31
http://www.damtp.cam.ac.uk/user/gold/teaching_biophysicsIII.html
Time-Resolved Events
• Conductance step indicates capture of DNA in nanopore
• Only when DNA is pulled taut the force changes
• Time to pull taut Dt is consistent with free translocation speed of DNA
• DNA is stalled in the nanopore and allows for force measurements on the molecule, and other things
(Keyser et al. 2006)
http://www.damtp.cam.ac.uk/user/gold/teaching_biophysicsIII.html
Force on DNA
• Linear force-voltage characteristic as expected
• Absence of nonlinearities indicate that equilibrium formulae can be used
• Poisson-Boltzmann should work fine in this situation
• (Navier-)Stokes should also work
• Force does not depend on distance nanopore-trap
• Extract the gradient and vary salt concentration
(Keyser et al. 2006)

11/16/2012
32
http://www.damtp.cam.ac.uk/user/gold/teaching_biophysicsIII.html
Hydrodynamics Should Matter
Hydrodynamic interactions matter
http://www.damtp.cam.ac.uk/user/gold/teaching_biophysicsIII.html
Force on a charged wall in solution? (Keyser et al. 2010)

11/16/2012
33
http://www.damtp.cam.ac.uk/user/gold/teaching_biophysicsIII.html
Poisson Boltzmann describes screening • Distribution of ions Boltzmann distributed
• When we have
• Taylor expansion yields
• Calculate f(x) self consistently with the Poisson eq.
( ) /
0( ) e x kTn x n e f
( ) / 1e x kTf
( )0
( ) 1 ( ) /n x n e x kTf
2( ) ( ) /
wf r r r
( ) ( ) ( )e n nr
r r r
(Keyser et al. 2010)
http://www.damtp.cam.ac.uk/user/gold/teaching_biophysicsIII.html
Poisson Boltzmann describes screening
• This yields a simple differential equation
• And we have the Debye screening length
• Solution for the differential equation
– Boundary conditions:
2
2 2 2
0
( ) ( )( )
2
wkTd x x
xdx e n
f ff
2 1/ 2
0( / 2 )
wkT e n
/ /( )
x xx Ae Be
f
0
( ) ( ); 0
x x dw
d x d x
dx dx
f s f
(Keyser et al. 2010)

11/16/2012
34
http://www.damtp.cam.ac.uk/user/gold/teaching_biophysicsIII.html
Poisson Boltzmann describes screening
• This yields the solution for f(x)
• Assuming that d>> we get
• Uncharged wall does not influence the screening layer!
/ 2 / /
2 /( )
1
x d x
d
w
e e ex
e
sf
/( ) ( )
x
w
x e d
f s
/
0( )
2
xn x n e
e
s
(Keyser et al. 2010)
http://www.damtp.cam.ac.uk/user/gold/teaching_biophysicsIII.html
• Uncharged wall does not influence the screening layer!
Potential for a slightly charged wall
20 mM KCl s = 0.001 C/m2
d 2d E E
(Keyser et al. 2010)

11/16/2012
35
http://www.damtp.cam.ac.uk/user/gold/teaching_biophysicsIII.html
• Uncharged wall does not influence the screening layer!
Ion distribution for a slightly charged wall
20 mM KCl s = 0.001 C/m2
d 2d E E
(Keyser et al. 2010)
http://www.damtp.cam.ac.uk/user/gold/teaching_biophysicsIII.html
• Uncharged wall DOES influence electroosmotic flow!
Electroosmotic flow along charged wall
d 2d
2
2
( ) ( )0z
d v x x E
dx
r
h
• Excess of counterions near surface leads to electroosmotic flow r(x)E force exerted by electric field E, h viscosity of water
• This leads to velocity of water v(x) assuming no-slip boundaries
/( ) 1
xE xv x e
d
s
h
E E
(Keyser et al. 2010)

11/16/2012
36
http://www.damtp.cam.ac.uk/user/gold/teaching_biophysicsIII.html
Electroosmotic flow along charged wall
20 mM KCl s = 0.001 C/m2
d 2d E E
(Keyser et al. 2010)
http://www.damtp.cam.ac.uk/user/gold/teaching_biophysicsIII.html
Forces on the DNA and Nanopore wall • Bare force Fbare is just product of area A, charge density and electric field E
• The drag force Fdrag exerted by the flowing liquid
• The force required to hold the charged wall stationary is thus
bareF A Es
drag bare
0
( )1 1
x
dv xF A AE F
dx d d
h s
( )mech elec bare dragF F F F AEd
s
(Keyser et al. 2010)

11/16/2012
37
http://www.damtp.cam.ac.uk/user/gold/teaching_biophysicsIII.html
Part of the force goes to the uncharged wall
• Fmech depends on the distance d between the walls
(Keyser et al. 2010)
http://www.damtp.cam.ac.uk/user/gold/teaching_biophysicsIII.html
DNA - High charge densities
• For high charge densities linearized PB does not work:
• With two infinite walls can still be solved:
• Introducing the Gouy-Chapman length
2
0
2
2( ) ( )sinh
w
end x e x
dx kT
f f
/
/( )
2 1ln
1
x
xx
kT e
e e
f
( )1/ 2
2 2
GC GC/ 1 /
GC 2 / | |wkT e s
(Keyser et al. 2010)
11/16/2012
38
http://www.damtp.cam.ac.uk/user/gold/teaching_biophysicsIII.html
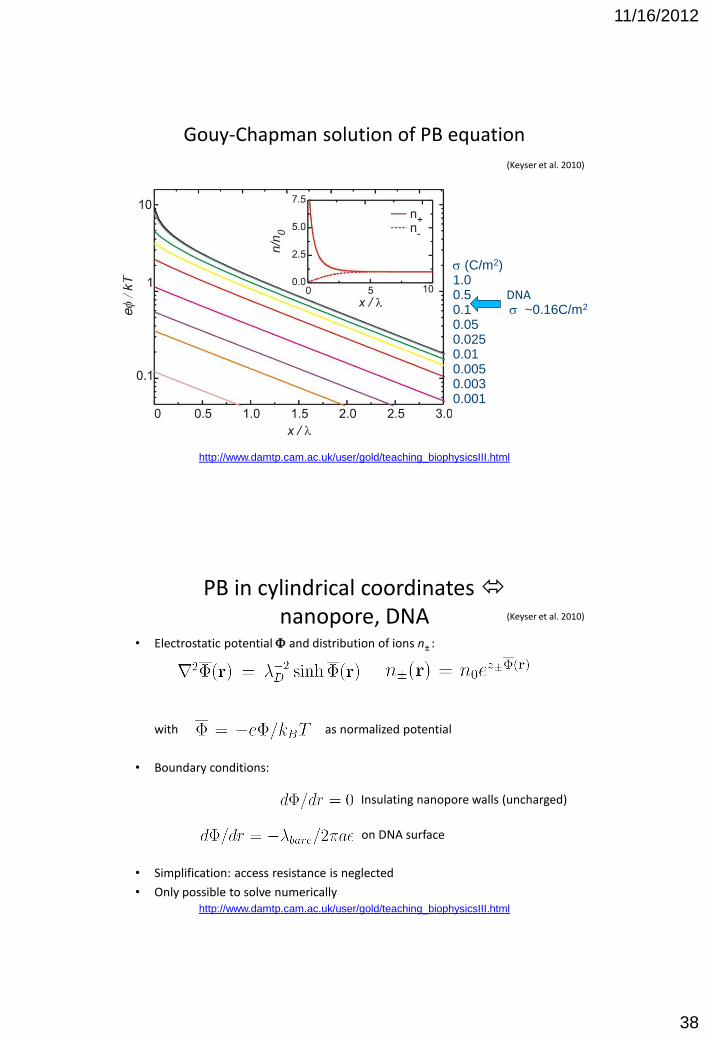
Gouy-Chapman solution of PB equation
s (C/m2) 1.0 0.5 0.1 0.05 0.025 0.01 0.005 0.003 0.001
DNA s ~0.16C/m2
(Keyser et al. 2010)
http://www.damtp.cam.ac.uk/user/gold/teaching_biophysicsIII.html
PB in cylindrical coordinates nanopore, DNA
• Electrostatic potential F and distribution of ions n± :
with as normalized potential
• Boundary conditions: Insulating nanopore walls (uncharged)
on DNA surface
• Simplification: access resistance is neglected
• Only possible to solve numerically
(Keyser et al. 2010)

11/16/2012
39
http://www.damtp.cam.ac.uk/user/gold/teaching_biophysicsIII.html
PB in cylindrical coordinates
• PB can be solved analytically only by linearizing again
• Combining Poisson Boltzmann and Stokes equation yields:
Potential F(a) on DNA surface, F(R) Nanopore wall
• Logarithmic dependence of Fmech on nanopore radius R slow variation as function of R
(Keyser et al. 2010)
http://www.damtp.cam.ac.uk/user/gold/teaching_biophysicsIII.html
Finite Element Calculation
• Combining Poisson Boltzmann and Stokes
• Main result: Force on DNA depends on pore diameter
• Change in pore diameter by factor 10 increases drag by a factor of two
(Keyser et al. 2009)
11/16/2012
40
http://www.damtp.cam.ac.uk/user/gold/teaching_biophysicsIII.html
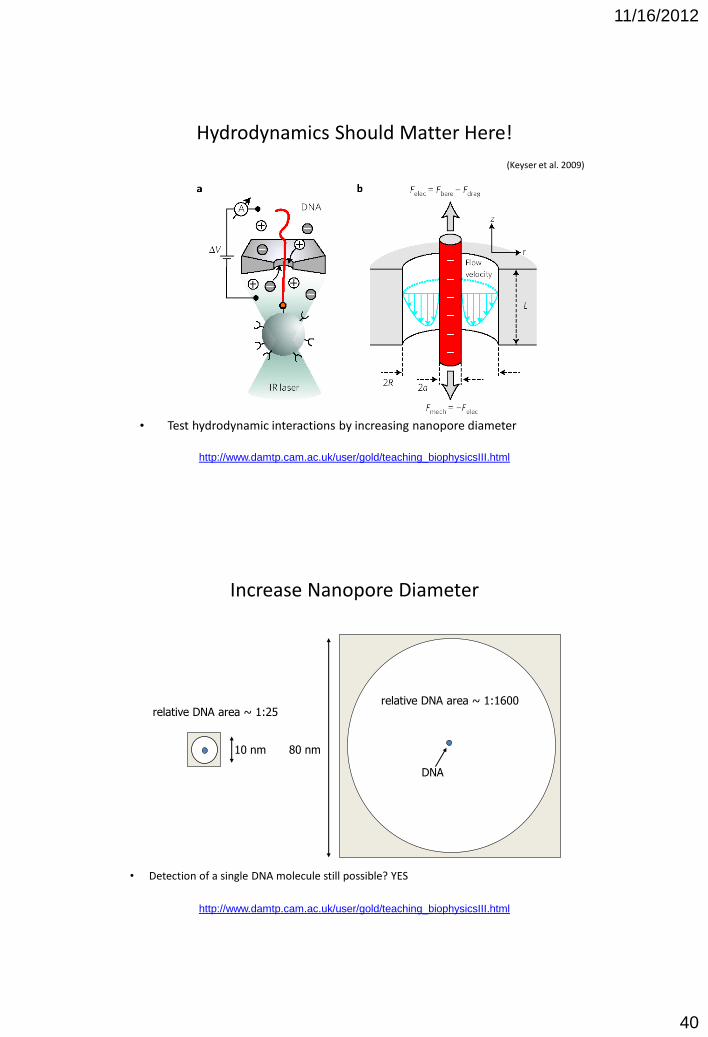
Hydrodynamics Should Matter Here!
• Test hydrodynamic interactions by increasing nanopore diameter
(Keyser et al. 2009)
http://www.damtp.cam.ac.uk/user/gold/teaching_biophysicsIII.html
Increase Nanopore Diameter
• Detection of a single DNA molecule still possible? YES
10 nm 80 nm
DNA
relative DNA area ~ 1:25 relative DNA area ~ 1:1600

11/16/2012
41
http://www.damtp.cam.ac.uk/user/gold/teaching_biophysicsIII.html
Force Dependence on Nanopore Radius
• Force is proportional to voltage as expected
• For larger nanopore force is roughly halved as expected from model
• Measure for a range of nanopore sizes and compare with numerical results
http://www.damtp.cam.ac.uk/user/gold/teaching_biophysicsIII.html
Comparison: Model Data
• Force depends on nanopore radius R
• Data can be explained by numerical model solving full Poisson Boltzmann and Navier-Stokes equations
• Hydrodynamics matters

11/16/2012
42
http://www.damtp.cam.ac.uk/user/gold/teaching_biophysicsIII.html
Explanation: Newton’s Third Law
http://www.damtp.cam.ac.uk/user/gold/teaching_biophysicsIII.html
Membranes and proteins
• Membrane proteins and ion channels
• Rotary motors in cell membranes
• Rotary motors for swimming bacteria
11/16/2012
43
http://www.damtp.cam.ac.uk/user/gold/teaching_biophysicsIII.html
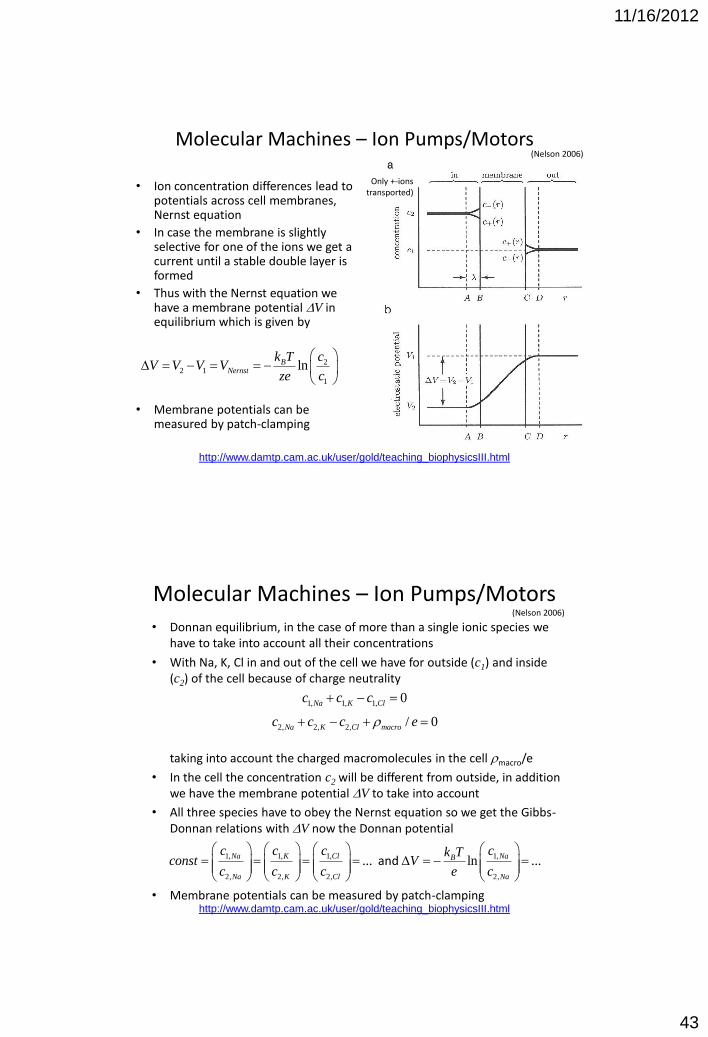
Molecular Machines – Ion Pumps/Motors
• Ion concentration differences lead to potentials across cell membranes, Nernst equation
• In case the membrane is slightly selective for one of the ions we get a current until a stable double layer is formed
• Thus with the Nernst equation we have a membrane potential DV in equilibrium which is given by
• Membrane potentials can be measured by patch-clamping
22 1
1
lnBNernst
k T cV V V V
ze c
D
(Nelson 2006)
Only +-ions transported)
http://www.damtp.cam.ac.uk/user/gold/teaching_biophysicsIII.html
Molecular Machines – Ion Pumps/Motors
• Donnan equilibrium, in the case of more than a single ionic species we have to take into account all their concentrations
• With Na, K, Cl in and out of the cell we have for outside (c1) and inside (c2) of the cell because of charge neutrality taking into account the charged macromolecules in the cell rmacro/e
• In the cell the concentration c2 will be different from outside, in addition we have the membrane potential DV to take into account
• All three species have to obey the Nernst equation so we get the Gibbs-Donnan relations with DV now the Donnan potential
• Membrane potentials can be measured by patch-clamping
(Nelson 2006)
1, 1, 1, 1,
2, 2, 2, 2,
... ln ... and Na K Cl NaB
Na K Cl Na
c c c ck Tconst V
c c c e c
D
1, 1, 1, 0Na K Clc c c
2, 2, 2, / 0Na K Cl macroc c c er

11/16/2012
44
http://www.damtp.cam.ac.uk/user/gold/teaching_biophysicsIII.html
Fabrication of Glass Microcapillaries*
Glass capillary
Laser
Pull
direction
Two glass capillaries
1.
2.
3.
1. Glass capillary
placed in puller
2. Laser heats up
capillary and force
applied to both
sides: Glass softens
and shrinks
3. Strong pull
separates glass in
two parts
20 mum
Sutter P-2000
http://www.damtp.cam.ac.uk/user/gold/teaching_biophysicsIII.html
Patch clamping
Patch-clamping modes of operation Current measurement through a SINGLE membrane pore possible

11/16/2012
45
http://www.damtp.cam.ac.uk/user/gold/teaching_biophysicsIII.html
Detection of Biological Membrane Potentials (E. Neher Nobel lecture)
• Glass capillary is pulled into a small tip with diameters of a few 10s-100s of nm and attached to the surface of the cell
• First true single-molecule measurements – done in the early 1970s!
http://www.damtp.cam.ac.uk/user/gold/teaching_biophysicsIII.html
Patch clamping was a true scientific revolution allowing for studies of voltage gating in single protein channels, nerve transduction and many other biological phenomena. One of the papers of Sakmann and Neher is cited more than 16,000 times!
Patch Clamping – Membrane Potentials (E. Neher Nobel lecture)

11/16/2012
46
http://www.damtp.cam.ac.uk/user/gold/teaching_biophysicsIII.html
Donnan equilibrium and membrane potential
• Membrane potential for sodium is not explained by the Donnan equilibrium active process (energy) needed to keep this membrane potential up
• Ion pumps use ATP to pump sodium out of the cell while the same pump (ATP driven) import potassium into the cells, hence sodium-potassium pump was discovered
• Function can be tested in the same lipid bilayer systems as described for the nanopores for DNA detection
(Nelson 2006)
http://www.damtp.cam.ac.uk/user/gold/teaching_biophysicsIII.html
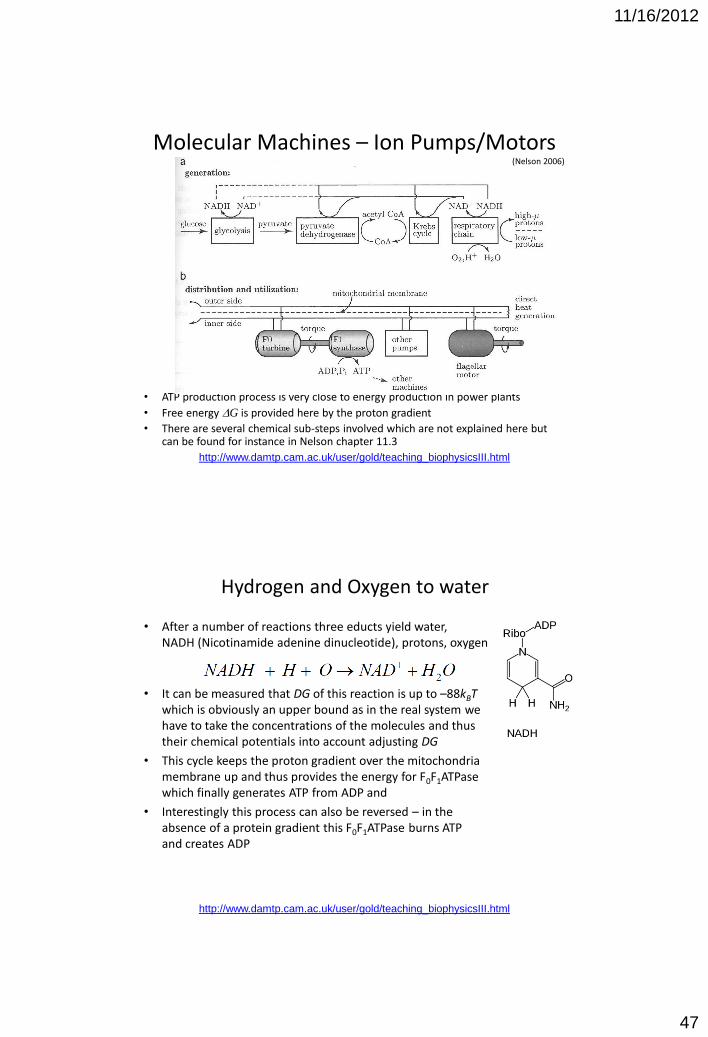
Generating ATP in mitochondria
• ATP is the main energy carrier in the cell, it is also used to make DNA and can be easily changed into GTP
• Mitochondria convert a proton gradient into the rotary motion of a transmembrane protein called F0F1ATPase
• Lipid membrane is needed to uphold the proton gradient which is created by de-protonation of NADH and generation of water
(Nelson 2006)
11/16/2012
47
http://www.damtp.cam.ac.uk/user/gold/teaching_biophysicsIII.html
Molecular Machines – Ion Pumps/Motors
• ATP production process is very close to energy production in power plants
• Free energy DG is provided here by the proton gradient
• There are several chemical sub-steps involved which are not explained here but can be found for instance in Nelson chapter 11.3
(Nelson 2006)
http://www.damtp.cam.ac.uk/user/gold/teaching_biophysicsIII.html
Hydrogen and Oxygen to water
• After a number of reactions three educts yield water, NADH (Nicotinamide adenine dinucleotide), protons, oxygen
• It can be measured that DG of this reaction is up to –88kBT which is obviously an upper bound as in the real system we have to take the concentrations of the molecules and thus their chemical potentials into account adjusting DG
• This cycle keeps the proton gradient over the mitochondria membrane up and thus provides the energy for F0F1ATPase which finally generates ATP from ADP and
• Interestingly this process can also be reversed – in the absence of a protein gradient this F0F1ATPase burns ATP and creates ADP

11/16/2012
48
http://www.damtp.cam.ac.uk/user/gold/teaching_biophysicsIII.html
Molecular Machines – Ion Pumps/Motors
• It is possible to image the rotary motion of the F0F1ATPase by attaching an actin filament which is fluorescently labelled to the top of the motor
• Rotary motion in three steps can be observed
• Highly efficient molecular machine with efficiency close to 1!
(Nelson 2006)
http://www.damtp.cam.ac.uk/user/gold/teaching_biophysicsIII.html
Proton-driven Flagellum Motor of E.coli
Outer
membrane
Inner
membrane
Stator:
Motor proteins:
MotA, MotB
Rotor:
Protein ring MS composed
of 26 FliG, FliF
Direction control:
FliM, FliN
Motor is driven by a proton gradient over the inner and outer membranes.
MotA and MotB are proton channels allowing for the passage and converting the
electric energy into rotational motion.
Bacteria use not ATP but ion currents for driving their rotary motors.
(Berg 2003)

11/16/2012
49
http://www.damtp.cam.ac.uk/user/gold/teaching_biophysicsIII.html
Change of Flagellum during Swimming/Tumbling
E.Coli swims in straight lines with intermittent tumbling motion. During straight line swimming the motors rotate counter clockwise (CCW) and during tumbling clockwise (CW). Flagella conformation depends on rotation direction. In CCW the flagella form a bundle while in CW they rotate separately.
(Berg 2003)
http://www.damtp.cam.ac.uk/user/gold/teaching_biophysicsIII.html
Change of Flagellum during Swimming/Tumbling (Berg 2003)
Single flagellar filament of E.Coli, imaged by fluorescent microscopy. Frame numbers indicate video frame numbers with ~17ms between frames. Direction switches from CCW to CW after frame 2, changing conformation to semi coiled (frame 10) and then to the ‘curly’ helix. Switch back to CCW (after frame 26) leads to transformation back to the normal helical confirmation (see 2).
11/16/2012
50
http://www.damtp.cam.ac.uk/user/gold/teaching_biophysicsIII.html
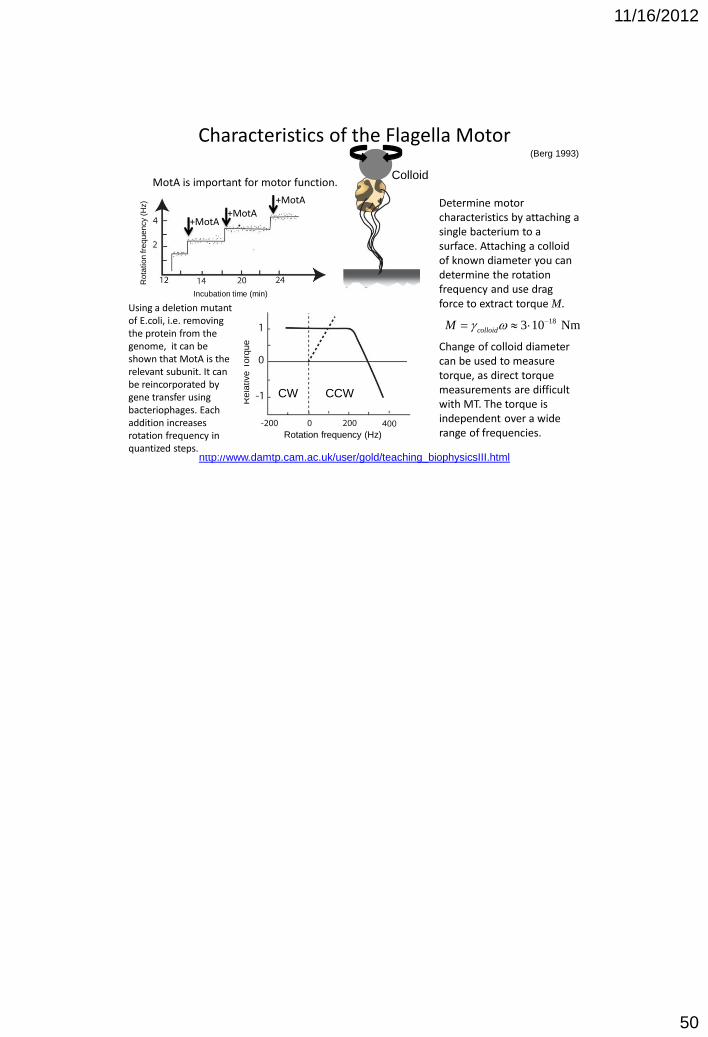
Characteristics of the Flagella Motor
Rotation frequency (Hz)
Rela
tive T
orq
ue
Rota
tio
n fre
qu
en
cy (
Hz)
Incubation time (min)
(Berg 1993)
Using a deletion mutant of E.coli, i.e. removing the protein from the genome, it can be shown that MotA is the relevant subunit. It can be reincorporated by gene transfer using bacteriophages. Each addition increases rotation frequency in quantized steps.
CW CCW
Colloid
Determine motor characteristics by attaching a single bacterium to a surface. Attaching a colloid of known diameter you can determine the rotation frequency and use drag force to extract torque M.
Change of colloid diameter can be used to measure torque, as direct torque measurements are difficult with MT. The torque is independent over a wide range of frequencies.
183 10 NmcolloidM
MotA is important for motor function.
+MotA +MotA
+MotA