electricity trade analysis - purdue
TRANSCRIPT

Electricity Trade AnalysisElectricity Trade Analysis
F.T SparrowF.T SparrowBrian H. BowenBrian H. BowenGeoff GranumGeoff Granum
Power Pool Development GroupPower Pool Development GroupPurdue University, U.S.A.Purdue University, U.S.A.
Strengthening Regional Energy Linkages in South Asia, Dhaka, Bangladesh, July 19-23, 2003
22
IntroductionIntroduction
Overall ReviewOverall ReviewThe Short term model structureThe Short term model structureDemonstration Model InputsDemonstration Model InputsDemonstration Results: Short Term (ST) & Demonstration Results: Short Term (ST) & Long Term (LT)Long Term (LT)
4 Scenarios4 ScenariosProjectsProjectsCountry outputsCountry outputs

33
Electricity Trade ModelingElectricity Trade Modeling
Long TermModel
Inputs Outputs
Capital CostsFuel CostsHeat RatesLine Losses
Generation CapacitiesReliability Standards
Country Autonomy Standards
Cost SavingsOptimal ExpansionsTrade TariffsWheeling EffectsReserve Margin Planning

44
ShortShort--Term & LongTerm & Long--Term Term ModelingModeling
Short-term (ST) modeling (fixed generation capacity) can be for almost any length of time less than 12 months. It can be a period of hours, days, weeks, or months. Long-term (LT) modeling (capacity expansions) is normally referring to several years. LT models are typically anywhere between 5 years & 20 years.

55
Electricity Forecasting PolicyElectricity Forecasting Policy
Across the United States & in the industrialized nationals generally a growth rate of about 2% is typical. In the developing economies the growth rates are often quoted as being double or triple this 2% growth rate & even more. Enormous planning differences occur over a 20 year planning horizon with different rates of 4%, 8%, & 12% are used: 1.0220 = 1.48, 1.0420 = 2.19, 1.0820 = 4.66, 1.1220 = 9.64

66
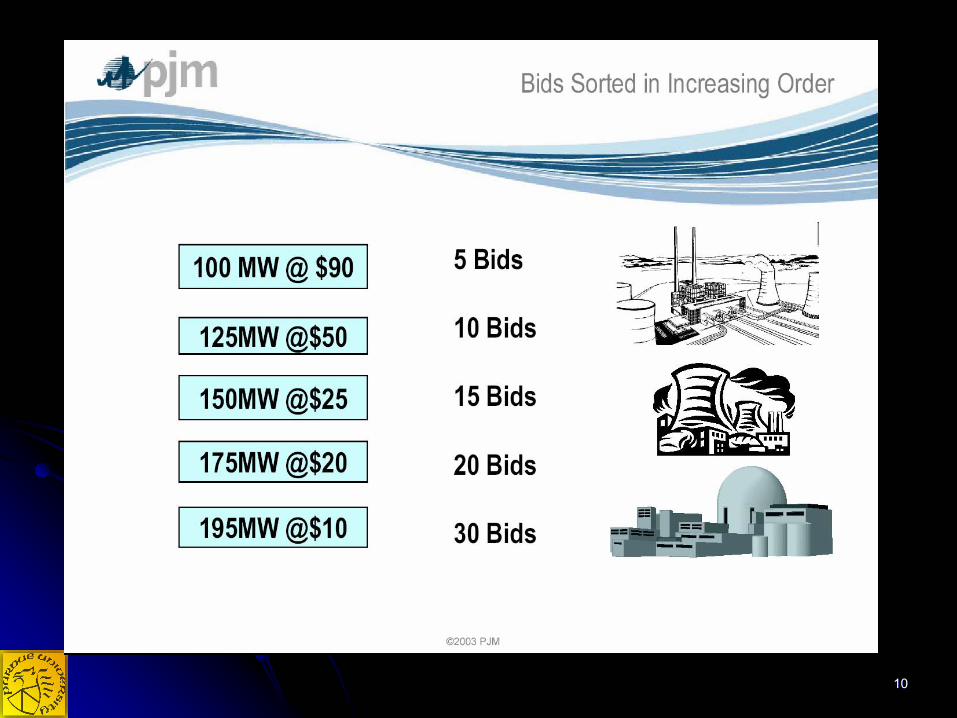
Electricity Trading Electricity Trading CommoditiesCommodities
The Purdue longThe Purdue long--term electricity trade term electricity trade model (PLTETM) trades in two model (PLTETM) trades in two commodities:commodities:
a.) Megawatt reserve power (MW)a.) Megawatt reserve power (MW)b.) Megawatt hour energy (MWh)b.) Megawatt hour energy (MWh)
77
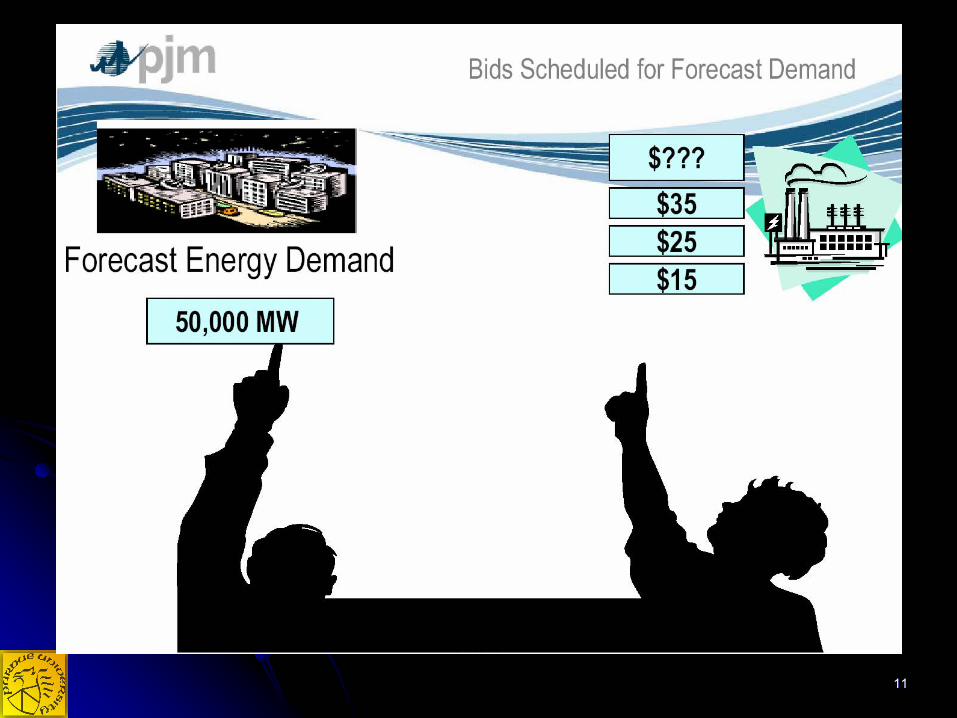
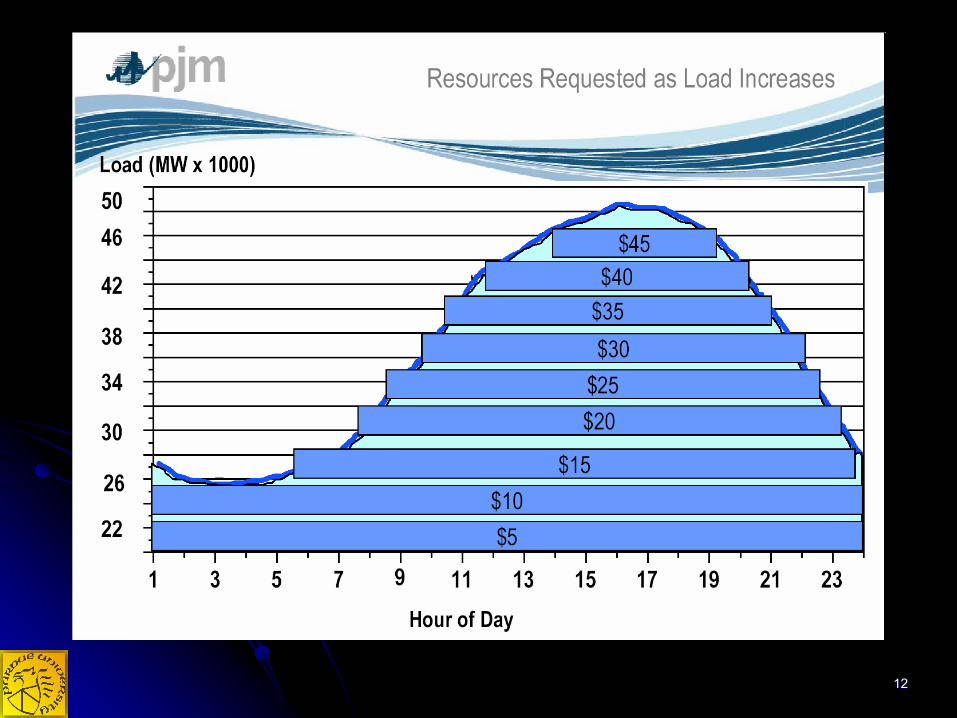
Supply, Demand & Shipment Supply, Demand & Shipment (Existing & Proposed)(Existing & Proposed)
The Purdue electricity & gas trade models minimize the cost to meet the demands for electricity & natural gas within one region over a long-term horizon (e.g., 20 years). The region consists of several or more countries (indexed as z or zp). Normally each country is modeled as one node. Free trade is permitted to take place between all of the countries in the specified region.
88
99
1010
1111
1212
1313
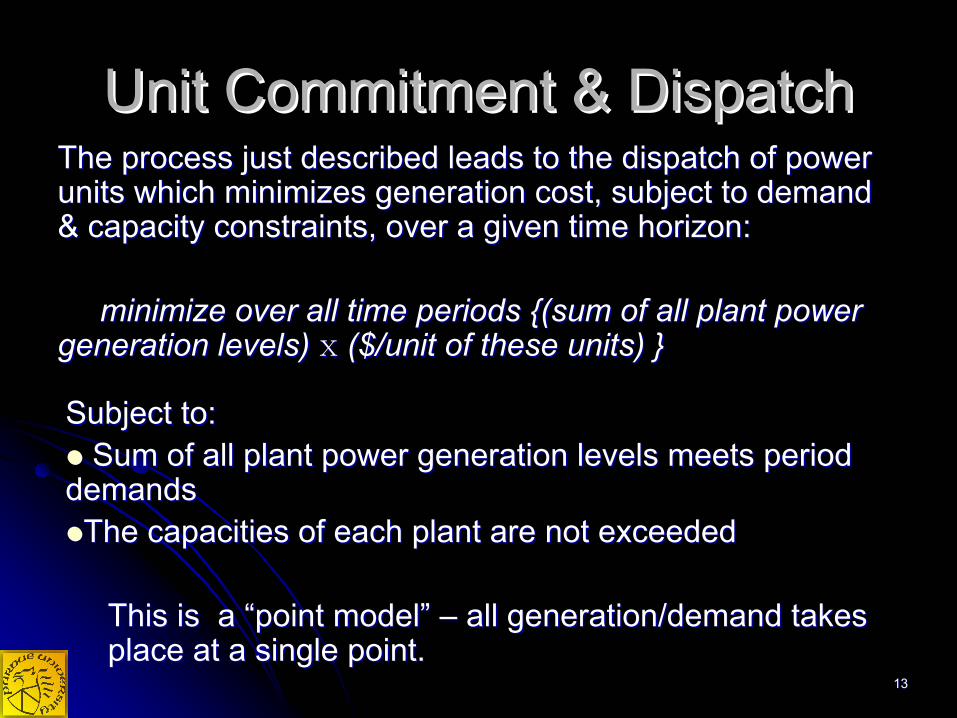
Unit Commitment & DispatchUnit Commitment & DispatchThe process just described leads to the dispatch of power The process just described leads to the dispatch of power units which minimizes generation cost, subject to demand units which minimizes generation cost, subject to demand & capacity constraints, over a given time horizon:& capacity constraints, over a given time horizon:
minimize over all time periods {(sum of all plant power minimize over all time periods {(sum of all plant power generation levels) generation levels) xx ($/unit of these units) }($/unit of these units) }
Subject to:Subject to:Sum of all plant power generation levels meets period Sum of all plant power generation levels meets period
demandsdemandsThe capacities of each plant are not exceededThe capacities of each plant are not exceeded
This is a “point model” This is a “point model” –– all generation/demand takes all generation/demand takes place at a single point. place at a single point.

1414
Model CharacteristicsModel CharacteristicsHow do we modify the model to reflect:How do we modify the model to reflect:(a)(a) Geography?Geography?(b)(b) Transmission losses/capacities?Transmission losses/capacities?(c)(c) Reliability?Reliability?(d)(d) Hydro/Thermal characteristics?Hydro/Thermal characteristics?(e)(e) Possibility of unmet demands or unmet reserve Possibility of unmet demands or unmet reserve
requirements?requirements?(f)(f) Country Autonomy?Country Autonomy?(g)(g) Allowing capacity additions?Allowing capacity additions?

1515
Solution to (a) & (b)?Solution to (a) & (b)?Make the model spatial:Make the model spatial:For whole region:For whole region:Minimize Minimize over all time periods { (cost of regional over all time periods { (cost of regional generation) + (cost of imports) generation) + (cost of imports) –– (revenues from (revenues from exports)}exports)}
Subject to:Subject to:Sum of all regional generation plus imports Sum of all regional generation plus imports
(adjusted for line loss) minus exports, meets (adjusted for line loss) minus exports, meets regional period demands.regional period demands.
The capacities of both generation units & The capacities of both generation units & transmission lines are not exceeded.transmission lines are not exceeded.

1616
Solution to Reliability, (c)?Solution to Reliability, (c)?Require each country/node to have access to enough capacity Require each country/node to have access to enough capacity to meet peak demand plus a reserve margin, allowing regions to meet peak demand plus a reserve margin, allowing regions to hold reserve capacity for each other:to hold reserve capacity for each other:
Minimize over all time periodsMinimize over all time periods {(cost of regional generation) + {(cost of regional generation) + (cost of power imports) + (cost of reserve imports) (cost of power imports) + (cost of reserve imports) -- (revenues (revenues from power exports) from power exports) -- (revenues from reserve exports)}(revenues from reserve exports)}
Subject to:Subject to:Sum of all regional generation plus power imports minus Sum of all regional generation plus power imports minus power exports meets regional demandspower exports meets regional demandsSum of all regional capacities plus capacity imports minus Sum of all regional capacities plus capacity imports minus capacity exports meets regional peak demand plus a capacity exports meets regional peak demand plus a required reserve margin (15required reserve margin (15--20% in U.S.)20% in U.S.)
1717
Solution to Hydro/Thermal Solution to Hydro/Thermal Characteristics (d)?Characteristics (d)?
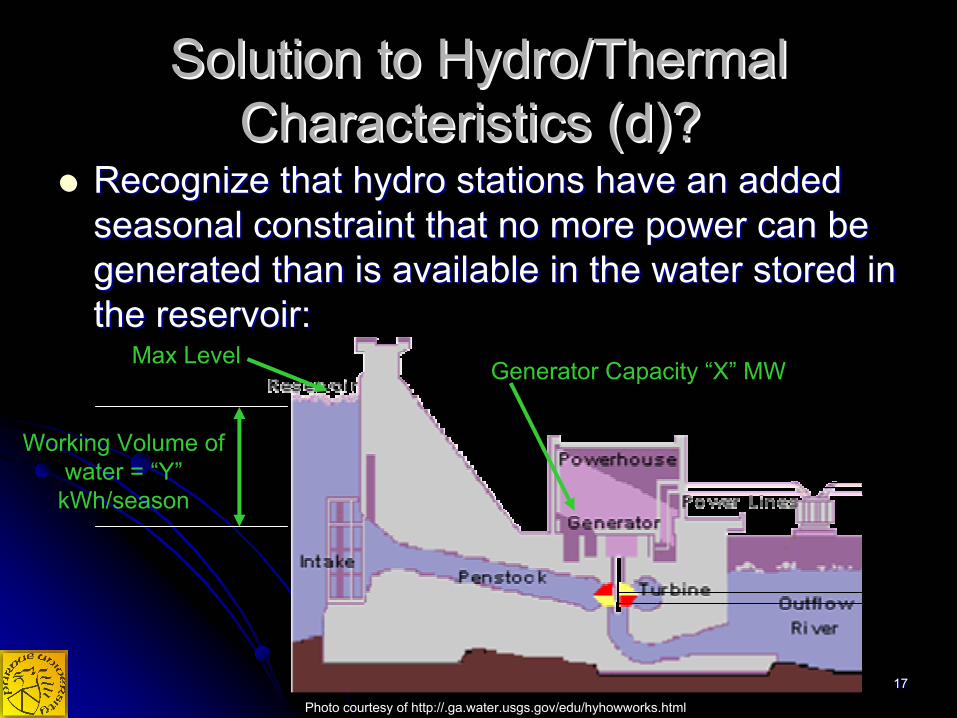
Recognize that hydro stations have an added Recognize that hydro stations have an added seasonal constraint that no more power can be seasonal constraint that no more power can be generated than is available in the water stored in generated than is available in the water stored in the reservoir: the reservoir:
Working Volume of water = “Y”
kWh/season
Max Level Generator Capacity “X” MW
Photo courtesy of http://.ga.water.usgs.gov/edu/hyhowworks.html
1818
Solution to unmet energy demands Solution to unmet energy demands / unmet reserve margins (e)?/ unmet reserve margins (e)?
Unmet Energy: Assume distributed generation Unmet Energy: Assume distributed generation available at fixed cost/kWh, or put in own estimate of available at fixed cost/kWh, or put in own estimate of consumer cost of lost power; serves as another power consumer cost of lost power; serves as another power source in energy demand generation. Current value is source in energy demand generation. Current value is $0.14/kWh (cost of diesel back$0.14/kWh (cost of diesel back--up generator). Having up generator). Having unmet energy requirements means the system must unmet energy requirements means the system must partially depend on high cost distributed generation to partially depend on high cost distributed generation to satisfy demands.satisfy demands.Unmet Reserves: Having unmet reserve capacity Unmet Reserves: Having unmet reserve capacity requirements means the system is not as reliable as it requirements means the system is not as reliable as it should be should be –– the system is vulnerable to system the system is vulnerable to system outages. This cost is hard to quantify: current value is outages. This cost is hard to quantify: current value is set at set at $2000.00/kW.$2000.00/kW.
1919
Country Autonomy (f)?Country Autonomy (f)?Need to protect against overNeed to protect against over--dependence on foreign dependence on foreign
sources of electricitysources of electricityTwo types of restrictions:Two types of restrictions:
a)a) “x%” of electricity must be generated “x%” of electricity must be generated domestically domestically –– a domestic energy (kWh) a domestic energy (kWh) requirement.requirement.
b)b) “y%” of electric demands must be “y%” of electric demands must be capablecapable of of being produced domestically: a domestic being produced domestically: a domestic capacity (MW) requirement (still allows trade in capacity (MW) requirement (still allows trade in kWh).kWh).
In runs that follow, autonomy = 100% for limited In runs that follow, autonomy = 100% for limited trade scenarios (some trade takes place).trade scenarios (some trade takes place).
2020
ShortShort--Term to LongTerm to Long--TermTerm
How to make the ST model into an LT model How to make the ST model into an LT model --allow capacity expansion as demand grows.allow capacity expansion as demand grows.
Convert the model to a multiConvert the model to a multi--year model.year model.Allow new construction with a time lag.Allow new construction with a time lag.Equipment costs entered into objective Equipment costs entered into objective
function by converting onefunction by converting one--time expense into a time expense into a levelized annual cost (as if purchase costs levelized annual cost (as if purchase costs financed by third party).financed by third party).

2121
Demonstration Model InputsDemonstration Model Inputs
GenerationGenerationTransmissionTransmission
Using a generic 7 country/node Using a generic 7 country/node regional modelregional model

Generic Model with Peak Demand (D) & Existing Generation (PG, CC, H) for Each Country
Boundary of regionfor power pool
Country 1D = 3000PG(1A) = 1200PG(1B) = 1600-2500(NH(1C) = 300-900NH(1D) = 600GT(1E) = 800)
Country 2D = 500PG(2A) = 550Country 3
D = 300PG(3A) = 260(GT(3B) = 600)
Country 4D = 1000PG(4A) = 500PG(4B) = 1200-2600(CC(4C) = 300-2100GT(4D) = 300)
Country7D = 400H(7A) = 450(NH(7B) = 200-600)
Country 6D = 300H(6A) = 600(NH(6B) = 150-900)
Country 5D = 2000PG(5A) = 2400(CC(5B) = 350-2800) Key (all values in MW):
D = Electricity DemandPG = Old thermal/oil generationCC= Combined Cycle generationGT= Gas Turbine generationH = Old hydropower generation
All electricity annual demand growth rates are set at 4% for each country
(Italicized values are proposed capacity expansions All PG have 9%/6% forced/unforced outage, 19% reserve requirementAll CC have 3%/2% forced/unforced outage, 19% reserve requirementAll GT have 1%/2% forced/unforced outage, 19% reserve requirementAll H & NH have 1% forced outage, 10% reserve requirement
)

2323
Proposed new gas turbine station capable of expansion up to 600MW with a variable cost of $0.3m/MW. Fuel $6/106Btu
GT(1E)
Proposed new hydro station of 600MW with a fixed cost of $850m
NH(1D)
Proposed new hydro station of 900MW with fixed cost $600m for the first 300MW & then a variable cost of $0.9m/MW
NH(1C)
Existing thermal station, 1600MW (expansion is possible up to 2500MW, costing $0.5m/MW). Fuel $44/MWh
PG(1B)
Existing thermal station, 1200MW. Fuel $68MWh
PG(1A)Country1
Details of StationStation Name
Country

2424
Proposed new gas turbine stations Proposed new gas turbine stations capable of expansion up to 600MW with capable of expansion up to 600MW with a variable cost of $0.31m/MW. Fuel a variable cost of $0.31m/MW. Fuel $7/10$7/1066BtuBtu
GT(3B)GT(3B)
Existing thermal station, 260MW. Fuel Existing thermal station, 260MW. Fuel $25/MWh$25/MWh
PG(3A)PG(3A)CountryCountry33
Existing thermal station, 550MW. Fuel Existing thermal station, 550MW. Fuel $80/MWh$80/MWh
PG(2A)PG(2A)CountryCountry22
Details of StationDetails of StationStation Station NameName
CountryCountry
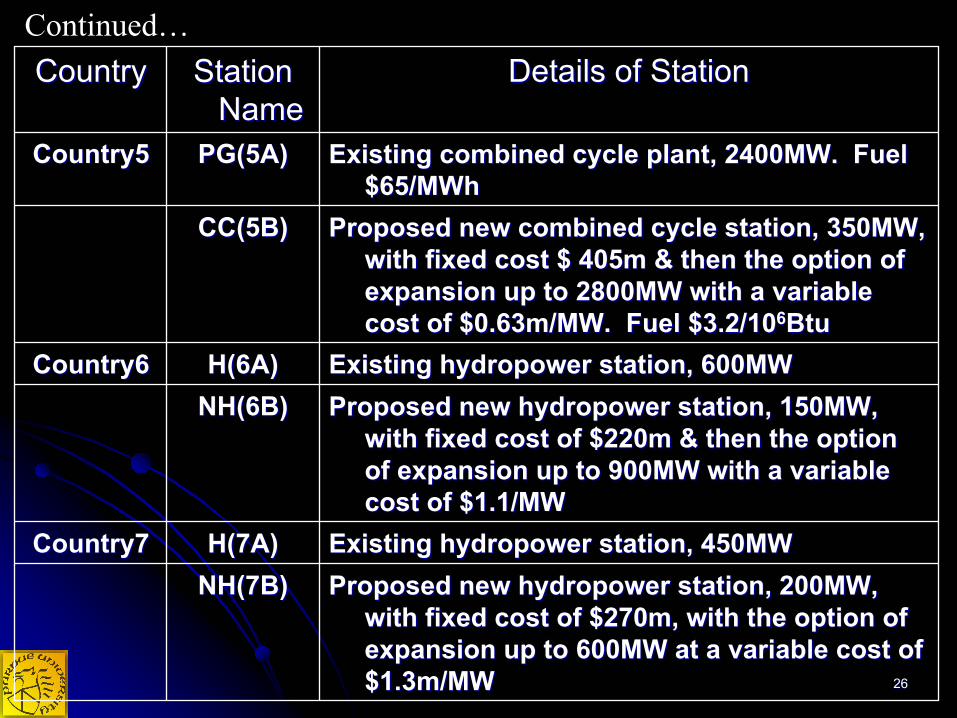
Continued…

2525
Proposed new gas turbine station, 300MW, Proposed new gas turbine station, 300MW, with a variable cost of $0.325m/MW. Fuel with a variable cost of $0.325m/MW. Fuel $5.5/10$5.5/1066BtuBtu
GT(4D)GT(4D)
Proposed new combined cycle station, 300MW, Proposed new combined cycle station, 300MW, with fixed cost of $175m & then the option with fixed cost of $175m & then the option of expansion up to 2100MW with a variable of expansion up to 2100MW with a variable cost of $0.55m/MW. Fuel $3.8/10cost of $0.55m/MW. Fuel $3.8/1066BtuBtu
CC(4C)CC(4C)
Existing combined cycle station, 1200MW, with Existing combined cycle station, 1200MW, with option of expansion up to 2600MW, with a option of expansion up to 2600MW, with a variable cost of $0.6m/MW. Fuel $30/MWhvariable cost of $0.6m/MW. Fuel $30/MWh
PG(4B)PG(4B)
Existing thermal station , 500MW. Fuel Existing thermal station , 500MW. Fuel $59/MWh$59/MWh
PG(4A)PG(4A)Country4Country4
Details of StationDetails of StationStation Station NameName
CountryCountryContinued…
2626
Continued…
Proposed new hydropower station, 200MW, Proposed new hydropower station, 200MW, with fixed cost of $270m, with the option of with fixed cost of $270m, with the option of expansion up to 600MW at a variable cost of expansion up to 600MW at a variable cost of $1.3m/MW$1.3m/MW
NH(7B)NH(7B)Existing hydropower station, 450MWExisting hydropower station, 450MWH(7A)H(7A)Country7Country7
Proposed new hydropower station, 150MW, Proposed new hydropower station, 150MW, with fixed cost of $220m & then the option with fixed cost of $220m & then the option of expansion up to 900MW with a variable of expansion up to 900MW with a variable cost of $1.1/MWcost of $1.1/MW
NH(6B)NH(6B)Existing hydropower station, 600MWExisting hydropower station, 600MWH(6A)H(6A)Country6Country6
Proposed new combined cycle station, 350MW, Proposed new combined cycle station, 350MW, with fixed cost $ 405m & then the option of with fixed cost $ 405m & then the option of expansion up to 2800MW with a variable expansion up to 2800MW with a variable cost of $0.63m/MW. Fuel $3.2/10cost of $0.63m/MW. Fuel $3.2/1066BtuBtu
CC(5B)CC(5B)
Existing combined cycle plant, 2400MW. Fuel Existing combined cycle plant, 2400MW. Fuel $65/MWh$65/MWh
PG(5A)PG(5A)Country5Country5
Details of StationDetails of StationStation Station NameName
CountryCountry

2727
Training Model with Existing International Transmission Lines & Proposed New Lines
Boundary of regionfor power pool
Key (all line values in MW):
12
43
5 6 7
100 100 150
300150
300300
350
Existing LineProposed Line
Italicized values are proposed new line expansions (MW)All lines can expand up to 2000MW

2828
Proposed new international transmission line with an initial carrying capability of 300MW having a fixed cost of $95m This line can be further expanded up to 2000MW with a variable expansion cost of $0.2m/MW
NT(7-1)7 to 1
Proposed new international transmission line with an initial carrying capability of 300MW having a fixed cost of $120m This line can be further expanded up to 2000MW with a variable expansion cost of $0.25m/MW
NT(6-7)6 to 7
Proposed new international transmission line with an initial carrying capability of 150MW having a fixed cost of $88m This line can be further expanded up to 750MW with a variable expansion cost of $0.15m/MW.
NT(6-2)6 to 2
Proposed new international transmission line with an initial carrying capability of 300MW having a fixed cost of $40m This line can be further expanded up to 750MW with a variable expansion cost of $0.22m/MW.
NT(5-6)5 to 6
Proposed new international transmission line with an initial carrying capability of 350MW having a fixed cost of $100m. This line can be further expanded up to 2000MW with a variable expansion cost of $0.16m/MW.
NT(4-5)4 to 5
Existing international transmission line with a total load carrying capability of 150MW –can be expanded up to 2000MW at a cost of $0.15/MWOT(3-4)3 to 4
Existing international transmission line with a total load carrying capability of 100MW –can be expanded up to 2000MW at a cost of $0.25/MWOT(2-3)2 to 3
Existing international transmission line with a total load carrying capability of 100MW –can be expanded up to 2000MW at a cost of $0.2m/MWOT(1-2)1 to 2
Details of International InterconnectorInterconnector Name
From CountryTo Country
Existing & Proposed International Transmission Lines

2929
Country DataCountry Data

3030
Demonstration Model OutputsDemonstration Model Outputs
Four Scenarios (2*ST & 2*LT)Four Scenarios (2*ST & 2*LT)ST & LT each have limited trade & free ST & LT each have limited trade & free trade scenarios.trade scenarios.Aggregate reports.Aggregate reports.Country Reports Country Reports –– Focus on countries 2, 3 Focus on countries 2, 3 & 4& 4Digging Deeper (Appendix)Digging Deeper (Appendix)
3131
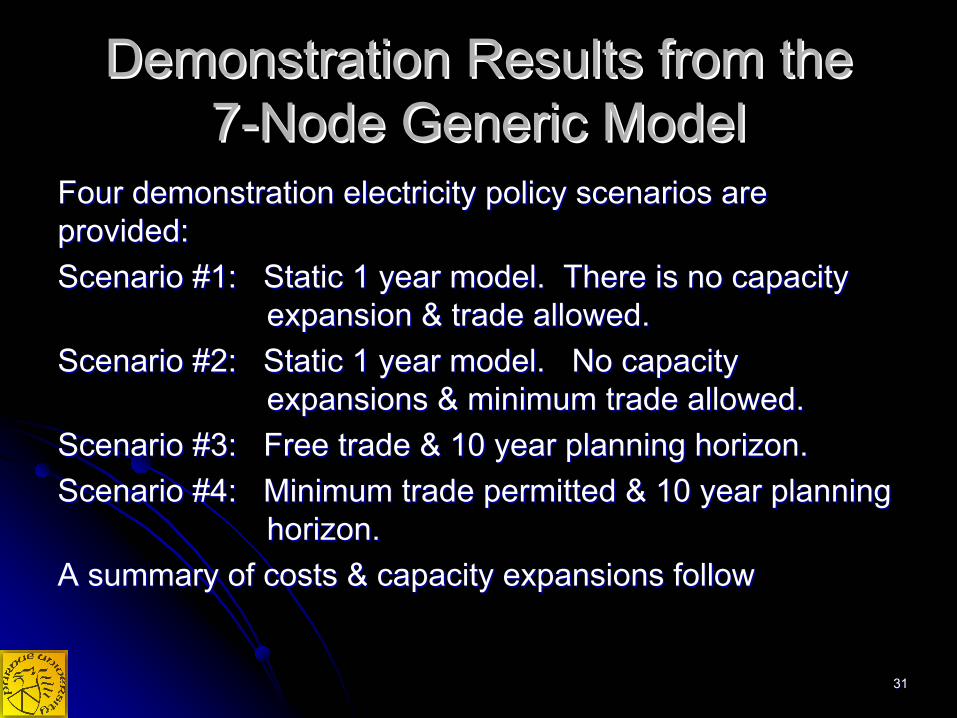
Demonstration Results from the Demonstration Results from the 77--Node Generic ModelNode Generic Model
Four demonstration electricity policy scenarios are Four demonstration electricity policy scenarios are provided:provided:Scenario #1: Static 1 year model. There is no capacity Scenario #1: Static 1 year model. There is no capacity
expansion & trade allowed.expansion & trade allowed.Scenario #2: Static 1 year model. No capacity Scenario #2: Static 1 year model. No capacity
expansions & minimum trade allowed.expansions & minimum trade allowed.Scenario #3: Free trade & 10 year planning horizon.Scenario #3: Free trade & 10 year planning horizon.Scenario #4: Minimum trade permitted & 10 year planning Scenario #4: Minimum trade permitted & 10 year planning
horizon.horizon.A summary of costs & capacity expansions followA summary of costs & capacity expansions follow

3232
Summary of Projects Selection for Summary of Projects Selection for the Three Policy Scenariosthe Three Policy Scenarios
2.860.631.881.62Unmet Reserve Margin, MW ($bn)
1.590.650.370.35Unserved Energy, MWh ($bn)2.423.2900Capacity capital costs ($bn)
11.138.592.062.02Operational Costs ($bn)18.1413.324.344.03Total regional cost ($bn)
Scenario #4
10 years4% growthMin. Trade
Scenario #3
10 years4% growthFree Trade
Scenario #2
1 year staticMin.
Trade
Scenario #1
1 year static
Free Trade

3333
Continued…Continued…Scenario
#410 years
4% growth
Min. Trade
Scenario #3
10 years4% growth
Free Trade
Scenario #2
1 year staticMin.
Trade
Scenario #1
1 year static Free
Trade
02,03100New Transmission MW)083300Old Transmission (MW)
Transmission Expansion (MW)427000New Gas Turbines (MW)
1,4792,34200New Hydropower (MW)3,1113,55300New Combined Cycle (MW)90095500Old Thermal (MW)
Generation Expansions (MW)
3434
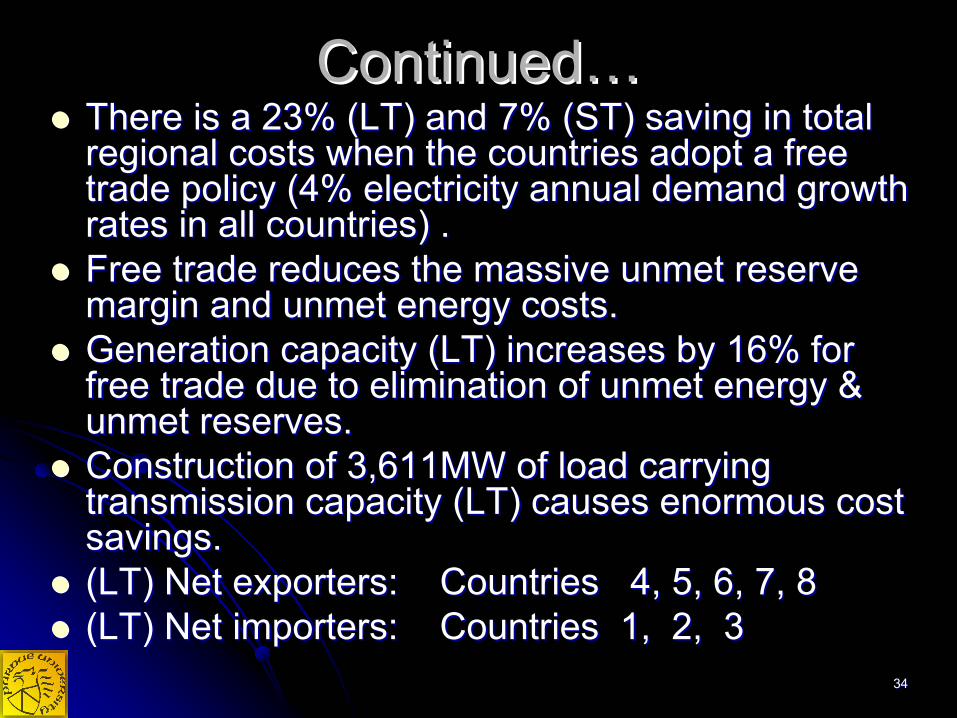
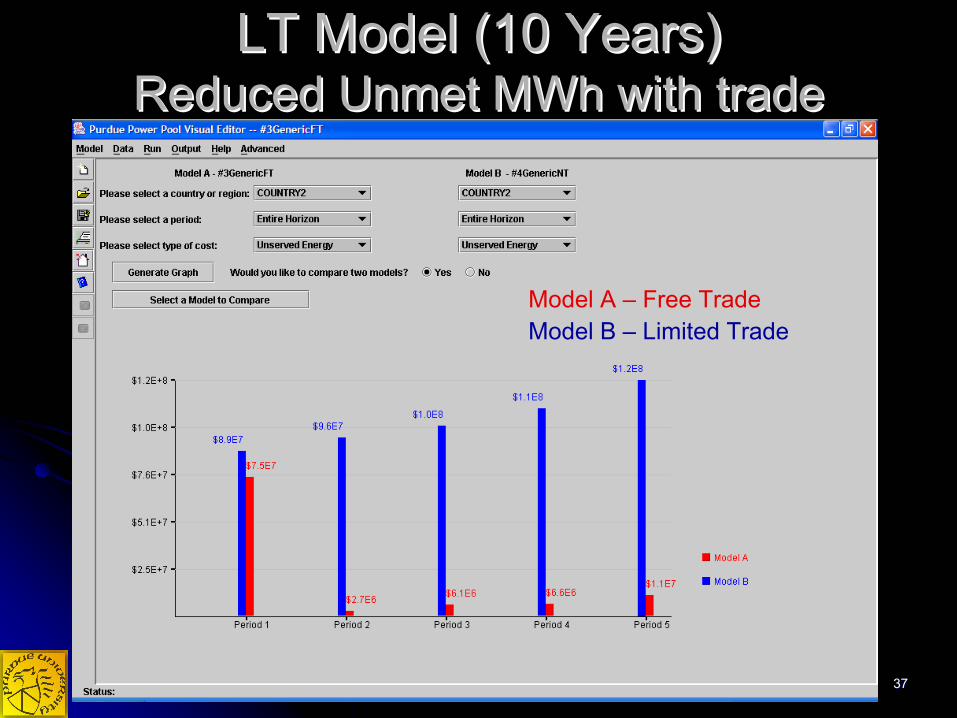
Continued…Continued…There is a 23% (LT) and 7% (ST) saving in total There is a 23% (LT) and 7% (ST) saving in total regional costs when the countries adopt a free regional costs when the countries adopt a free trade policy (4% electricity annual demand growth trade policy (4% electricity annual demand growth rates in all countries) .rates in all countries) .Free trade reduces the massive unmet reserve Free trade reduces the massive unmet reserve margin and unmet energy costs.margin and unmet energy costs.Generation capacity (LT) increases by 16% for Generation capacity (LT) increases by 16% for free trade due to elimination of unmet energy & free trade due to elimination of unmet energy & unmet reserves. unmet reserves. Construction of 3,611MW of load carrying Construction of 3,611MW of load carrying transmission capacity (LT) causes enormous cost transmission capacity (LT) causes enormous cost savings.savings.(LT) Net exporters: Countries 4, 5, 6, 7, 8(LT) Net exporters: Countries 4, 5, 6, 7, 8(LT) Net importers: Countries 1, 2, 3(LT) Net importers: Countries 1, 2, 3
3535
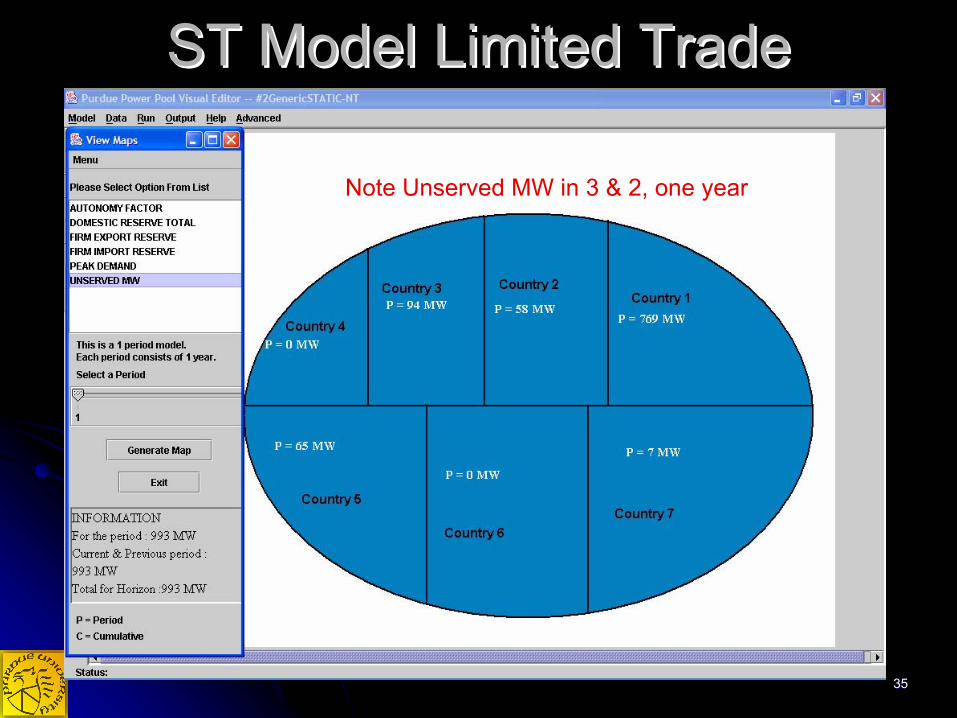
ST Model Limited TradeST Model Limited Trade
Note Unserved MW in 3 & 2, one year

3636
ST Model With TradeST Model With Trade
Note small unserved MW only in 2, one year
3737
LT Model (10 Years) LT Model (10 Years) Reduced Unmet MWh with tradeReduced Unmet MWh with trade
Model A – Free TradeModel B – Limited Trade
3838
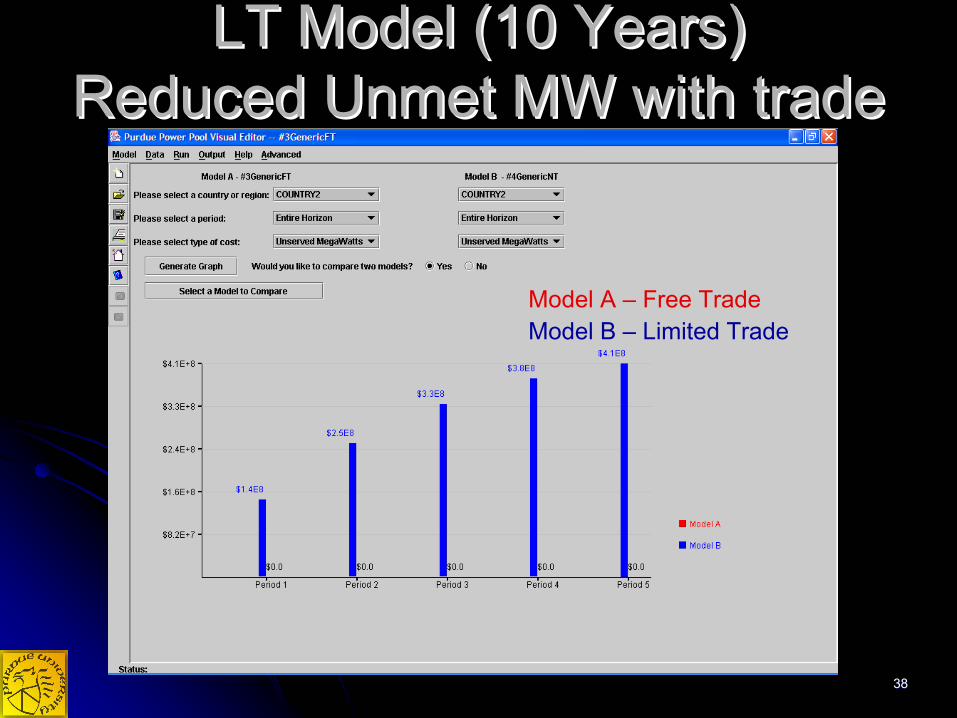
LT Model (10 Years) LT Model (10 Years) Reduced Unmet MW with tradeReduced Unmet MW with trade
Model A – Free TradeModel B – Limited Trade

3939
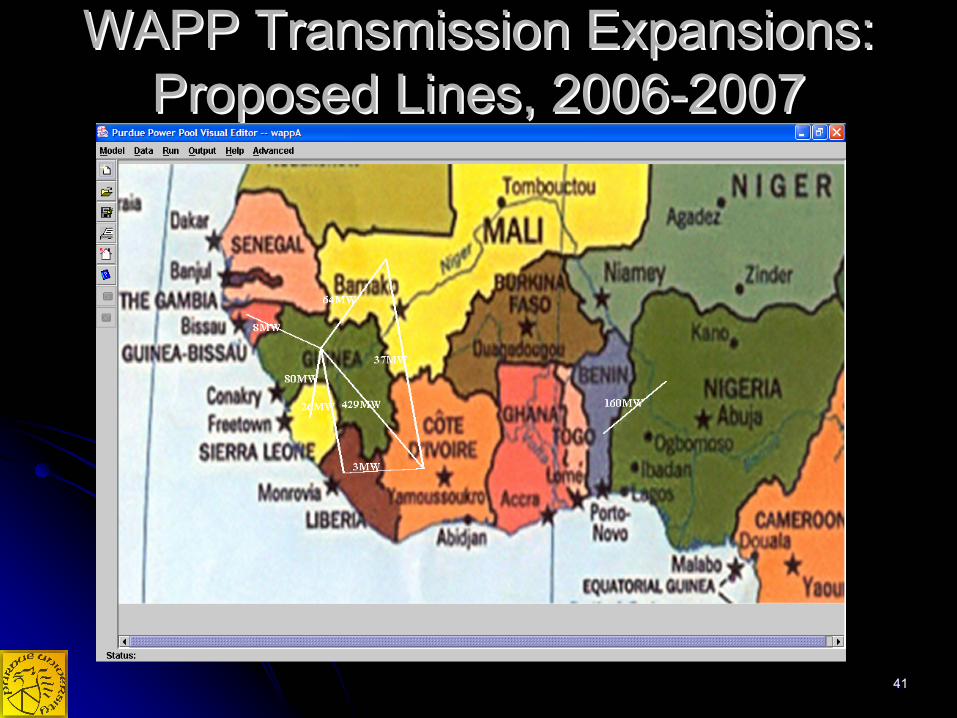
Examples From WAPP Examples From WAPP (West Africa Power Pool)(West Africa Power Pool)
Consider the WAPP LT model & the effects Consider the WAPP LT model & the effects on trade from changes in demand & the use on trade from changes in demand & the use of natural gas for of natural gas for Ghana & NigeriaGhana & Nigeria. .
First, let’s look at the international First, let’s look at the international transmission line expansion plan.transmission line expansion plan.

4040
WAPP Transmission Expansions: WAPP Transmission Expansions: Existing Lines, 2006Existing Lines, 2006--20072007
4141
WAPP Transmission Expansions: WAPP Transmission Expansions: Proposed Lines, 2006Proposed Lines, 2006--20072007
4242
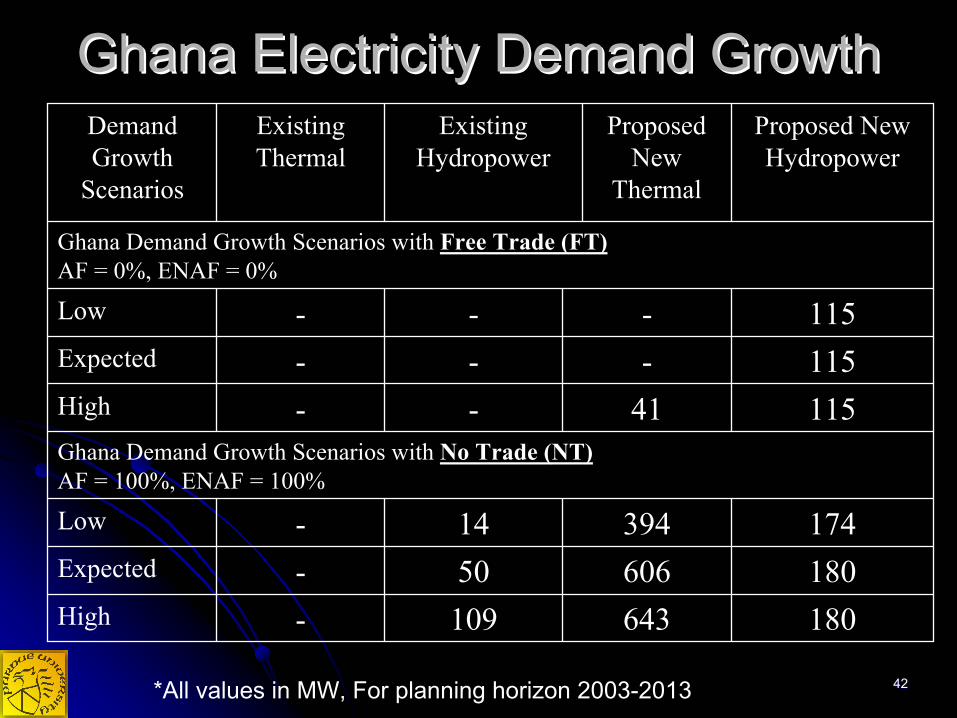
Ghana Electricity Demand GrowthGhana Electricity Demand Growth
180643109-High18060650-Expected17439414-Low
Ghana Demand Growth Scenarios with No Trade (NT)AF = 100%, ENAF = 100%
11541--High115---Expected115---Low
Ghana Demand Growth Scenarios with Free Trade (FT)AF = 0%, ENAF = 0%
Proposed New Hydropower
Proposed New
Thermal
Existing Hydropower
Existing Thermal
Demand Growth
Scenarios
*All values in MW, For planning horizon 2003-2013

4343
Choice of TechnologyChoice of TechnologyPolicy concerning the use of Nigeria’s flared Policy concerning the use of Nigeria’s flared natural gas has immense impact on a future natural gas has immense impact on a future fully integrated West Africa Power Pool.fully integrated West Africa Power Pool.
The choice is gas exports or gasThe choice is gas exports or gas--byby--wire wire exports.exports.
Impact upon Ghana & Nigeria is now Impact upon Ghana & Nigeria is now illustrated (with free trade 2003illustrated (with free trade 2003--2013).2013).

4444
Ghana Energy TradeGhana Energy TradeWith With CC (Natural Gas) Expansion in NigeriaCC (Natural Gas) Expansion in Nigeria
Ghana MWh imports
Ghana MWh exports

4545
Ghana Energy Trade Ghana Energy Trade No CC (No CC (Natural Gas) Expansion in NigeriaNatural Gas) Expansion in Nigeria
Ghana MWh imports
Ghana MWh exports

4646
Cost to Nigeria & Natural Gas 2003Cost to Nigeria & Natural Gas 2003--20132013
0.0030.77Revenue from Exports
3.7320.006Cost of Imports
12.2336.822Total Cost after gains from trade
8.5047.586Total Cost before gains from trade
Limited Use of Natural Gas
($billions) (Gas Exports)
Full Use of Natural Gas
($billions)(Gas-By-Wire)

4747
Nigeria’s Investment Strategy:Nigeria’s Investment Strategy:
Model A – Natural Gas Expansions in Nigeria
Model B – Limited Natural Gas Expansions in Nigeria

4848
AppendixAppendix
Digging DeeperDigging Deeper

4949
ShortShort--Term Model ResultsTerm Model ResultsCountries 2, 3 & 4 (one year)Countries 2, 3 & 4 (one year)
A) Limited Trade Case (Total Cost $4.34 billion)
D = 1040 MW
S = 1200 + 500 MW
4
D = 312 MW
S= 218 MW
3
D = 520 MW
S = 462 MW
2
Unmet reserves = 0Unmet energy ~= 0Generation = 7.04*106 MWhCost = $244*106 (0% unmet costs)
Unmet reserves = 94 MWUnmet energy = .34*106 MWhGeneration = 1.79*106 MWhCost = $271*106 (67% unmet costs)
Unmet reserves = 58 MWUnmet energy = .33*106 MWhGeneration = 3.73*106 MWhCost = $411*106 (87% unmet costs)
Summary: Lack of trade means countries 2 & 3 are being provided with high cost low reliability power while 4’s excess capacity sits idle.
5050
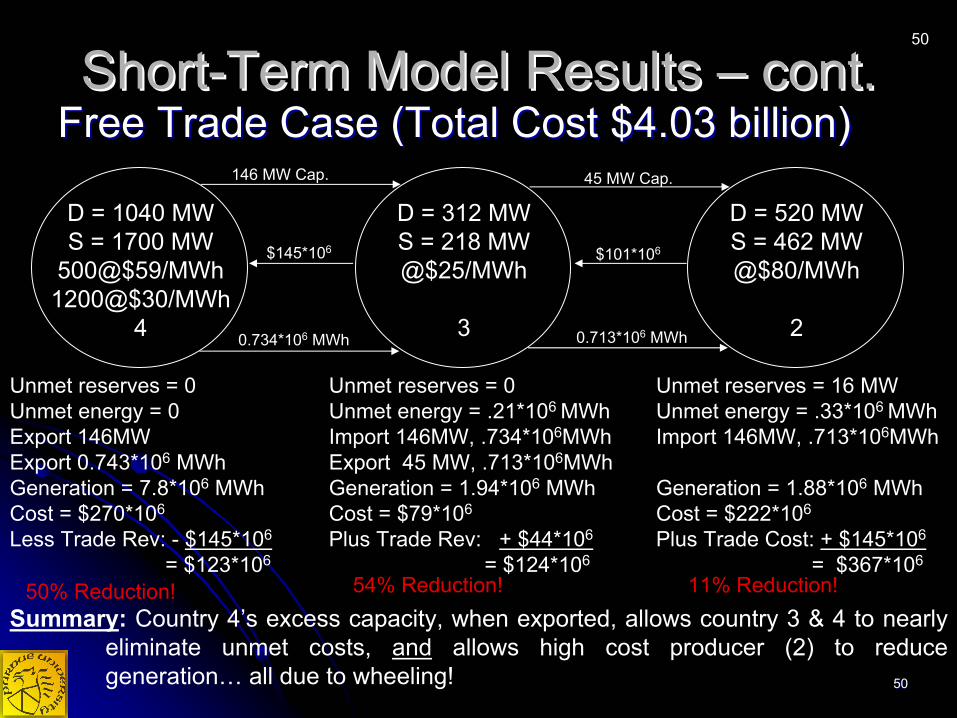
ShortShort--Term Model Results Term Model Results –– cont.cont.Free Trade Case (Total Cost $4.03 billion)Free Trade Case (Total Cost $4.03 billion)
D = 1040 MWS = 1700 MW
500@$59/MWh1200@$30/MWh
4
Unmet reserves = 0Unmet energy = 0Export 146MWExport 0.743*106 MWhGeneration = 7.8*106 MWhCost = $270*106
Less Trade Rev: - $145*106
= $123*106
Summary: Country 4’s excess capacity, when exported, allows country 3 & 4 to nearly eliminate unmet costs, and allows high cost producer (2) to reduce generation… all due to wheeling!
D = 520 MWS = 462 MW@$80/MWh
2
D = 312 MWS = 218 MW@$25/MWh
3
Unmet reserves = 0Unmet energy = .21*106 MWhImport 146MW, .734*106MWhExport 45 MW, .713*106MWhGeneration = 1.94*106 MWhCost = $79*106
Plus Trade Rev: + $44*106
= $124*106
Unmet reserves = 16 MWUnmet energy = .33*106 MWhImport 146MW, .713*106MWh
Generation = 1.88*106 MWhCost = $222*106
Plus Trade Cost: + $145*106
= $367*106
50% Reduction! 54% Reduction! 11% Reduction!
50
146 MW Cap.
$145*106 $101*106
0.734*106 MWh 0.713*106 MWh
45 MW Cap.

5151
LongLong--Term Model ResultsTerm Model ResultsA) Limited Trade Case (Total Cost $18.1 billion)
D = 1040 MWGrow @4%/year
S = 1200 + 500 MWBuilds 1011MW of CC
4
New CC Capacity built to replace more expensive existing capacityTotal Horizon Cost: $1.9*109
New CT capacity allows country to keep unmet costs insignificant.Total Horizon Cost: $1.27*109
- 0.15*109
$1.12*109
Summary: 3 cuts unmet costs by building new capacity, 2 still in trouble, 4 builds new capacity to replace expensive old capacity.
D = 312 MWGrow @4%/year
S = 218 MWBuilds 227 MW of CT
3
D = 520 MW
S = 462 MWNo Projects Available
2
Since no projects available, problems compound as D grows, S decays: unmet costs grow.Total Horizon Cost: $3.99*109
- 0.02*109
$3.97*109
5252
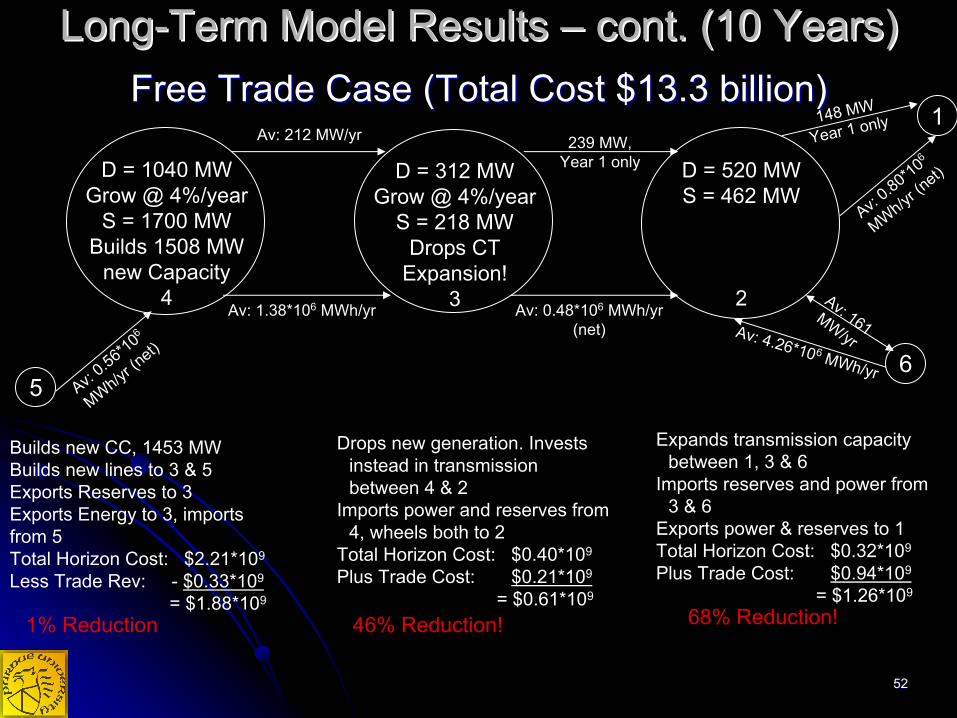
LongLong--Term Model Results Term Model Results –– cont. (10 Years)cont. (10 Years)Free Trade Case (Total Cost $13.3 billion)Free Trade Case (Total Cost $13.3 billion)
Builds new CC, 1453 MWBuilds new lines to 3 & 5Exports Reserves to 3Exports Energy to 3, imports from 5Total Horizon Cost: $2.21*109
Less Trade Rev: - $0.33*109
= $1.88*109
1% Reduction 46% Reduction! 68% Reduction!
D = 1040 MWGrow @ 4%/year
S = 1700 MWBuilds 1508 MW
new Capacity4
D = 520 MWS = 462 MW
2
D = 312 MWGrow @ 4%/year
S = 218 MWDrops CT
Expansion!3
Av: 212 MW/yr
Drops new generation. Invests instead in transmission between 4 & 2
Imports power and reserves from 4, wheels both to 2
Total Horizon Cost: $0.40*109
Plus Trade Cost: $0.21*109
= $0.61*109
Expands transmission capacity between 1, 3 & 6
Imports reserves and power from 3 & 6
Exports power & reserves to 1Total Horizon Cost: $0.32*109
Plus Trade Cost: $0.94*109
= $1.26*109
239 MW,Year 1 only
1
65
Av: 161MW/yrAv: 4.26*106 MWh/yrAv: 0
.56*106
MWh/yr (n
et)
148 MW
Year 1 only
Av: 1.38*106 MWh/yr Av: 0.48*106 MWh/yr(net)
Av: 0.80*106
MWh/yr (n
et)

5353
In SummaryIn Summary
Gains from trade can be substantialGains from trade can be substantial
Bilateral trades are too restrictiveBilateral trades are too restrictive
Consider the benefits of wheelingConsider the benefits of wheeling
Alternative methods to share gains from Alternative methods to share gains from
trade need to be consideredtrade need to be considered