electricity in minnesota history of the system, today’s grid, and where the electricity goes...
Post on 21-Dec-2015
237 views
TRANSCRIPT
Electricity in Minnesota
History of the System, Today’s Grid, and Where the Electricity Goes
6/21/2011
A Timeline of Minnesota’s Electrical System

1840-1870 Hydro-mechanical power. Saw mills stood along a dam that crossed the Mississippi River’s East Channel a few blocks north of Water Power Park down on Saint Anthony Main.
1870 Jay Cooke purchases land on both side of the Saint Louis River in anticipation of a hydroelectric plant.
1871George Wright, builds Central Dam along the Otter Tail River.
1882Minnesota Brush Electric Company builds a power station on the west bank of the Mississippi. Minnesota Brush shuts down the brush electric station in 1894 and replaces it with a steam-powered generating plant near Fourth Avenue North and the Mississippi.
1882Vernon Wright inherits Central Dam from his father.
1894Minneapolis General Electric Company builds the first Main Street Power Station, a water and steam power plant. Main Street Station was also a transformer substation, which “stepped down” high voltage power into lower voltage for consumer use.
1905Minnesota Power’s predecessor company builds a hydroelectric dam on the St. Louis River in Duluth.
1909 H.M. Byllesby forms the Washington County Light & Power Company, a subsidiary of his utilities conglomerate, Consumers Power Company.
1909Dayton Hollow Hydroelectric Plant (Otter Tail Power Co.) goes online .
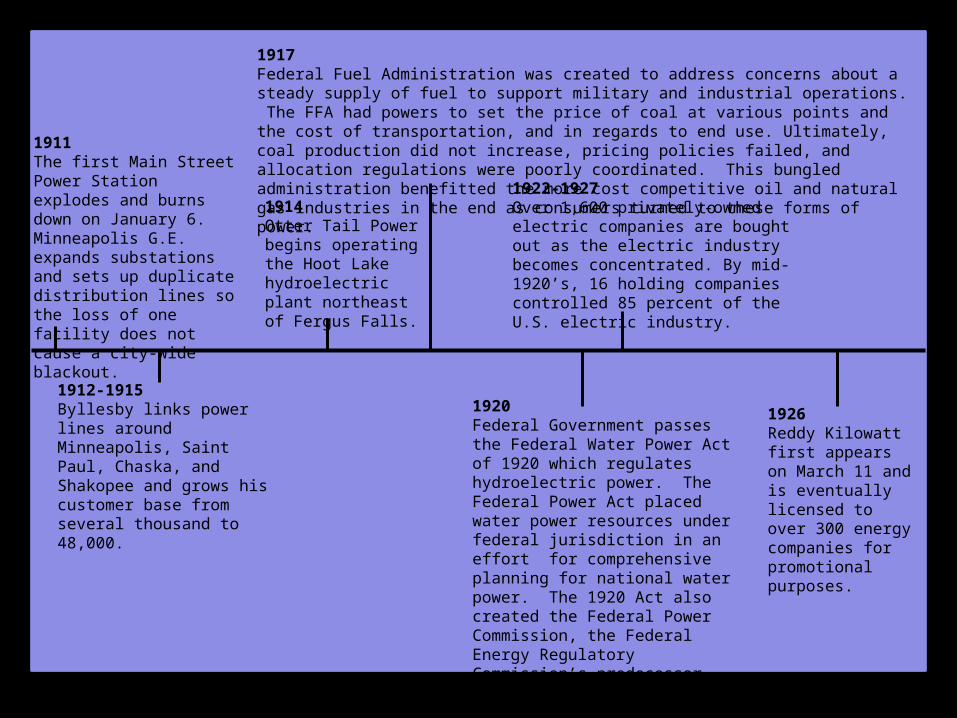
1911The first Main Street Power Station explodes and burns down on January 6. Minneapolis G.E. expands substations and sets up duplicate distribution lines so the loss of one facility does not cause a city-wide blackout.
1914Otter Tail Power begins operating the Hoot Lake hydroelectric plant northeast of Fergus Falls.
1912-1915Byllesby links power lines around Minneapolis, Saint Paul, Chaska, and Shakopee and grows his customer base from several thousand to 48,000.
1917Federal Fuel Administration was created to address concerns about a steady supply of fuel to support military and industrial operations. The FFA had powers to set the price of coal at various points and the cost of transportation, and in regards to end use. Ultimately, coal production did not increase, pricing policies failed, and allocation regulations were poorly coordinated. This bungled administration benefitted the more cost competitive oil and natural gas industries in the end as consumers turned to these forms of power.
1920Federal Government passes the Federal Water Power Act of 1920 which regulates hydroelectric power. The Federal Power Act placed water power resources under federal jurisdiction in an effort for comprehensive planning for national water power. The 1920 Act also created the Federal Power Commission, the Federal Energy Regulatory Commission’s predecessor.
1922-1927Over 1,600 privately-owned electric companies are bought out as the electric industry becomes concentrated. By mid-1920’s, 16 holding companies controlled 85 percent of the U.S. electric industry.
1926Reddy Kilowatt first appears on March 11 and is eventually licensed to over 300 energy companies for promotional purposes.
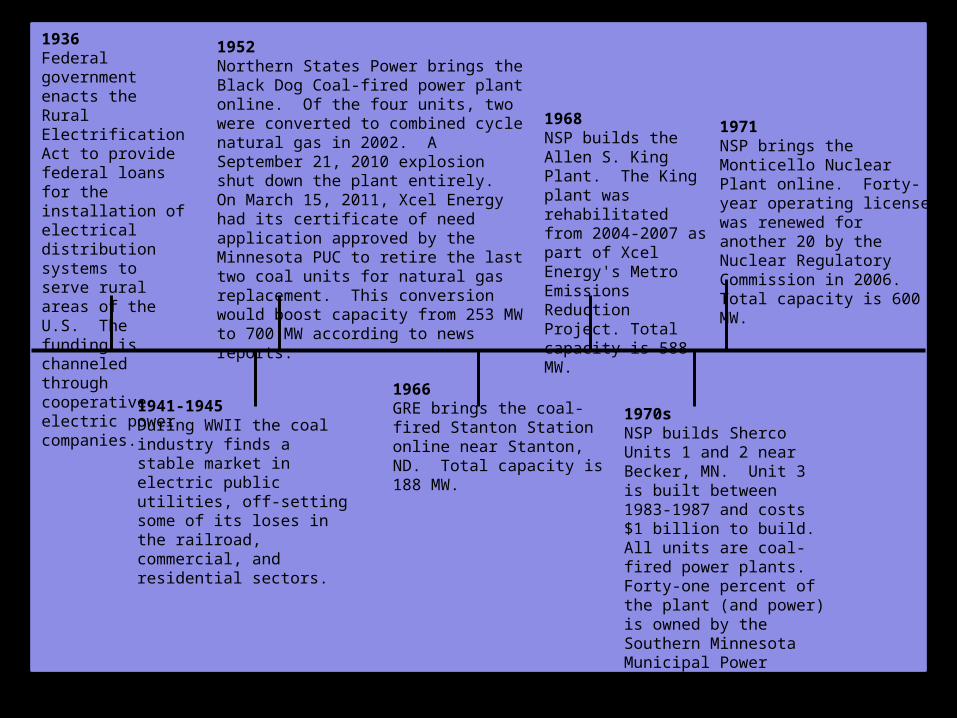
1936Federal government enacts the Rural Electrification Act to provide federal loans for the installation of electrical distribution systems to serve rural areas of the U.S. The funding is channeled through cooperative electric power companies.
1941-1945During WWII the coal industry finds a stable market in electric public utilities, off-setting some of its loses in the railroad, commercial, and residential sectors.
1952Northern States Power brings the Black Dog Coal-fired power plant online. Of the four units, two were converted to combined cycle natural gas in 2002. A September 21, 2010 explosion shut down the plant entirely. On March 15, 2011, Xcel Energy had its certificate of need application approved by the Minnesota PUC to retire the last two coal units for natural gas replacement. This conversion would boost capacity from 253 MW to 700 MW according to news reports.
1966GRE brings the coal-fired Stanton Station online near Stanton, ND. Total capacity is 188 MW.
1968NSP builds the Allen S. King Plant. The King plant was rehabilitated from 2004-2007 as part of Xcel Energy's Metro Emissions Reduction Project. Total capacity is 588 MW.
1970sNSP builds Sherco Units 1 and 2 near Becker, MN. Unit 3 is built between 1983-1987 and costs $1 billion to build. All units are coal-fired power plants. Forty-one percent of the plant (and power) is owned by the Southern Minnesota Municipal Power Agency. Total plant capacity is 2,400 MW.
1971NSP brings the Monticello Nuclear Plant online. Forty-year operating license was renewed for another 20 by the Nuclear RegulatoryCommission in 2006. Total capacity is 600 MW.
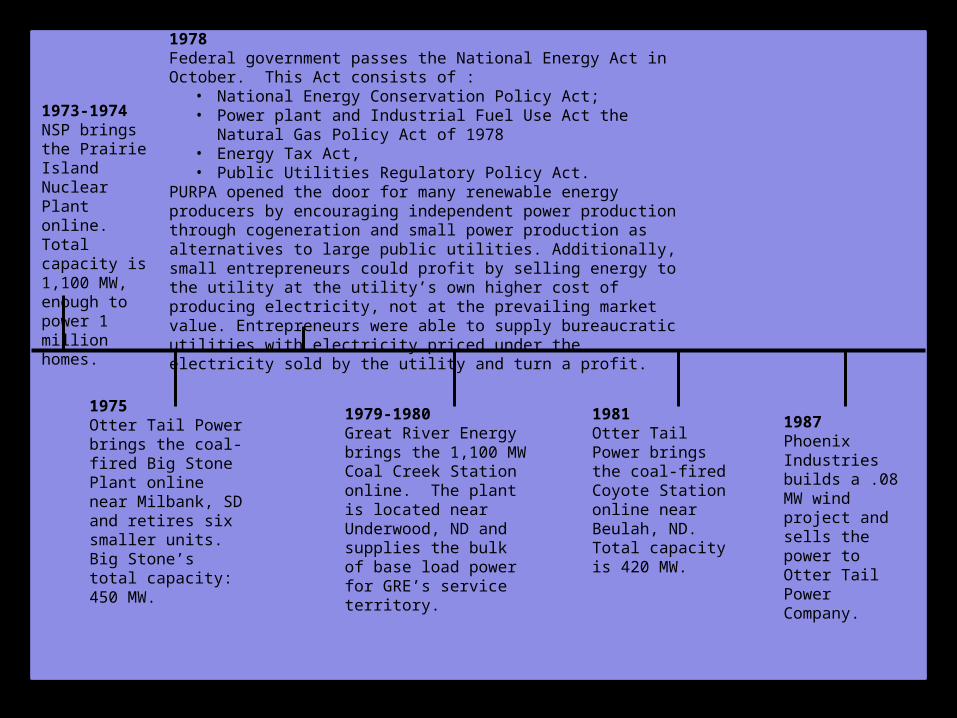
1973-1974NSP brings the Prairie Island Nuclear Plant online. Total capacity is 1,100 MW, enough to power 1 million homes.
1975Otter Tail Power brings the coal-fired Big Stone Plant online near Milbank, SD and retires six smaller units. Big Stone’s total capacity: 450 MW.
1978Federal government passes the National Energy Act in October. This Act consists of :
• National Energy Conservation Policy Act;• Power plant and Industrial Fuel Use Act the Natural Gas Policy Act
of 1978• Energy Tax Act,• Public Utilities Regulatory Policy Act.
PURPA opened the door for many renewable energy producers by encouraging independent power production through cogeneration and small power production as alternatives to large public utilities. Additionally, small entrepreneurs could profit by selling energy to the utility at the utility’s own higher cost of producing electricity, not at the prevailing market value. Entrepreneurs were able to supply bureaucratic utilities with electricity priced under the electricity sold by the utility and turn a profit.
1979-1980Great River Energy brings the 1,100 MW Coal Creek Station online. The plant is located near Underwood, ND and supplies the bulk of base load power for GRE’s service territory.
1981Otter Tail Power brings the coal-fired Coyote Station online near Beulah, ND. Total capacity is 420 MW.
1987Phoenix Industries builds a .08 MW wind project and sells the power to Otter Tail Power Company.
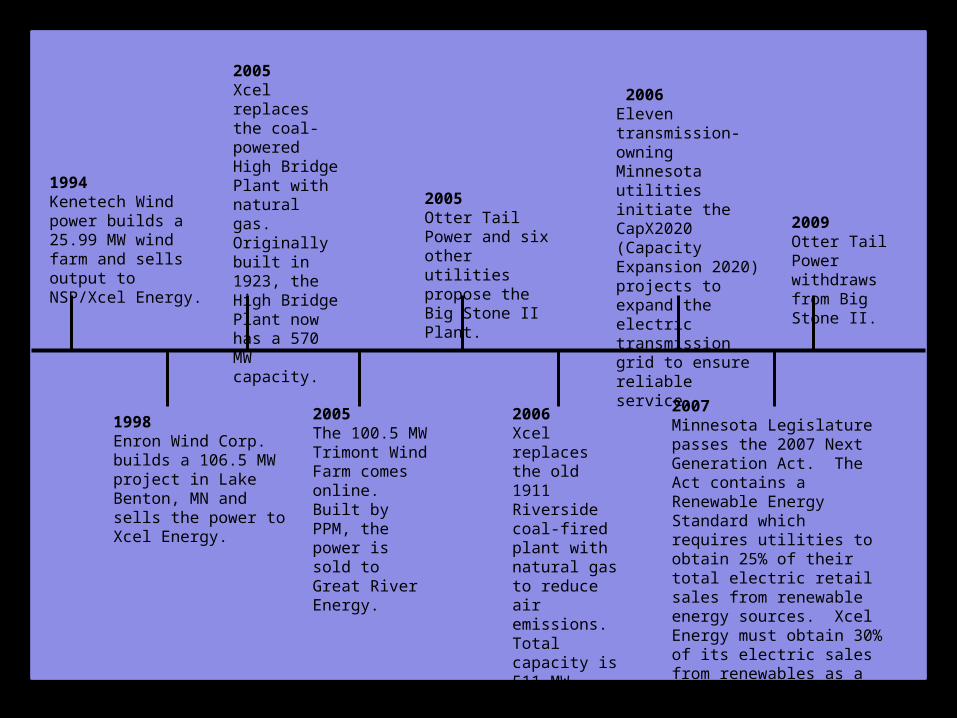
1994Kenetech Wind power builds a 25.99 MW wind farm and sells output to NSP/Xcel Energy.
1998Enron Wind Corp. builds a 106.5 MW project in Lake Benton, MN and sells the power to Xcel Energy.
2005Xcel replaces the coal-powered High Bridge Plant with natural gas. Originally built in 1923, the High Bridge Plant now has a 570 MW capacity.
2005The 100.5 MW Trimont Wind Farm comes online. Built by PPM, the power is sold to Great River Energy.
2005Otter Tail Power and six other utilities propose the Big Stone II Plant.
2006Xcel replaces the old 1911 Riverside coal-fired plant with natural gas to reduce air emissions. Total capacity is 511 MW.
2006Eleven transmission-owning Minnesota utilities initiate the CapX2020 (Capacity Expansion 2020) projects to expand the electric transmission grid to ensure reliable service.
2007Minnesota Legislature passes the 2007 Next Generation Act. The Act contains a Renewable Energy Standard which requires utilities to obtain 25% of their total electric retail sales from renewable energy sources. Xcel Energy must obtain 30% of its electric sales from renewables as a trade off for nuclear waste facilities.
2009Otter Tail Power withdraws from Big Stone II.
THE CURRENT ELECTRICAL SYSTEM WHERE WE’RE AT
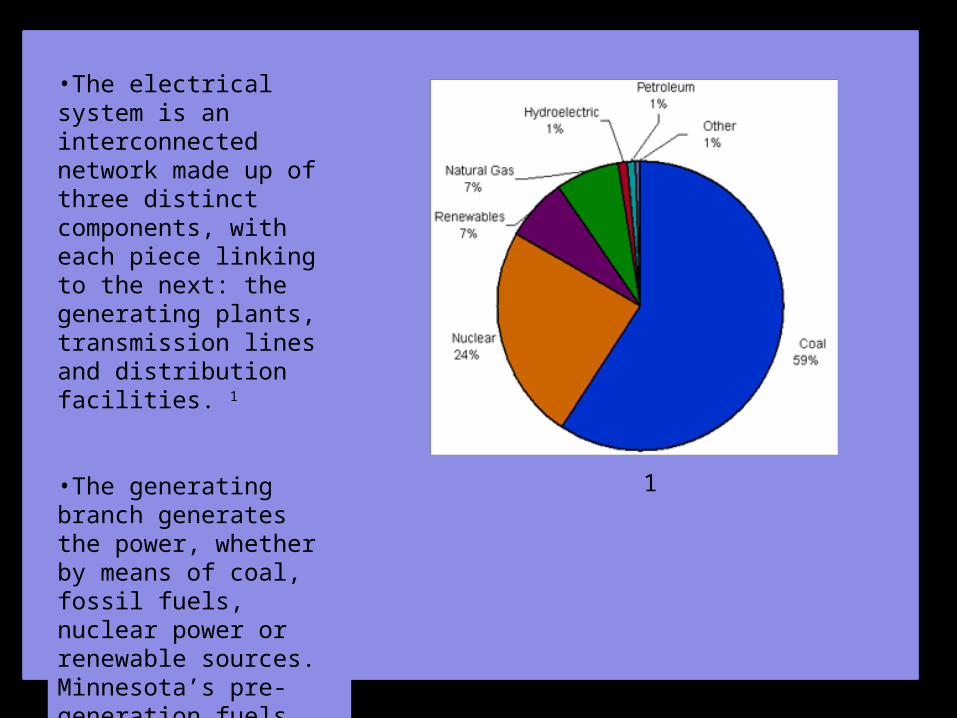
•The electrical system is an interconnected network made up of three distinct components, with each piece linking to the next: the generating plants, transmission lines and distribution facilities. 1
•The generating branch generates the power, whether by means of coal, fossil fuels, nuclear power or renewable sources. Minnesota’s pre-generation fuels are pictured at right.” 2
1
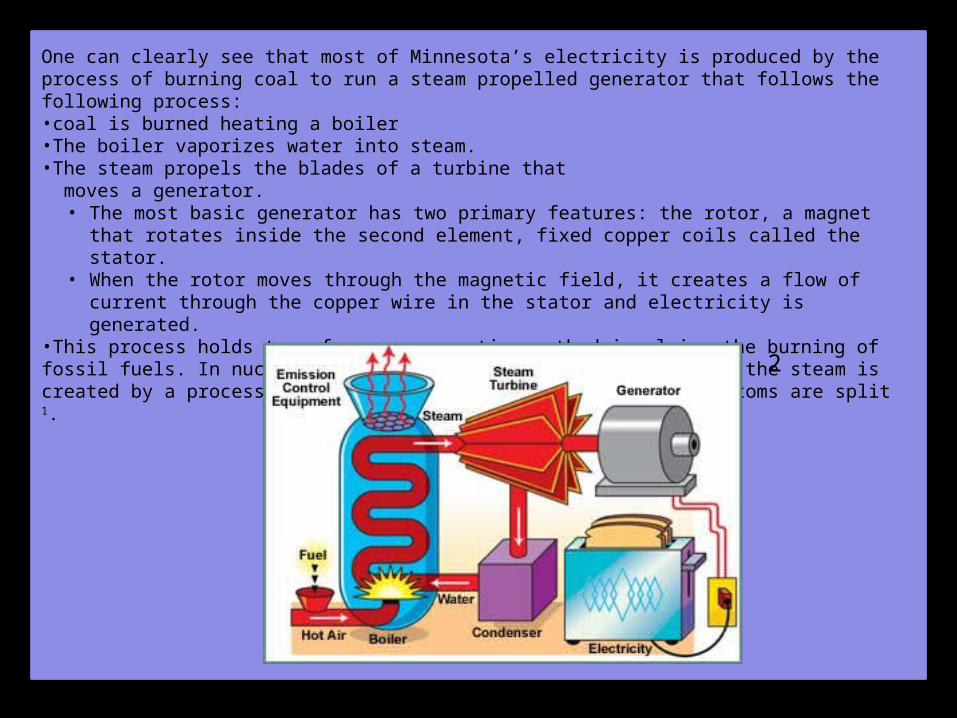
One can clearly see that most of Minnesota’s electricity is produced by the process of burning coal to run a steam propelled generator that follows the following process: •coal is burned heating a boiler •The boiler vaporizes water into steam. •The steam propels the blades of a turbine that moves a generator.
• The most basic generator has two primary features: the rotor, a magnet that rotates inside the second element, fixed copper coils called the stator.
• When the rotor moves through the magnetic field, it creates a flow of current through the copper wire in the stator and electricity is generated.
•This process holds true for any generation method involving the burning of fossil fuels. In nuclear generation the process is similar but the steam is created by a process called nuclear fission in which Uranium atoms are split 1.
2

2
Before entering the grid the voltage must be raised or “stepped-up” to minimize energy losses associated with transmission .3 The electricity then flows along the transmission grid to another substation where it is “stepped down” to a lower voltage before it is distributed. The decrease in voltage allows the utility to use smaller wires and poles to deliver power to consumers. Before its final distribution to residential and commercial customers, the voltage is stepped down once again as it exits the distribution lines for its final destination.”4

The distinction between the transmission and distribution branches is somewhat murky and it would appear on the surface level that they perform essentially the same tasks. However, in their 2008 report on Energy Policy and Conservation the Office of Energy Security (now the Division of Energy resources) describe the difference as being akin to interstates and local streets saying, “ if the transmission system is analogous to the interstate highway system whose focus is on moving electricity efficiently and reliably, the local electric distribution system can be thought of as local streets and roads whose focus is on distributing quality electric service to retail customers”. 5 In sum, the transmission and distribution systems are similar in what they do but vary markedly in their ultimate goals.
How the System is Organized
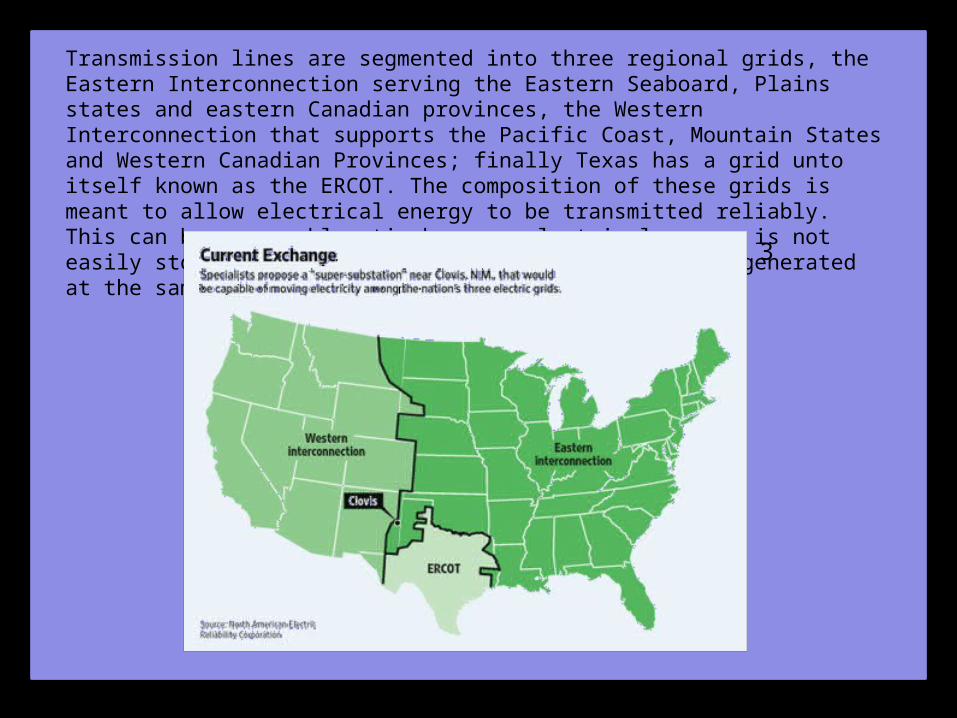
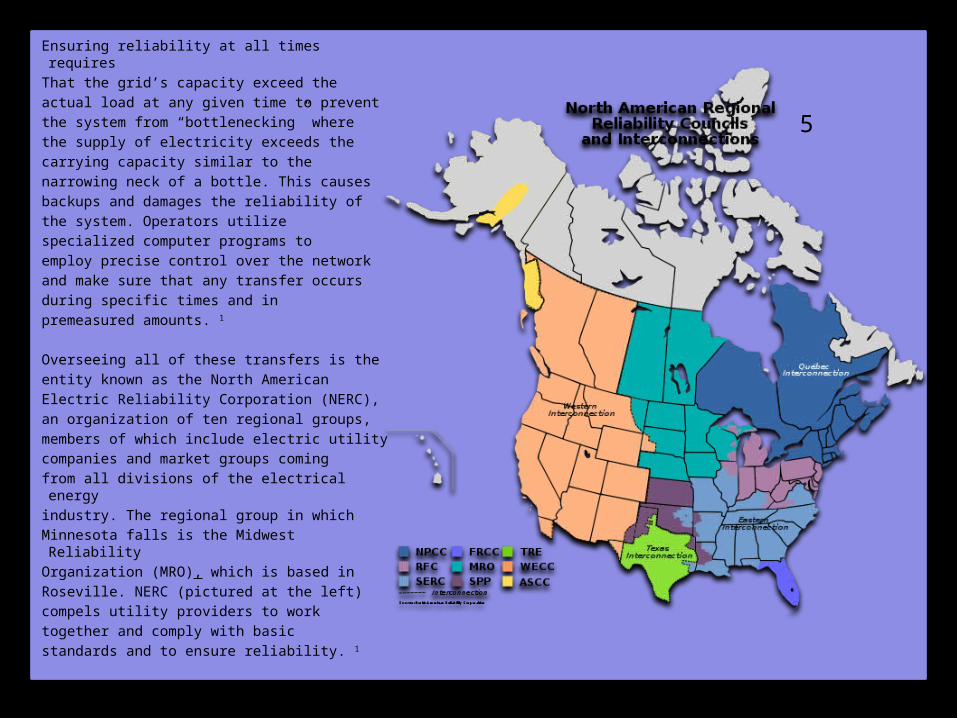
Transmission lines are segmented into three regional grids, the Eastern Interconnection serving the Eastern Seaboard, Plains states and eastern Canadian provinces, the Western Interconnection that supports the Pacific Coast, Mountain States and Western Canadian Provinces; finally Texas has a grid unto itself known as the ERCOT. The composition of these grids is meant to allow electrical energy to be transmitted reliably. This can become problematic because electrical energy is not easily stored and cannot be directed. It needs to be generated at the same time it is needed 1.
3
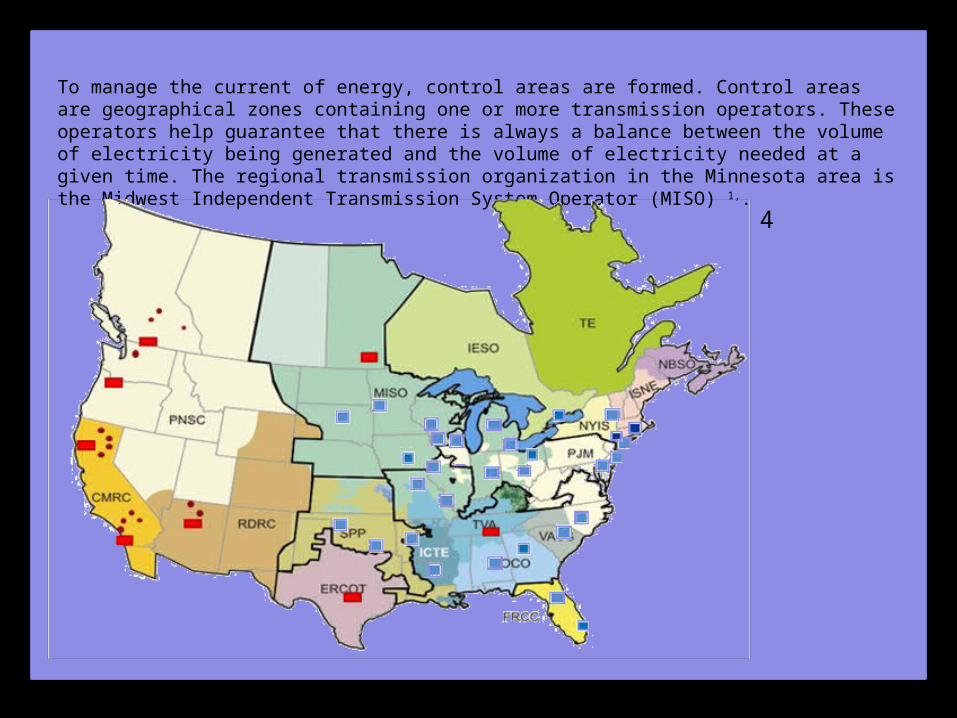
To manage the current of energy, control areas are formed. Control areas are geographical zones containing one or more transmission operators. These operators help guarantee that there is always a balance between the volume of electricity being generated and the volume of electricity needed at a given time. The regional transmission organization in the Minnesota area is the Midwest Independent Transmission System Operator (MISO) 1,.
4
Ensuring reliability at all times requires
That the grid’s capacity exceed the
actual load at any given time to prevent
the system from “bottlenecking” where
the supply of electricity exceeds the
carrying capacity similar to the
narrowing neck of a bottle. This causes
backups and damages the reliability of
the system. Operators utilize
specialized computer programs to
employ precise control over the network
and make sure that any transfer occurs
during specific times and in
premeasured amounts. 1
Overseeing all of these transfers is the
entity known as the North American
Electric Reliability Corporation (NERC),
an organization of ten regional groups,
members of which include electric utility
companies and market groups coming
from all divisions of the electrical energy
industry. The regional group in which
Minnesota falls is the Midwest Reliability
Organization (MRO), which is based in
Roseville. NERC (pictured at the left)
compels utility providers to work
together and comply with basic
standards and to ensure reliability. 1
5

Where the Electricity Goes…
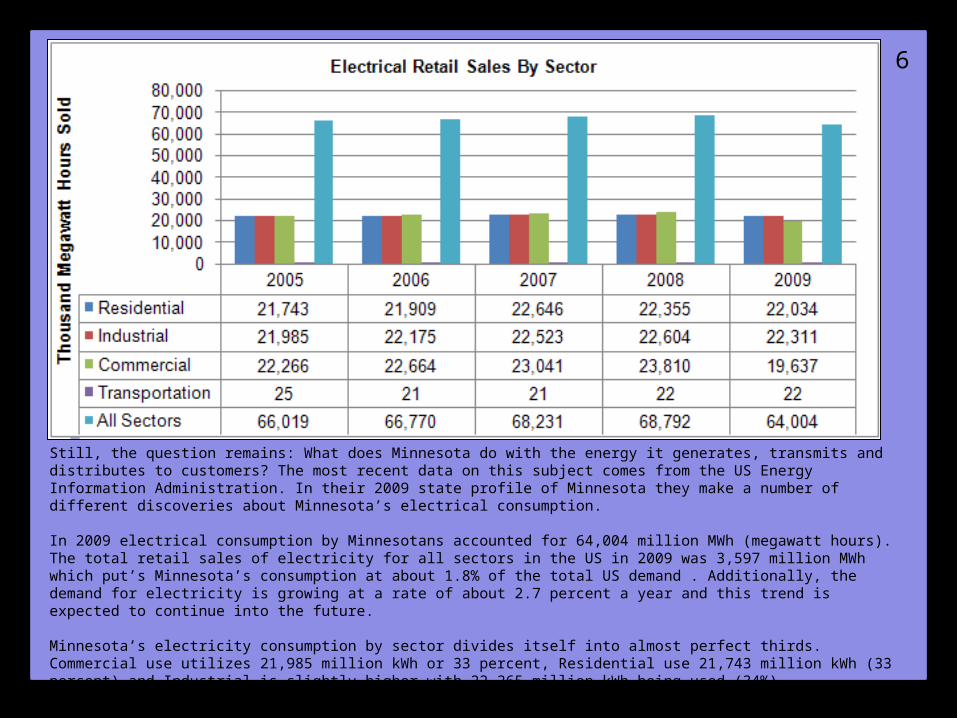
Still, the question remains: What does Minnesota do with the energy it generates, transmits and distributes to customers? The most recent data on this subject comes from the US Energy Information Administration. In their 2009 state profile of Minnesota they make a number of different discoveries about Minnesota’s electrical consumption. In 2009 electrical consumption by Minnesotans accounted for 64,004 million MWh (megawatt hours). The total retail sales of electricity for all sectors in the US in 2009 was 3,597 million MWh which put’s Minnesota’s consumption at about 1.8% of the total US demand . Additionally, the demand for electricity is growing at a rate of about 2.7 percent a year and this trend is expected to continue into the future. Minnesota’s electricity consumption by sector divides itself into almost perfect thirds. Commercial use utilizes 21,985 million kWh or 33 percent, Residential use 21,743 million kWh (33 percent) and Industrial is slightly higher with 22,265 million kWh being used (34%). Transportation is also used but at a miniscule 24 million kWh it doesn’t even account for 1 percent of Minnesota’s total electrical expenditures. 9,10
6
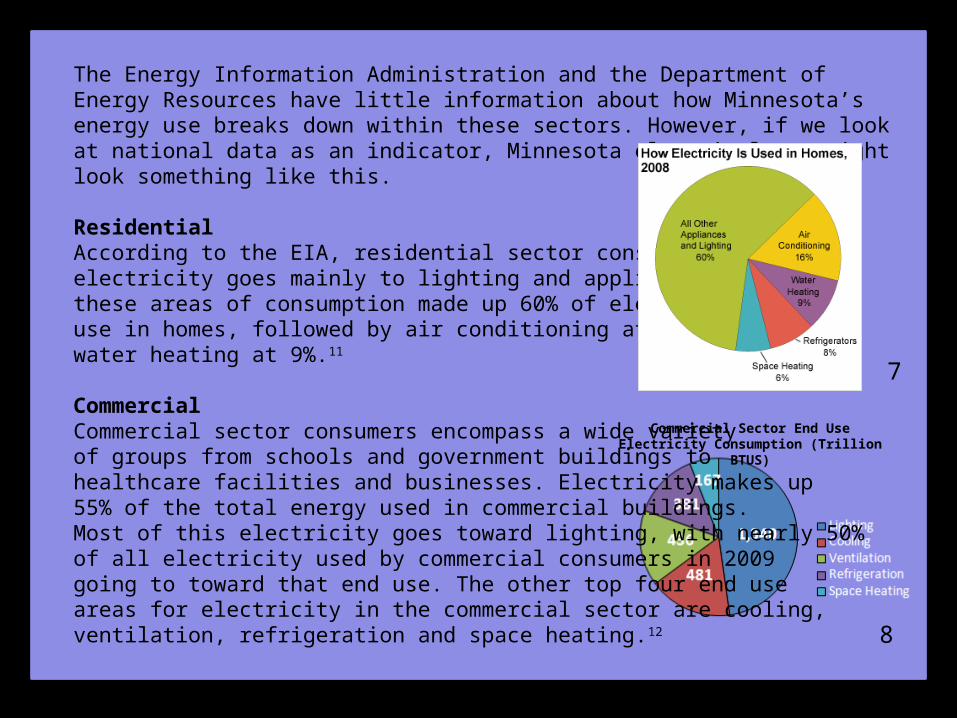
The Energy Information Administration and the Department of Energy Resources have little information about how Minnesota’s energy use breaks down within these sectors. However, if we look at national data as an indicator, Minnesota electrical use might look something like this.
Residential According to the EIA, residential sector consumption of electricity goes mainly to lighting and appliances. In 2008these areas of consumption made up 60% of electrical use in homes, followed by air conditioning at 16% and water heating at 9%.11
Commercial Commercial sector consumers encompass a wide varietyof groups from schools and government buildings to healthcare facilities and businesses. Electricity makes up55% of the total energy used in commercial buildings.Most of this electricity goes toward lighting, with nearly 50% of all electricity used by commercial consumers in 2009 going to toward that end use. The other top four end use areas for electricity in the commercial sector are cooling, ventilation, refrigeration and space heating.12
Commercial Sector End Use Electricity Consumption (Trillion BTUS)
7
8
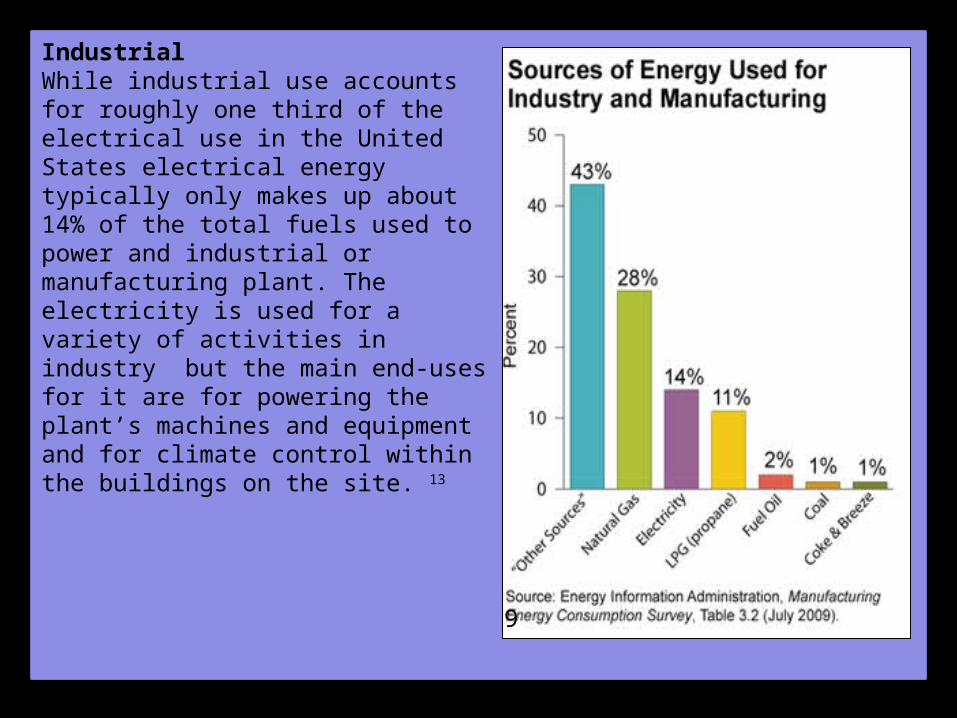
IndustrialWhile industrial use accounts for roughly one third of the electrical use in the United States electrical energy typically only makes up about 14% of the total fuels used to power and industrial or manufacturing plant. The electricity is used for a variety of activities in industry but the main end-uses for it are for powering the plant’s machines and equipment and for climate control within the buildings on the site. 13
9
Looking at the history of Minnesota’s electrical system and the system we have now it is clear the journey from the first hydroelectric plant to the system we have today was not a simple one and it led in part to the unique system we have today.
The various maps of the grid and the governing bodies seem to resemble a patchwork quilt, a hodgepodge of different regions and organizations that all come together to form the electrical system as we know it. We happened into this system haphazardly and have been doing as best we can to make it work for everyone. However, the structure of the grid and the length of time it has been around present some issues that must be addressed in the near future in order to progress.
Problems With the Current GridDr. Massoud Amin is the Director of the Technological Leadership Institute at the University of Minnesota Twin Cities. One of his areas of focus is electrical infrastructure and in a recent article he outlined some of the problems facing the current grid. Due to heavier use of the transmission and distribution systems the grid is straining to keep up with growing capacity and demand. This has a couple of different implications for electrical energy: 14
•Bottlenecking of power leads to more line loss – Transmission and Distribution losses grew between 1970 and 2001, jumping from around 5 percent to 9.5 percent. This seems counterintuitive. As time goes on efficiency should increase, not diminish •Not enough grid capacity to integrate renewables – Both Dr. Amin and the Minnesota Division of Energy resources recognize higher proportions of renewable energy, notably wind are being integrated into states’ energy portfolios. However, the transmission and distribution systems are not currently in a place to allow for the incorporation of these new sources of electricity and, because of this, delay the process of shifting to cleaner forms of energy.15 •Reliability According Dr. Amin, as well as data from the U.S. Energy Information Administration, the US Grid is experiencing trouble delivering reliable power. Between the years of 2000 and 2004 there were 156 outages of 100 megawatts or more and these outages increased to 264 between 2005 and 2009. Additionally, the number of outages affecting 50,000-plus consumers swelled from 149 during the 2000 to 2004 period to 349 from 2005 to 2009. These outages have real monetary consequences, costing the economy, anywhere from $80 billion to as much as $188 billion per year.
• Dr. Amin notes that reliability varies from region to region saying “some regions do better than others. The country’s most reliable utilities tend to be located in the Midwest: Minnesota, Iowa, the Dakotas, Missouri, Nebraska, and Kansas lose power on average 92 minutes per year, while customers in New York, Pennsylvania, and New Jersey suffer 214 minutes without electricity”. However, despite Minnesota’s relatively high reliability it fails to compare with other countries, some of whom only experience 4 minutes of interrupted service per year.14
Timeline of Minnesota Electricity: Works Cited
Timeline taken from: "A Brief History of Minnesota's Electrical System ." Citizing The Citizens League, 8May 2011. Web. 20 June 2011.http://www.citizing.org/projects/workingteamenergyindependence/library/961#comments .
The Current Electrical System: Works Cited1. "About Electricity ." Minnesota Power. Minnesota Power, 2011. Web. 25 May 2011. <http://www.mnpower.com/about_electricity/index.htm>.2. "Electricity and the Environment ." Minnesota Pollution Control Agency . Minnesota Pollution Control Agency , n.d. Web. 26 May 2011.<http://www.pca.state.mn.us/index.php/topics/energy/electricityand-the-environment/electricity-and-the environment.html?menuid=&missing=0&redirect=1>.3. "What is the electric power grid, and what are some challenges it faces?" US Energy Information Administration.US Government, 20 Oct. 2009. Web. 14 June 2011. <http://www.eia.gov/energy_in_brief/power_grid.cfm>.4. "A Primer on Electric Utilities Deregulation and Restructuring of US Electricity Markets." US Department of Energy. US Government, May 2002. Web. 1 June 2011. <http://www1.eere.energy.gov/femp/pdfs/primer.pdf>.5. "Energy Policy and Conservation Report 2008 ." Minnesota Office of Energy Security. Minnesota Chamber of Commerce , n.d. Web. 8 June 2008. <http://www.state.mn.us/mn/externalDocs/Commerce/Quadrennial_Report__2008_091509012935_2008-QuadReport.pdf>.6. "Guide to Tribal Energy Development ." U.S. Department of Energy . US Government, 7 June 2007. Web. 13 June 2011. <http://www1.eere.energy.gov/tribalenergy/guide/north_american_grids.html>.7. "History ." MISO . Midwest Independent Transmission System Operators, 2011. Web.13 June 2011. <https://www.midwestiso.org/AboutUs/History/Pages/History.aspx>.8. "NERC Map." Wikipedia. Wikipedia , 10 May 2009. Web. 1 June 2011. <http://en.wikipedia.org/wiki/File:NERC-map-en.svg>.9. "Minnesota Electricity Profile: Retail Sales, Revenue, and Average Retail Price by Sector, 1990 Through 2009." The US Energy Information Administration .US Government , Apr. 2011. Web. 14 June 2011. <http://www.eia.gov/cneaf/electricity/st_profiles/minnesota.html>.10. "Electric Sales and Revenue 2009 ." Energy Information Administration . US Government, 5 Apr. 2011. Web. 14 June 2011. <http://www.eia.gov/cneaf/electricity/esr/esr_sum.html>.
The Current Electrical System: Works Cited Continued
11. "Energy Use in Homes ." Energy Information Administration . US Government , 19 Feb. 2010 . Web. 20 June 2011. <http://www.eia.gov/energyexplained/ index.cfm?page=us_energy_homes>. 12. "Commercial Sector Energy Consumption” Energy Information Administration . US Government , 2009. Web. 20 June 2011. <http://www.eia.gov/totalenergy/data/annual/pdf/sec2_8.pdf>13. "Energy Use in Industry ." Energy Information Administration . US Government, 26 Jan. 2010. Web. 20 June 2011. http://www.eia.gov/energyexplained/index.cfm?page=us_energy_industry . 14. Amin, Massoud. "Toward A More Secure, Strong and Smart Electric Power Grid." IEEE Smart Grid. IEEE, 25 Feb. 2011. Web. 21 June 2011. <http://smartgrid.ieee.org/news-smart-grid-newsletter/3031-toward-a-more-secure-strong-and-smart-electric-power-grid>. 15. "Minnesota's Electric Transmission System: Now and Into the Future ."Minnesota Division of Energy Resources. State of Minnesota , Jan. 2011. Web. 21 June 2011.<http://www.state.mn.us/mn/externalDocs/Commerce/Minnesotas_Electric_Transmission_System_Report_2010_012411033951_ElectricTransmis sionReport2010.pdf>.
Charts and Images 1. "Electricity and the Environment ." Minnesota Pollution Control Agency . MinnesotaPollution Control Agency , n.d. Web. 26 May 2011.<http://www.pca.state.mn.us/index.php/topics/energy/electricityand-theenvironment/electricity-and-theenvironment.html?menuid=&missing=0&redirect= 1>.2. "About Electricity ." Minnesota Power. Minnesota Power, 2011. Web. 25 May 2011. <http://www.mnpower.com/about_electricity/index.htm>.3. Richard, Michael Graham. "'Tres Amigas' Superstation Could Connect 3 US ElectricalGrids ." Treehugger. Treehugger, 15 Oct. 2009. Web. 17 June 2011.<http://www.treehugger.com/files/2009/10/tres-amigas-clovis-superstation-connecting-uselectricity-grids.php>. 4. "RTDMS Deployments ." Electric Power Group . EPG , 2008. Web. 17 June 2011. <http://electricpowergroup.com/solutions/rtdms/deployments.html>. 5. "NERC Map." Wikipedia. Wikipedia , 10 May 2009. Web. 1 June 2011.<http://en.wikipedia.org/wiki/File:NERC-map-en.svg>.6."Minnesota Electricity Profile: Retail Sales, Revenue, and Average Retail Price bySector, 1990 Through 2009." The US Energy Information Administration.US Government, Apr. 2011. Web. 14 June 2011.<http://www.eia.gov/cneaf/electricity/st_profiles/minnesota.html>.7. "Energy Use in Homes." Energy Information Administration.US Government,19 Feb.2010. Web. 20 June 2011.<http://www.eia.gov/energyexplained/index.cfm?page=us_energy_homes>. 8. "Commercial Sector Energy Consumption” Energy Information Administration . US Government ,2009. Web. 20 June 2011. <http://www.eia.gov/totalenergy/data/annual/pdf/sec2_8.pdf>9. "Energy Use in Industry ." Energy Information Administration . US Government, 26 Jan. 2010. Web.20 June 2011. http://www.eia.gov/energyexplained/index.cfm?page=us_energy_industry .