electricity in life cycle assessment - nc state universityrichardv/documents/lecture8lca... ·...
TRANSCRIPT
Environmental Life Cycle Assessment
PSE 476/WPS 576/WPS 595-005
Lecture 8: Life Cycle Inventory: LCA Stages:
Power and Electricity
Richard Venditti, Jesse Daystar & Carter Reeb
1
Fall 2012
Richard A. Venditti Forest Biomaterials
North Carolina State University Raleigh, NC 27695-8005
Go.ncsu.edu/venditti

What is Energy?
• Energy is the potential to do work.
– Potential or Kinetic
• Work = Force * distance
or
• Mass * velocity2
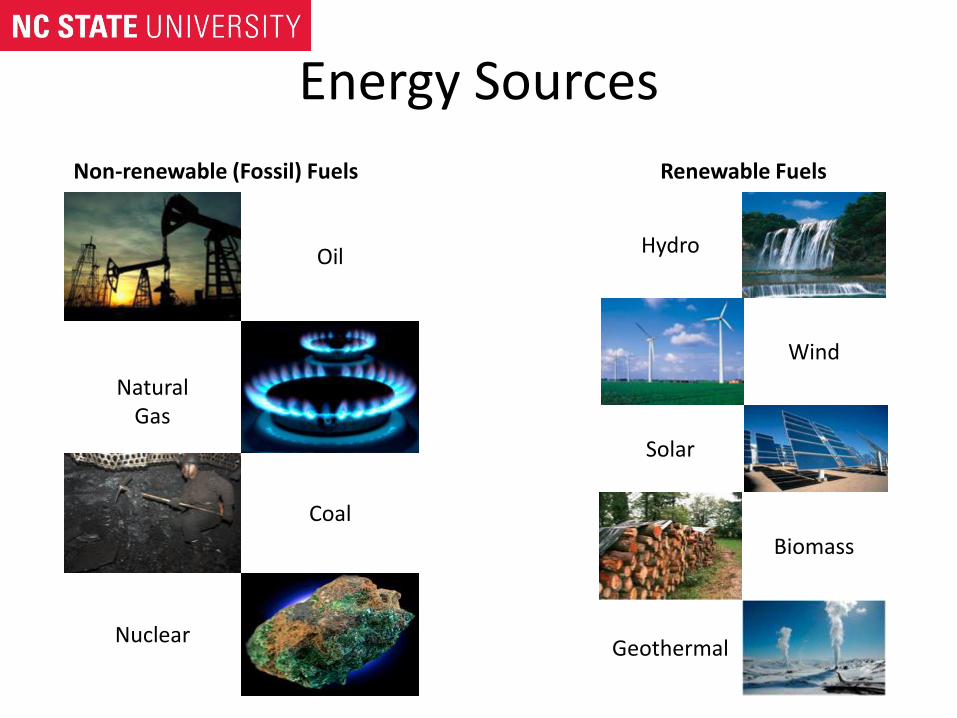
Energy Sources
Non-renewable (Fossil) Fuels
Oil
Natural Gas
Coal
Nuclear
Renewable Fuels
Hydro
Wind
Solar
Biomass
Geothermal

Single (or combined)-cycle Power Generation
• Thermoelectric process
– Combusts coal, natural gas, or oil
– Steam turns turbine
– Rotor turns magnets in generator
– Magnets move past copper wiring – generate electricity
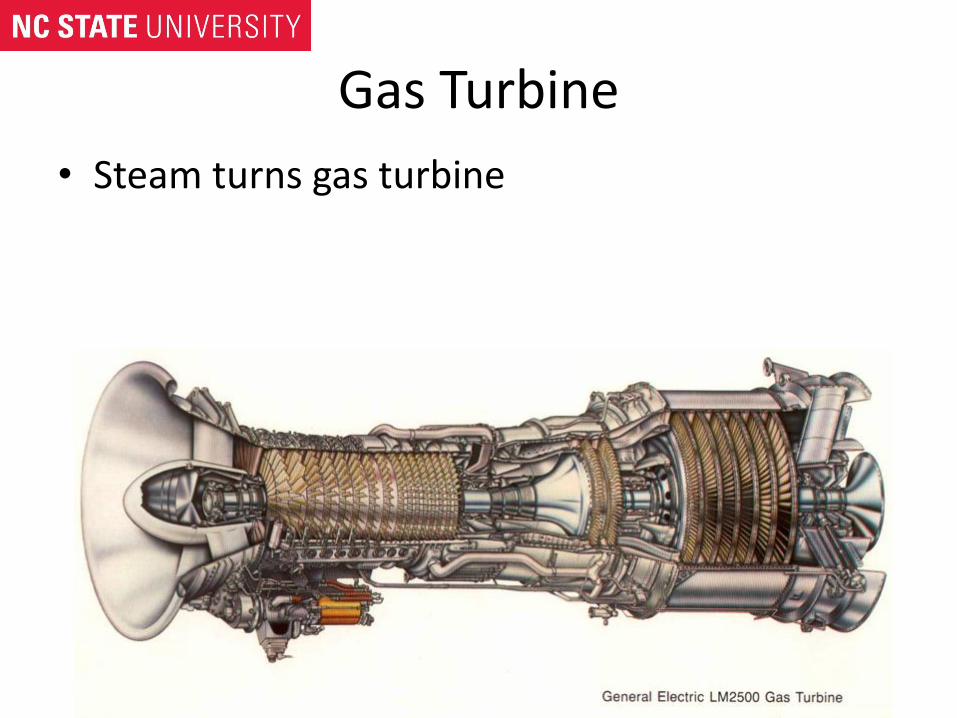
Gas Turbine
• Steam turns gas turbine

Generator
• Stator and Rotor
• Armature and Field windings
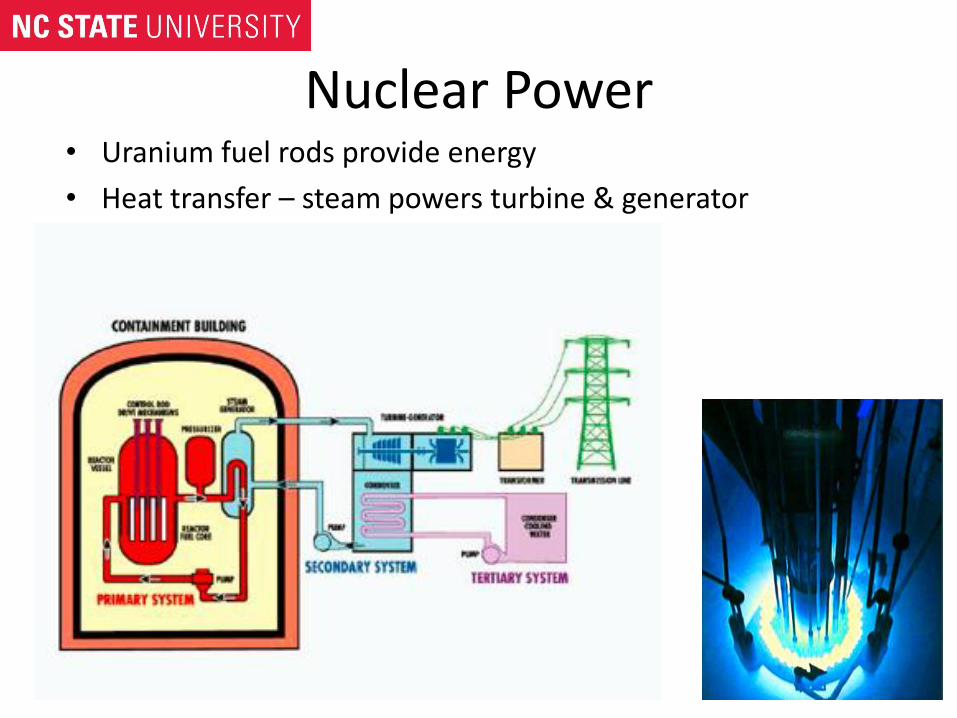
Nuclear Power • Uranium fuel rods provide energy
• Heat transfer – steam powers turbine & generator

Hydro-electricity
• Potential energy (head) of water
• Movement past turbine
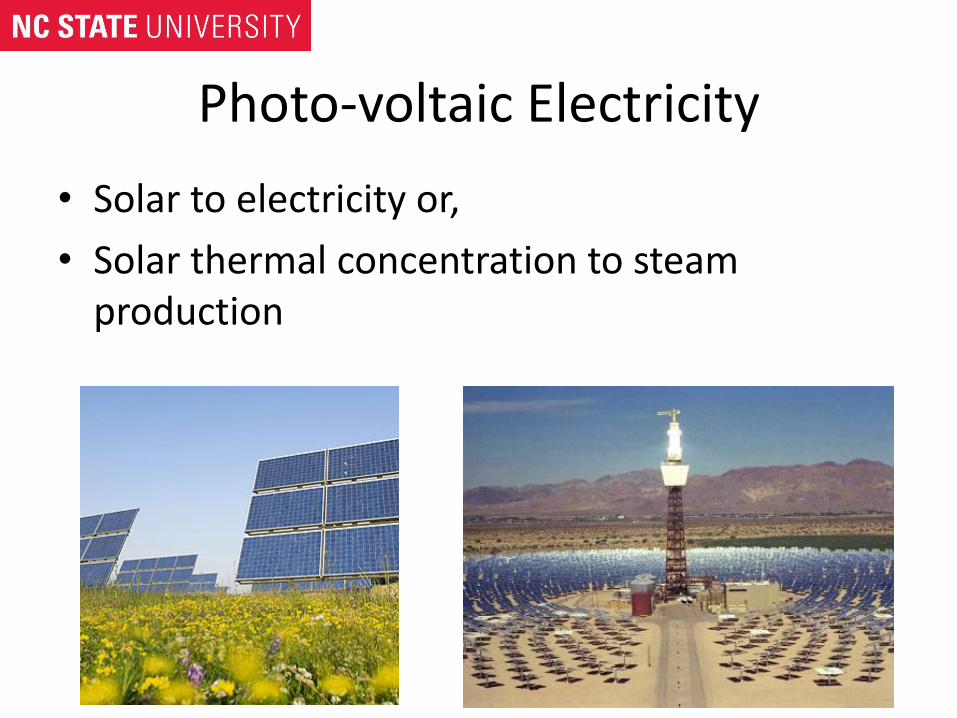
Photo-voltaic Electricity
• Solar to electricity or,
• Solar thermal concentration to steam production
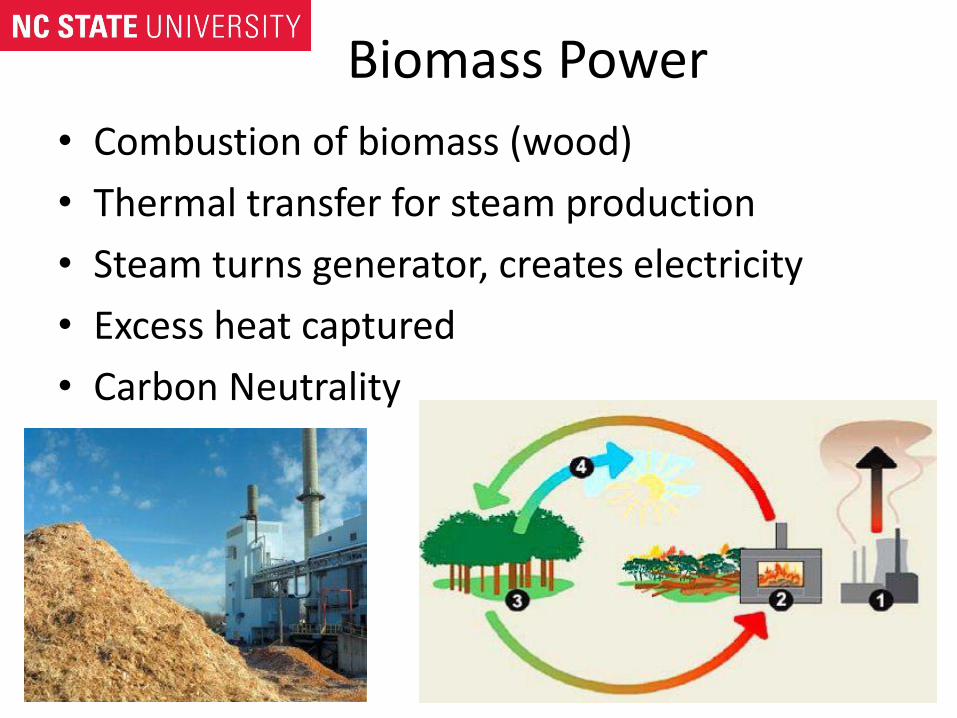
Biomass Power
• Combustion of biomass (wood)
• Thermal transfer for steam production
• Steam turns generator, creates electricity
• Excess heat captured
• Carbon Neutrality

Electricity Transmission
Electricity Use
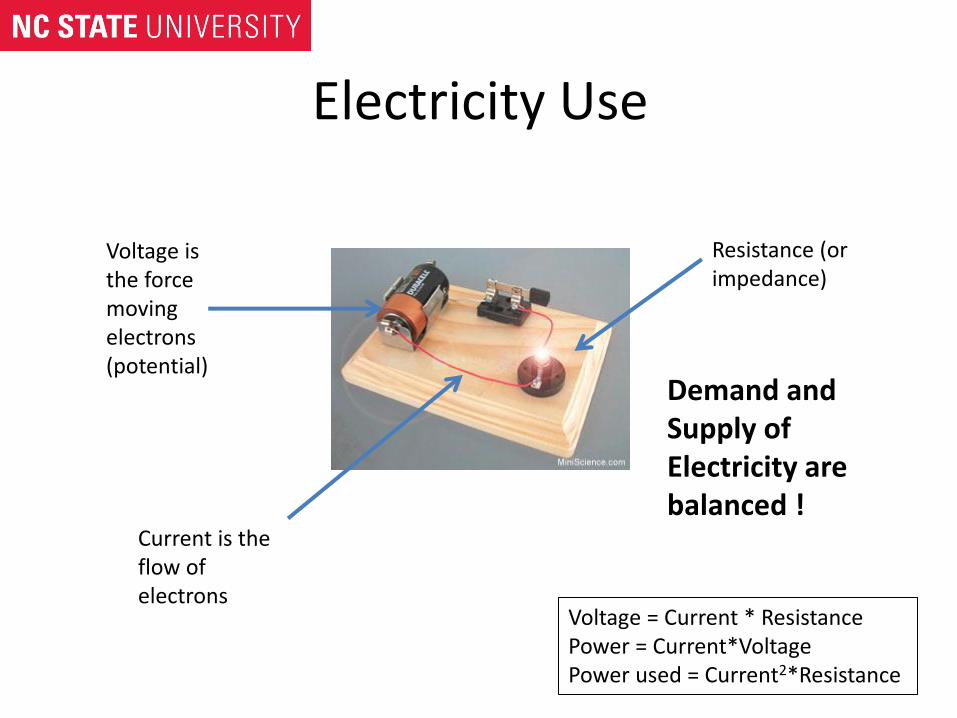
Voltage = Current * Resistance Power = Current*Voltage Power used = Current2*Resistance
Voltage is the force moving electrons (potential)
Resistance (or impedance)
Current is the flow of electrons
Demand and Supply of Electricity are balanced !

Why is Electricity transported in high voltage?
• To minimize power losses due to the resistance of the transmitting cables
• Power lost in lines = Current2 * Resistance • To get the power needed to flow through the transmission
lines the Current or the Voltage can be raised, – Power Required= Current * Voltage – Current = Power Required / Voltage
• Power lost in lines = (Power Required/Voltage) 2 *Resistance
Voltage = Current * Resistance Power = Current*Voltage Power used = Current2*Resistance
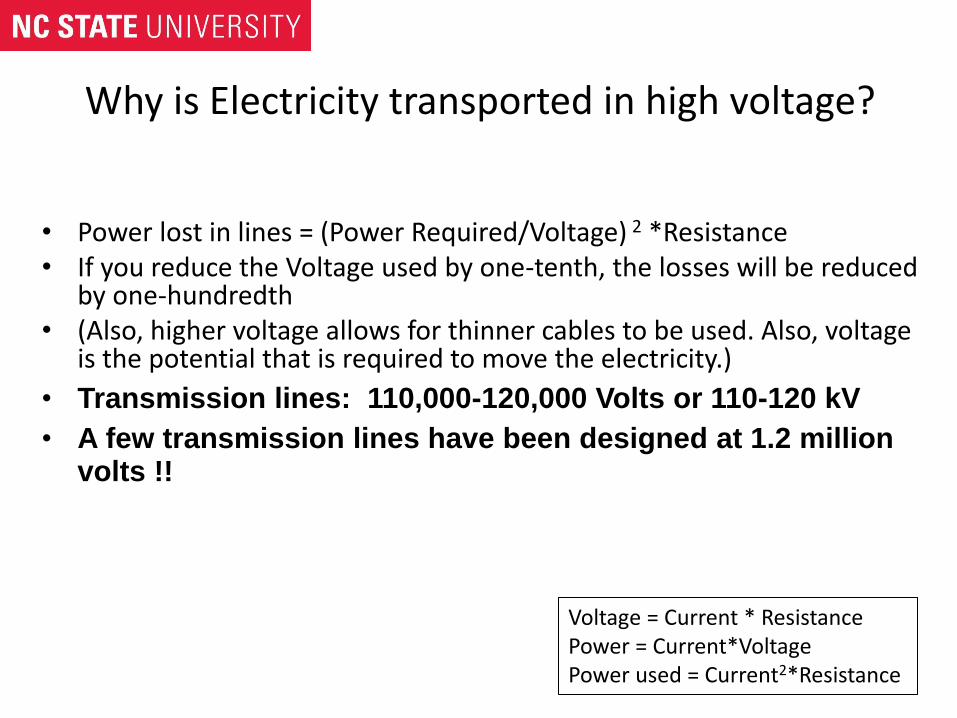
Why is Electricity transported in high voltage?
Voltage = Current * Resistance Power = Current*Voltage Power used = Current2*Resistance
• Power lost in lines = (Power Required/Voltage) 2 *Resistance • If you reduce the Voltage used by one-tenth, the losses will be reduced
by one-hundredth • (Also, higher voltage allows for thinner cables to be used. Also, voltage
is the potential that is required to move the electricity.)
• Transmission lines: 110,000-120,000 Volts or 110-120 kV
• A few transmission lines have been designed at 1.2 million volts !!

Electricity Balance • The production and demand must be balanced, always • Base load are satisfied typically with large efficient plants • Spinning reserve, comes on only during peak times, lowere efficiency
power sources, • Intermittent energy sources, suffer because they cause problems with
balancing supply and demand __________________________
Total electricity consumption in CA on a hot day. http://www.mpoweruk.com/electricity_demand.htm
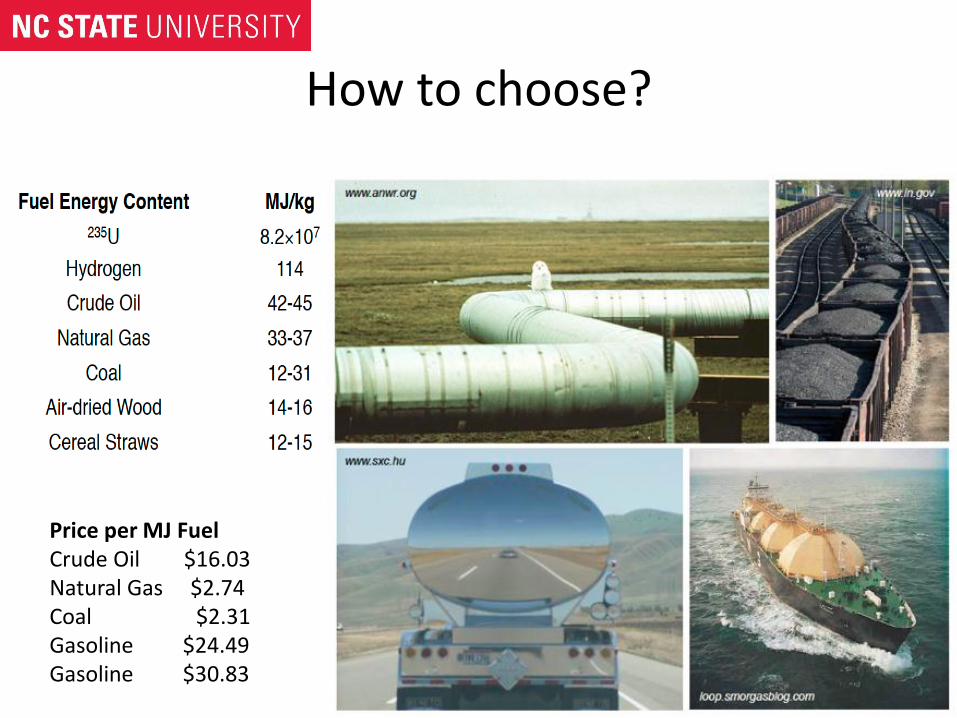
How to choose?
Price per MJ Fuel Crude Oil $16.03 Natural Gas $2.74 Coal $2.31 Gasoline $24.49 Gasoline $30.83
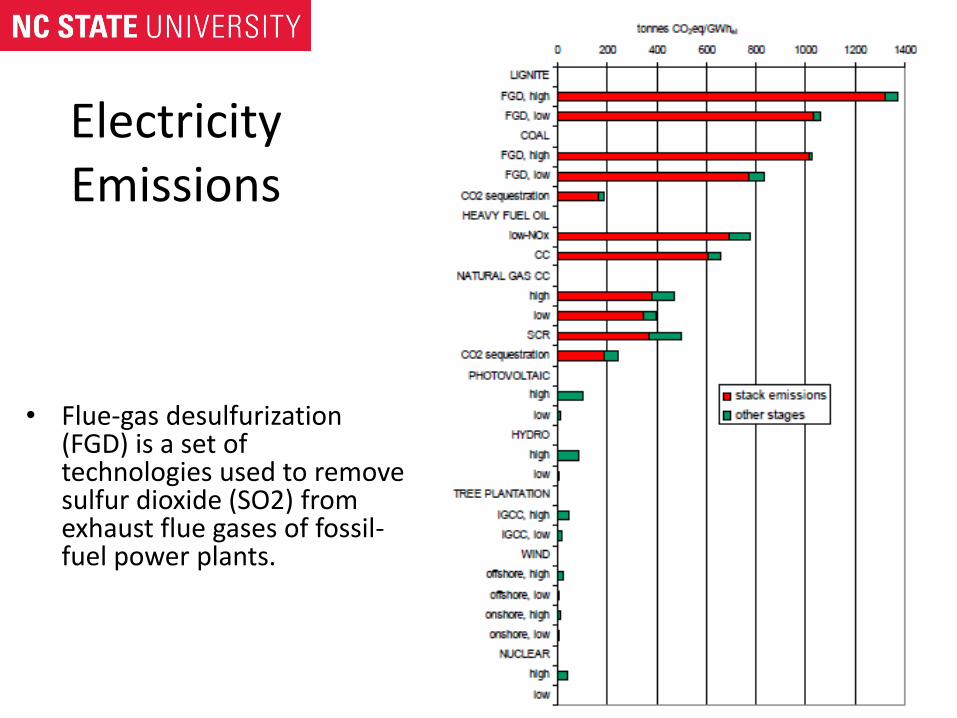
Electricity Emissions
• Flue-gas desulfurization (FGD) is a set of technologies used to remove sulfur dioxide (SO2) from exhaust flue gases of fossil-fuel power plants.
Electricity Emissions • Careful, parts thinking, this is only
one aspect of the entire issue
• Other issues:

Emissions Factors for LCA

Emissions Factors for LCA Combustion Pre-combustion Total
kg CO2 eq/GJ
HHV
kg CO2 eq/GJ
HHV
kg CO2 eq/GJ
HHV
Anthracite coal 94.05 24.464 118.514
Bituminous coal 90.32 5.382 95.702
Diesel 70.59 12.256 82.846
Distillate fuel oil (#2 fuel oil) 70.59 12.256 82.846
Gasoline 66.08 11.823 77.903
Kerosene 68.55 11.862 80.412
Lignite 96.61 10.56 107.17
Natural gas 50.54 12.784 63.324
Non-recyclable paper 0 0 0
Other No default No default No default
Other biomass 0 No default No default
Petroleum coke 92.87 18.712 111.582
Propane (LPG) 60 11.865 71.865
Purchased hogged fuel, from logging residues 1.84 0.19 2.03
Purchased hogged fuel, from manufacturing residues 1.84 3.081 4.921
Purchased spent liquor solids 0.637 0 0.637
Residual fuel oil (#5, #6) 73.77 12.331 86.101
Self-generated hogged fuel, from logging residues 1.84 0 1.84
Self-generated hogged fuel, from manufacturing residues 1.84 0 1.84
Self-generated spent liquor solids 0.637 0 0.637
Sawdust 1.84 3.081 4.921
Tire derived fuel 81.49 0 81.49
Fuels inputs
Most emission Factors are Tier 1 from Revised 2006 IPCC Guidelines for National Greenhouse Gas Inventories: Volume 2 Energy, Chapter 2 Stationary Combustion (unless noted otherwise) Converted from LHV basis to HHV by multiplying by 0.95 (or 0.9 in the case of natural gas)

What is biomass? • Using sunlight and photosynthesis, plants convert
atmospheric CO2 into plant tissue (biomass) and stored energy (Source: NCASI)
Photosynthesis
CO2 + sunlight =
biomass + stored energy
CO2
Carbon in atmospheric CO2 becomes carbon in biomass
(biogenic carbon)
The chemical bonds in biomass store the sun’s energy

The Biomass Carbon Cycle
• Biogenic carbon is part of a relatively rapid natural cycle that impacts atmospheric CO2 only if the cycle is out of balance
Atmosphere
Biomass
(Biogenic)
Carbon B
iog
enic
CO
2
CO
2

CO2 CO2
Is the biomass carbon cycle in balance?
U.S. Global B
iogenic
CO
2
CO
2
Bio
genic
CO
2
CO
2
Increases in atmospheric CO2 caused by deforestation, primarily in the tropics, are being offset by
growth in global forests. The exact balance is uncertain.
Removals of CO2 from the atmosphere by U.S. forests are larger than releases of biogenic CO2. The difference (a net uptake of CO2) offsets approximately
10% to 15% of all U.S. GHG emissions.
Balance uncertain
Balance favorable
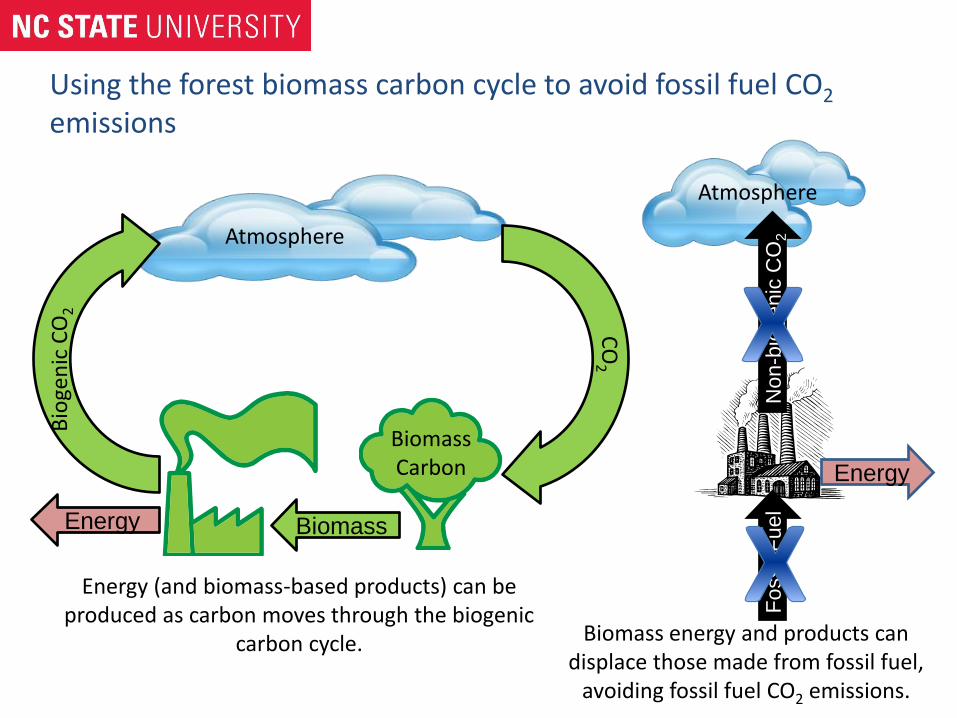
Using the forest biomass carbon cycle to avoid fossil fuel CO2 emissions
Atmosphere
Biomass Carbon
Bio
gen
ic C
O2
CO
2
Energy (and biomass-based products) can be produced as carbon moves through the biogenic
carbon cycle.
Fossil
Fuel
Atmosphere
Non
-bio
genic
CO
2
Biomass energy and products can displace those made from fossil fuel,
avoiding fossil fuel CO2 emissions.
Biomass Energy
Energy
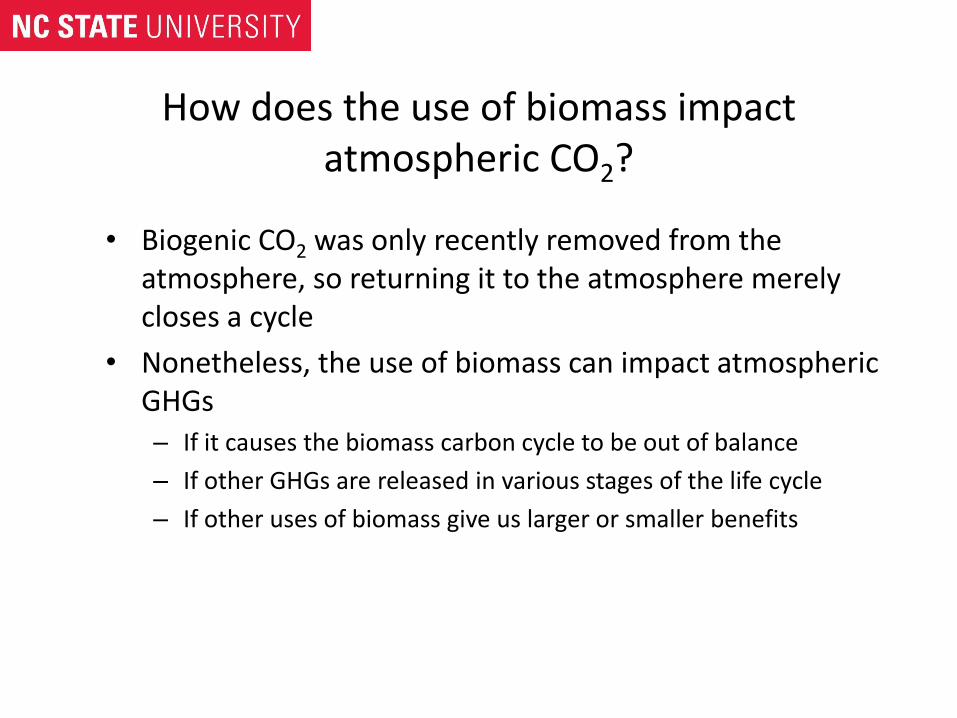
How does the use of biomass impact atmospheric CO2?
• Biogenic CO2 was only recently removed from the atmosphere, so returning it to the atmosphere merely closes a cycle
• Nonetheless, the use of biomass can impact atmospheric GHGs – If it causes the biomass carbon cycle to be out of balance
– If other GHGs are released in various stages of the life cycle
– If other uses of biomass give us larger or smaller benefits

How does the use of biomass impact atmospheric CO2?
2. If other GHGs are released in the life cycle (Remember avoid parts thinking)
Atmosphere
Bio
genic
CO
2
CO
2
Biomass Energy
Products
Biomass
Biomass
Carbon
Foss
il fu
el
Foss
il fu
el
Fert
ilize
rs
Foss
il C
O2
Foss
il C
O2
Oth
er
GH
Gs
Oth
er
GH
Gs
Oth
er G
HG
s
Foss
il fu
el
Foss
il C
O2
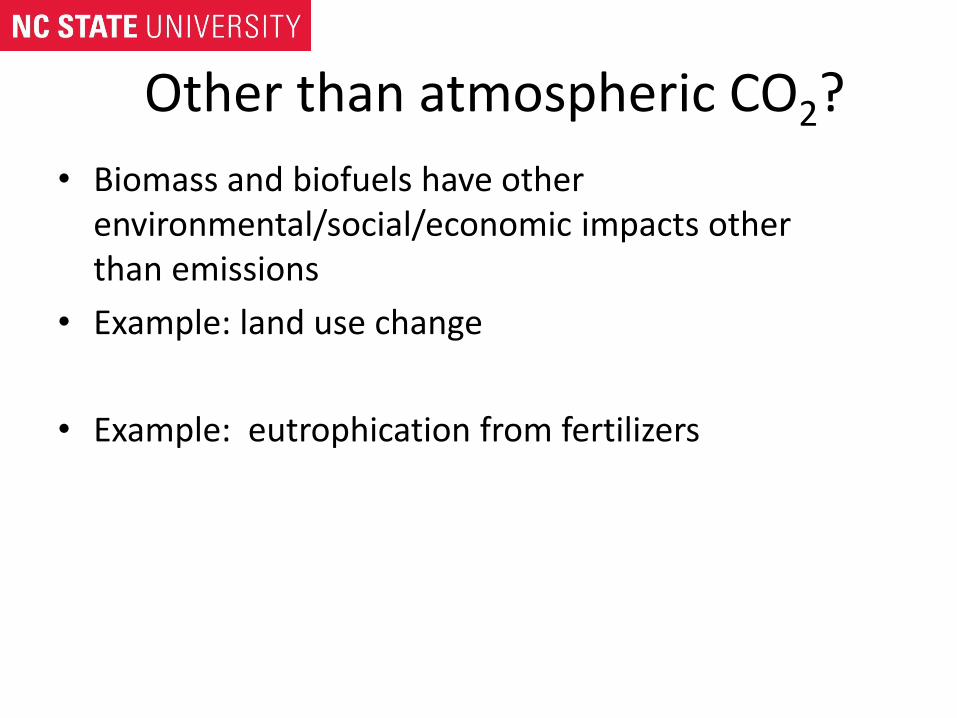
Other than atmospheric CO2?
• Biomass and biofuels have other environmental/social/economic impacts other than emissions
• Example: land use change
• Example: eutrophication from fertilizers

Environmental impacts of cellulosic ethanol in the Southern U.S. using a thermochemical conversion pathway
(in preparation)
Jesse Daystar, Carter Reeb, Ronalds Gonzalez, Richard Venditti

Bioethanol from Cellulosic Biomass
• System boundary for the life cycle assessment of bioethanol from cradle-to-grave; assuming thermochemical conversion of the biomass to ethanol and use in a light-duty transport vehicle.

Bioethanol from Cellulosic Biomass
• Direct land use change impacts on net GHG emissions of 1 MJ ethanol. (IPCC and FICAT data used for land use change)

• Normalized environmental impacts of cellulosic ethanol and gasoline using the TRACI impact assessment method, bars left to right correspond to legend left to right and top to bottom
0.
10.
20.
30.
40.
50.
60.
70.
80.
90.
100.
GlobalWarming
Acidification Carcinogenics Noncarcinogenics
Respiratoryeffects
Eutrophication Ozonedepletion
Ecotoxicity Smog
%
Loblolly Pine Eucalpytus Unmanaged Hardwood
Forest Residues Forest Residues no burden Switchgrass
Gasoline
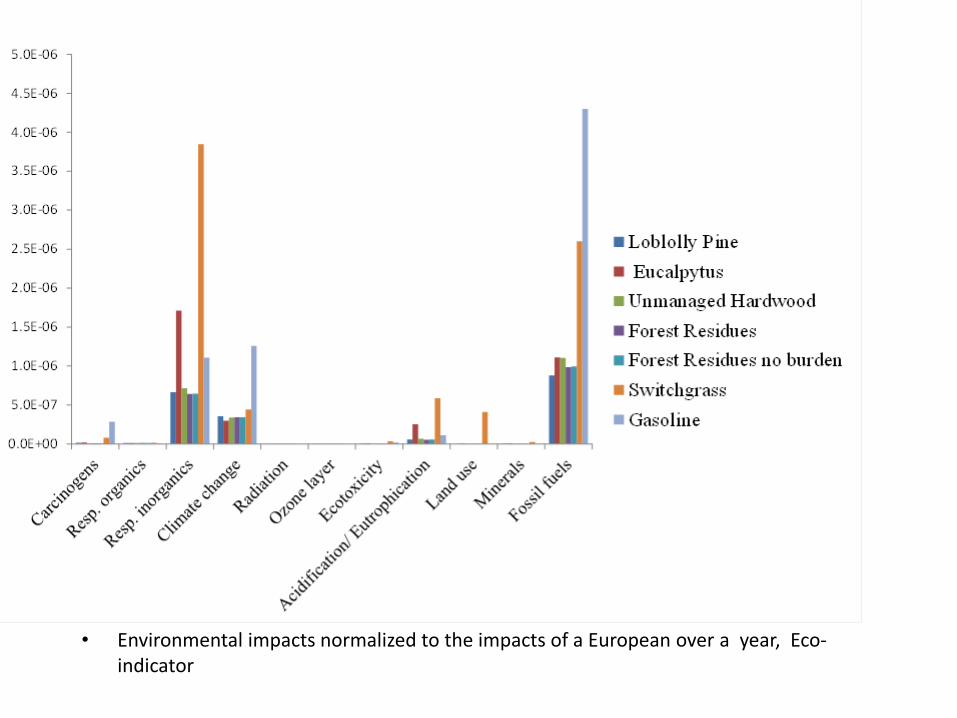
• Environmental impacts normalized to the impacts of a European over a year, Eco-indicator

Summary of Bioethanol Study
• Significant reduction with TC Cellulosic Bioethanol in GHG compared to gasoline
• Land use changes significant
• Differences in biomass
• Other environmental impacts of the bioethanol exist, especially for switchgrass

Primarily Hydro-electric
Primarily Coal and Nuclear
Primarily Coal

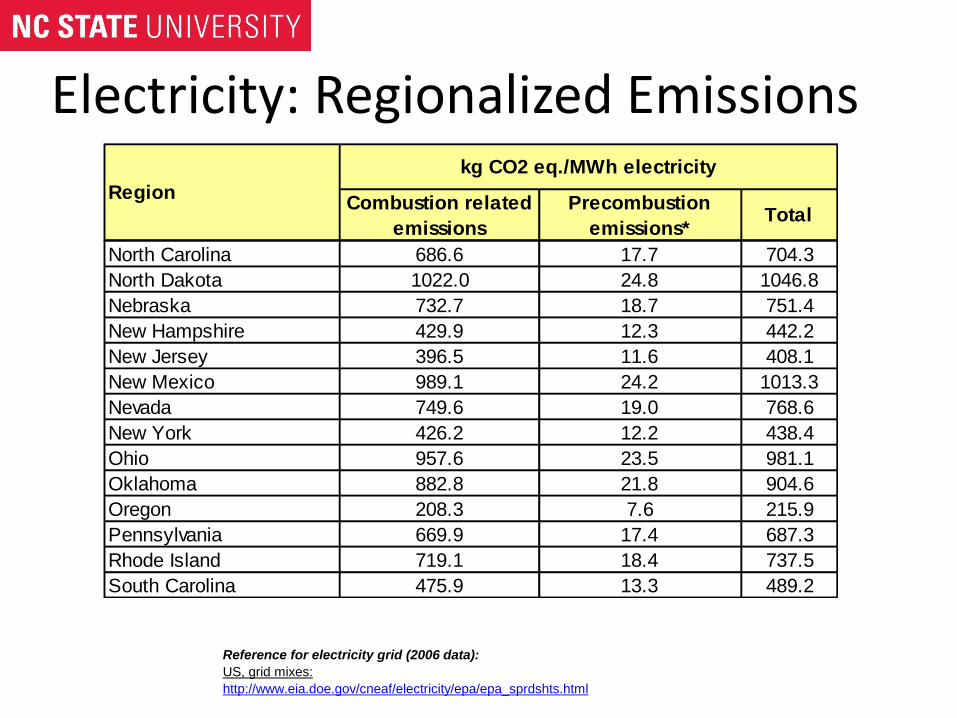
Electricity: Regionalized Emissions
Combustion related
emissions
Precombustion
emissions*Total
North America 651.1 17 668.1
U.S. 705.5 18.1 723.6
Eastern Inter 729.3 18.6 747.9
Western Inter 568.0 15.3 583.3
New England 499.7 13.8 513.5
Mid Atlantic 548.4 14.8 563.2
East-North Central 755.7 19.2 774.9
West-North Central 568.0 15.3 583.3
South Atlantic 754.6 19.2 773.8
East-South Central 793.9 20 813.9
West-South Central 771.2 19.5 790.7
Mountain 847.4 21.1 868.5
Pacific Contiguous 308.2 9.7 317.9
Pacific Non-Contiguous 723.80 18.50 742.30
Region
kg CO2 eq./MWh electricity
Reference for electricity grid (2006 data):
US, grid mixes:
http://www.eia.doe.gov/cneaf/electricity/epa/epa_sprdshts.html
Electricity: Regionalized Emissions
Reference for electricity grid (2006 data):
US, grid mixes:
http://www.eia.doe.gov/cneaf/electricity/epa/epa_sprdshts.html
Combustion related
emissions
Precombustion
emissions*Total
Region
kg CO2 eq./MWh electricity
North Carolina 686.6 17.7 704.3
North Dakota 1022.0 24.8 1046.8
Nebraska 732.7 18.7 751.4
New Hampshire 429.9 12.3 442.2
New Jersey 396.5 11.6 408.1
New Mexico 989.1 24.2 1013.3
Nevada 749.6 19.0 768.6
New York 426.2 12.2 438.4
Ohio 957.6 23.5 981.1
Oklahoma 882.8 21.8 904.6
Oregon 208.3 7.6 215.9
Pennsylvania 669.9 17.4 687.3
Rhode Island 719.1 18.4 737.5
South Carolina 475.9 13.3 489.2

Electricity: Regionalized Emissions
Combustion related
emissions
Precombustion
emissions*Total
Region
kg CO2 eq./MWh electricity
Canada 205.4 8.3 213.7
Alberta 925.6 24.5 950.1
British Colombia 17.0 4.5 21.5
Manitoba 11.2 3.6 14.8
New Brunswick 366.4 13.3 379.7
Newfoundland/Labrador 15.1 3.8 18.9
Nova Scotia 548.7 19.3 568.0
Ontario 183.9 8.2 192.1
Prince Edward Island 192.3 3.9 196.2
Quebec 6.0 3.4 9.40
Saskatchewan 811.4 19.4 830.8
Yukon, Norwest Terr. & Nunavut 84.3 10.3 94.6
Environment Canada. 2008. National Inventory Report 1990 -2006: Greenhouse Gas Sources and Sinks in Canada. Gatineau, Qc: Environment Canada.
Summary
• Non-renewable fuels • Renewable fuels • Thermoelectric Process • Electricity Balance • Base load • Spinning reserve • Intermittent energy sources • Biomass carbon cycle • Displacement • Regionalized electricity emissions
References
• Dr. Eccles, Duke University
• http://www.eumayors.eu/IMG/pdf/technical_annex_en.pdf
• http://www.worldenergy.org/documents/lca2.pdf

Questions?