electrical resistivity of concrete for durability ...€¦ · electrical resistivity of concrete...
TRANSCRIPT

Review ArticleElectrical Resistivity of Concrete forDurability Evaluation: A Review
Pejman Azarsa and Rishi Gupta
Department of Civil Engineering, University of Victoria, Victoria, BC, Canada
Correspondence should be addressed to Rishi Gupta; [email protected]
Received 17 October 2016; Revised 30 March 2017; Accepted 2 May 2017; Published 31 May 2017
Academic Editor: Gianfranco Palumbo
Copyright © 2017 Pejman Azarsa and Rishi Gupta. This is an open access article distributed under the Creative CommonsAttribution License, which permits unrestricted use, distribution, and reproduction in any medium, provided the original work isproperly cited.
Degradation processes in reinforced concrete structures that affect durability are partially controlled by transport of aggressive ionsthrough the concrete microstructure. Ions are charged and the ability of concrete to hold out against transfer of ions greatly relieson its electrical resistivity. Hence, a connection could be expected between electrical resistivity of concrete and the deteriorationprocesses such as increase in permeability and corrosion of embedded steel. Through this paper, an extensive literature review hasbeen done to address relationship between concrete electrical resistivity and its certain durability characteristics. These durabilitycharacteristics include chloride diffusivity and corrosion of reinforcement as these have major influence on concrete degradationprocess. Overall, there exists an inverse or direct proportional correlation between these parameters. Evaluated results, frommeasuring the concrete electrical resistivity, can also be used as a great indicator to identify early age characteristics of freshconcrete and for evaluation of its properties, determination ofmoisture content, connectivity of themicropores, and even conditionassessment of in-service structures. This paper also reviews and assesses research concerning the influential parameters such asenvironmental conditions and presence of steel rebar and cracks on measuring electrical resistivity of concrete. Moreover, concreteresistivity concept, application, and its various measurement techniques are introduced.
1. Introduction
The durability of concrete is defined as its ability to resistweathering action, chemical attack, abrasion, or any otherdeterioration process to retain its original form, quality, andserviceability when exposed to harsh environment [1]. To alarge extent, it is commonly accepted that concrete durabilityis governed by concrete’s resistance to the penetration ofaggressive media. This media may be present in a liquidor gaseous state and that may be transported by variousmechanisms such as permeation, diffusion, absorption, cap-illary suction, and combinations of the items just mentioned.Hence, for concrete in service, a combined action of variousmedia may prevail and mixed modes of transport processesoccur. Moreover, there are correlations between transportparameters of concrete and the following durability charac-teristics: carbonation, sulphate attack, alkali-aggregate reac-tion, frost resistance, leaching, soft water attack, acid attack,abrasion, chloride ingress, and reinforcement corrosion.
Consequently, the transport of ions through microstructureof concrete plays an important role in the control of concretedurability. When ions are charged, then it is the concrete’sability to withstand transfer of charged ions which is highlydependent upon its electrical resistivity. In this study, sincechloride ingress and reinforcement corrosion are reportedas major concrete deterioration processes, one of the mainconcentration areas is on these durability characteristics andtheir relationship with concrete electrical resistivity.
Over the last few decades, a great deal of attention hasbeen paid to research and development of electrical resistiv-ity measurement techniques as a nondestructive technique(NDT) to evaluate the durability of concrete structures.This method is becoming more popular especially for fieldevaluations due to its simplicity, rapidness, and cost duringtest conduction. However, the inclusion of these methodsinto the standards and guidelines is quite slow. Electricalresistivity has been standardized in 2012 by ASTM C1760 [2]tomeasure the concrete bulk resistivity and also by AASHTO
HindawiAdvances in Materials Science and EngineeringVolume 2017, Article ID 8453095, 30 pageshttps://doi.org/10.1155/2017/8453095
2 Advances in Materials Science and Engineering
TP 95-11 [3] to quantify the surface resistivity of concrete.However, there is a gap that still exists between the currentknowledge and industry practice.
Electrical resistivity is amaterial property that can be usedfor various purposes, one of which is to identify early agecharacteristics of fresh concrete.When the fresh concrete setsand hardens, depercolation (discontinuity) of the capillarypore space leads to an increase in its electrical resistivity.Since electrical current is conveyed by dissolved chargedions flowing into the concrete pore solution, it is a goodindicator of concrete pore structures [4]. This pore structureformation at early-ages can define the long-term durabilityof concrete. In addition, the tensile strength of cementitiousmaterials at early-ages is low and the material is proneto cracking. This initial cracking also serves as a pathwayfor deleterious materials to ingress into the matrix. Thiscracking can also be captured by resistivity measurementsand thus helps predict the long-term durability of concrete.In addition, electrical resistivity can be used as an index todetermine the moisture content and the connectivity of themicropores in the concrete [5].
Several researchers attempted to characterize the effectsof various parameters on electrical resistivity measurements.One of the important factors affecting the measurements isenvironmental conditions such as temperature, rainfall, andrelative humidity. During testing, good electrical connec-tion between concrete and electrodes as well as specimengeometry plays a key role in having a reliable measurement.The electrical resistivity measurements are highly influencedby the moisture content of concrete. For instance, whenthe moisture content is reduced, the resistivity is increasedsignificantly. Therefore, considering all these influencingparameters for on-site resistivity measurements and to makemeaningful conclusions is not a simple task.
In this paper, the correlation between electrical resis-tivity and certain durability characteristics of concrete isdiscussed. These concrete characteristics include chloridepermeability, corrosion rate, and compressive strength. Also,different approaches in the measurement of concrete resistiv-ity including bulk and surface resistivity measurements arepresented.This paper reviews the effect of several influencingparameters such as external environment (e.g., temperature)and concrete mixture on the electrical resistivity. In addition,some of bulk and surface resistivity test setups (both oflaboratory and field tests) conducted by authors are alsopresented.
2. Theoretical Background
2.1. Concept. Electrical resistivity (𝜌) of a material is definedas its capability to withstand the transfer of ions subjected toan electrical field. It is largely dependent on the microstruc-ture properties of concrete such as pore size and shape of theinterconnections (i.e., tortuosity) [6]. Specimens with similardegree of water saturation and temperature should be usedas both of these factors affect resistivity. Lower permeabilityresults from a finer pore network with less connectivity andeventually leads to higher electrical resistivity. The rangespanned by resistivity is one of the greatest of any material
property [12]. For concrete, it varies from 106Ω⋅m for ovendried samples to 10Ω⋅m for saturated concrete [13]. Electricalresistivity is the ratio between applied voltage (𝑉) andresulting current (𝐼) multiplied by a cell constant and theelectrical current is carried by ions dissolved in the poreliquid [7, 14]. Thus, it is a geometry independent propertyand an inherent characteristic of a material, as described inthe following [6, 14]:
𝜌 = 𝑘 ⋅ 𝑅 = 𝑘 ⋅ (𝑉𝐼 ) , (1)
where 𝑅 is the resistance of concrete; 𝑘 is a geometricalfactor which depends on the size and shape of the sampleas well as the distance between the probes on the testingdevice [6]. There are several factors that may affect electricalresistivity of concrete, and they can be divided into twogroups: (1) intrinsic factors affecting the electrical resistivityof concrete, such as w/c ratio, aging, and pore structure;(2) factors affecting the resistivity measurements, includingspecimen geometry,moisture content, temperature, electrodespacing, and presence of rebar. For instance, more pore wateras well as wider pores results in lower concrete resistivity andenvironmental factors such as higher temperature decreasesthe resistivity values [7]. Furthermore, adding reactive sup-plementary cementitious materials such as blast furnace slagand fly ash leads to lower permeability and higher electricalresistivity due to reduction in capillary porosity and hydroxylions (OH−). Both carbonation and chloride penetrationalso individually cause an increase in concrete resistivityin particular in Portland cement concrete but penetratedchloride impact is relatively small [7].The effects of the above-mentioned parameters will be discussed in detail later in thispaper.
2.2. Measurement Techniques. Electrical resistivity measure-ments can be performed in several ways nondestructively:using electrodes positioned on a specimen surface, or placingan electrode-disc or linear array or a four-probe square arrayon the concrete’s surface. Types of device techniques that canbe used typically to measure resistivity physically include (1)bulk electrical resistivity test, (2) surface disc test, (3)Wennerfour-point line array test, and (4) four-probe square array test.
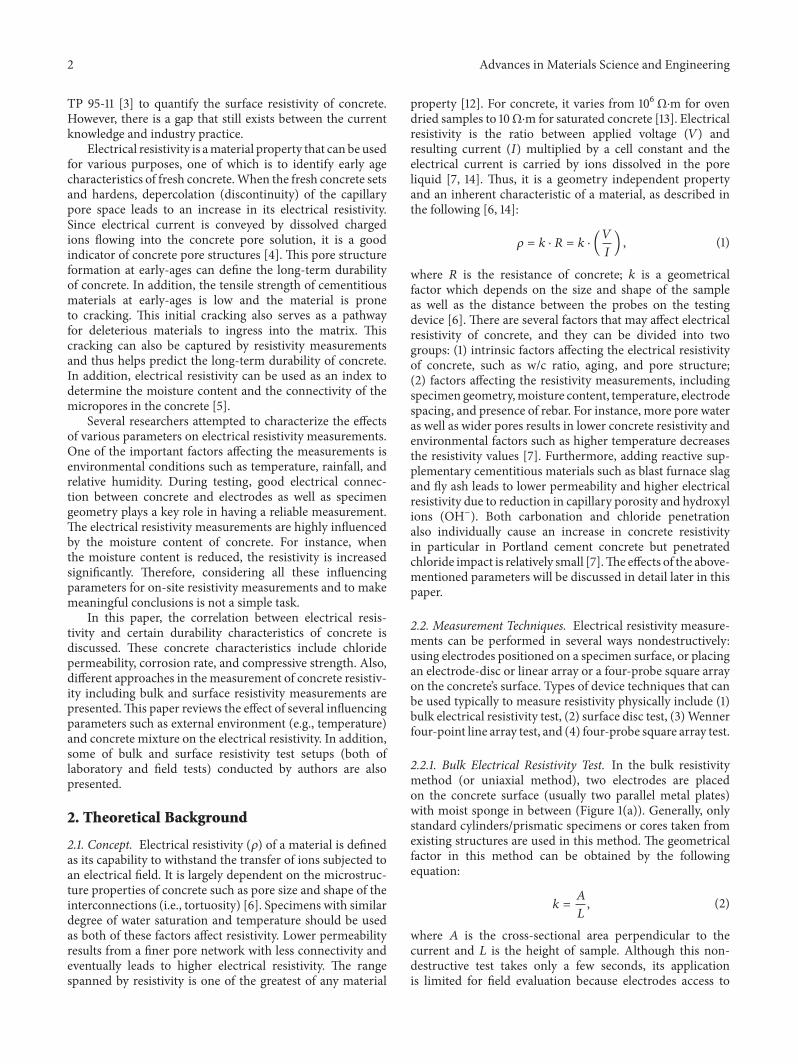
2.2.1. Bulk Electrical Resistivity Test. In the bulk resistivitymethod (or uniaxial method), two electrodes are placedon the concrete surface (usually two parallel metal plates)with moist sponge in between (Figure 1(a)). Generally, onlystandard cylinders/prismatic specimens or cores taken fromexisting structures are used in this method. The geometricalfactor in this method can be obtained by the followingequation:
𝑘 = 𝐴𝐿 , (2)
where 𝐴 is the cross-sectional area perpendicular to thecurrent and 𝐿 is the height of sample. Although this non-destructive test takes only a few seconds, its applicationis limited for field evaluation because electrodes access to
Advances in Materials Science and Engineering 3
V
cylinder with length L, and cross section area A
Metal plate
Moist sponge
4-× 8-inch concrete
0.5 to 10 kHz
∼
(a)
cylinder with length L, and cross section area A
V
a
Electrodes, spacing a
0.01 to 10 kHzA
4-× 8-inch concrete
(b)
Figure 1: Electrical resistivity measuring techniques: (a) two-point uniaxial method and (b) four-point (Wenner probe) method (reproducedfrom [6]).
opposite sides of the concrete element is not possible all thetime; while other above-mentioned resistivity measurement(surface disc test,Wenner four-point line array test, and four-probe square array test) methods may use probes placed ononly one side surface of specimen.
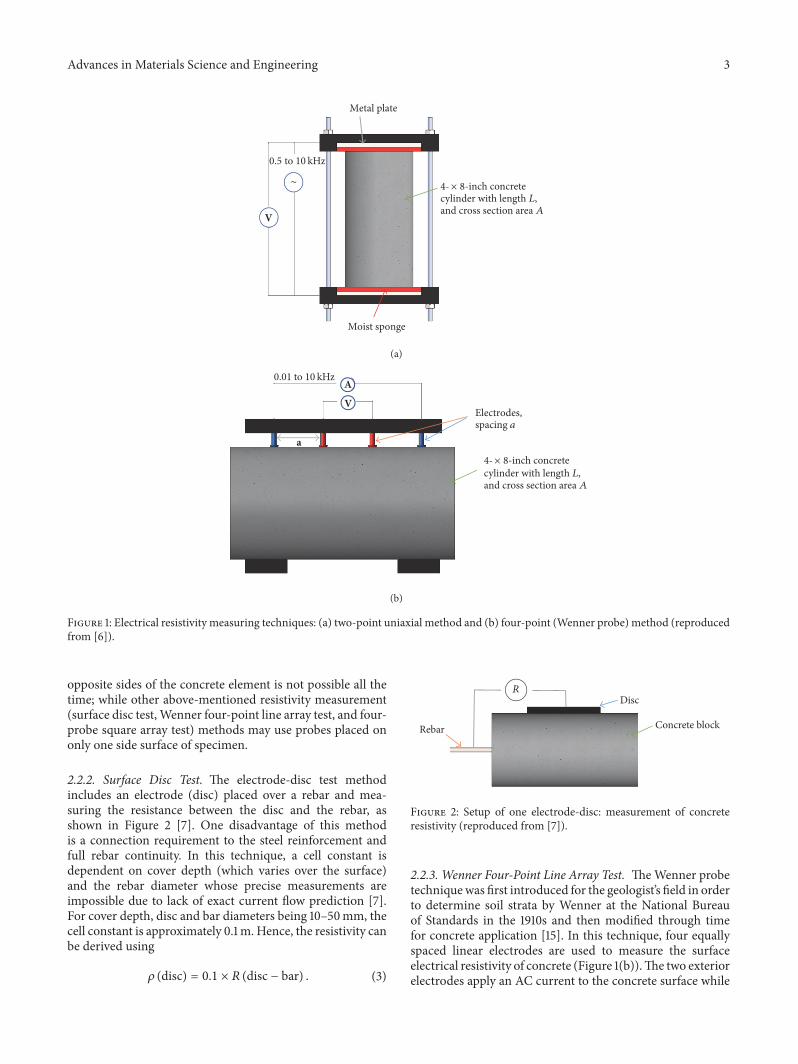
2.2.2. Surface Disc Test. The electrode-disc test methodincludes an electrode (disc) placed over a rebar and mea-suring the resistance between the disc and the rebar, asshown in Figure 2 [7]. One disadvantage of this methodis a connection requirement to the steel reinforcement andfull rebar continuity. In this technique, a cell constant isdependent on cover depth (which varies over the surface)and the rebar diameter whose precise measurements areimpossible due to lack of exact current flow prediction [7].For cover depth, disc and bar diameters being 10–50mm, thecell constant is approximately 0.1m. Hence, the resistivity canbe derived using
𝜌 (disc) = 0.1 × 𝑅 (disc − bar) . (3)
Concrete blockRebar
DiscR
Figure 2: Setup of one electrode-disc: measurement of concreteresistivity (reproduced from [7]).
2.2.3. Wenner Four-Point Line Array Test. TheWenner probetechniquewas first introduced for the geologist’s field in orderto determine soil strata by Wenner at the National Bureauof Standards in the 1910s and then modified through timefor concrete application [15]. In this technique, four equallyspaced linear electrodes are used to measure the surfaceelectrical resistivity of concrete (Figure 1(b)).The two exteriorelectrodes apply an AC current to the concrete surface while
4 Advances in Materials Science and Engineering
the electrical potential is measured from the interior probes.It should be noted that DC current is not desirable as itmay result in inaccurate readings because of polarizationeffect. The effect of current frequencies on measurements isdiscussed in Section 5.2.6 (studies on electrical signal shapeand frequency). The constant cell is defined as (4) for semi-infinite homogenous material [6]:
𝑘 = 𝛾 ⋅ 𝑎, (4)
where 𝑎 is the distance between the equally spaced electrodesand 𝛾 is the dimensionless geometry factor which is equalto 2𝜋 for semi-infinite concrete elements such as concreteslabs [6]. However, the geometry factor is different for testsconducted in a laboratory condition on small cylinders orcubic specimens. To measure the surface electrical resistivity,AASTHO TP 95-11 is the only specified standard whichrequires an electrode spacing of 1.5 inch (or 38mm) withan AC frequency of 13Hz [3]. Due to its configuration, thismethod is reliable for on-site measurement; however manyfactors that will be discussed in Section 5 can affect theresults such as rebar and cracks presence, surface conditions,concrete mixture, and environmental conditions.
2.2.4. Four-Probe Square Array Test. The four-probe squarearray consists of the four probes that are arranged in squareposition with spacing of 50 to 100mm [10].
2.3. Applications. Electrical resistivity can be related to cer-tain performance characteristics of concrete and can be usedas a promising quality assurance tool for fresh or hardenedconcrete [6]. Some of these correlations will be discussed inthe following sections. It can be used as ameasure of concreteresistance to chloride ingress as well as corrosion initiationand rate measurements. The concrete diffusion coefficient asan important factor in the service life estimation of structuresalso can be obtained by electrical resistivity technique. Inaddition, it is a reliable test method to detect and monitorthe initiation and propagation of cracks in concrete sincethey change the connectivity of concrete pore structure, andthus its electrical conductivity [16]. Cement mortars andconcrete setting time can be determined through the conceptof electrical resistivity. However, the correlation betweensetting time and concrete durability is not fully understood.Another potential application of the electrical resistivitymethod is to compute the moisture content of concrete,although reliability of this method is still under question [5].However, electrical resistivity method is a simple and reliablenondestructive test method; the application and reliabilityof this method in determining certain characteristics ofconcrete has yet to be widely evaluated. This is more dueto the limited knowledge in this area especially for on-siteevaluation.
3. Objective and Methodology
The primary objective of this paper is to review the existingstate of practice on the electrical resistivity measurementstechnique. This paper also identifies the applicability and
limitation of electrical resistivitymethod and reviews the cor-relation between resistivity and certain durability propertiesof concrete. Correlation between surface and bulk electricalresistivity and their applications is also discussed. Finally,key parameters affecting the electrical resistivity readings areidentified for future research in the area.
An extensive literature search was undertaken frommostrelevant publications in the area. A comparison was madeof the experimental setup (Section 4), and the way inwhich the correlated data was obtained between resistivityand durability properties of concrete (Sections 6–8). Severalparameters influencing the concrete resistivitywere identifiedand compared (Section 5). The information observed fromthe literatures was based on experimental and numericalstudies. The reviewed data was compiled in tables and latercompared. Detailed information on the experimental setupsis presented in Abbreviations section and Tables 1–4. Theliterature search covered both laboratory and field investiga-tion.
4. Comparison of the ExperimentalInvestigations
In this section, experimental setups developed by otherresearchers have been summarized in Tables 1–4.These tablesconsist of specimens’ configuration, materials type, resistivitymeasurement techniques, and specimen curing/exposureconditions. The data in the tables is arranged in the orderin which the citations appear in Sections 5–8. An additionalrow that contains authors’ data on measuring electricalresistivity of simulated field circular hollow-section columnsis also included. The extent to which differences in thesetups can influence electrical resistivity measurements arediscussed later in Sections 5–8 using data presented in thissection. A comparison of the experimental setups is given inSections 4.1–4.3. Abbreviations and symbols are defined inAbbreviations section.
4.1. Specimen Geometry and Setup. Frequently, in the elec-trical resistivity studies, samples with dimensions between100 and 400mmwere used (Table 1). Specimens with dimen-sions over 1000mm to simulate real-world condition weremore seldom used. According to Table 2, the steel rebardiameter varied from 4 to 25mm. In most cases, no detailedinformation was provided about the type of steel embedded;both smooth and ribbed steel was used. Cover depth rangingfrom 10 to 80mm was considered for steel reinforcementbars in the majority of the experimental investigations. Forthose studies investigating the relationship between steelreinforcement corrosion and concrete resistivity, chlorideingress was the major cause of corrosion. However, noinformation was provided on the size of the anode and theratio between anode and cathode in the reviewed articles.Only one study concentrated solely on carbonation-inducedcorrosion.
4.2. Materials and Exposure Conditions. According to datain Table 1, concrete or mortar samples were casted with aw/b ratio between 0.4 and 0.65 by mass in most reviewed

Advances in Materials Science and Engineering 5Ta
ble1:Detailsof
thes
pecimen
geom
etry
(interm
sofspecimen
size),m
aterialtype,andnu
mbero
fspecimens.
Refs
Specim
enconfi
guratio
nMaterialstype
w/b
ratio
Rebar
presence
Type
Size
(mm)
TNVM
Mixtype
OPC
SLG
FAMK
SFOthers
[4]
Disk
Φ100×5
044
CON/CEM
××
×—
×(5%
&10%)
NP(30%
and
50%)
0.35,0.4,0.45
N
[16]
Slab
254×7
6×1
2.7
18CO
N×T
ypeI
—×
——
—0.26
N
[22]
Cylin
der
Φ47×9
530
CEM
×TypeI
—×(
classes
C&F)
——
CaCO3
(10%
&15%)
0.35
N
[23]
Slab
250×2
00×1
201
CON
×—
——
——
0.5
Y
[8]
Slab,cub
e,cylin
der
300×3
00×1
35,
300×3
00×2
00,
100×1
00×1
00,
Φ100×2
00
6CO
N×(
blended)
—×(
20%
blended)
——
—0.4
Y
[24]
Prism
300×3
00×1
507
CON
×TypeI
—×
——
—0.42
Y
[25]
Cylin
der,prism
Φ100×2
00,
Φ150×3
00,
200×2
00×1
75,
160×1
60×1
40,
120×1
20×1
10
NR
CON
×TypeI
——
——
—0.4,0.6
Y
[26]
Cylin
der,prism
Φ150×3
00,
40×4
0×1
60NR
MOR
×—
——
——
0.5
Y
[27]
Prism
400×4
00×1
006
MOR
×—
——
——
0.6
Y[28]
Cylin
der
Φ150×2
204
CON
×—
——
——
0.4,0.6
Y
[29]
Slab,cub
e650×6
5 0×1
00,
150×1
50×1
501
CON
×—
——
——
0.5
N
[30]
Slab
600×6
00×1
209
CON
×—
——
——
0.36,0.48,
0.61
Y
[11]
Beam
1500
×200
×100
2CO
N×
——
——
×0.7
N
[31]
Cylin
der
Φ100×2
0021
CON
×TypeI/II
×(grades
100&
120,50%)
×(cla
sses
C&F,20%)
—×(
5%&
10%)
—0.35,0.5,0.65
N
[32]
Cylin
der
Φ100×2
0033
CON
×TypeI/II
—×
—×
—0.41
N[33]
Cube
150×1
50×1
5047
CON
××
——
——
0.4–
0.55
N[34]
Prism
100×1
00×1
7012
CON
××(
50%and70%)
——
—WPC
0.3,0.42,0.55
N
[35]
Cylin
der
Φ150×3
003
CON
×TypeI
——
——
—0.45,0.55,
0.65
N
[36]
Cylin
der
Φ75×1
50NR
CON
×TypeV
——
——
—0.45
N
[37]
Cube,cylinder,
block
100×1
00×1
00,
Φ100×2
00,
Φ 150×3
00,
300×3
00×2
00
NR
CON
×(blended)
—×(
18%
blended)
——
—0.4
N
[38]
Cube
150×1
50×1
50NR
CON
××
——
×PF
A0.59–0
.7N
[39]
Cylin
der
Φ100×2
0012
CON
××
××
×Micro-FA
0.3–0.4
N
[40]
Cube
150×1
50×1
5033
CON
×TypeI
&Ty
peV
×—
——
—NR
N
[41]
Cylin
der
Φ100×2
0019
CON
××
×—
×—
0.41
N
[42]
Slab,cylinder
280×2
80×1
02,
Φ102×2
04NR
CON
××
××
—MS
0.35–0
.45
N
[43]
NR
NR
NR
MOR/CE
M×T
ypeI
——
——
—0.42
N[44]
Cylin
der
Φ100×2
0012
CON
××
×—
——
0.41
N

6 Advances in Materials Science and Engineering
Table1:Con
tinued.
Refs
Specim
enconfi
guratio
nMaterialstype
w/b
ratio
Rebar
presence
Type
Size
(mm)
TNVM
Mixtype
OPC
SLG
FAMK
SFOthers
[45]
Block
300×3
00×2
003
CON
××
——
—PF
A0.39,0.4,0.44
Y
[46]
Slab,cylinder
610×6
10×1
52,
Φ100×2
00,
Φ150×3
0010
CON
××
×(cla
ssF)
——
MS
0.43
Y
[47]
Prism
1000
×100
0×
300,
150×2
70×1
50NR
CON
×—
×—
——
0.35–0
.65
Y
[48]
Cylin
der
Φ100×2
00NR
CON
×TypeI/II
—×(
20%)
—×(
8%)
—0.4
N[49]
Cylin
der
Φ100×2
0010
CON
××(
SC)
——
——
0.45,0.65
Y[50]
Prism
100×1
00×3
0012
CON
××
×—
——
0.4,0.45,0.5
Y
[51]
Cylin
der,cube
Φ100×2
00,
100×1
00×1
0012
CON
××
——
×—
0.25,0.28,
0.35
N
[52]
Cylin
der
Φ100×2
0012
CON
××
××
×(Sup
erfin
efly
ash)
0.28–0
.49
N
[53]
Cylin
der
Φ100×2
0011
CON
××
×—
——
0.37–0
.45
N
[54]
Cylin
der
Φ100×2
00343
CON
×TypeI/II
—×(
classC,
25%)
——
—0.42
N
[55]
Cylin
der
Φ100×2
00514
CON
××
×(cla
ssF)
——
—0.41
N[56]
Cylin
der
Φ100×2
0057
CON
×TypeI
——
××
RHA,N
P0.4–
0.6
N
[57]
Cube,slab
100×1
00×1
00,
250×2
50×1
0010
CON
××
—(5%,10%
,20%)
—MS(5%and
10%)&
PFA
(30%
)0.52
N
[58]
Disk
Φ100×5
06
CON
××(
30%)
——
×(10%)
—0.25,0.28,
0.35
N
[59]
Cylin
der
Φ150×3
0024
CON
××(
50%)
——
8%NP(12%
,25%)
0.28–0
.6N
[60]
Cylin
der
Φ150×2
004
CON
×—
——
——
0.4,0.6
Y
[21]
Cylin
der,prism
Φ102×1
78,
406×7
6×1
02NR
MOR
×—
——
—WPC
0.42
N
[61]
Cylin
der
Φ100×2
0033
CON
×TypeII–V
(grades100
&120)
(classes
C&
F)×
×—
0.44
N
[62]
Cylin
der
Φ100×2
00,
Φ150×3
0023
CON
×TypeII–V
×(grade120)
(classF,20%)
××
—0.44
N
AuthorsH
ollowsection,
cylin
der
Innerd
ia.152
andexternaldia.
304,
Φ100×2
00
18CO
N×
×—
×—
CA(2%),
PLC
0.5
Y
Advances in Materials Science and Engineering 7
Table 2: Details of the reinforcements and measurement methods used to record corrosion rate.
Refs
ReinforcementCause of corrosion
Corrosion rate
Φ (mm) Length (mm) Cover depth(mm) Technique Details
Correctionfor ohmic
drop[23] 10 200 1, 10, 20 Carbonation — — —
[8] 10 300 50 & 75
Not studied (NS)(only effect of rebar
presence on resistivitymeasurement was
considered)
— — —
[24] 16 300 50 Cyclic ponding withsea water — — —
[25] 4 110, 160, 200 Various(53.5–100) NS — — —
[26] 8 40 80 NS — — —[27] 13, 19, 25 410 20, 30, 40 NS — — —
[28] 10 250 150 NaCl solution/marineexposure LPR Embedded
steel rebar N
[30] 10 — 25 NS — — —
[45] 16 200 50 NaCl solution/marineexposure — — —
[46] NR NR NR NaCl solution LPR NR NR[47] NR NR 70 NaCl solution — — —
[49] 16 NR 42 NaCl solution NR Embeddedsteel rebar NR
[50] 8 150 10 or 30 NaCl solution LPREmbeddedCE & RE onthe surface
N
[60] 10 200 15 NaCl solution — — —
Authors 10 914 19–38 NaCl solution LPR Embeddedsteel rebar Y
experimental programs.Themixture proportions and cementcontent varied and blended cements such as fly ash or slagcements were used in parts of studies. In a couple of studies,no detailed information was provided about the cementtype. However, ASTM Type I and CEM I/II cements wereused in most of the articles. Only one reported study usedWhite Portland Cement (WPC) [34]. Also, Rice Husk Ash(RHA) as a cementitious supplementary material was onlystudied by Gastaldini et al. [63]. Work done by authors of thispaper seems to be the only one that considered crystallineadmixture as a healing agent to investigate its effect onelectrical resistivity of concrete.
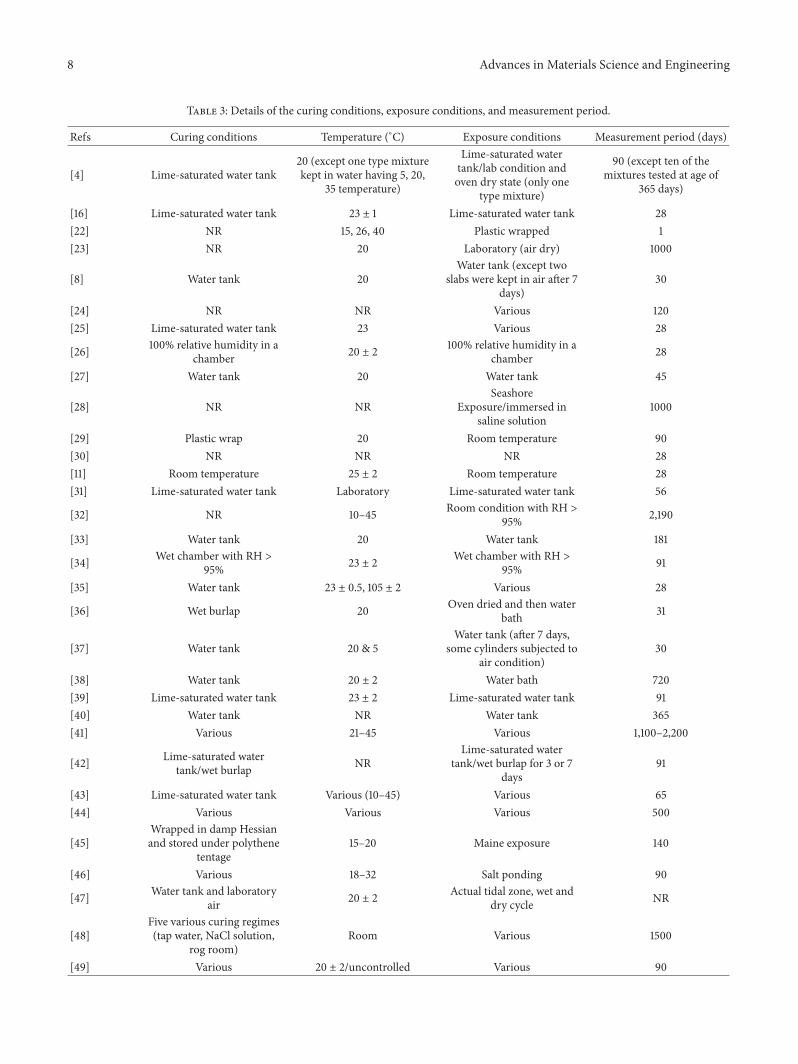
The specimens were cured and exposed to various and/orchanging conditions over the testing period (Table 3). Inmoststudies, samples were cured in the lime-saturated water tankwith controlled temperature to eliminate the temperatureeffect on resistivity measurements. The temperature waskept constant between 20∘C and 25∘C in most experiments.To achieve a wide range of concrete resistivity, drier cli-mates were considered occasionally. In most experiments,specimens were kept in a water tank during resistivitymeasurements or exposed to a high relative humidity (RH).For those studies focused on accelerating corrosion process,
RH between 90% and 95% was chosen as an exposureregime. In parts of studies, samples were exposed to outsideclimates, in particular marine conditions (similar to authors’experimental setup). In general, laboratory experiments wereundertaken over a period between 28 and 365 days. Only afew studies measured electrical resistivity for a period overone year [42, 50, 64, 65].
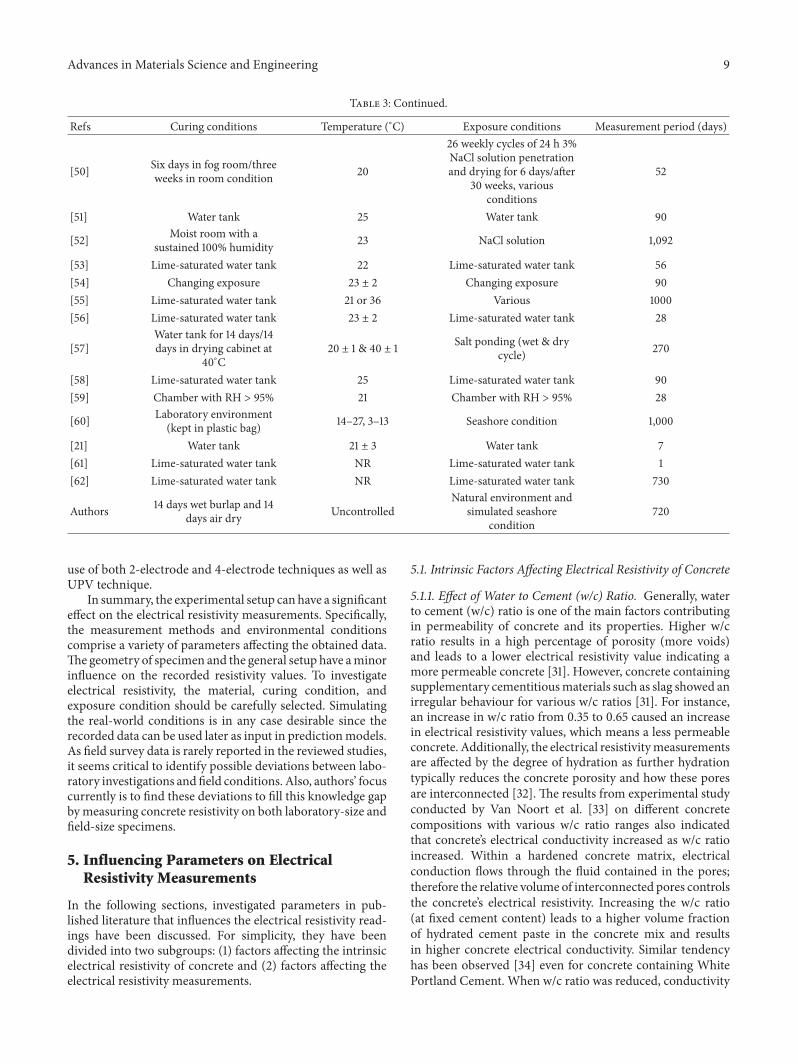
4.3. Measurement Methods. Either two-electrode or four-point electrode (Wenner probe setup) techniques wereemployed to record concrete electrical resistance, which isthen converted into resistivity by multiplying it with anappropriate geometrical factor.The limitations of 2-electrodemethod resulted in using Wenner probe configurations inmost studies specially for field investigations. In experi-mental studies that attempted to find correlation betweenconcrete electrical resistivity and its durability parameters,other destructive and nondestructive testing techniques fromstandardized measuring protocol including Rapid ChloridePermeability (RCP) test, Rapid Chloride Migration (RCM)test, Bulk Diffusion (BD) test, and Ultrasonic Pulse Velocity(UPV) were employed. Authors ongoing work also employs
8 Advances in Materials Science and Engineering
Table 3: Details of the curing conditions, exposure conditions, and measurement period.
Refs Curing conditions Temperature (∘C) Exposure conditions Measurement period (days)
[4] Lime-saturated water tank20 (except one type mixturekept in water having 5, 20,
35 temperature)
Lime-saturated watertank/lab condition andoven dry state (only one
type mixture)
90 (except ten of themixtures tested at age of
365 days)
[16] Lime-saturated water tank 23 ± 1 Lime-saturated water tank 28[22] NR 15, 26, 40 Plastic wrapped 1[23] NR 20 Laboratory (air dry) 1000
[8] Water tank 20Water tank (except two
slabs were kept in air after 7days)
30
[24] NR NR Various 120[25] Lime-saturated water tank 23 Various 28
[26] 100% relative humidity in achamber 20 ± 2 100% relative humidity in a
chamber 28
[27] Water tank 20 Water tank 45
[28] NR NRSeashore
Exposure/immersed insaline solution
1000
[29] Plastic wrap 20 Room temperature 90[30] NR NR NR 28[11] Room temperature 25 ± 2 Room temperature 28[31] Lime-saturated water tank Laboratory Lime-saturated water tank 56
[32] NR 10–45 Room condition with RH >95% 2,190
[33] Water tank 20 Water tank 181
[34] Wet chamber with RH >95% 23 ± 2 Wet chamber with RH >
95% 91
[35] Water tank 23 ± 0.5, 105 ± 2 Various 28
[36] Wet burlap 20 Oven dried and then waterbath 31
[37] Water tank 20 & 5Water tank (after 7 days,
some cylinders subjected toair condition)
30
[38] Water tank 20 ± 2 Water bath 720[39] Lime-saturated water tank 23 ± 2 Lime-saturated water tank 91[40] Water tank NR Water tank 365[41] Various 21–45 Various 1,100–2,200
[42] Lime-saturated watertank/wet burlap NR
Lime-saturated watertank/wet burlap for 3 or 7
days91
[43] Lime-saturated water tank Various (10–45) Various 65[44] Various Various Various 500
[45]Wrapped in damp Hessianand stored under polythene
tentage15–20 Maine exposure 140
[46] Various 18–32 Salt ponding 90
[47] Water tank and laboratoryair 20 ± 2 Actual tidal zone, wet and
dry cycle NR
[48]Five various curing regimes(tap water, NaCl solution,
rog room)Room Various 1500
[49] Various 20 ± 2/uncontrolled Various 90
Advances in Materials Science and Engineering 9
Table 3: Continued.
Refs Curing conditions Temperature (∘C) Exposure conditions Measurement period (days)
[50] Six days in fog room/threeweeks in room condition 20
26 weekly cycles of 24 h 3%NaCl solution penetrationand drying for 6 days/after
30 weeks, variousconditions
52
[51] Water tank 25 Water tank 90
[52] Moist room with asustained 100% humidity 23 NaCl solution 1,092
[53] Lime-saturated water tank 22 Lime-saturated water tank 56[54] Changing exposure 23 ± 2 Changing exposure 90[55] Lime-saturated water tank 21 or 36 Various 1000[56] Lime-saturated water tank 23 ± 2 Lime-saturated water tank 28
[57]Water tank for 14 days/14days in drying cabinet at
40∘C20 ± 1 & 40 ± 1 Salt ponding (wet & dry
cycle) 270
[58] Lime-saturated water tank 25 Lime-saturated water tank 90[59] Chamber with RH > 95% 21 Chamber with RH > 95% 28
[60] Laboratory environment(kept in plastic bag) 14–27, 3–13 Seashore condition 1,000
[21] Water tank 21 ± 3 Water tank 7[61] Lime-saturated water tank NR Lime-saturated water tank 1[62] Lime-saturated water tank NR Lime-saturated water tank 730
Authors 14 days wet burlap and 14days air dry Uncontrolled
Natural environment andsimulated seashore
condition720
use of both 2-electrode and 4-electrode techniques as well asUPV technique.
In summary, the experimental setup can have a significanteffect on the electrical resistivity measurements. Specifically,the measurement methods and environmental conditionscomprise a variety of parameters affecting the obtained data.The geometry of specimen and the general setup have aminorinfluence on the recorded resistivity values. To investigateelectrical resistivity, the material, curing condition, andexposure condition should be carefully selected. Simulatingthe real-world conditions is in any case desirable since therecorded data can be used later as input in predictionmodels.As field survey data is rarely reported in the reviewed studies,it seems critical to identify possible deviations between labo-ratory investigations and field conditions. Also, authors’ focuscurrently is to find these deviations to fill this knowledge gapbymeasuring concrete resistivity on both laboratory-size andfield-size specimens.
5. Influencing Parameters on ElectricalResistivity Measurements
In the following sections, investigated parameters in pub-lished literature that influences the electrical resistivity read-ings have been discussed. For simplicity, they have beendivided into two subgroups: (1) factors affecting the intrinsicelectrical resistivity of concrete and (2) factors affecting theelectrical resistivity measurements.
5.1. Intrinsic Factors Affecting Electrical Resistivity of Concrete
5.1.1. Effect of Water to Cement (w/c) Ratio. Generally, waterto cement (w/c) ratio is one of the main factors contributingin permeability of concrete and its properties. Higher w/cratio results in a high percentage of porosity (more voids)and leads to a lower electrical resistivity value indicating amore permeable concrete [31]. However, concrete containingsupplementary cementitiousmaterials such as slag showed anirregular behaviour for various w/c ratios [31]. For instance,an increase in w/c ratio from 0.35 to 0.65 caused an increasein electrical resistivity values, which means a less permeableconcrete. Additionally, the electrical resistivitymeasurementsare affected by the degree of hydration as further hydrationtypically reduces the concrete porosity and how these poresare interconnected [32]. The results from experimental studyconducted by Van Noort et al. [33] on different concretecompositions with various w/c ratio ranges also indicatedthat concrete’s electrical conductivity increased as w/c ratioincreased. Within a hardened concrete matrix, electricalconduction flows through the fluid contained in the pores;therefore the relative volume of interconnected pores controlsthe concrete’s electrical resistivity. Increasing the w/c ratio(at fixed cement content) leads to a higher volume fractionof hydrated cement paste in the concrete mix and resultsin higher concrete electrical conductivity. Similar tendencyhas been observed [34] even for concrete containing WhitePortland Cement. When w/c ratio was reduced, conductivity
10 Advances in Materials Science and Engineering
Table 4: Details of the different measurement methods used in the literature.
RefsMeasurement technique
Concrete resistivity Rapid chloridepermeability test Others
Two-electrode Four-point method
[4] × — — Rapid chloride migration test (NT Build492) & ASTM C1760
[16] × — — —[22] × — — —[23] × × — Multiring electrodes[8] × × — NT Build 492[24] — × — —[25] — × — —[26] × × — —[27] — × — —[28] — × — Steel potential[29] × × — —[30] — × — Ultrasonic Pulse Velocity[11] — × — Electric imaging[31] — × × —[32] — × — —[33] × — — NT Build 492[34] — × — —[35] — × — —[36] × — — —[37] × × — NT Build 492[38] × — — —[39] × × — —[40] × × — —[41] — × — —
[42] × × ×(ASTM C1202) —
[43] × × — —[44] — × — —[45] × — — —
[46] × × ×(AASHTO T227) Half-cell potential
[47] × × — —[48] — × — —[49] — × — —[50] × — — Steel corrosion potential[51] × — — NT BUILD 492[52] — × — ASTM C1556-04
[53] × × ×(ASTM C1202) —
[54] — × × KDOT Boil Testing
[55] — × — Bulk diffusion test (NT Build 443), NTBuild 492
[56] — × × Water Penetration Depth
[57] — — — Resistivity using disc method (oneexternal electrode)
[58] × × — NT Build 492[59] — × — Natural diffusion test (90 days)[60] — × — Half-cell potential method
Advances in Materials Science and Engineering 11
Table 4: Continued.
RefsMeasurement technique
Concrete resistivity Rapid chloridepermeability test Others
Two-electrode Four-point method[21] × × — —[61] × × — —[62] × × — —Authors × × × UPV, half-cell potential, infrared camera
of pore solution was increased due to the greater ionicconcentration of the solution. Su et al. [35] studied the effectof moisture content on concrete resistivity measurements.It was found that the electrical resistivity difference formixes with 0.55 and 0.65 w/c ratios was not noticeable,although it became significant for specimens with a w/cratio of 0.45. It seems that both the capillary pore size effectand interconnectivity effect improve resistivity for saturatedconcrete with a higher w/c ratio. Long-term experimentalstudy also showed the reduction in concrete resistivity withthe increase of w/c ratio until approximately 500 days.However, after 500 days, the resistivity results revealed acontrary behaviour because the concrete specimens kept inunsaturated condition (in a laboratory environment) withhigher w/c ratio favored the carbonation process that ledto larger resistivity values for more advanced ages. Saleemet al. [36] also found similar trend for concrete samplescontaminated with sulphate/chloride. About 15–20% reduc-tion in electrical resistivity values was reported when thewater/cement ratio increased from 0.4 to 0.6 [25].
5.1.2. Effect of Aggregate Size and Type. In general, aggregatesdepending on their location and size have a higher electricalresistivity compared to hardened cementitious paste becausethey have less porosity; thus electrical current can easilyflow through the pore system of the paste. Hence, a numberof researchers attempted to investigate aggregates’ effect onelectrical resistivity measurements. The experimental studyperformed by Sengul [4] indicated that increasing aggre-gate content resulted in higher electrical resistivity. He alsoobserved that the resistivity of the mixture containing 60%aggregate with the size of 16–32mm was approximately 3times higher than that of the hardened cement paste [4].Increase in aggregate content and reduction in cement pastefor a given volume resulted in higher resistivity valuesbecause of replacing the porous hardened cement paste withdenser aggregates. The investigation on comparing effectof two different aggregate sizes (0–4mm and 16–32mm)on electrical resistivity showed that larger aggregate sizeresulted in higher electrical resistivity values. Morris et al.[18] also reported that the variability was greater on thespecimens with larger maximum aggregate size. Two possiblecauses of this variability originate from the tortuosity effectand formation of more interfacial transition zone (ITZ)(more porous structure compared to bulk cement paste)for smaller aggregate/particle size. Therefore, variation in
aggregate content and size should be taken into account whencomparing the resistivity values of different concretes.
As reported in the Sengul study [4], aggregate type alsoaffected the electrical resistivity of concrete. For electricalresistivity measurements, comparison between the crushedlimestone aggregate and gravel showed higher values whencrushed limestone was used [4]. Gravel was rounded shapedaggregates with smooth surface whereas the limestone aggre-gates have rough surface texture. Therefore, using roundedaggregates such as gravel results in poor bonding betweengravel and cement paste which may also be a reason behindthe variations in resistivity readings. In addition, tortuositycan be higher for crushed stone aggregates due to therough surface texture and irregular particle shape, which,in turn, may reduce the rate of electrical flow and affectresistivity [4]. Comparable standard deviation values werealso observed when different aggregate type was used withthe same maximum aggregate size [18]. Furthermore, usinggranite as coarse aggregate with fly ash also resulted inhigher resistivity measurements than the mixture containinglimestone aggregate type [44]. Hence, the effects of aggregatetype should not be ignored during resistivity measurements.
5.1.3. Effect of Curing Conditions. The resistivity evolutionof concrete is affected by the curing regimes [48]. Two keyelements influence this variation in resistivity: the degreeof hydration of the cementitious material and the degree ofsaturation of the specimen. The numerical study performedby Weiss et al. [70] attempted to simulate a mortar with awater to cement ratio of 0.42 with three curing conditions: (a)sealed during curing and testing, (b) sealed during curing andsaturated during testing, and (c) saturated during curing andtesting. It was concluded that the specimen that was sealedduring both curing and testing had the highest resistivitywhereas the sample that was sealed during curing andsaturated at the time of testing had the lower most resistivity[70].This difference can be explained by the saturation degreeof the sample. The results recommend that storing a sampleunderwater in the lab may cause a remarkably differentdegree of hydration than what may occur in a field structure.The sample that was continually saturated and the samplethat was sealed and saturated at the time of testing had asimilar resistivity for the same degree of hydration; however,the continually saturated sample had a higher degree ofhydration at the same age [70]. For specimens cured undersaturated lime water, it has also been hypothesized that
12 Advances in Materials Science and Engineering
the volume of solution in which samples are stored canaffect resistivity measurements due to possible pore solutionconcentration or dilution via leaching [43, 70]. Accordingto AASHTO TP 95-11 [3], for the samples cured in a lime-water tank, the average resistivity value needs to bemultipliedby 1.1 while this coefficient is 1 for the specimens stored ina 100% relative humidity moist room. For a given water-cement ratio, it was observed that better curing procedureyielded higher electrical resistivity [49]. For both wet anddry curing conditions experimented in the study [8], theresistivity distinctly increased with increasing age. Samplestorage and curing conditions are important, as they caninfluence the degree of hydration, the degree of saturation,and the pore structure and solution through leaching [43].Differences in resistivity can develop as a result of samplestorage conditions and wetting the specimens prior to theresistivity measurements is recommended.
5.2. Factors Affecting the Electrical Resistivity Measurements
5.2.1. Presence of Rebar. A number of researchers have beenexploring the effect of embedded rebar presence on concreteelectrical resistivity through experimental and numericalinvestigation. Theoretically, electrical current fluxes takepathways having the least amount of resistivity and whenthere is embedded rebar in concrete, the current field is dis-torted. However, the alternation in current field is dependenton many factors such as orientation of rebar with respect tothe probe, rebar diameter and spacing, and depth at which itis located [17, 23, 71].
Millard [71] and Gowers and Millard [17] utilized anexperimental setup with steel rebar in the tanks filled withconductive medium solution and its finite element modelingin order to study the effects of concrete cover thickness as wellas rebar diameter and spacing on concrete resistivity usingfour-point Wenner probe. According to this study, distancebetween the probe and embedded rebar was found to be themain influential parameter when measurements were takenon top of the bar. It was also reported that rebar diameteris not impactful in its disturbance. Moreover, it was foundthat measurement errors were increased by reducing rebarspacing while measurements are taken between two parallelrebars. However, it should be noted that results were obtainedfrom measurements on the conductive solution tank andnot from real concrete block. Similar study of resistivitymeasurements utilizing Wenner probe on concrete blockwith embedded steel reinforcement showed that orienting theprobe perpendicular to reinforcements significantly reducedtheir influence on resistivity measurements [23]. It is morecommon in reinforced concrete structures that rebars areavailable in both directions and electrically linked togetherbut, in the tested concrete block, no lateral rebarswere presentwhich thenmay have different effects onmeasured resistivity.
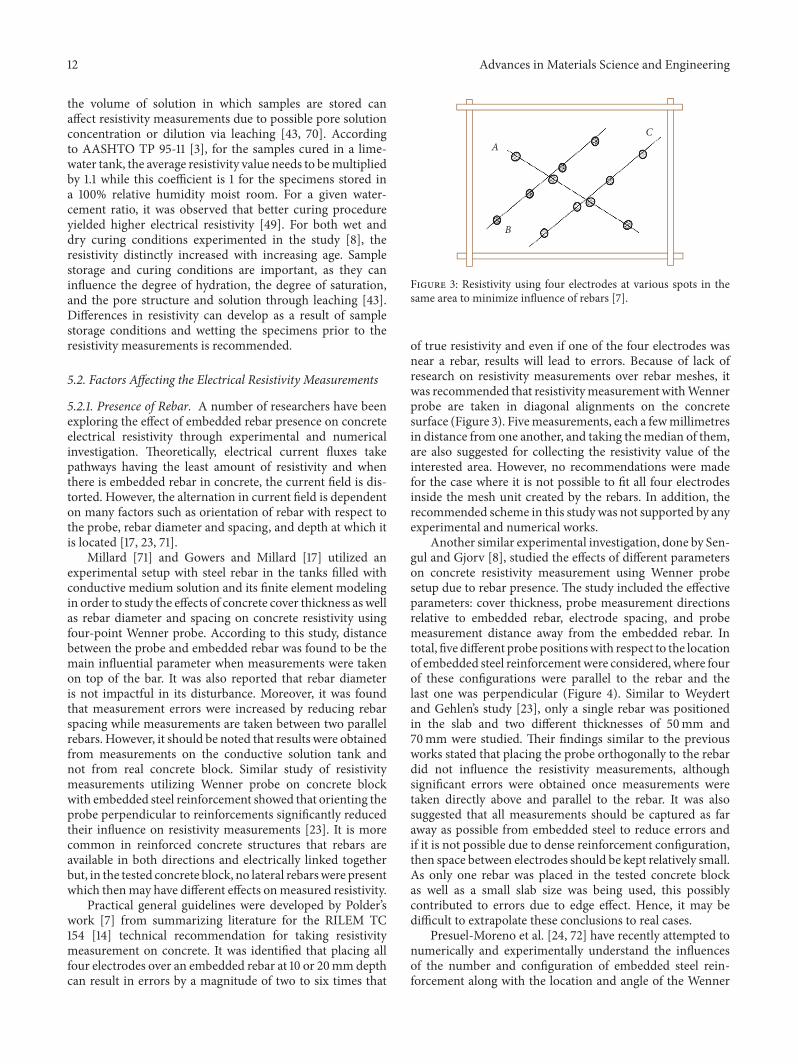
Practical general guidelines were developed by Polder’swork [7] from summarizing literature for the RILEM TC154 [14] technical recommendation for taking resistivitymeasurement on concrete. It was identified that placing allfour electrodes over an embedded rebar at 10 or 20mmdepthcan result in errors by a magnitude of two to six times that
CA
B
Figure 3: Resistivity using four electrodes at various spots in thesame area to minimize influence of rebars [7].
of true resistivity and even if one of the four electrodes wasnear a rebar, results will lead to errors. Because of lack ofresearch on resistivity measurements over rebar meshes, itwas recommended that resistivitymeasurementwithWennerprobe are taken in diagonal alignments on the concretesurface (Figure 3). Fivemeasurements, each a fewmillimetresin distance from one another, and taking themedian of them,are also suggested for collecting the resistivity value of theinterested area. However, no recommendations were madefor the case where it is not possible to fit all four electrodesinside the mesh unit created by the rebars. In addition, therecommended scheme in this study was not supported by anyexperimental and numerical works.
Another similar experimental investigation, done by Sen-gul and Gjorv [8], studied the effects of different parameterson concrete resistivity measurement using Wenner probesetup due to rebar presence. The study included the effectiveparameters: cover thickness, probe measurement directionsrelative to embedded rebar, electrode spacing, and probemeasurement distance away from the embedded rebar. Intotal, five different probe positionswith respect to the locationof embedded steel reinforcementwere considered, where fourof these configurations were parallel to the rebar and thelast one was perpendicular (Figure 4). Similar to Weydertand Gehlen’s study [23], only a single rebar was positionedin the slab and two different thicknesses of 50mm and70mm were studied. Their findings similar to the previousworks stated that placing the probe orthogonally to the rebardid not influence the resistivity measurements, althoughsignificant errors were obtained once measurements weretaken directly above and parallel to the rebar. It was alsosuggested that all measurements should be captured as faraway as possible from embedded steel to reduce errors andif it is not possible due to dense reinforcement configuration,then space between electrodes should be kept relatively small.As only one rebar was placed in the tested concrete blockas well as a small slab size was being used, this possiblycontributed to errors due to edge effect. Hence, it may bedifficult to extrapolate these conclusions to real cases.
Presuel-Moreno et al. [24, 72] have recently attempted tonumerically and experimentally understand the influencesof the number and configuration of embedded steel rein-forcement along with the location and angle of the Wenner
Advances in Materials Science and Engineering 13
1234
Embedded steel bar 5
Alignment of probes
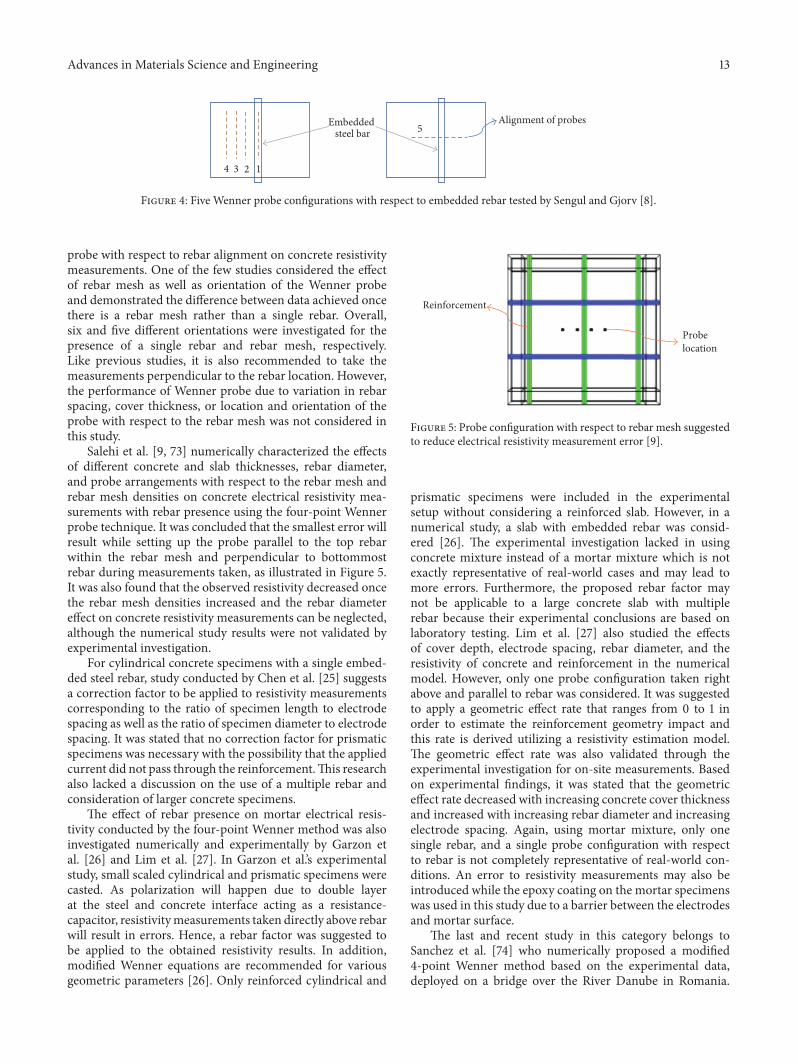
Figure 4: Five Wenner probe configurations with respect to embedded rebar tested by Sengul and Gjorv [8].
probe with respect to rebar alignment on concrete resistivitymeasurements. One of the few studies considered the effectof rebar mesh as well as orientation of the Wenner probeand demonstrated the difference between data achieved oncethere is a rebar mesh rather than a single rebar. Overall,six and five different orientations were investigated for thepresence of a single rebar and rebar mesh, respectively.Like previous studies, it is also recommended to take themeasurements perpendicular to the rebar location. However,the performance of Wenner probe due to variation in rebarspacing, cover thickness, or location and orientation of theprobe with respect to the rebar mesh was not considered inthis study.
Salehi et al. [9, 73] numerically characterized the effectsof different concrete and slab thicknesses, rebar diameter,and probe arrangements with respect to the rebar mesh andrebar mesh densities on concrete electrical resistivity mea-surements with rebar presence using the four-point Wennerprobe technique. It was concluded that the smallest error willresult while setting up the probe parallel to the top rebarwithin the rebar mesh and perpendicular to bottommostrebar during measurements taken, as illustrated in Figure 5.It was also found that the observed resistivity decreased oncethe rebar mesh densities increased and the rebar diametereffect on concrete resistivity measurements can be neglected,although the numerical study results were not validated byexperimental investigation.
For cylindrical concrete specimens with a single embed-ded steel rebar, study conducted by Chen et al. [25] suggestsa correction factor to be applied to resistivity measurementscorresponding to the ratio of specimen length to electrodespacing as well as the ratio of specimen diameter to electrodespacing. It was stated that no correction factor for prismaticspecimens was necessary with the possibility that the appliedcurrent did not pass through the reinforcement.This researchalso lacked a discussion on the use of a multiple rebar andconsideration of larger concrete specimens.
The effect of rebar presence on mortar electrical resis-tivity conducted by the four-point Wenner method was alsoinvestigated numerically and experimentally by Garzon etal. [26] and Lim et al. [27]. In Garzon et al.’s experimentalstudy, small scaled cylindrical and prismatic specimens werecasted. As polarization will happen due to double layerat the steel and concrete interface acting as a resistance-capacitor, resistivitymeasurements taken directly above rebarwill result in errors. Hence, a rebar factor was suggested tobe applied to the obtained resistivity results. In addition,modified Wenner equations are recommended for variousgeometric parameters [26]. Only reinforced cylindrical and
Probelocation
Reinforcement
Figure 5: Probe configuration with respect to rebar mesh suggestedto reduce electrical resistivity measurement error [9].
prismatic specimens were included in the experimentalsetup without considering a reinforced slab. However, in anumerical study, a slab with embedded rebar was consid-ered [26]. The experimental investigation lacked in usingconcrete mixture instead of a mortar mixture which is notexactly representative of real-world cases and may lead tomore errors. Furthermore, the proposed rebar factor maynot be applicable to a large concrete slab with multiplerebar because their experimental conclusions are based onlaboratory testing. Lim et al. [27] also studied the effectsof cover depth, electrode spacing, rebar diameter, and theresistivity of concrete and reinforcement in the numericalmodel. However, only one probe configuration taken rightabove and parallel to rebar was considered. It was suggestedto apply a geometric effect rate that ranges from 0 to 1 inorder to estimate the reinforcement geometry impact andthis rate is derived utilizing a resistivity estimation model.The geometric effect rate was also validated through theexperimental investigation for on-site measurements. Basedon experimental findings, it was stated that the geometriceffect rate decreased with increasing concrete cover thicknessand increased with increasing rebar diameter and increasingelectrode spacing. Again, using mortar mixture, only onesingle rebar, and a single probe configuration with respectto rebar is not completely representative of real-world con-ditions. An error to resistivity measurements may also beintroduced while the epoxy coating on the mortar specimenswas used in this study due to a barrier between the electrodesand mortar surface.
The last and recent study in this category belongs toSanchez et al. [74] who numerically proposed a modified4-point Wenner method based on the experimental data,deployed on a bridge over the River Danube in Romania.
14 Advances in Materials Science and Engineering
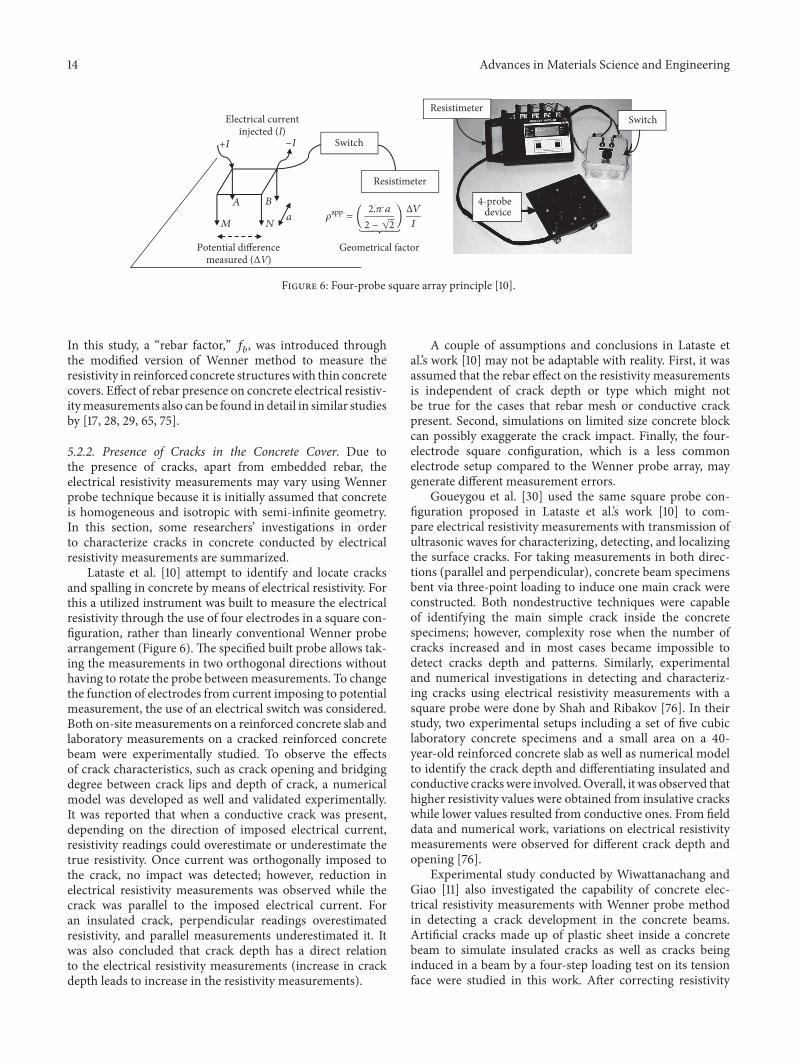
Electrical currentinjected (I)
Switch
Resistimeter
A B
M N
Potential differencemeasured (ΔV)
4-probedevicea
SwitchResistimeter
+I −I
Geometrical factor
𝜌app = ( 2.𝜋.a
2 − √2) ΔV
I
Figure 6: Four-probe square array principle [10].
In this study, a “rebar factor,” 𝑓𝑏, was introduced throughthe modified version of Wenner method to measure theresistivity in reinforced concrete structureswith thin concretecovers. Effect of rebar presence on concrete electrical resistiv-itymeasurements also can be found in detail in similar studiesby [17, 28, 29, 65, 75].
5.2.2. Presence of Cracks in the Concrete Cover. Due tothe presence of cracks, apart from embedded rebar, theelectrical resistivity measurements may vary using Wennerprobe technique because it is initially assumed that concreteis homogeneous and isotropic with semi-infinite geometry.In this section, some researchers’ investigations in orderto characterize cracks in concrete conducted by electricalresistivity measurements are summarized.
Lataste et al. [10] attempt to identify and locate cracksand spalling in concrete by means of electrical resistivity. Forthis a utilized instrument was built to measure the electricalresistivity through the use of four electrodes in a square con-figuration, rather than linearly conventional Wenner probearrangement (Figure 6). The specified built probe allows tak-ing the measurements in two orthogonal directions withouthaving to rotate the probe betweenmeasurements. To changethe function of electrodes from current imposing to potentialmeasurement, the use of an electrical switch was considered.Both on-site measurements on a reinforced concrete slab andlaboratory measurements on a cracked reinforced concretebeam were experimentally studied. To observe the effectsof crack characteristics, such as crack opening and bridgingdegree between crack lips and depth of crack, a numericalmodel was developed as well and validated experimentally.It was reported that when a conductive crack was present,depending on the direction of imposed electrical current,resistivity readings could overestimate or underestimate thetrue resistivity. Once current was orthogonally imposed tothe crack, no impact was detected; however, reduction inelectrical resistivity measurements was observed while thecrack was parallel to the imposed electrical current. Foran insulated crack, perpendicular readings overestimatedresistivity, and parallel measurements underestimated it. Itwas also concluded that crack depth has a direct relationto the electrical resistivity measurements (increase in crackdepth leads to increase in the resistivity measurements).
A couple of assumptions and conclusions in Lataste etal.’s work [10] may not be adaptable with reality. First, it wasassumed that the rebar effect on the resistivity measurementsis independent of crack depth or type which might notbe true for the cases that rebar mesh or conductive crackpresent. Second, simulations on limited size concrete blockcan possibly exaggerate the crack impact. Finally, the four-electrode square configuration, which is a less commonelectrode setup compared to the Wenner probe array, maygenerate different measurement errors.
Goueygou et al. [30] used the same square probe con-figuration proposed in Lataste et al.’s work [10] to com-pare electrical resistivity measurements with transmission ofultrasonic waves for characterizing, detecting, and localizingthe surface cracks. For taking measurements in both direc-tions (parallel and perpendicular), concrete beam specimensbent via three-point loading to induce one main crack wereconstructed. Both nondestructive techniques were capableof identifying the main simple crack inside the concretespecimens; however, complexity rose when the number ofcracks increased and in most cases became impossible todetect cracks depth and patterns. Similarly, experimentaland numerical investigations in detecting and characteriz-ing cracks using electrical resistivity measurements with asquare probe were done by Shah and Ribakov [76]. In theirstudy, two experimental setups including a set of five cubiclaboratory concrete specimens and a small area on a 40-year-old reinforced concrete slab as well as numerical modelto identify the crack depth and differentiating insulated andconductive crackswere involved.Overall, it was observed thathigher resistivity values were obtained from insulative crackswhile lower values resulted from conductive ones. From fielddata and numerical work, variations on electrical resistivitymeasurements were observed for different crack depth andopening [76].
Experimental study conducted by Wiwattanachang andGiao [11] also investigated the capability of concrete elec-trical resistivity measurements with Wenner probe methodin detecting a crack development in the concrete beams.Artificial cracks made up of plastic sheet inside a concretebeam to simulate insulated cracks as well as cracks beinginduced in a beam by a four-step loading test on its tensionface were studied in this work. After correcting resistivity
Advances in Materials Science and Engineering 15
0.000 0.1 0.2 0.3 0.4 0.5 0.6 0.7 0.8 0.9 1.0 1.1
60.0 80.0 140 210 340 600 1200 4500Resistivity in ohm.m
−0.05−0.10
−0.15
0.00
Dep
th (m
)
(a)
0.000 0.1 0.2 0.3 0.4 0.5 0.6 0.7 0.8 0.9 1.0 1.1
−0.05−0.10−0.15
0.00
60.0 80.0 140 210 340 600 1200 4500Resistivity in ohm.m
Dep
th (m
)
(b)
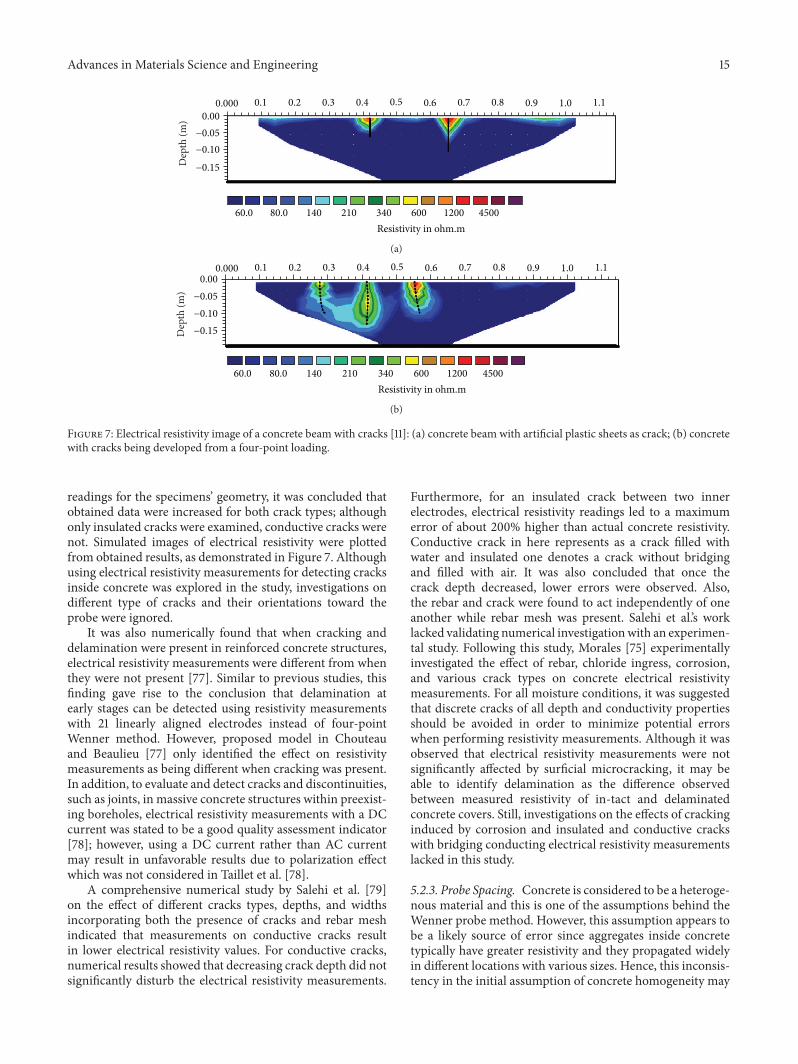
Figure 7: Electrical resistivity image of a concrete beam with cracks [11]: (a) concrete beam with artificial plastic sheets as crack; (b) concretewith cracks being developed from a four-point loading.
readings for the specimens’ geometry, it was concluded thatobtained data were increased for both crack types; althoughonly insulated cracks were examined, conductive cracks werenot. Simulated images of electrical resistivity were plottedfrom obtained results, as demonstrated in Figure 7. Althoughusing electrical resistivity measurements for detecting cracksinside concrete was explored in the study, investigations ondifferent type of cracks and their orientations toward theprobe were ignored.
It was also numerically found that when cracking anddelamination were present in reinforced concrete structures,electrical resistivity measurements were different from whenthey were not present [77]. Similar to previous studies, thisfinding gave rise to the conclusion that delamination atearly stages can be detected using resistivity measurementswith 21 linearly aligned electrodes instead of four-pointWenner method. However, proposed model in Chouteauand Beaulieu [77] only identified the effect on resistivitymeasurements as being different when cracking was present.In addition, to evaluate and detect cracks and discontinuities,such as joints, in massive concrete structures within preexist-ing boreholes, electrical resistivity measurements with a DCcurrent was stated to be a good quality assessment indicator[78]; however, using a DC current rather than AC currentmay result in unfavorable results due to polarization effectwhich was not considered in Taillet et al. [78].
A comprehensive numerical study by Salehi et al. [79]on the effect of different cracks types, depths, and widthsincorporating both the presence of cracks and rebar meshindicated that measurements on conductive cracks resultin lower electrical resistivity values. For conductive cracks,numerical results showed that decreasing crack depth did notsignificantly disturb the electrical resistivity measurements.
Furthermore, for an insulated crack between two innerelectrodes, electrical resistivity readings led to a maximumerror of about 200% higher than actual concrete resistivity.Conductive crack in here represents as a crack filled withwater and insulated one denotes a crack without bridgingand filled with air. It was also concluded that once thecrack depth decreased, lower errors were observed. Also,the rebar and crack were found to act independently of oneanother while rebar mesh was present. Salehi et al.’s worklacked validating numerical investigationwith an experimen-tal study. Following this study, Morales [75] experimentallyinvestigated the effect of rebar, chloride ingress, corrosion,and various crack types on concrete electrical resistivitymeasurements. For all moisture conditions, it was suggestedthat discrete cracks of all depth and conductivity propertiesshould be avoided in order to minimize potential errorswhen performing resistivity measurements. Although it wasobserved that electrical resistivity measurements were notsignificantly affected by surficial microcracking, it may beable to identify delamination as the difference observedbetween measured resistivity of in-tact and delaminatedconcrete covers. Still, investigations on the effects of crackinginduced by corrosion and insulated and conductive crackswith bridging conducting electrical resistivity measurementslacked in this study.
5.2.3. Probe Spacing. Concrete is considered to be a heteroge-nous material and this is one of the assumptions behind theWenner probe method. However, this assumption appears tobe a likely source of error since aggregates inside concretetypically have greater resistivity and they propagated widelyin different locations with various sizes. Hence, this inconsis-tency in the initial assumption of concrete homogeneity may
16 Advances in Materials Science and Engineering
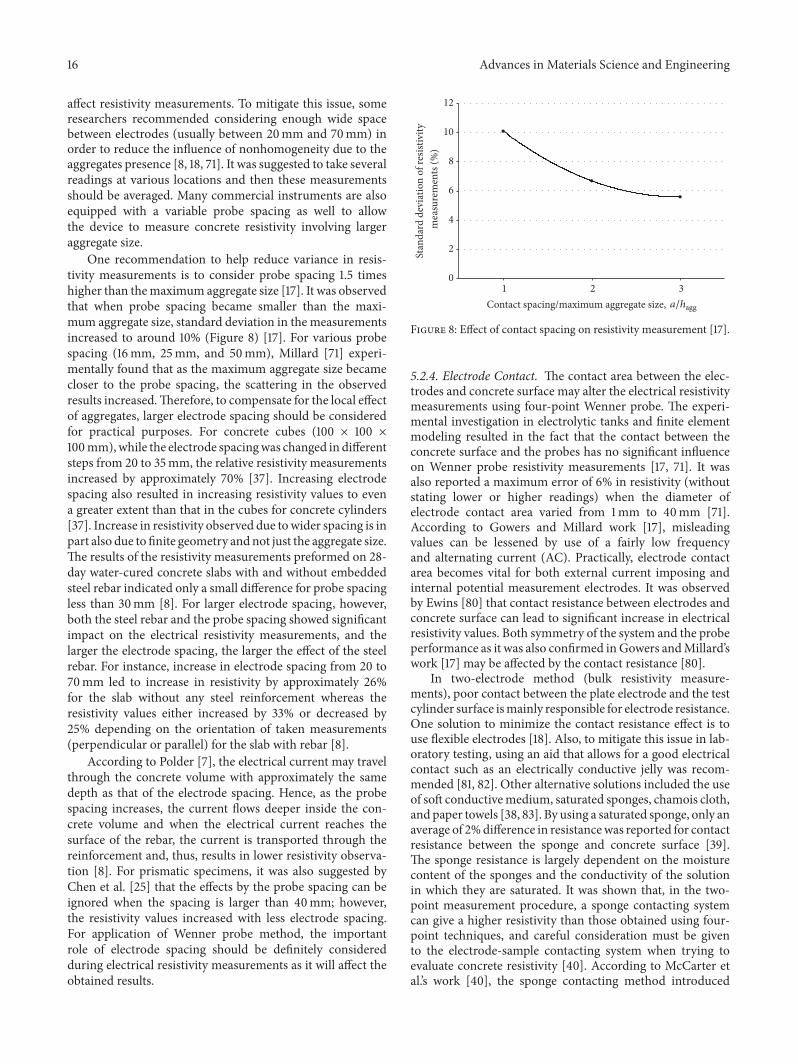
affect resistivity measurements. To mitigate this issue, someresearchers recommended considering enough wide spacebetween electrodes (usually between 20mm and 70mm) inorder to reduce the influence of nonhomogeneity due to theaggregates presence [8, 18, 71]. It was suggested to take severalreadings at various locations and then these measurementsshould be averaged. Many commercial instruments are alsoequipped with a variable probe spacing as well to allowthe device to measure concrete resistivity involving largeraggregate size.
One recommendation to help reduce variance in resis-tivity measurements is to consider probe spacing 1.5 timeshigher than themaximum aggregate size [17]. It was observedthat when probe spacing became smaller than the maxi-mum aggregate size, standard deviation in the measurementsincreased to around 10% (Figure 8) [17]. For various probespacing (16mm, 25mm, and 50mm), Millard [71] experi-mentally found that as the maximum aggregate size becamecloser to the probe spacing, the scattering in the observedresults increased.Therefore, to compensate for the local effectof aggregates, larger electrode spacing should be consideredfor practical purposes. For concrete cubes (100 × 100 ×100mm),while the electrode spacingwas changed in differentsteps from 20 to 35mm, the relative resistivity measurementsincreased by approximately 70% [37]. Increasing electrodespacing also resulted in increasing resistivity values to evena greater extent than that in the cubes for concrete cylinders[37]. Increase in resistivity observed due towider spacing is inpart also due to finite geometry andnot just the aggregate size.The results of the resistivity measurements preformed on 28-day water-cured concrete slabs with and without embeddedsteel rebar indicated only a small difference for probe spacingless than 30mm [8]. For larger electrode spacing, however,both the steel rebar and the probe spacing showed significantimpact on the electrical resistivity measurements, and thelarger the electrode spacing, the larger the effect of the steelrebar. For instance, increase in electrode spacing from 20 to70mm led to increase in resistivity by approximately 26%for the slab without any steel reinforcement whereas theresistivity values either increased by 33% or decreased by25% depending on the orientation of taken measurements(perpendicular or parallel) for the slab with rebar [8].
According to Polder [7], the electrical current may travelthrough the concrete volume with approximately the samedepth as that of the electrode spacing. Hence, as the probespacing increases, the current flows deeper inside the con-crete volume and when the electrical current reaches thesurface of the rebar, the current is transported through thereinforcement and, thus, results in lower resistivity observa-tion [8]. For prismatic specimens, it was also suggested byChen et al. [25] that the effects by the probe spacing can beignored when the spacing is larger than 40mm; however,the resistivity values increased with less electrode spacing.For application of Wenner probe method, the importantrole of electrode spacing should be definitely consideredduring electrical resistivity measurements as it will affect theobtained results.
Stan
dard
dev
iatio
n of
resis
tivity
mea
sure
men
ts (%
)
0
2
4
6
8
10
12
1 2 3Contact spacing/maximum aggregate size, a/ℎagg
Figure 8: Effect of contact spacing on resistivity measurement [17].
5.2.4. Electrode Contact. The contact area between the elec-trodes and concrete surface may alter the electrical resistivitymeasurements using four-point Wenner probe. The experi-mental investigation in electrolytic tanks and finite elementmodeling resulted in the fact that the contact between theconcrete surface and the probes has no significant influenceon Wenner probe resistivity measurements [17, 71]. It wasalso reported a maximum error of 6% in resistivity (withoutstating lower or higher readings) when the diameter ofelectrode contact area varied from 1mm to 40mm [71].According to Gowers and Millard work [17], misleadingvalues can be lessened by use of a fairly low frequencyand alternating current (AC). Practically, electrode contactarea becomes vital for both external current imposing andinternal potential measurement electrodes. It was observedby Ewins [80] that contact resistance between electrodes andconcrete surface can lead to significant increase in electricalresistivity values. Both symmetry of the system and the probeperformance as it was also confirmed inGowers andMillard’swork [17] may be affected by the contact resistance [80].
In two-electrode method (bulk resistivity measure-ments), poor contact between the plate electrode and the testcylinder surface ismainly responsible for electrode resistance.One solution to minimize the contact resistance effect is touse flexible electrodes [18]. Also, to mitigate this issue in lab-oratory testing, using an aid that allows for a good electricalcontact such as an electrically conductive jelly was recom-mended [81, 82]. Other alternative solutions included the useof soft conductivemedium, saturated sponges, chamois cloth,and paper towels [38, 83]. By using a saturated sponge, only anaverage of 2%difference in resistancewas reported for contactresistance between the sponge and concrete surface [39].The sponge resistance is largely dependent on the moisturecontent of the sponges and the conductivity of the solutionin which they are saturated. It was shown that, in the two-point measurement procedure, a sponge contacting systemcan give a higher resistivity than those obtained using four-point techniques, and careful consideration must be givento the electrode-sample contacting system when trying toevaluate concrete resistivity [40]. According to McCarter etal.’s work [40], the sponge contacting method introduced
Advances in Materials Science and Engineering 17
a misleading resistance originating from the sponge-sampleinterface that was in series with the bulk resistance of thesample. Therefore, an operator using an electrical resistivitydevice needs to ensure proper contact between the electrodesand concrete surface as poor contact may affect the electricalresistivity readings. The influence of electrode contact is lessgoverning in the Wenner probe method than in the uniaxialmethod and, hence, measurements can be performed in awider frequency range (10Hz to 10 kHz) [6].
5.2.5. SpecimenGeometry. In the four-pointWennermethod,the electrical resistivity measurements are initially presumedto be performed on the domain of semi-infinite mediumwhich is not a practically accurate assumption. This assump-tion leads to deviation from the ideal condition of havinginfinitely large geometrywhich can possibly occur in differentelectrode orientations. For relatively small size concreteelements (e.g., cylinder or prism specimens), constriction ofcurrent to flow into a different field pattern is one of themajorreasons for this deviation. Even though several researchershave realized the effect of specimens’ geometry, only verylimited information is available on this topic.
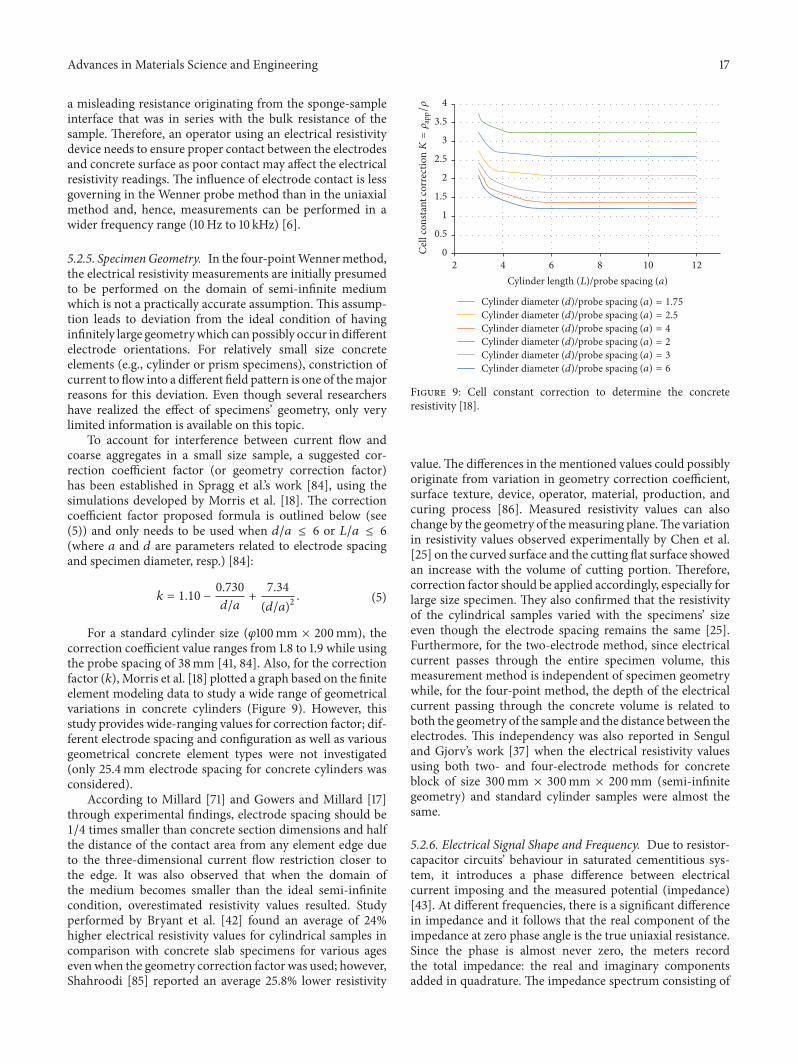
To account for interference between current flow andcoarse aggregates in a small size sample, a suggested cor-rection coefficient factor (or geometry correction factor)has been established in Spragg et al.’s work [84], using thesimulations developed by Morris et al. [18]. The correctioncoefficient factor proposed formula is outlined below (see(5)) and only needs to be used when 𝑑/𝑎 ≤ 6 or 𝐿/𝑎 ≤ 6(where 𝑎 and 𝑑 are parameters related to electrode spacingand specimen diameter, resp.) [84]:
𝑘 = 1.10 − 0.730𝑑/𝑎 + 7.34
(𝑑/𝑎)2 . (5)
For a standard cylinder size (𝜑100mm × 200mm), thecorrection coefficient value ranges from 1.8 to 1.9 while usingthe probe spacing of 38mm [41, 84]. Also, for the correctionfactor (𝑘), Morris et al. [18] plotted a graph based on the finiteelement modeling data to study a wide range of geometricalvariations in concrete cylinders (Figure 9). However, thisstudy provides wide-ranging values for correction factor; dif-ferent electrode spacing and configuration as well as variousgeometrical concrete element types were not investigated(only 25.4mm electrode spacing for concrete cylinders wasconsidered).
According to Millard [71] and Gowers and Millard [17]through experimental findings, electrode spacing should be1/4 times smaller than concrete section dimensions and halfthe distance of the contact area from any element edge dueto the three-dimensional current flow restriction closer tothe edge. It was also observed that when the domain ofthe medium becomes smaller than the ideal semi-infinitecondition, overestimated resistivity values resulted. Studyperformed by Bryant et al. [42] found an average of 24%higher electrical resistivity values for cylindrical samples incomparison with concrete slab specimens for various agesevenwhen the geometry correction factor was used; however,Shahroodi [85] reported an average 25.8% lower resistivity
0
0.5
1
1.5
2
2.5
3
3.5
4
2 4 6 8 10 12Cylinder length (L)/probe spacing (a)
Cylinder diameter (d)/probe spacing
Cylinder diameter (d)/probe spacing
Cylinder diameter (d)/probe spacing
Cylinder diameter (d)/probe spacing
Cylinder diameter (d)/probe spacing
Cylinder diameter (d)/probe spacing
Cel
l con
stant
corr
ectio
nK
=𝜌 a
pp/𝜌
(a) = 1.75
(a) = 2.5
(a) = 4
(a) = 2
(a) = 3
(a) = 6
Figure 9: Cell constant correction to determine the concreteresistivity [18].
value.The differences in the mentioned values could possiblyoriginate from variation in geometry correction coefficient,surface texture, device, operator, material, production, andcuring process [86]. Measured resistivity values can alsochange by the geometry of themeasuring plane.The variationin resistivity values observed experimentally by Chen et al.[25] on the curved surface and the cutting flat surface showedan increase with the volume of cutting portion. Therefore,correction factor should be applied accordingly, especially forlarge size specimen. They also confirmed that the resistivityof the cylindrical samples varied with the specimens’ sizeeven though the electrode spacing remains the same [25].Furthermore, for the two-electrode method, since electricalcurrent passes through the entire specimen volume, thismeasurement method is independent of specimen geometrywhile, for the four-point method, the depth of the electricalcurrent passing through the concrete volume is related toboth the geometry of the sample and the distance between theelectrodes. This independency was also reported in Senguland Gjorv’s work [37] when the electrical resistivity valuesusing both two- and four-electrode methods for concreteblock of size 300mm × 300mm × 200mm (semi-infinitegeometry) and standard cylinder samples were almost thesame.
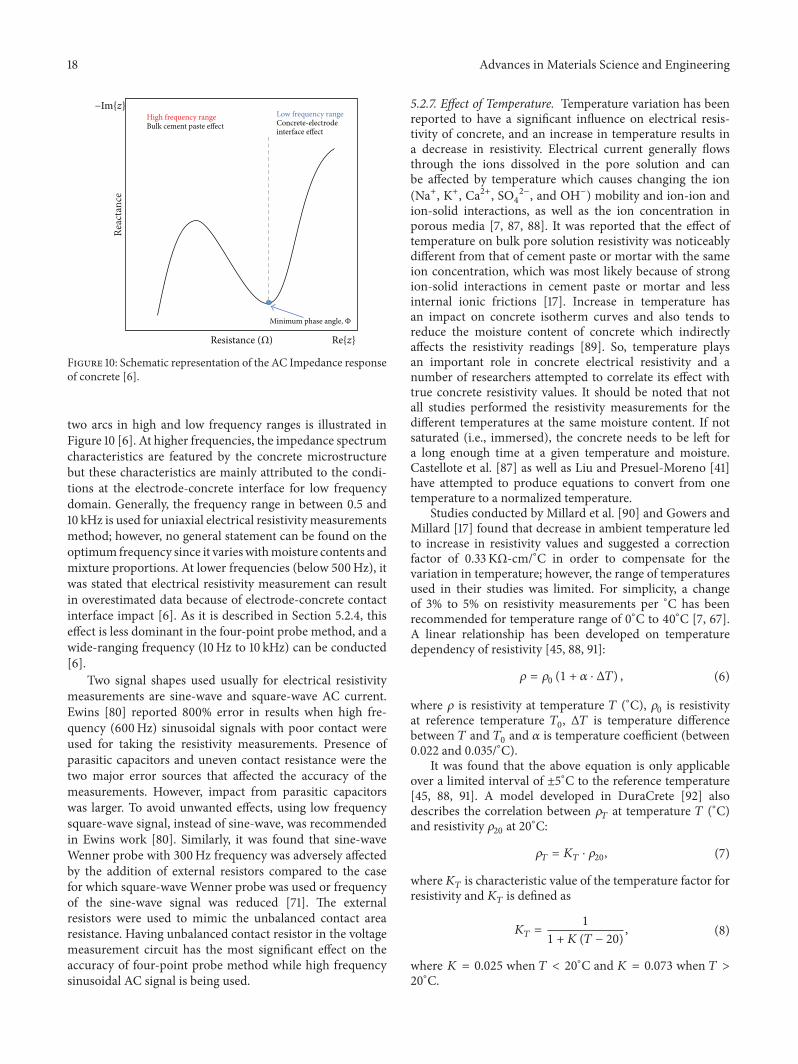
5.2.6. Electrical Signal Shape and Frequency. Due to resistor-capacitor circuits’ behaviour in saturated cementitious sys-tem, it introduces a phase difference between electricalcurrent imposing and the measured potential (impedance)[43]. At different frequencies, there is a significant differencein impedance and it follows that the real component of theimpedance at zero phase angle is the true uniaxial resistance.Since the phase is almost never zero, the meters recordthe total impedance: the real and imaginary componentsadded in quadrature. The impedance spectrum consisting of
18 Advances in Materials Science and Engineering
Minimum phase angle, Φ
Low frequency rangeConcrete-electrode interface effect
High frequency rangeBulk cement paste effect
Resistance (Ω) Re{z}
−Im{z}Re
acta
nce
Figure 10: Schematic representation of the AC Impedance responseof concrete [6].
two arcs in high and low frequency ranges is illustrated inFigure 10 [6]. At higher frequencies, the impedance spectrumcharacteristics are featured by the concrete microstructurebut these characteristics are mainly attributed to the condi-tions at the electrode-concrete interface for low frequencydomain. Generally, the frequency range in between 0.5 and10 kHz is used for uniaxial electrical resistivity measurementsmethod; however, no general statement can be found on theoptimum frequency since it varieswithmoisture contents andmixture proportions. At lower frequencies (below 500Hz), itwas stated that electrical resistivity measurement can resultin overestimated data because of electrode-concrete contactinterface impact [6]. As it is described in Section 5.2.4, thiseffect is less dominant in the four-point probe method, and awide-ranging frequency (10Hz to 10 kHz) can be conducted[6].
Two signal shapes used usually for electrical resistivitymeasurements are sine-wave and square-wave AC current.Ewins [80] reported 800% error in results when high fre-quency (600Hz) sinusoidal signals with poor contact wereused for taking the resistivity measurements. Presence ofparasitic capacitors and uneven contact resistance were thetwo major error sources that affected the accuracy of themeasurements. However, impact from parasitic capacitorswas larger. To avoid unwanted effects, using low frequencysquare-wave signal, instead of sine-wave, was recommendedin Ewins work [80]. Similarly, it was found that sine-waveWenner probe with 300Hz frequency was adversely affectedby the addition of external resistors compared to the casefor which square-wave Wenner probe was used or frequencyof the sine-wave signal was reduced [71]. The externalresistors were used to mimic the unbalanced contact arearesistance. Having unbalanced contact resistor in the voltagemeasurement circuit has the most significant effect on theaccuracy of four-point probe method while high frequencysinusoidal AC signal is being used.
5.2.7. Effect of Temperature. Temperature variation has beenreported to have a significant influence on electrical resis-tivity of concrete, and an increase in temperature results ina decrease in resistivity. Electrical current generally flowsthrough the ions dissolved in the pore solution and canbe affected by temperature which causes changing the ion(Na+, K+, Ca2+, SO4
2−, and OH−) mobility and ion-ion andion-solid interactions, as well as the ion concentration inporous media [7, 87, 88]. It was reported that the effect oftemperature on bulk pore solution resistivity was noticeablydifferent from that of cement paste or mortar with the sameion concentration, which was most likely because of strongion-solid interactions in cement paste or mortar and lessinternal ionic frictions [17]. Increase in temperature hasan impact on concrete isotherm curves and also tends toreduce the moisture content of concrete which indirectlyaffects the resistivity readings [89]. So, temperature playsan important role in concrete electrical resistivity and anumber of researchers attempted to correlate its effect withtrue concrete resistivity values. It should be noted that notall studies performed the resistivity measurements for thedifferent temperatures at the same moisture content. If notsaturated (i.e., immersed), the concrete needs to be left fora long enough time at a given temperature and moisture.Castellote et al. [87] as well as Liu and Presuel-Moreno [41]have attempted to produce equations to convert from onetemperature to a normalized temperature.
Studies conducted by Millard et al. [90] and Gowers andMillard [17] found that decrease in ambient temperature ledto increase in resistivity values and suggested a correctionfactor of 0.33 KΩ-cm/∘C in order to compensate for thevariation in temperature; however, the range of temperaturesused in their studies was limited. For simplicity, a changeof 3% to 5% on resistivity measurements per ∘C has beenrecommended for temperature range of 0∘C to 40∘C [7, 67].A linear relationship has been developed on temperaturedependency of resistivity [45, 88, 91]:
𝜌 = 𝜌0 (1 + 𝛼 ⋅ Δ𝑇) , (6)
where 𝜌 is resistivity at temperature 𝑇 (∘C), 𝜌0 is resistivityat reference temperature 𝑇0, Δ𝑇 is temperature differencebetween 𝑇 and 𝑇0 and 𝛼 is temperature coefficient (between0.022 and 0.035/∘C).
It was found that the above equation is only applicableover a limited interval of ±5∘C to the reference temperature[45, 88, 91]. A model developed in DuraCrete [92] alsodescribes the correlation between 𝜌𝑇 at temperature 𝑇 (∘C)and resistivity 𝜌20 at 20∘C:
𝜌𝑇 = 𝐾𝑇 ⋅ 𝜌20, (7)
where𝐾𝑇 is characteristic value of the temperature factor forresistivity and 𝐾𝑇 is defined as
𝐾𝑇 = 11 + 𝐾 (𝑇 − 20) , (8)
where 𝐾 = 0.025 when 𝑇 < 20∘C and 𝐾 = 0.073 when 𝑇 >20∘C.

Advances in Materials Science and Engineering 19
Several researchers also defined a wide agreement for thiscorrelation using Arrhenius law [41, 45, 87, 88, 91, 93]:
𝜌𝑇 = 𝜌0 ⋅ exp [𝐸𝑎,𝜌𝑅 ( 1𝑇 − 1𝑇0)] , (9)
where 𝜌 is resistivity at temperature 𝑇 (K), 𝜌0 is resis-tivity at reference temperature 𝑇0 (K), 𝑅 is gas constant(8.314 kJ−1mol−1), and 𝐸𝑎,𝜌 is activation energy for resistivity(J/mol) (ranges from 16.9 J/mol to 42.77 J/mol).
The activation energy of conduction (𝐸𝑎,𝜌) can be deter-mined using the slope of a plot of the natural logarithm ofresistivity and the inverse of temperature [43]. The slope ofthe best-fit line is multiplied by the negative of the universalgas constant [8.314 kJ−1mol−1] to determine the activationenergy of conduction. The above-mentioned correlation ispublished using only standard cylinder samples (𝜑100 ×200mm) and additional work is still needed for real-worldresistivity measurements and also to consider the influencegenerated by moisture content as an additional factor. Forstandard curing conditions in water at 20∘C, it was suggestedthat the effect of temperature can be eliminated [4]. Spragget al. [43] stated that the resistivity measured using thesame mature sample can differ by as much as 80% whenthe temperature of the sample fluctuates between 10∘C and45∘C. Additionally, several other studies showed in detaila prominent effect on resistivity results due to temperaturevariation [46, 47, 51, 52]. In summary, when the temperatureincreases, electrons move faster causing higher electricalconductivity, thus lowering resistivity.
5.2.8. Effect of Moisture Content. Moisture content is one ofthe influencing factors that can inversely affect the concreteelectrical resistivitymeasurements. Essentially, electrical con-ductivity increases with an increase in moisture content dueto change in the ionmobility [41, 94]; however, there could bea difference in resistivity between immersed samples (eitherwater or lime water) and those in high humidity. Larsen etal. [94] found that when moisture degree decreases from88% to 77%, the resistivity increases by an average of twotimes and from 88% to 66% it increases by an averageof 6 times. In the air-dry state, it was also reported thatconcrete had approximately 50% higher resistivity than thatin saturated condition [4]. As the electrical current is carriedby ion flowing through the pore solution in concrete, highermoisture content leads to easier electrical flow and thusthe electrical resistivity reduced. However, at low resistivityvalues, moisture content has less effect on the accuracy of theresistivity measurements [46]. For quality control purposes,it is essential to ensure that the same moisture degree indifferent mixtures and also the resistivity measurements ofthe specimens with low moisture content are inappropriate[25]. Furthermore, it was experimentally found that poorsurface saturation using pressurized water and static pondingcan lead to misinterpretation of resistivity of over 30%compared to full laboratory saturation [86]. So, additionalresearch is still required to simulate the on-site saturationby different systems and to understand how much time isrequired for water to penetrate through concrete surface in
order to obtain constant moisture level through the bulkspecimen.
6. Correlation between Concrete Resistivityand Its Durability Characteristics
Through following sections, relationship between electricalresistivity and the two main concrete durability characteris-tics including chloride ingress and corrosion of embeddedreinforcements will be presented.
6.1. Correlation between Electrical Resistivity and ChlorideDiffusivity. Diffusivity is the controlling parameter whichdetermines the time it takes for chloride ions to diffuse intoconcrete and reach the critical chloride threshold for corro-sion initiation. Typically, this can bemeasured through RapidChlorideMigration (RCM) test, Rapid Chloride PermeabilityTest (RCPT), or Bulk Diffusion (BD) method [95]. However,such test methods are either time-consuming or expensivefor evaluating the concrete permeability properties. Hence,electrical resistivity was found experimentally and theoreti-cally to be an efficient method that can be applied indirectlyto determine concrete chloride permeability.
In theory, the relationship between diffusivity of ionspecies 𝑖 and its partial conductivity can be described byNernst-Einstein equation [96]:
𝐷𝑖 = 𝑅𝑇𝜎𝑖𝑍2𝑖 𝐹2𝐶𝑖 , (10)
where 𝐷𝑖 is the diffusivity of ion 𝑖 (m2/s); 𝜎𝑖 is the partialconductivity of ion 𝑖 (s/m);𝑅 is the gas constant (8,314 J/mol);𝑇 is absolute temperature (K); 𝑍𝑖 is the charge of ion 𝑖; 𝐹is Faraday’s constant (96500 Coulombs/mole); and 𝐶𝑖 is theconcentration of ion 𝑖 (mol/m2). By applying Archie’s law,the correlation between the bulk resistivity, pore solutionresistivity, and porosity can be expressed by the following[37, 97]:
𝐹 = 𝜌𝜌0 =
𝜎0𝜎 = 𝑎 ⋅ 𝜑−𝑚, (11)
where 𝐹 is formation factor; 𝑎 and 𝑚 are constants; and 𝜑 isporosity of concrete.𝑚 is dependent on tortuosity of concreteand has been found to be 1.5 to 3.2 [37, 97]. Combining theabove equations gives the formation factor as a function ofeffective chloride diffusion coefficient of concrete (𝐷eff) andchloride ion diffusion coefficient in the pore solution (𝐷0):
𝐹 = 𝐷0𝐷eff
. (12)
Several researchers have also conducted various experi-ments to investigate the relationship between concrete resis-tivity and chloride diffusivity. A strong correlation betweenthese two parameters has been reported for various concretemixtures at different ages [4, 42, 47, 50–52]. Due to presenceof chloride, experimental results showed that the electricalresistivity of mortar was reduced [17]. The concrete resis-tivity was inversely related to chloride ingress, where lower
20 Advances in Materials Science and Engineering
Table 5: Classification of concrete permeability to surface resistivity values.
RCP test versus surface resistivity
Chloride ionpermeability
RCP testcharged passed(Coulombs)
Surface Resistivity Test
4 × 8 cylinder(kΩ-cm)
𝑎 = 1.5 𝑘 = 1.8(measured)
6 × 12 cylinder(kΩ-cm)
𝑎 = 1.5 𝑘 = 1.8(measured)
Semi-infinite slab(real)
KDOT4 × 8 cylinder(kΩ-cm)
𝑎 = 1.5 𝑘 = 1.8(measured)
High >4000 <12 <9.5 <6.7 <7.0Moderate 2000–4000 12–21 9.5–16.5 6.7–11.7 7.0–13.0Low 1000–2000 21–37 16.5–29 11.7–20.6 13.0–24.3Very low 100–1000 37–254 29–199 20.6–141.1 24.3–191Negligible <100 >254 >199 >141.1 >191
resistivity indicated the area where chloride penetrationwill be faster [7]; however, its effect on electrical resistivityreadings is relatively small compared to carbonation process[7, 50]. Recent field experience indicated that the relationshipbetween surface resistivity at 28 days and 56 days withRCP data was moderate [53]. Experimental investigation byFlorida Department of Transportation (FDOT) on wet curedconcrete specimens in a controlled environment or curedsamples in lime water, using RCP test and 4-point Wennermethod in conjunction, confirmed the inverse correlation ofchloride resistivity [98, 99].The summary of FDOTproposedrelationship between resistivity and chloride can be foundin Table 5. The table also shows an indication of the risk ofchloride penetrability with regard to charge passed based onASTM C1202 standard [100]. In RCP test, a 60V potentialis applied across the sample of 95mm diameter and 50mmthickness for 6 hours. Current readings are taken every 30minutes, at minimum, and then the total charge passed inCoulombs is calculated by integrating the Current versusTime graph developed from the readings taken.
Similar experimental investigation conducted by theLouisiana Transportation Research Center (LTRC) alsofound a good correlation between resistivity and RCP testwhile the classified concrete permeability to surface resistivityvalues are equal to those proposed by FDOT as shown inTable 5 [31]. Following these experimental investigations,AASHTO published a provisional method TP 95-11 for indi-cating the concrete’s ability to resist chloride ion penetrationusing surface resistivity measurement method [3]. However,Kansas Department of Transportation (KDOT) reporteddifferent value range for surface resistivity [54]. For instance,it is considered that chloride penetration is highwhen surfaceresistivity value is less than 7.0 kΩ-cm for 4 × 8 cylinderwith 1.5-inch probe spacing which is a relatively small valuecompared to two other experimental results (Table 5) [54].
In addition to the experimental study on laboratory speci-mens, the correlation between electrical resistivity and appar-ent diffusivity coefficients (𝐷app) is reported by researchersfor field specimens [53, 55]. Due to complexity of the expo-sure environments such as humidity difference, temperature,and the elevation fromwater level, results are scattered. How-ever, a recent investigation on Florida bridges showed a better
correlation between resistivity and apparent diffusivity onceresistivity was measured under saturated condition [65]. Theauthors of this paper are currently involved in a study wherethe effect of full or partial saturation is being studied. To pre-dict chloride threshold (ClTH) values, the electrical resistivitymethodwas used periodically during 1000-daymonitoring ofreinforced concrete element exposure tomarine environment[28]. After applying the geometrical factor, the relationshipbetween chloride content, in terms of chlorides relative tothe weight of cement, and resistivity (𝜌) can be expressed asshown in the following [28]:
ClTH (%) = 0.019𝜌 + 0.401. (13)
A good correlation between RCM coefficients and elec-trical resistivity measured by two-electrode method wasreported in European Union-Brite EuRam III experimentalinvestigation [92]. Similarly, this correlation for resistivitymeasured byWenner method is reported in Dhir et al.’s work[101]. Although resistivity measurements can be possibly agood alternative or replacement for the RCM test, moreexperiments need to be conducted to validate this correlation.The electrical resistivity test was suggested to be used as aquality control predictor of the chloride ingress resistance,but not as a predictor of diffusion behaviour of all kindsof concretes or as replacement of the long-term diffusiontests [56]. FDOT long-term monitoring of various concretesconcluded that correlation between the RCM and the long-term tests was equal to or slightly better than those obtainedby the RCP and surface resistivity due to less sensitivityof RCM test to presence of supplementary cementitiousmaterials [102]. A linear trend exists between chloride dif-fusion coefficient (𝐷RCM) derived by RCM test and con-crete electrical conductivity using two-electrode resistivitymeasurements [33, 46, 57, 58]. Additionally, to account forthe retardation of chloride penetration due to the chloridereaction or binding with the cement phases, a factor needs tobe applied to electrical resistivity measurements [59]. A reac-tion factor (𝑟cl) is defined as the ratio between the diffusioncoefficients 𝐷app and 𝐷eff assuming lineal chloride binding
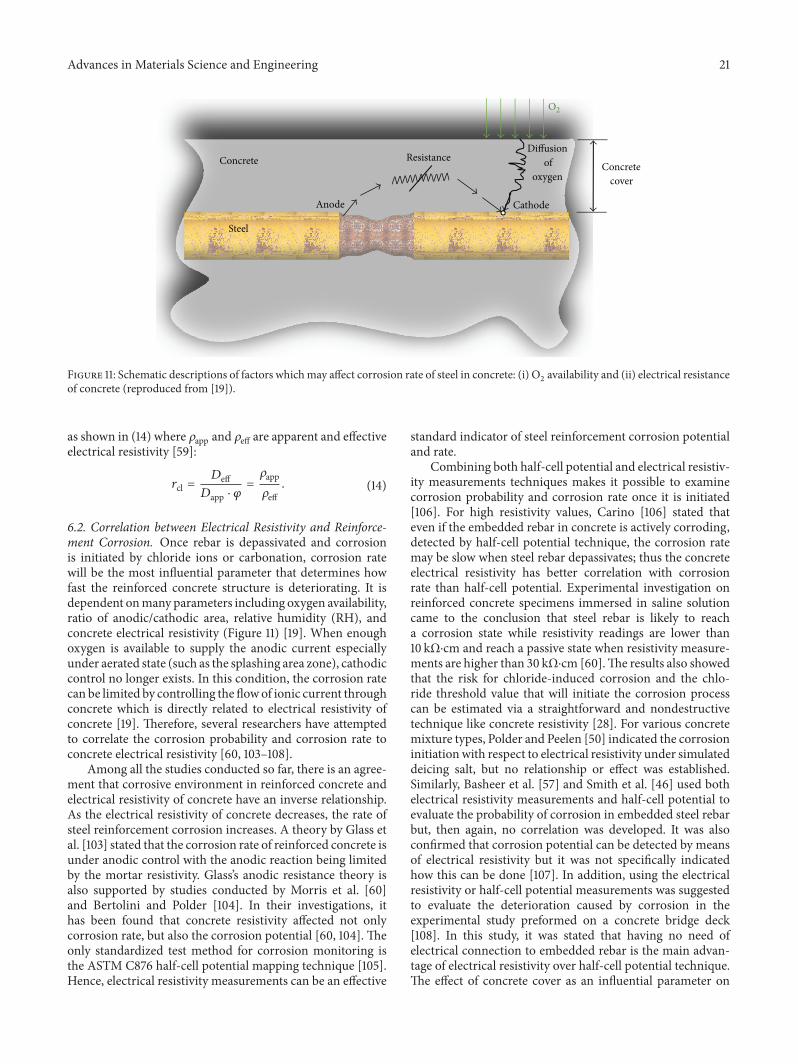
Advances in Materials Science and Engineering 21
Steel
Concrete Resistance
Anode Cathode
Diffusion of
oxygenConcrete
cover
O2
Figure 11: Schematic descriptions of factors whichmay affect corrosion rate of steel in concrete: (i) O2 availability and (ii) electrical resistanceof concrete (reproduced from [19]).
as shown in (14) where 𝜌app and 𝜌eff are apparent and effectiveelectrical resistivity [59]:
𝑟cl = 𝐷eff𝐷app ⋅ 𝜑 = 𝜌app
𝜌eff . (14)
6.2. Correlation between Electrical Resistivity and Reinforce-ment Corrosion. Once rebar is depassivated and corrosionis initiated by chloride ions or carbonation, corrosion ratewill be the most influential parameter that determines howfast the reinforced concrete structure is deteriorating. It isdependent onmany parameters including oxygen availability,ratio of anodic/cathodic area, relative humidity (RH), andconcrete electrical resistivity (Figure 11) [19]. When enoughoxygen is available to supply the anodic current especiallyunder aerated state (such as the splashing area zone), cathodiccontrol no longer exists. In this condition, the corrosion ratecan be limited by controlling the flowof ionic current throughconcrete which is directly related to electrical resistivity ofconcrete [19]. Therefore, several researchers have attemptedto correlate the corrosion probability and corrosion rate toconcrete electrical resistivity [60, 103–108].
Among all the studies conducted so far, there is an agree-ment that corrosive environment in reinforced concrete andelectrical resistivity of concrete have an inverse relationship.As the electrical resistivity of concrete decreases, the rate ofsteel reinforcement corrosion increases. A theory by Glass etal. [103] stated that the corrosion rate of reinforced concrete isunder anodic control with the anodic reaction being limitedby the mortar resistivity. Glass’s anodic resistance theory isalso supported by studies conducted by Morris et al. [60]and Bertolini and Polder [104]. In their investigations, ithas been found that concrete resistivity affected not onlycorrosion rate, but also the corrosion potential [60, 104]. Theonly standardized test method for corrosion monitoring isthe ASTM C876 half-cell potential mapping technique [105].Hence, electrical resistivity measurements can be an effective
standard indicator of steel reinforcement corrosion potentialand rate.
Combining both half-cell potential and electrical resistiv-ity measurements techniques makes it possible to examinecorrosion probability and corrosion rate once it is initiated[106]. For high resistivity values, Carino [106] stated thateven if the embedded rebar in concrete is actively corroding,detected by half-cell potential technique, the corrosion ratemay be slow when steel rebar depassivates; thus the concreteelectrical resistivity has better correlation with corrosionrate than half-cell potential. Experimental investigation onreinforced concrete specimens immersed in saline solutioncame to the conclusion that steel rebar is likely to reacha corrosion state while resistivity readings are lower than10 kΩ⋅cm and reach a passive state when resistivity measure-ments are higher than 30 kΩ⋅cm [60].The results also showedthat the risk for chloride-induced corrosion and the chlo-ride threshold value that will initiate the corrosion processcan be estimated via a straightforward and nondestructivetechnique like concrete resistivity [28]. For various concretemixture types, Polder and Peelen [50] indicated the corrosioninitiationwith respect to electrical resistivity under simulateddeicing salt, but no relationship or effect was established.Similarly, Basheer et al. [57] and Smith et al. [46] used bothelectrical resistivity measurements and half-cell potential toevaluate the probability of corrosion in embedded steel rebarbut, then again, no correlation was developed. It was alsoconfirmed that corrosion potential can be detected by meansof electrical resistivity but it was not specifically indicatedhow this can be done [107]. In addition, using the electricalresistivity or half-cell potential measurements was suggestedto evaluate the deterioration caused by corrosion in theexperimental study preformed on a concrete bridge deck[108]. In this study, it was stated that having no need ofelectrical connection to embedded rebar is the main advan-tage of electrical resistivity over half-cell potential technique.The effect of concrete cover as an influential parameter on
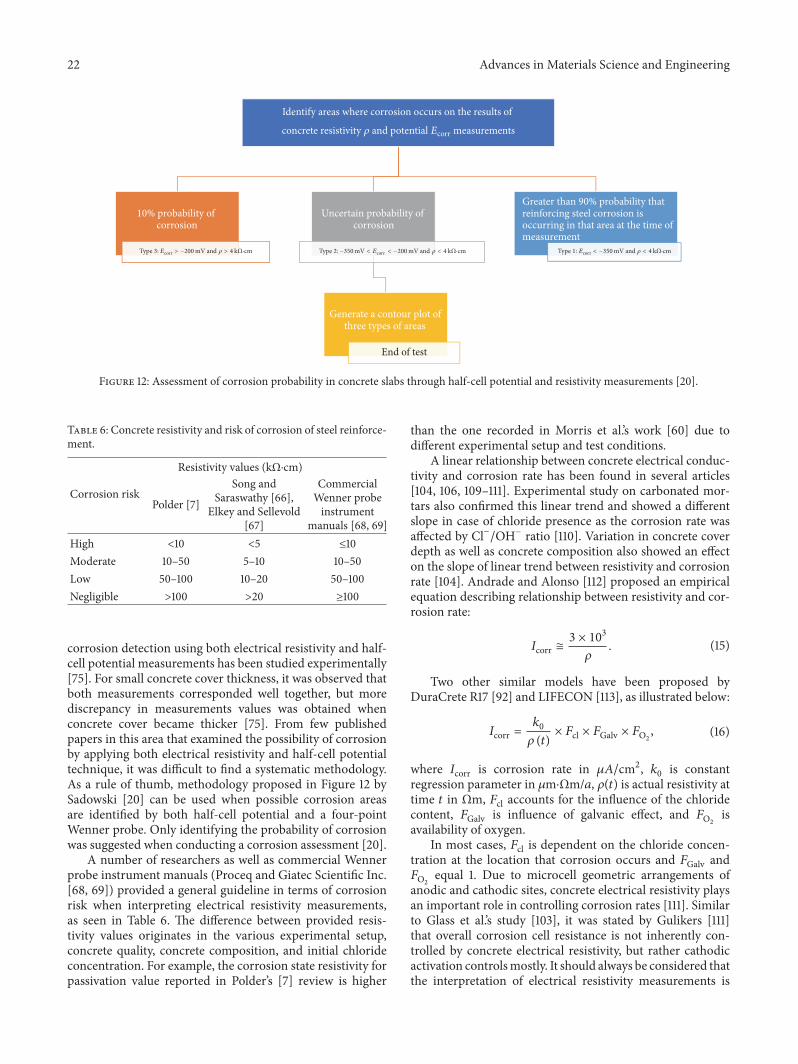
22 Advances in Materials Science and Engineering
10% probability of corrosion
Uncertain probability of corrosion
Generate a contour plot of three types of areas
End of test
Greater than 90% probability that reinforcing steel corrosion is occurring in that area at the time of measurement
Identify areas where corrosion occurs on the results of
measurementsconcrete resistivity 𝜌 and potential Ecorr
Type 3: Ecorr > −200 mV and 𝜌 > 4 kΩ Type 1: Ecorr < −350mV and 𝜌 < 4 kΩType 2: −350mV < Ecorr < −200mV and 𝜌 < 4 kΩ·cm ·cm ·cm
Figure 12: Assessment of corrosion probability in concrete slabs through half-cell potential and resistivity measurements [20].
Table 6: Concrete resistivity and risk of corrosion of steel reinforce-ment.
Corrosion risk
Resistivity values (kΩ⋅cm)
Polder [7]
Song andSaraswathy [66],
Elkey and Sellevold[67]
CommercialWenner probeinstrument
manuals [68, 69]High <10 <5 ≤10Moderate 10–50 5–10 10–50Low 50–100 10–20 50–100Negligible >100 >20 ≥100
corrosion detection using both electrical resistivity and half-cell potential measurements has been studied experimentally[75]. For small concrete cover thickness, it was observed thatboth measurements corresponded well together, but morediscrepancy in measurements values was obtained whenconcrete cover became thicker [75]. From few publishedpapers in this area that examined the possibility of corrosionby applying both electrical resistivity and half-cell potentialtechnique, it was difficult to find a systematic methodology.As a rule of thumb, methodology proposed in Figure 12 bySadowski [20] can be used when possible corrosion areasare identified by both half-cell potential and a four-pointWenner probe. Only identifying the probability of corrosionwas suggested when conducting a corrosion assessment [20].
A number of researchers as well as commercial Wennerprobe instrument manuals (Proceq and Giatec Scientific Inc.[68, 69]) provided a general guideline in terms of corrosionrisk when interpreting electrical resistivity measurements,as seen in Table 6. The difference between provided resis-tivity values originates in the various experimental setup,concrete quality, concrete composition, and initial chlorideconcentration. For example, the corrosion state resistivity forpassivation value reported in Polder’s [7] review is higher
than the one recorded in Morris et al.’s work [60] due todifferent experimental setup and test conditions.
A linear relationship between concrete electrical conduc-tivity and corrosion rate has been found in several articles[104, 106, 109–111]. Experimental study on carbonated mor-tars also confirmed this linear trend and showed a differentslope in case of chloride presence as the corrosion rate wasaffected by Cl−/OH− ratio [110]. Variation in concrete coverdepth as well as concrete composition also showed an effecton the slope of linear trend between resistivity and corrosionrate [104]. Andrade and Alonso [112] proposed an empiricalequation describing relationship between resistivity and cor-rosion rate:
𝐼corr ≅ 3 × 10³𝜌 . (15)
Two other similar models have been proposed byDuraCrete R17 [92] and LIFECON [113], as illustrated below:
𝐼corr = 𝑘0𝜌 (𝑡) × 𝐹cl × 𝐹Galv × 𝐹O2
, (16)
where 𝐼corr is corrosion rate in 𝜇𝐴/cm2, 𝑘0 is constantregression parameter in 𝜇m⋅Ωm/𝑎, 𝜌(𝑡) is actual resistivity attime 𝑡 in Ωm, 𝐹cl accounts for the influence of the chloridecontent, 𝐹Galv is influence of galvanic effect, and 𝐹O
2
isavailability of oxygen.
In most cases, 𝐹cl is dependent on the chloride concen-tration at the location that corrosion occurs and 𝐹Galv and𝐹O
2
equal 1. Due to microcell geometric arrangements ofanodic and cathodic sites, concrete electrical resistivity playsan important role in controlling corrosion rates [111]. Similarto Glass et al.’s study [103], it was stated by Gulikers [111]that overall corrosion cell resistance is not inherently con-trolled by concrete electrical resistivity, but rather cathodicactivation controlsmostly. It should always be considered thatthe interpretation of electrical resistivity measurements is
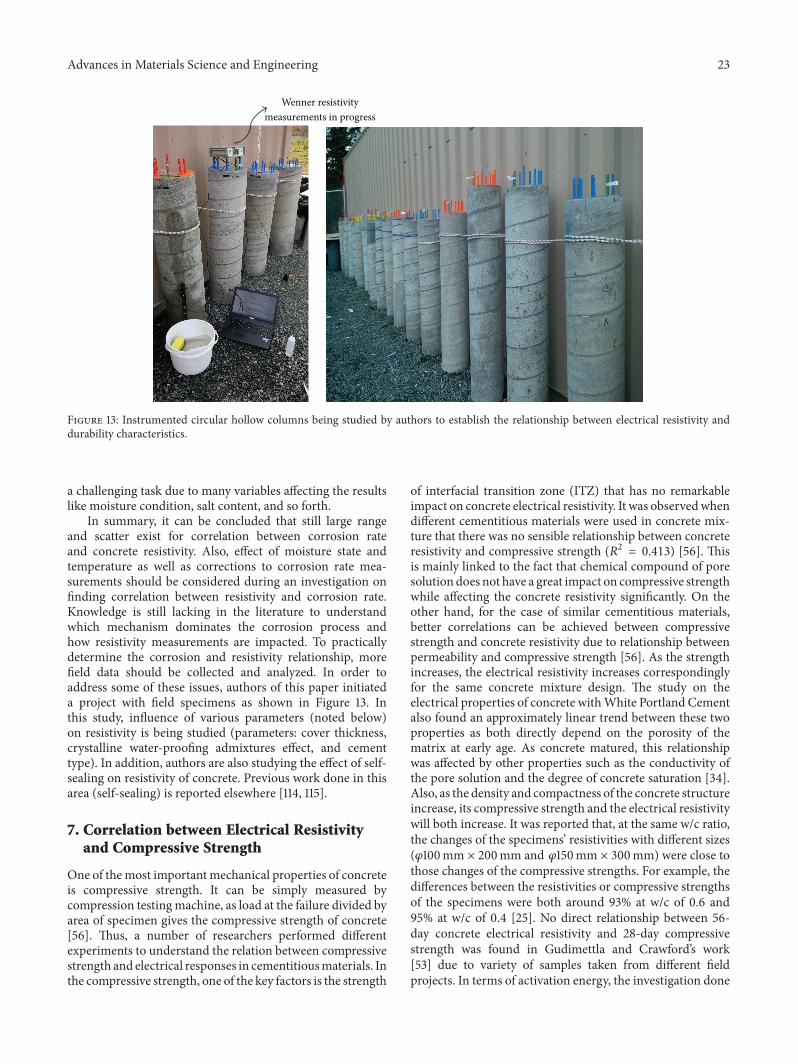
Advances in Materials Science and Engineering 23
Wenner resistivity measurements in progress
Figure 13: Instrumented circular hollow columns being studied by authors to establish the relationship between electrical resistivity anddurability characteristics.
a challenging task due to many variables affecting the resultslike moisture condition, salt content, and so forth.
In summary, it can be concluded that still large rangeand scatter exist for correlation between corrosion rateand concrete resistivity. Also, effect of moisture state andtemperature as well as corrections to corrosion rate mea-surements should be considered during an investigation onfinding correlation between resistivity and corrosion rate.Knowledge is still lacking in the literature to understandwhich mechanism dominates the corrosion process andhow resistivity measurements are impacted. To practicallydetermine the corrosion and resistivity relationship, morefield data should be collected and analyzed. In order toaddress some of these issues, authors of this paper initiateda project with field specimens as shown in Figure 13. Inthis study, influence of various parameters (noted below)on resistivity is being studied (parameters: cover thickness,crystalline water-proofing admixtures effect, and cementtype). In addition, authors are also studying the effect of self-sealing on resistivity of concrete. Previous work done in thisarea (self-sealing) is reported elsewhere [114, 115].
7. Correlation between Electrical Resistivityand Compressive Strength
One of themost importantmechanical properties of concreteis compressive strength. It can be simply measured bycompression testingmachine, as load at the failure divided byarea of specimen gives the compressive strength of concrete[56]. Thus, a number of researchers performed differentexperiments to understand the relation between compressivestrength and electrical responses in cementitiousmaterials. Inthe compressive strength, one of the key factors is the strength
of interfacial transition zone (ITZ) that has no remarkableimpact on concrete electrical resistivity. It was observedwhendifferent cementitious materials were used in concrete mix-ture that there was no sensible relationship between concreteresistivity and compressive strength (𝑅2 = 0.413) [56]. Thisis mainly linked to the fact that chemical compound of poresolution does not have a great impact on compressive strengthwhile affecting the concrete resistivity significantly. On theother hand, for the case of similar cementitious materials,better correlations can be achieved between compressivestrength and concrete resistivity due to relationship betweenpermeability and compressive strength [56]. As the strengthincreases, the electrical resistivity increases correspondinglyfor the same concrete mixture design. The study on theelectrical properties of concrete withWhite Portland Cementalso found an approximately linear trend between these twoproperties as both directly depend on the porosity of thematrix at early age. As concrete matured, this relationshipwas affected by other properties such as the conductivity ofthe pore solution and the degree of concrete saturation [34].Also, as the density and compactness of the concrete structureincrease, its compressive strength and the electrical resistivitywill both increase. It was reported that, at the same w/c ratio,the changes of the specimens’ resistivities with different sizes(𝜑100mm × 200mm and 𝜑150mm × 300mm) were close tothose changes of the compressive strengths. For example, thedifferences between the resistivities or compressive strengthsof the specimens were both around 93% at w/c of 0.6 and95% at w/c of 0.4 [25]. No direct relationship between 56-day concrete electrical resistivity and 28-day compressivestrength was found in Gudimettla and Crawford’s work[53] due to variety of samples taken from different fieldprojects. In terms of activation energy, the investigation done

24 Advances in Materials Science and Engineering
by Liu and Presuel-Moreno [44] showed that resistivity isnoticeably higher than the reported activation energy forcompressive strength. In conclusion, there is no practicalcorrelation between electrical resistivity and compressivestrength for various cementitious materials; however, for thesame mixture design, electrical resistivity is linearly relatedto compressive strength. Generally, as concrete permeabilitydecreases, both electrical resistivity and compressive strengthincrease.
8. Correlation between Surface and BulkElectrical Resistivity
As it is discussed in previous sections, every electrical resis-tivity (𝜌) measurement is composed of a resistance (𝑅) and ageometry correction factor (𝑘) that convert the resistance toresistivity which is a geometry independent intrinsicmaterialproperty [21]. The correction factor (𝑘) depends on thegeometry and size of the sample and the electrodes location.Hence, for the same concrete material, variation in electrodegeometries and sample size may result in different resistancevalues but eventually will yield the same resistivity using (17).Four common measurement electrode geometries that havebeen employed in several studies to conduct electrical test oncementitious cylinders are included: (1) uniaxial resistance(or bulk resistance), (2) surface resistance, (3) embeddedsensors, and (4) disc method (one external electrode). Inthis section, researchers’ review on correlation between thefirst two common (bulk and surface) resistivity measurementmethods is summarized.
𝜌 = 𝑅 ⋅ 𝑘. (17)
Theoretically, the ratio of surface and bulk resistance forstandard size cylinder specimen (100mm × 200mm) andprobe spacing of 𝑎 = 50mm can be computed in thefollowing equation [18]:
𝑅1𝑅2 = (𝜌1𝜌2)(
18) , (18)
where 𝑅1 is resistance measured by 4-point Wenner method(surface resistance), 𝑅2 is resistance measured by uniaxialmethod (bulk resistance), 𝜌1 is resistivity measured by 4-point Wenner method (surface resistivity), and 𝜌2 is resistiv-ity measured by uniaxial method (bulk resistivity).
The ratio of two different resistivity types (𝜌1 and 𝜌2) isequal to 2.63 [18]. Therefore, the theoretical ratio of surfaceand bulk resistance can be computed as
𝑅1𝑅2 =
2.638 = 0.33. (19)
Also, a number of researchers experimentally attemptedto study this correlation between bulk and surface resis-tivity data. Studies performed by Ghosh and Tran [61, 62]showed the correlation between bulk and surface resistivityfor different groups of binary and ternary mixtures. It wasobserved that for most groups of mixtures, the coefficient ofdetermination (𝑅2) values for linear trend line was higher
than 0.8 and sometimes close to 1 except some silica fumemixtures at early-ages where the coefficient became less than0.80.The linear trend line varied from 0.29 to 0.47 at differentconcrete ages of 7, 14, 28, 56, 91, and 161 days. For probespacing 𝑎 = 38.1mm, Spragg et al. [39] also reported a stronglinear correlationwith an𝑅2 = 0.9986, with surface resistivitymeasurements tending to be 1.86 times higher than bulkresistivity which supports previous work done byMorris et al.[18]. Several Department of Transportation (DOT) and otheragencies participated in a round robin program (summarizedby Indiana DOT). A recent study on specimens casted duringactual concrete production in the field through differentUS states proved that the surface and bulk measurementscorrelate extremely well with each other at 28- and 56-day age[53]. It was observed that the surface resistivity results weretypically 1.9 times higher than the bulk resistivity obtaineddata. Authors have found a similar correlation between bulkand surface resistivity (𝑅2 = 0.979).
Both surface and bulk resistivity measurement methodshave been used to determine the presence of a heterogeneityproblem [21]. To investigate the heterogeneous systems, thesurface and uniaxial resistivity tests were performed onthe cylindrical specimen with a 10-mm thick white cementpaste on outer layer and the prismatic specimens with twoseparate layers of white and grey cement pastes setup inparallel and series configurations, as illustrated in Figure 14[21]. For the uniaxial case, the total resistivity (𝜌𝑐) can becalculated through the proposed equations (20a) and (20b)for parallel and series configurations. A correction factor(D) has been developed for heterogeneity which depends onthe material of interest and an approach was proposed tocompare the resistivities measured from a surface test anda bulk test. In this approach, if there is heterogeneity, thevalues from the two tests will be different. This differencecan give an indication as to whether the surface layer ismore or less resistive [21]. Similarly, correlation betweensurface and bulk resistivity found in other studies indicateda strong relationship between the resistivity values when theappropriate geometry factor was applied [8, 37]:
1𝜌𝑐 =
𝑛
∑𝑖=1
𝐴 𝑖𝜌𝑖 (Parallel configuration) , (20a)
𝜌𝑐 =𝑛
∑𝑖=1
𝜌𝑖 ⋅ 𝐿 𝑖 (Series configuration) . (20b)
In summary, the coefficient of determination value (𝑅2)for linear trend between bulk and surface resistivity indifferent literatures for various ages is shown in Table 7.Based on the reported data, it can be concluded that a strongrelationship exists between resistivity measured by surfaceand bulk tests. However, in practical cases, caution is neededfor multilayered cementitious composite systems as electricalcurrent flows differently in these two techniques and for thetypes of layered electrical properties that can occur due tomoisture gradients, chemical changes, and ionic gradients[21]. More complicated situations for resistivitymeasurementthat arise during field measurements where seasonal andwet/drying might take place at the tidal section on partially
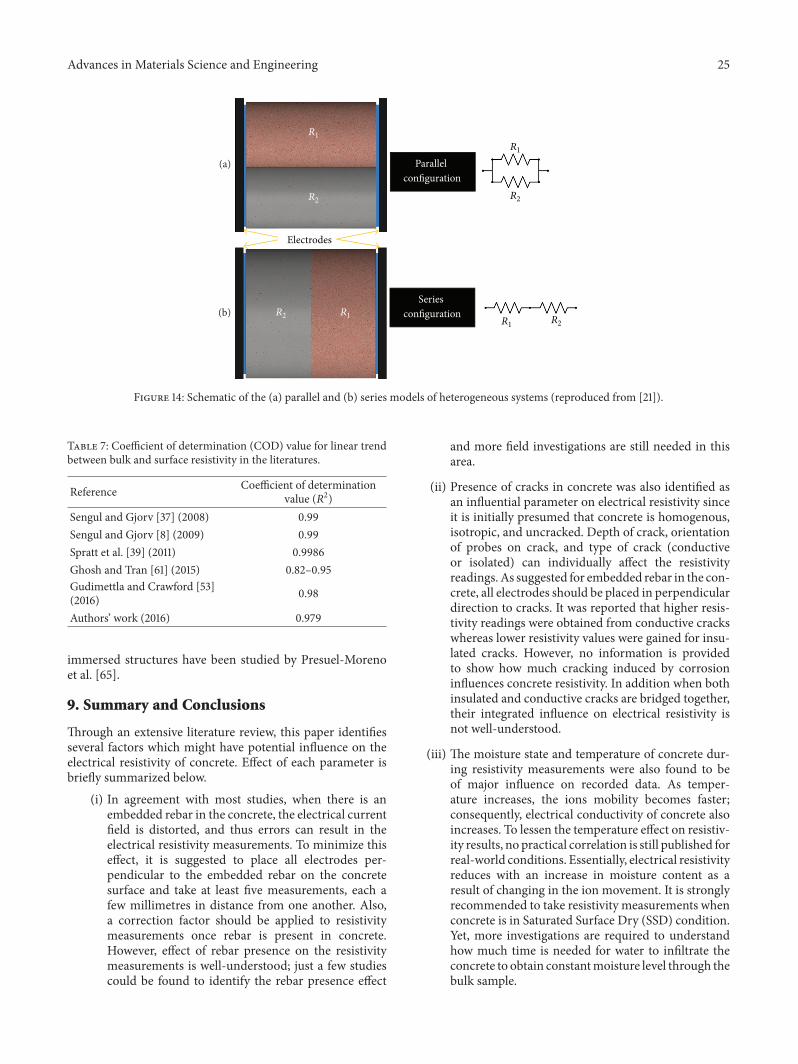
Advances in Materials Science and Engineering 25
Electrodes
Parallel configuration
Series configuration
R1
R1
R1
R1
R2
R2 R2
R2
(a)
(b)
Figure 14: Schematic of the (a) parallel and (b) series models of heterogeneous systems (reproduced from [21]).
Table 7: Coefficient of determination (COD) value for linear trendbetween bulk and surface resistivity in the literatures.
Reference Coefficient of determinationvalue (𝑅2)
Sengul and Gjorv [37] (2008) 0.99Sengul and Gjorv [8] (2009) 0.99Spratt et al. [39] (2011) 0.9986Ghosh and Tran [61] (2015) 0.82–0.95Gudimettla and Crawford [53](2016) 0.98
Authors’ work (2016) 0.979
immersed structures have been studied by Presuel-Morenoet al. [65].
9. Summary and Conclusions
Through an extensive literature review, this paper identifiesseveral factors which might have potential influence on theelectrical resistivity of concrete. Effect of each parameter isbriefly summarized below.
(i) In agreement with most studies, when there is anembedded rebar in the concrete, the electrical currentfield is distorted, and thus errors can result in theelectrical resistivity measurements. To minimize thiseffect, it is suggested to place all electrodes per-pendicular to the embedded rebar on the concretesurface and take at least five measurements, each afew millimetres in distance from one another. Also,a correction factor should be applied to resistivitymeasurements once rebar is present in concrete.However, effect of rebar presence on the resistivitymeasurements is well-understood; just a few studiescould be found to identify the rebar presence effect
and more field investigations are still needed in thisarea.
(ii) Presence of cracks in concrete was also identified asan influential parameter on electrical resistivity sinceit is initially presumed that concrete is homogenous,isotropic, and uncracked. Depth of crack, orientationof probes on crack, and type of crack (conductiveor isolated) can individually affect the resistivityreadings.As suggested for embedded rebar in the con-crete, all electrodes should be placed in perpendiculardirection to cracks. It was reported that higher resis-tivity readings were obtained from conductive crackswhereas lower resistivity values were gained for insu-lated cracks. However, no information is providedto show how much cracking induced by corrosioninfluences concrete resistivity. In addition when bothinsulated and conductive cracks are bridged together,their integrated influence on electrical resistivity isnot well-understood.
(iii) The moisture state and temperature of concrete dur-ing resistivity measurements were also found to beof major influence on recorded data. As temper-ature increases, the ions mobility becomes faster;consequently, electrical conductivity of concrete alsoincreases. To lessen the temperature effect on resistiv-ity results, no practical correlation is still published forreal-world conditions. Essentially, electrical resistivityreduces with an increase in moisture content as aresult of changing in the ion movement. It is stronglyrecommended to take resistivity measurements whenconcrete is in Saturated Surface Dry (SSD) condition.Yet, more investigations are required to understandhow much time is needed for water to infiltrate theconcrete to obtain constantmoisture level through thebulk sample.

26 Advances in Materials Science and Engineering
(iv) The studies related to resistivity measurement testdevice confirmed that electrical signal shape andfrequency, electrode contact with concrete surface,and probe spacing of surface resistivity measurementdevice can affect the resistivity results. To minimizethe effect of signal shape and frequency, using lowfrequency range square-wave signal for surface resis-tivity and high frequency range for bulk resistiv-ity is recommended. Proper contact should also beprovided to not mislead resistivity readings. Usinga saturated sponge between electrodes and concretesurface can reduce this effect. In 4-point Wennerprobe method, as it is assumed that concrete ishomogenousmaterial, aggregates inside concrete alsoaffect its homogeneity due to their higher resistivity.Therefore, providing enough wide spaces betweenelectrodes is essential to diminish aggregates effect. Asa rule of thumb, probe spacing 1.5 times higher thanthe maximum aggregate size should be considered.
(v) Aggregate content and type were identified to have aninfluence on concrete resistivity. Increase in aggregatecontent results in higher resistivity values due to theirless porosity and lower electrical conductivity. Also,aggregates with rough surface texture were found tohave higher resistivity as their tortuosity is higher.Therefore, the effect of aggregates content and typeshould be accounted for in resistivity measurements.
(vi) Carbonation process in aged concrete forms a multi-layered system that results in various resistivity valuesthrough the concrete depth. So, its effect shouldbe mitigated during resistivity measurements. Lowerresistivity is also generated when w/b ratio is high dueto higher percentage of porosity.
Correlation between concrete electrical resistivity and itscertain durability characteristics such as chloride diffusivity,compressive strength, and corrosion potential/rate was dis-cussed in this paper and is summarized below.
(i) Concrete resistivity is inversely related to chlorideingress, where lower resistivity indicated the areawhere chloride diffusion will be faster. A retardationof chloride can be taken into account through theintroduced reaction factor (𝑟cl). More research is stillrequired to better simulate sea site conditions.
(ii) Furthermore, a strong correlation can be foundbetween increasing electrical resistivity of concreteand the corrosion rate. The relationship can be seenwhen corrosion has initiated (active conditions). Itwill not be valid in the case of saturated concrete,where although the resistivity is low, the corrosionrate will be small because of lack of oxygen. Field datawas considered in just a few investigations and, thus,it is of high interest to gather more field experience.
(iii) In addition, concrete compressive strength and itselectrical resistivity have a direct relationship witheach other as both directly depend on the porosity ofthe matrix at early age. However, at a later age, the
conductivity of the pore solution and the degree ofconcrete saturation both influence this relationship.No practical relationship was identified in the liter-atures between compressive strength and electricalresistivity.
(iv) Four common measurement electrode geometriesthat have been employed in several studies to conductelectrical test on cementitious cylinders were intro-duced in this article. Among them, a strong directlinear correlation between two common methods ofresistivity measurements (concrete surface and bulkresistivity) was presented. However, more attentionshould be paid to multilayered cementitious com-posite systems in the field as electrical current flowsdifferently in these two techniques and for the types oflayered electrical properties that can happen becauseof moisture gradients, chemical changes, and ionicgradients.
Abbreviations
CON: ConcreteCEM: Cement pasteMOR: MortarMK: MetakaolinSF: Silica fumeRHA: Rice Husk AshOPC: Ordinary Portland CementSLG: SlagFA: Fly ashNP: Natural pozzolanUPV: Ultrasonic Pulse VelocityWPC: White Portland CementPFA: Pulverized-Fuel AshMS: MicrosilicaLPR: Linear Polarization Resistance techniqueTNVM: Total Number of Various Mixturesw/b: Water/binder ratioNR: Not reportedCR: Counter electrodeRE: Reference electrodeSC: Slag cementCA: Crystalline admixturesPLC: Portland Limestone Cement.
Conflicts of Interest
The authors declare that there are no conflicts of interestregarding the publication of this paper.
References
[1] P. K. Mehta and P. J. M. Monteiro, Concrete: microstructure,properties, and materials, McGraw-Hill, New York, NY, USA,3rd edition, 2006.
[2] ASTM, “Standard test method for bulk electrical conductivityof hardened concrete,” ASTM C1760-12, ASTM International,2012.
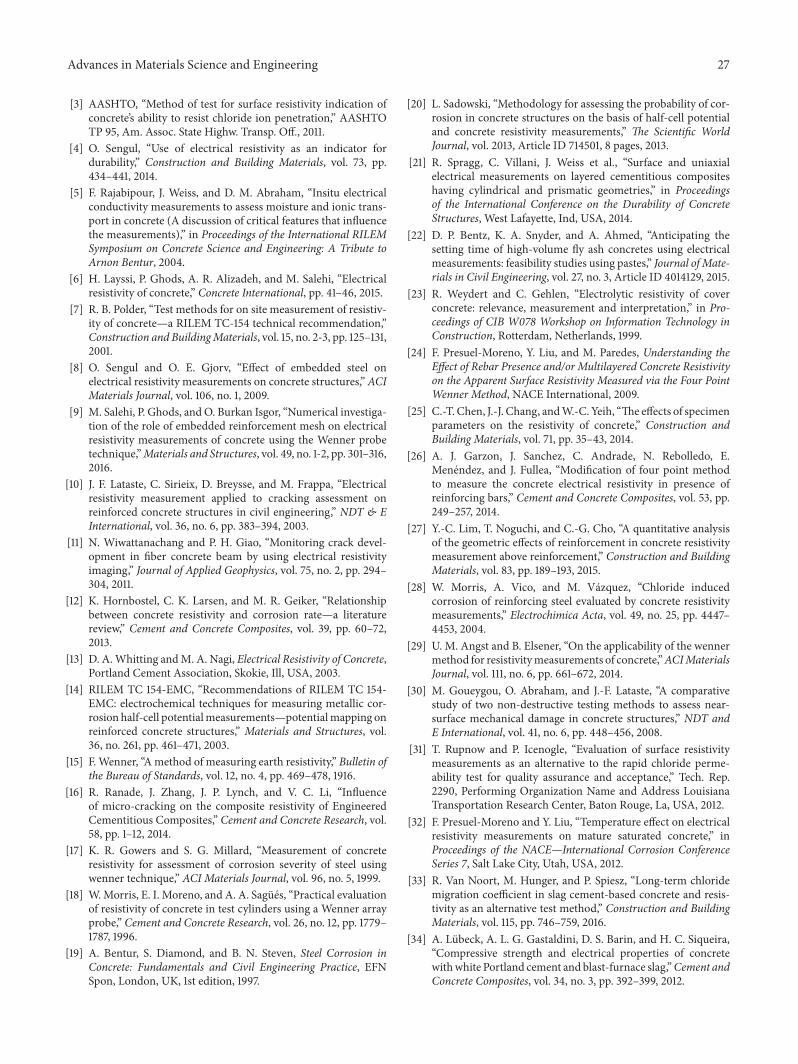
Advances in Materials Science and Engineering 27
[3] AASHTO, “Method of test for surface resistivity indication ofconcrete’s ability to resist chloride ion penetration,” AASHTOTP 95, Am. Assoc. State Highw. Transp. Off., 2011.
[4] O. Sengul, “Use of electrical resistivity as an indicator fordurability,” Construction and Building Materials, vol. 73, pp.434–441, 2014.
[5] F. Rajabipour, J. Weiss, and D. M. Abraham, “Insitu electricalconductivity measurements to assess moisture and ionic trans-port in concrete (A discussion of critical features that influencethe measurements),” in Proceedings of the International RILEMSymposium on Concrete Science and Engineering: A Tribute toArnon Bentur, 2004.
[6] H. Layssi, P. Ghods, A. R. Alizadeh, and M. Salehi, “Electricalresistivity of concrete,” Concrete International, pp. 41–46, 2015.
[7] R. B. Polder, “Test methods for on site measurement of resistiv-ity of concrete—a RILEM TC-154 technical recommendation,”Construction and BuildingMaterials, vol. 15, no. 2-3, pp. 125–131,2001.
[8] O. Sengul and O. E. Gjorv, “Effect of embedded steel onelectrical resistivity measurements on concrete structures,” ACIMaterials Journal, vol. 106, no. 1, 2009.
[9] M. Salehi, P. Ghods, andO. Burkan Isgor, “Numerical investiga-tion of the role of embedded reinforcement mesh on electricalresistivity measurements of concrete using the Wenner probetechnique,”Materials and Structures, vol. 49, no. 1-2, pp. 301–316,2016.
[10] J. F. Lataste, C. Sirieix, D. Breysse, and M. Frappa, “Electricalresistivity measurement applied to cracking assessment onreinforced concrete structures in civil engineering,” NDT & EInternational, vol. 36, no. 6, pp. 383–394, 2003.
[11] N. Wiwattanachang and P. H. Giao, “Monitoring crack devel-opment in fiber concrete beam by using electrical resistivityimaging,” Journal of Applied Geophysics, vol. 75, no. 2, pp. 294–304, 2011.
[12] K. Hornbostel, C. K. Larsen, and M. R. Geiker, “Relationshipbetween concrete resistivity and corrosion rate—a literaturereview,” Cement and Concrete Composites, vol. 39, pp. 60–72,2013.
[13] D. A.Whitting andM. A. Nagi, Electrical Resistivity of Concrete,Portland Cement Association, Skokie, Ill, USA, 2003.
[14] RILEM TC 154-EMC, “Recommendations of RILEM TC 154-EMC: electrochemical techniques for measuring metallic cor-rosion half-cell potentialmeasurements—potentialmapping onreinforced concrete structures,” Materials and Structures, vol.36, no. 261, pp. 461–471, 2003.
[15] F. Wenner, “Amethod of measuring earth resistivity,” Bulletin ofthe Bureau of Standards, vol. 12, no. 4, pp. 469–478, 1916.
[16] R. Ranade, J. Zhang, J. P. Lynch, and V. C. Li, “Influenceof micro-cracking on the composite resistivity of EngineeredCementitious Composites,” Cement and Concrete Research, vol.58, pp. 1–12, 2014.
[17] K. R. Gowers and S. G. Millard, “Measurement of concreteresistivity for assessment of corrosion severity of steel usingwenner technique,” ACI Materials Journal, vol. 96, no. 5, 1999.
[18] W.Morris, E. I. Moreno, and A. A. Sagues, “Practical evaluationof resistivity of concrete in test cylinders using a Wenner arrayprobe,” Cement and Concrete Research, vol. 26, no. 12, pp. 1779–1787, 1996.
[19] A. Bentur, S. Diamond, and B. N. Steven, Steel Corrosion inConcrete: Fundamentals and Civil Engineering Practice, EFNSpon, London, UK, 1st edition, 1997.
[20] L. Sadowski, “Methodology for assessing the probability of cor-rosion in concrete structures on the basis of half-cell potentialand concrete resistivity measurements,” The Scientific WorldJournal, vol. 2013, Article ID 714501, 8 pages, 2013.
[21] R. Spragg, C. Villani, J. Weiss et al., “Surface and uniaxialelectrical measurements on layered cementitious compositeshaving cylindrical and prismatic geometries,” in Proceedingsof the International Conference on the Durability of ConcreteStructures, West Lafayette, Ind, USA, 2014.
[22] D. P. Bentz, K. A. Snyder, and A. Ahmed, “Anticipating thesetting time of high-volume fly ash concretes using electricalmeasurements: feasibility studies using pastes,” Journal of Mate-rials in Civil Engineering, vol. 27, no. 3, Article ID 4014129, 2015.
[23] R. Weydert and C. Gehlen, “Electrolytic resistivity of coverconcrete: relevance, measurement and interpretation,” in Pro-ceedings of CIB W078 Workshop on Information Technology inConstruction, Rotterdam, Netherlands, 1999.
[24] F. Presuel-Moreno, Y. Liu, and M. Paredes, Understanding theEffect of Rebar Presence and/or Multilayered Concrete Resistivityon the Apparent Surface Resistivity Measured via the Four PointWenner Method, NACE International, 2009.
[25] C.-T. Chen, J.-J. Chang, andW.-C. Yeih, “The effects of specimenparameters on the resistivity of concrete,” Construction andBuilding Materials, vol. 71, pp. 35–43, 2014.
[26] A. J. Garzon, J. Sanchez, C. Andrade, N. Rebolledo, E.Menendez, and J. Fullea, “Modification of four point methodto measure the concrete electrical resistivity in presence ofreinforcing bars,” Cement and Concrete Composites, vol. 53, pp.249–257, 2014.
[27] Y.-C. Lim, T. Noguchi, and C.-G. Cho, “A quantitative analysisof the geometric effects of reinforcement in concrete resistivitymeasurement above reinforcement,” Construction and BuildingMaterials, vol. 83, pp. 189–193, 2015.
[28] W. Morris, A. Vico, and M. Vazquez, “Chloride inducedcorrosion of reinforcing steel evaluated by concrete resistivitymeasurements,” Electrochimica Acta, vol. 49, no. 25, pp. 4447–4453, 2004.
[29] U. M. Angst and B. Elsener, “On the applicability of the wennermethod for resistivitymeasurements of concrete,”ACIMaterialsJournal, vol. 111, no. 6, pp. 661–672, 2014.
[30] M. Goueygou, O. Abraham, and J.-F. Lataste, “A comparativestudy of two non-destructive testing methods to assess near-surface mechanical damage in concrete structures,” NDT andE International, vol. 41, no. 6, pp. 448–456, 2008.
[31] T. Rupnow and P. Icenogle, “Evaluation of surface resistivitymeasurements as an alternative to the rapid chloride perme-ability test for quality assurance and acceptance,” Tech. Rep.2290, Performing Organization Name and Address LouisianaTransportation Research Center, Baton Rouge, La, USA, 2012.
[32] F. Presuel-Moreno and Y. Liu, “Temperature effect on electricalresistivity measurements on mature saturated concrete,” inProceedings of the NACE—International Corrosion ConferenceSeries 7, Salt Lake City, Utah, USA, 2012.
[33] R. Van Noort, M. Hunger, and P. Spiesz, “Long-term chloridemigration coefficient in slag cement-based concrete and resis-tivity as an alternative test method,” Construction and BuildingMaterials, vol. 115, pp. 746–759, 2016.
[34] A. Lubeck, A. L. G. Gastaldini, D. S. Barin, and H. C. Siqueira,“Compressive strength and electrical properties of concretewithwhite Portland cement and blast-furnace slag,”Cement andConcrete Composites, vol. 34, no. 3, pp. 392–399, 2012.
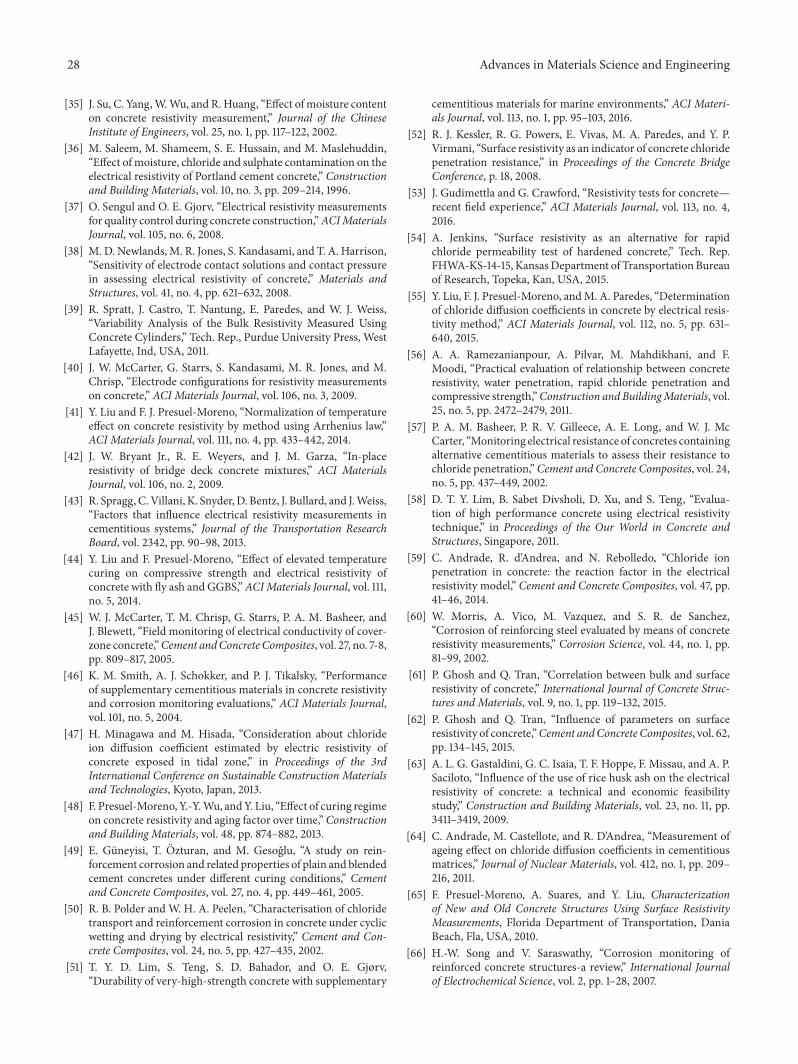
28 Advances in Materials Science and Engineering
[35] J. Su, C. Yang,W.Wu, and R. Huang, “Effect ofmoisture contenton concrete resistivity measurement,” Journal of the ChineseInstitute of Engineers, vol. 25, no. 1, pp. 117–122, 2002.
[36] M. Saleem, M. Shameem, S. E. Hussain, and M. Maslehuddin,“Effect of moisture, chloride and sulphate contamination on theelectrical resistivity of Portland cement concrete,” Constructionand Building Materials, vol. 10, no. 3, pp. 209–214, 1996.
[37] O. Sengul and O. E. Gjorv, “Electrical resistivity measurementsfor quality control during concrete construction,”ACIMaterialsJournal, vol. 105, no. 6, 2008.
[38] M. D. Newlands,M. R. Jones, S. Kandasami, and T. A. Harrison,“Sensitivity of electrode contact solutions and contact pressurein assessing electrical resistivity of concrete,” Materials andStructures, vol. 41, no. 4, pp. 621–632, 2008.
[39] R. Spratt, J. Castro, T. Nantung, E. Paredes, and W. J. Weiss,“Variability Analysis of the Bulk Resistivity Measured UsingConcrete Cylinders,” Tech. Rep., Purdue University Press, WestLafayette, Ind, USA, 2011.
[40] J. W. McCarter, G. Starrs, S. Kandasami, M. R. Jones, and M.Chrisp, “Electrode configurations for resistivity measurementson concrete,” ACI Materials Journal, vol. 106, no. 3, 2009.
[41] Y. Liu and F. J. Presuel-Moreno, “Normalization of temperatureeffect on concrete resistivity by method using Arrhenius law,”ACI Materials Journal, vol. 111, no. 4, pp. 433–442, 2014.
[42] J. W. Bryant Jr., R. E. Weyers, and J. M. Garza, “In-placeresistivity of bridge deck concrete mixtures,” ACI MaterialsJournal, vol. 106, no. 2, 2009.
[43] R. Spragg, C.Villani, K. Snyder,D. Bentz, J. Bullard, and J.Weiss,“Factors that influence electrical resistivity measurements incementitious systems,” Journal of the Transportation ResearchBoard, vol. 2342, pp. 90–98, 2013.
[44] Y. Liu and F. Presuel-Moreno, “Effect of elevated temperaturecuring on compressive strength and electrical resistivity ofconcrete with fly ash and GGBS,”ACIMaterials Journal, vol. 111,no. 5, 2014.
[45] W. J. McCarter, T. M. Chrisp, G. Starrs, P. A. M. Basheer, andJ. Blewett, “Field monitoring of electrical conductivity of cover-zone concrete,”Cement andConcrete Composites, vol. 27, no. 7-8,pp. 809–817, 2005.
[46] K. M. Smith, A. J. Schokker, and P. J. Tikalsky, “Performanceof supplementary cementitious materials in concrete resistivityand corrosion monitoring evaluations,” ACI Materials Journal,vol. 101, no. 5, 2004.
[47] H. Minagawa and M. Hisada, “Consideration about chlorideion diffusion coefficient estimated by electric resistivity ofconcrete exposed in tidal zone,” in Proceedings of the 3rdInternational Conference on Sustainable Construction Materialsand Technologies, Kyoto, Japan, 2013.
[48] F. Presuel-Moreno, Y.-Y.Wu, andY. Liu, “Effect of curing regimeon concrete resistivity and aging factor over time,” Constructionand Building Materials, vol. 48, pp. 874–882, 2013.
[49] E. Guneyisi, T. Ozturan, and M. Gesoglu, “A study on rein-forcement corrosion and related properties of plain and blendedcement concretes under different curing conditions,” Cementand Concrete Composites, vol. 27, no. 4, pp. 449–461, 2005.
[50] R. B. Polder and W. H. A. Peelen, “Characterisation of chloridetransport and reinforcement corrosion in concrete under cyclicwetting and drying by electrical resistivity,” Cement and Con-crete Composites, vol. 24, no. 5, pp. 427–435, 2002.
[51] T. Y. D. Lim, S. Teng, S. D. Bahador, and O. E. Gjørv,“Durability of very-high-strength concrete with supplementary
cementitious materials for marine environments,” ACI Materi-als Journal, vol. 113, no. 1, pp. 95–103, 2016.
[52] R. J. Kessler, R. G. Powers, E. Vivas, M. A. Paredes, and Y. P.Virmani, “Surface resistivity as an indicator of concrete chloridepenetration resistance,” in Proceedings of the Concrete BridgeConference, p. 18, 2008.
[53] J. Gudimettla and G. Crawford, “Resistivity tests for concrete—recent field experience,” ACI Materials Journal, vol. 113, no. 4,2016.
[54] A. Jenkins, “Surface resistivity as an alternative for rapidchloride permeability test of hardened concrete,” Tech. Rep.FHWA-KS-14-15, KansasDepartment of Transportation Bureauof Research, Topeka, Kan, USA, 2015.
[55] Y. Liu, F. J. Presuel-Moreno, andM. A. Paredes, “Determinationof chloride diffusion coefficients in concrete by electrical resis-tivity method,” ACI Materials Journal, vol. 112, no. 5, pp. 631–640, 2015.
[56] A. A. Ramezanianpour, A. Pilvar, M. Mahdikhani, and F.Moodi, “Practical evaluation of relationship between concreteresistivity, water penetration, rapid chloride penetration andcompressive strength,”Construction and BuildingMaterials, vol.25, no. 5, pp. 2472–2479, 2011.
[57] P. A. M. Basheer, P. R. V. Gilleece, A. E. Long, and W. J. McCarter, “Monitoring electrical resistance of concretes containingalternative cementitious materials to assess their resistance tochloride penetration,”Cement and Concrete Composites, vol. 24,no. 5, pp. 437–449, 2002.
[58] D. T. Y. Lim, B. Sabet Divsholi, D. Xu, and S. Teng, “Evalua-tion of high performance concrete using electrical resistivitytechnique,” in Proceedings of the Our World in Concrete andStructures, Singapore, 2011.
[59] C. Andrade, R. d’Andrea, and N. Rebolledo, “Chloride ionpenetration in concrete: the reaction factor in the electricalresistivity model,” Cement and Concrete Composites, vol. 47, pp.41–46, 2014.
[60] W. Morris, A. Vico, M. Vazquez, and S. R. de Sanchez,“Corrosion of reinforcing steel evaluated by means of concreteresistivity measurements,” Corrosion Science, vol. 44, no. 1, pp.81–99, 2002.
[61] P. Ghosh and Q. Tran, “Correlation between bulk and surfaceresistivity of concrete,” International Journal of Concrete Struc-tures and Materials, vol. 9, no. 1, pp. 119–132, 2015.
[62] P. Ghosh and Q. Tran, “Influence of parameters on surfaceresistivity of concrete,”Cement andConcrete Composites, vol. 62,pp. 134–145, 2015.
[63] A. L. G. Gastaldini, G. C. Isaia, T. F. Hoppe, F. Missau, and A. P.Saciloto, “Influence of the use of rice husk ash on the electricalresistivity of concrete: a technical and economic feasibilitystudy,” Construction and Building Materials, vol. 23, no. 11, pp.3411–3419, 2009.
[64] C. Andrade, M. Castellote, and R. D’Andrea, “Measurement ofageing effect on chloride diffusion coefficients in cementitiousmatrices,” Journal of Nuclear Materials, vol. 412, no. 1, pp. 209–216, 2011.
[65] F. Presuel-Moreno, A. Suares, and Y. Liu, Characterizationof New and Old Concrete Structures Using Surface ResistivityMeasurements, Florida Department of Transportation, DaniaBeach, Fla, USA, 2010.
[66] H.-W. Song and V. Saraswathy, “Corrosion monitoring ofreinforced concrete structures-a review,” International Journalof Electrochemical Science, vol. 2, pp. 1–28, 2007.
Advances in Materials Science and Engineering 29
[67] W. Elkey and E. J. Sellevold, Electrical Resistivity of Concrete,supplement 80, Norwegian Road Research Laboratory, Oslo,Norway, 1995.
[68] “Operating Instructions Resipod Family Manual.” Proceq.[69] SURF�, Surface Electrical Resistivity of ConcreteManual, Giatec
Scientific Inc., https://www.giatecscientific.com/concrete-resist-ivity/surf/.
[70] J. Weiss, K. Snyder, J. Bullard, and D. Bentz, “Using a saturationfunction to interpret the electrical properties of partially satu-rated concrete,” Journal ofMaterials in Civil Engineering, vol. 25,no. 8, pp. 1097–1106, 2013.
[71] S. G. Millard, “Reinforced concrete resistivity measurementtechniques,” Institution of Civil Engineers, vol. 91, pp. 71–88, 1991.
[72] F. Presuel-Moreno, Y. Liu, and Y.-Y. Wu, “Numerical modelingof the effects of rebar presence and/or multilayered concreteresistivity on the apparent resistivity measured via the Wennermethod,” Construction and Building Materials, vol. 48, pp. 16–25, 2013.
[73] M. Salehi, Numerical investigation of the role of embeddedreinforcement mesh on electrical resistivity measurements ofconcrete using theWenner probe technique [M.S. thesis], CarletonUniversity, Ottawa, Canada, 2013.
[74] J. Sanchez, C. Andrade, J. Torres, N. Rebolledo, and J. Fullea,“Determination of reinforced concrete durability with on-siteresistivity measurements,”Materials and Structures, vol. 50, no.1, 2017.
[75] M. Morales, “Experimental investigation of the effects ofembedded rebar, cracks, chloride ingress and corrosion on elec-trical resistivity measurements of reinforced concrete,” Master,Oregon State University, 2015.
[76] A. A. Shah and Y. Ribakov, “Non-destructive measurements ofcrack assessment and defect detection in concrete structures,”Materials and Design, vol. 29, no. 1, pp. 61–69, 2008.
[77] M. Chouteau and S. Beaulieu, “An investigation on applicationof the electrical resistivity tomography method to concretestructures,” in Proceedings of the Geophysics 2002. The 2ndAnnual Conference on the Application of Geophysical and NDTMethodologies to Transportation Facilities and Infrastructure,Washington DC, USA, 2002.
[78] E. Taillet, J. F. Lataste, P. Rivard, and A. Denis, “Non-destructiveevaluation of cracks in massive concrete using normal dcresistivity logging,” NDT and E International, vol. 63, pp. 11–20,2014.
[79] M. Salehi, P. Ghods, and O. B. Isgor, “Numerical study on theeffect of cracking on surface resistivity of plain and reinforcedconcrete elements,” Journal ofMaterials in Civil Engineering, vol.27, no. 12, Article ID 04015053, 2015.
[80] A. J. Ewins, “Resistivity Measurements in Concrete,” BritishJournal of NDT, vol. 32, no. 3, pp. 120–126, 1990.
[81] R. Henkensiefken, J. Castro, D. Bentz, T. Nantung, and J. Weiss,“Water absorption in internally cured mortar made with water-filled lightweight aggregate,”Cement andConcrete Research, vol.39, no. 10, pp. 883–892, 2009.
[82] M. D. A. Thomas, “The use of conductive gel,” 2008.[83] J. D. Shane, Electrical conductivity and transport properties
of cement-based material measured by impedance spectroscopy[ph.D. thesis], NothwesternUniversity, Evanston, Ill, USA, 2000.
[84] R. Spragg, Y. Bu, K. Snyder, D. Bentz, and J. Weiss, “Electricaltesting of cement-based materials: role of testing techniques,sample conditioning,” Tech. Rep. FHWA/IN/JTRP-2013/28,Purdue University, 2013.
[85] A. Shahroodi, Development of test methods for assessment ofconcrete durability for use in performance-based specifications[M.S. thesis], University of Toronto, Toronto, Canada, 2010.
[86] J. M. S. Marquez, Influence of saturation and geometry on sur-face electrical resistivity measurements [M.S. thesis], ConcoridaUniversity, Montreal, Canada, 2015.
[87] M. Castellote, C. Andrade, andM. C. Alonso, “Standardization,to a reference of 25∘C, of electrical resistivity for mortars andconcretes in saturated or isolated conditions,” ACI MaterialsJournal, vol. 99, no. 2, 2002.
[88] Y. A. Villagran Zaccardi, J. F. Garcıa, P. Huelamo, and A. A.Di Maio, “Influence of temperature and humidity on Portlandcement mortar resistivity monitored with inner sensors,”Mate-rials and Corrosion, vol. 60, no. 4, pp. 294–299, 2009.
[89] S. Poyet, “Experimental investigation of the effect of tempera-ture on the first desorption isotherm of concrete,” Cement andConcrete Research, vol. 39, no. 11, pp. 1052–1059, 2009.
[90] S. G. Millard, J. A. Harrison, and K. R. Gowers, “Practi-cal measurement of concrete resistivity,” British Journal Non-Destructive Testing, vol. 33, pp. 59–63, 1991.
[91] T. M. Chrisp, G. Starrs, W. J. McCarter, E. Rouchotas, and J.Blewett, “Temperature-conductivity relationships for concrete:an activation energy approach,” Journal of Materials ScienceLetters, vol. 20, no. 12, pp. 1085–1087, 2001.
[92] DuraCrete R17, “Probabilistic performance based durabilitydesign of concrete structures, includes general guidelines fordurability design and redesign,” Tech. Rep. BE95-1347/R17, TheEuropean Union – Brite EuRam III, CUR, Gouda.
[93] M. Pour-Ghaz, O. B. Isgor, and P. Ghods, “The effect of tem-perature on the corrosion of steel in concrete. Part 1: Simulatedpolarization resistance tests andmodel development,”CorrosionScience, vol. 51, no. 2, pp. 415–425, 2009.
[94] C. K. Larsen, E. J. Sellevold, J.-M. Østvik, and Ø. Vennesland,“Electrical resistivity of concrete—Part II: influence of moisturecontent and temperature,” in Proceedings of the 2nd Interna-tional RILEM Symposium on Advances in Concrete throughScience and Engineering, 2006.
[95] Y. Liu,Accelerated curing of concrete with high volume pozzolans-resistivity, diffusivity and compressive strength [ph.D. thesis],Florida Atlantic University, Boca Raton, Fla, USA, 2012.
[96] X. Lu, “Application of theNernst-Einstein equation to concrete,”Cement and Concrete Research, vol. 27, no. 2, pp. 293–302, 1997.
[97] K. R. Backe, O. B. Lile, and S. K. Lyomov, “Characterizing curingcement slurries by electrical conductivity,” SPE Drilling andCompletion, vol. 16, no. 4, pp. 201–207, 2001.
[98] FDOT, “Florida Method of Test For Concrete Resistivity as anElectrical Indicator of its Permeability,” FM 5-578, 2004.
[99] R. J. Kessler, R. G. Powers, and M. A. Paredes, “Resistivitymeasurements of water saturated concrete as an indicator ofpermeability,” in Proceedings of the Corrosion, Houston, Tex,USA.
[100] ASTM, “Standard test method for electrical indication ofconcrete’s ability to resist chloride ion penetration,” ASTMInternational C1202-12, 2012.
[101] R. K. Dhir, M. J. McCarthy, and M. D. Newlands, Eds.,Challenges of Concrete Construction: Concrete for Extreme Con-ditions: Proceedings of the International Conference held at theUniversity of Dundee, on 9–11 September 2002, vol. 6, ThomasTelford Publishing, Scotland, UK.
[102] E. Vivas, A. Boyd, and H. R. Hamilton III, “Permeability ofconcrete-comparison of conductivity and diffusion methods,”

30 Advances in Materials Science and Engineering
Tech. Rep. 4910 45 04 992-12 (0026899), Florida Department ofTransportation, Tallahassee, Fla, USA, 2007.
[103] G. K. Glass, C. L. Page, and N. R. Short, “Factors affecting thecorrosion rate of steel in carbonatedmortars,”Corrosion Science,vol. 32, no. 12, pp. 1283–1294, 1991.
[104] L. Bertolini and R. Polder, Concrete resistivity and reinforce-ment corrosion rate as a function of temperature and humidityof the environment TNO 97-NaN-R0574, Netherlands Organi-sation for Applied Scientific Research, Delft, The Netherlands,1997.
[105] ASTM, “Test Method for Corrosion Potentials of UncoatedReinforcing Steel in Concrete,” ASTM International C876, 2015.
[106] N. J. Carino, “Nondestructive techniques to investigate corro-sion status in concrete structures,” Journal of Performance ofConstructed Facilities, vol. 13, no. 3, pp. 96–106, 1999.
[107] N. Gucunski, F. Romero, S. Kruschwitz, R. Feldmann, A.Abu-Hawash, and M. Dunn, “Multiple complementary nonde-structive evaluation technologies for condition assessment ofconcrete bridge decks,” Transportation Research Record: Journalof the Transportation Research Board, no. 2201, pp. 34–44, 2010.
[108] N. Gucunski, A. Imani, F. Romero et al., Nondestructive testingto identify concrete bridge deck deterioration, TransportationResearch Board, Washington DC, USA, 2012.
[109] C. Alonso, C. Andrade, and J. A. Gonzalez, “Relation betweenresistivity and corrosion rate of reinforcements in carbonatedmortar made with several cement types,” Cement and ConcreteResearch, vol. 18, no. 5, pp. 687–698, 1988.
[110] C. Andrade and C. Alonso, “Corrosion rate monitoring in thelaboratory and on-site,” Construction and Building Materials,vol. 10, no. 5, pp. 315–328, 1996.
[111] J. Gulikers, “Theoretical considerations on the supposed linearrelationship between concrete resistivity and corrosion rate ofsteel reinforcement,”Materials and Corrosion, vol. 56, no. 6, pp.393–403, 2005.
[112] C. Andrade and C. Alonso, “Test methods for on-site corrosionrate measurement of steel reinforcement in concrete by meansof the polarization resistance method,” RILEM, vol. 37, pp. 623–643, 2004.
[113] E. Vesikari and M.-K. Soderqvist, “Life cycle management ofconcrete infrastructures for improved sustainability,” in Pro-ceedings of the 9th International BridgeManagement Conference,pp. 15–28, 2003.
[114] R. Gupta and A. Biparva, “Innovative test technique to evaluate‘self-sealing’ of concrete,” Journal of Testing and Evaluation, vol.43, no. 5, pp. 1091–1098, 2015.
[115] R. Gupta and A. Biparva, “Do crystalline water proofing admix-tures affect restrained plastic shrinkage behavior of concrete?”Revista ALCONPAT, vol. 7, no. 1, p. 15, 2017.

Submit your manuscripts athttps://www.hindawi.com
ScientificaHindawi Publishing Corporationhttp://www.hindawi.com Volume 2014
CorrosionInternational Journal of
Hindawi Publishing Corporationhttp://www.hindawi.com Volume 2014
Polymer ScienceInternational Journal of
Hindawi Publishing Corporationhttp://www.hindawi.com Volume 2014
Hindawi Publishing Corporationhttp://www.hindawi.com Volume 2014
CeramicsJournal of
Hindawi Publishing Corporationhttp://www.hindawi.com Volume 2014
CompositesJournal of
NanoparticlesJournal of
Hindawi Publishing Corporationhttp://www.hindawi.com Volume 2014
Hindawi Publishing Corporationhttp://www.hindawi.com Volume 2014
International Journal of
Biomaterials
Hindawi Publishing Corporationhttp://www.hindawi.com Volume 2014
NanoscienceJournal of
TextilesHindawi Publishing Corporation http://www.hindawi.com Volume 2014
Journal of
NanotechnologyHindawi Publishing Corporationhttp://www.hindawi.com Volume 2014
Journal of
CrystallographyJournal of
Hindawi Publishing Corporationhttp://www.hindawi.com Volume 2014
The Scientific World JournalHindawi Publishing Corporation http://www.hindawi.com Volume 2014
Hindawi Publishing Corporationhttp://www.hindawi.com Volume 2014
CoatingsJournal of
Advances in
Materials Science and EngineeringHindawi Publishing Corporationhttp://www.hindawi.com Volume 2014
Smart Materials Research
Hindawi Publishing Corporationhttp://www.hindawi.com Volume 2014
Hindawi Publishing Corporationhttp://www.hindawi.com Volume 2014
MetallurgyJournal of
Hindawi Publishing Corporationhttp://www.hindawi.com Volume 2014
BioMed Research International
MaterialsJournal of
Hindawi Publishing Corporationhttp://www.hindawi.com Volume 2014