electrical and pharmacological properties of mammalian neuroglial cells in tissue-culture
TRANSCRIPT

Electrical and Pharmacological Properties of Mammalian Neuroglial Cells in Tissue-CultureAuthor(s): W. M. WardellSource: Proceedings of the Royal Society of London. Series B, Biological Sciences, Vol. 165, No.1000 (Sep. 13, 1966), pp. 326-361Published by: The Royal SocietyStable URL: http://www.jstor.org/stable/75633 .
Accessed: 03/05/2014 20:05
Your use of the JSTOR archive indicates your acceptance of the Terms & Conditions of Use, available at .http://www.jstor.org/page/info/about/policies/terms.jsp
.JSTOR is a not-for-profit service that helps scholars, researchers, and students discover, use, and build upon a wide range ofcontent in a trusted digital archive. We use information technology and tools to increase productivity and facilitate new formsof scholarship. For more information about JSTOR, please contact [email protected].
.
The Royal Society is collaborating with JSTOR to digitize, preserve and extend access to Proceedings of theRoyal Society of London. Series B, Biological Sciences.
http://www.jstor.org
This content downloaded from 130.132.123.28 on Sat, 3 May 2014 20:05:02 PMAll use subject to JSTOR Terms and Conditions

Electrical and pharmacological properties of mammalian
neuroglial cells in tissue-culture
By W. M. Wardell*
University Department of Pharmacology, South Parks Road, Oxford
(Communicated by W. D. M. Paton, F.R.S.?
Received 8 December 1965?Revised 28 March 1966)
[Plates 47 to 49]
Neuroglial cells growing in short-term tissue-cultures of mammalian brain were impaled with microelectrodes under microscopic visual control. All the membrane potentials wore internally negative with a mean value of ?31 mV. They were reversibly depolarized by raising the external potassium ion concentration in the presence of low, normal and high chloride concentrations. No effect on glial membrane potentials was obtained by applying acetylcholine, adrenaline, noradrenaline, 5-hydroxytryptamine, sodium glutamate or barium ions.
The 'response' of these cells to extracellular stimulation through saline-filled glass micropipettes has been analysed. Its properties were similar to those reported by other workers, tho mean amplitude being 8-0 mV and the mean half-time of repolarization 1-5 s. Typical stimulus parameters were a 3 ms cathodal current pulse of 40 /xA intensity, delivered through a pipette of 10 /xm tip diameter placed 10 fimaway from the cell membrane. These stimuli had a powerful mechanical component (due to electro-osmosis and electrophoresis) which could cause visible mechanical damage to the cells. The 'response' could easily be obtained in HeLa cells and fibroblasts; it was not abolished by local anaesthetics or by sodium substitutes; and it could not be elicited by intraeellular stimuli causing less than 200 mV displacement of membrane potential in either direction. On the other hand, the 'response' could readily be produced by purely mechanical percussion of the cell membrane, or by displacement of the membrane potential to a level sufficient to cause demonstrable dielectric breakdown (above 250 mV in either direction).
Tho 'response' thus did not resemble regenerative responses in other excitable tissues, but did resemble closely the known effects of mechanical and of dielectric breakdown of cell membranes. The evidence showed that the 'response' in tissue-cultured cells was duo largely to mechanical breakdown of the cell membrane. Since the membrane behaves passively, tho term 'response' should bo abandoned; the phenomenon is an artifact and has no neurophysiological significance.
In the intact brain (where a similar 'response' has been reported by other workers), the mechanical pulse would be absent, and it is suggested that there the effect might be duo to dielectric breakdown.
The input resistance of glial cells ranged from 0-5 to 10-5 MO (mean = 4-2 MO). It was not feasible to estimate the specific membrane resistance.
Introduction
For over a century it has been known that a large part of the brain consists of
non-neural tissue, the neuroglia. Its electrophysiological role?if any?is still
unknown. The findings with the electron microscope in the last decade, that only a small volume of intercellular space intervenes between neurons and glial cells, raise the question of whether the neuroglia might be in a position to influence the
ionic environment of neurons and the flow of current in nervous tissue. The proper? ties of glial cell membranes are thus of interest because of this possible neuro?
physiological role. : Christopher Welch Scholar, University of Oxford.
[ 326 ]
This content downloaded from 130.132.123.28 on Sat, 3 May 2014 20:05:02 PMAll use subject to JSTOR Terms and Conditions

Electrophysiology of neuroglia 327
The lack of electrophysiological information about glial cells is due to the tech? nical difficulty of identifying them. Glial cells apparently lack a distinctive elec? trical sign (comparable with the nerve impulse) by which they can be identified
electrically, and in the absence of this, positive identification can only be made on
morphological grounds. The difficulty lies in correlating the electrical and morpho? logical studies. Most of the limited information at present available from corre? lated electrical and morphological studies of glial cells either suggests that their membranes are electrically passive, or is equivocal. In squid axon (Villegas, Villegas, Gimenez & Villegas 1963) and leech ganglion (Kuffler & Potter 1964; Nicholls & Kuffler 1964) the immediate biophysical relationship between neurons and neuroglia is passive, while in the intact central nervous system, 'silent cells' have been identified and studied electrically (Coombs, Eccles & Fatt 1955a), but no morphological studies have been made to determine whether or not these are
glia. There are only two direct reports that glial cell membranes might be capable of
undergoing electrical activity. The first is that of Svaetichin, Laufer, Mitari, Fatechand, Vallecalle & Villegas (1961) concerning glial elements in the retina of a fish. The second is the apparent 'response' to electrical stimulation of mammalian
glial cells in tissue culture and of silent cells in the mammalian brain, described
by Hild, Chang & Tasaki (1958); Tasaki & Chang (1958); Hild & Tasaki (1962); and Hild, Takenaka & Walker (1965).
This paper consists mainly of the analysis of the second of these phenomena (the 'response' of mammalian glial cells to electrical stimulation) in the situation in which it was first observed (Hild et al. 1958; Hild & Tasaki 1962; Hild et al.
1965): in neuroglia growing in tissue cultures of mammalian brain.
Some observations are also described of the membrane potentials of glial and other cells growing in tissue culture, and of the effect on the glial cells of some drugs of neurophysiological interest.
Preliminary accounts of this work have been published (Wardell 1963, 1964).
Methods
The methods were similar to those used by Hild & Tasaki (1962).
Tissue culture
(Pomerat & Costero 1956; Hild & Tasaki 1962; Lumsden 1951; Paul i960) Fragments 1 mm3 in size were cut aseptically from the cerebellum of 1- to
4-day-old rabbits, dissected free of meninges in Hanks's solution and explanted on to the surface of plasma clots (Difco Laboratories Ltd: reconstituted desiccated chicken plasma). They were then incubated on flying coverslips in roller tubes
(12 rev/h for 4 to 8 days, optimum = 6 days) at a temperature of 36-5 ?C in 1 ml. of a nutrient medium consisting of 2 parts of Earle's saline solution (Oxoid Ltd) with glucose increased to 600 mg/100 ml., and 1 part 50% 9-day chick embryo extract in Earle's solution. The pH of the nutrient solution was kept in the range 6-9 to 7-1 by frequent adjustment. No antibiotics were used. There were two main
This content downloaded from 130.132.123.28 on Sat, 3 May 2014 20:05:02 PMAll use subject to JSTOR Terms and Conditions

328 W. M. Wardell
differences between the method used here and that of other workers. First, serum
was omitted from the nutrient solution because of problems of toxicity; the
essential constituents of serum were presumably derived instead from the large
plasma clot. Secondly, explants were made on to the surface of already-formed
plasma clots. This simple modification confined cellular migration to the surface
of the clot, thus exposing the cells directly to the bathing solution and to the
100 Ksi
?-H To Tektronix
2rnT
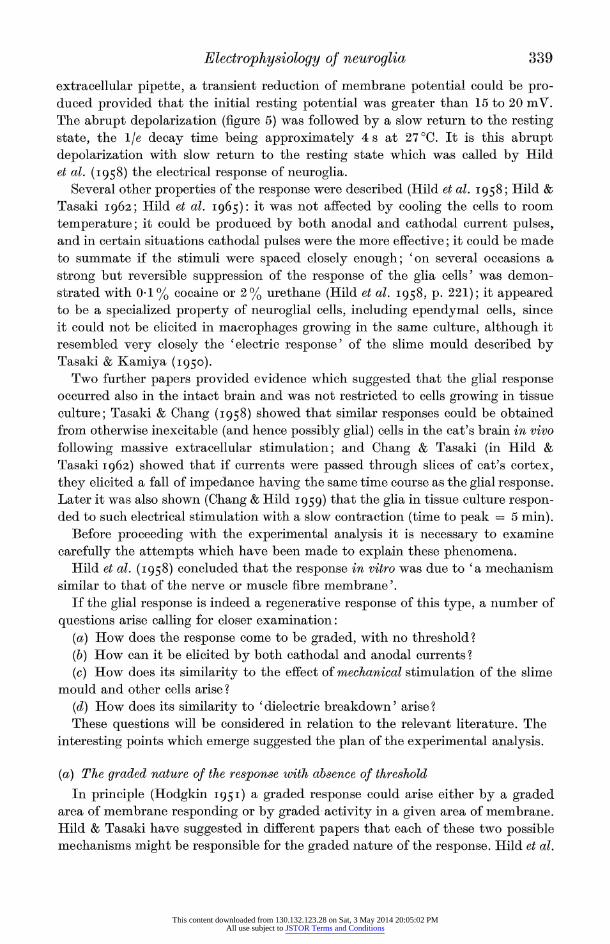
Figure 1. Diagram of bathing chamber and recording system, showing the position of the stimulating electrode (left) and the recording electrode (right). Oblique view of chamber (below).
microelectrodes, and eliminating the difficulties encountered by other workers in
impaling the cells (Grain 1956; Grill, Rumery & Woodbury 1959; Hild et al. 1958; Hild & Tasaki 1962).
HeLa cells were obtained from the Sir William Dunn School of Pathology, Oxford, and suspended in the above nutrient solution at a concentration of 3 x IO5
cells/ml. When 2 ml. of this suspension were incubated in a stationary Leighton tube, the cells settled and grew on the surface of a plasma-covered coverslip on its
floor. After 1 to 3 days these cultures were used in the same way as the cultures of
cerebellum.
Optical and mechanical apparatus, and bathing chamber
The main components are illustrated in figure 1. The cells were viewed with a Zeiss W.L. phase-contrast microscope using a x 40 Neofluar objective and a long
This content downloaded from 130.132.123.28 on Sat, 3 May 2014 20:05:02 PMAll use subject to JSTOR Terms and Conditions

Electrophysiology of neuroglia 329
working-distance condenser. The total magnification was x 640. A green glass filter and a heat-absorbing filter were placed in the light path.
The bathing chamber (figure 1 inset) was very similar to that used by Hild & Tasaki (1958). The base was a strip of thin Perspex, the roof was formed by the
coverslip bearing the culture on its under surface, and the sides were open. The
total height of the chamber was less than 6 mm, to fit within the working distance of the condenser. The total depth of the coverslip, clot and culture was less than
0-3 mm, to fit within the working distance of the objective. The chamber was filled with 0-6 ml. of Hanks's saline solution which was changed
frequently. A heater and thermocouple were incorporated for those experiments (Results, Part I) performed at 37 ?C, and the gas phase surrounding the bath was
controlled by introducing 100% C02 at a rate which kept the pH to within 0-1
unit of the target value of 7-0.
The bathing fluid was held in the chamber, despite the open sides, by surface
tension. Microelectrodes with bent tips pointing upwards at an angle of 15? from
the horizontal were introduced through the menisci at the open sides, and their movements controlled by a pair of Leitz micromanipulators.
Precautions were taken to screen the apparatus electrically and to minimize mechanical vibration.
Bathing solutions
The compositions of the various solutions are summarized in table 1. The saline solution normally used was Hanks's (Oxoid Ltd; Paul i960).
Table 1. Composition of normal and altered
bathing solutions (paul i960) Hanks's solution
substance
Na+ K+ ethane sulphonate ci-
NaCl KC1
CaCl2 MgS04.7H20 MgCl2.6H20 Na2HP04.2H20 NaH2P04.H20 KH2P04 NaHC03 glucose phenol red
Na ethane sulphonate H20 K ethane sulphonate
normal
142
147
8-0 0-4
x 2-5 K+ x 5-0 K+ x 10 K+
(A) major ions (mM) 133-5 119-2 90-7 14-2 28-5 57 88-2 117-6 132-3 58-8 29-4 14-7
(B) weights of salts used (g/1.) 2-39 0-88 0-33 1-04 0-79 0-40
0-14 010 0-10 0-06
0-06 0-35 3-0 0-01
x 20 K+ Earle's
33-7 114 139-7
7-3
0-27
144 5-3
126
6-8 0-4
0-2 0-10
0-125
2-2 6-0 0-02
13-2 150 2-61
12-2 7-6
4-45 16-3
Vol. 165. B.
This content downloaded from 130.132.123.28 on Sat, 3 May 2014 20:05:02 PMAll use subject to JSTOR Terms and Conditions

330 W. M. Wardell
Hanks's solutions with altered K+ and Cl~ concentrations were made up having 2-5, 5, 10 and 20 times the normal potassium ion concentration and a constant
[K+] x [Cl~] product of 837 mM2. The extra potassium replaced an equimolar amount of sodium, while the deficit of chloride was replaced by an equimolar amount of the anion ethane sulphonate (B.D.H. Ltd; Goodford & Ing 1959).
Low-sodium Hanks's solutions were made by replacing the 138 ium/I. of NaCl
by either 152 mM of tris chloride [152 mM tris (hydroxymethyl) amino methane
(Sigma Chemical Company), titrated to pH 7-2 with HC1?Liittgau & Niedergerke
1959]; or by 246 mM of sucrose. With these solutions, the final sodium ion concen?
tration in the bath (determined flame-photometrically after two experiments) was
less than 6-0 mequiv./l. Anaesthetic solutions: Cocaine hydrochloride B.P. and Urethane (B.D.H. Ltd)
were added in concentrations of 0-1 % and 2-0% respectively, w/v, to normal Hanks's
solution.
Changing the solutions: in those experiments in which the bath fluid was
changed, the contents of the bath were replaced at least three times during a
period of 20 min before the new observations commenced.
Recording system (figure 1)
Membrane potentials were recorded with 3 m KCl-filled micropipettes of 25 to
75 MO resistance in the bath fluid, and less than ? 20 mV tip potential. The input
stage was a pair of conventional cathode followers having a grid current smaller
than 2-5 x 10-11A, an input impedance greater than 50 x IO9 O, and an input capaci? tance of less than 10 pP.
The Ag/AgCl wire from the recording pipette was connected to one grid via
a cathodally screened lead and the indifferent grid was either earthed, or floated
via a second extracellular pipette. The bath fluid was earthed via an Ag/AgCl wire.
Records were displayed on one or two Tetronix type 502 oscilloscopes as required and photographed with Grass recording cameras.
Extracellular stimulation
Glass micropipettes of 3 to 10 /xm tip diameter were filled with an aqueous solution of 0-9% NaCl containing 0-5% agar, and had a resistance of 1 to 5 MO.
A platinum indifferent electrode was placed in the bath fluid, and current moni?
tored by the voltage drop across a 1 KO resistor placed between this and the return
lead from the stimulator. The source of stimulating current was either the radio-
frequency isolation unit of a conventional square-wave stimulator, or a floating
battery switched by a transistor flip-flop circuit. In either case the maximum
available voltage was usually 100 V. Metal-filled glass pipettes were made initially as above but filled with an alloy of 50 % indium and 50 % Woods metal, and in
some cases the tips were silver plated. Mechanical pulses were delivered by con?
necting saline-filled pipettes to a saline-filled Polythene tube closed at its other end
and subjecting the latter to mechanical blows.
This content downloaded from 130.132.123.28 on Sat, 3 May 2014 20:05:02 PMAll use subject to JSTOR Terms and Conditions

Electrophysiology of neuroglia 331
Intraeellular stimulation
Because of the small size of the cells and the large currents necessary, double-
barrelled electrodes were used (Coombs et al. 1955a) for simultaneous stimulating and recording, instead of separate electrodes or a single electrode. They were made
by fusing two tubes and then proceeding as for single-barrelled electrodes, and
about 10% of filled electrodes finally passed the rigorous selection procedures. Electrodes with resistance of each barrel between 20 and 80 MO and coupling resistance (Rc) less than 1 MO were first chosen, and then used to impale a few
cells. Of these a few were found in which the resistance in at least one barrel had
fallen to approximately 20 MO, and the coupling resistance (in the bath fluid) had
fallen to a stable value between 100 and 500 KO. It is possible that these changes reflected the chipping away of the lateral edges of one or both tips. They were
finally tested to select those which could pass the large currents required.
(a) Stimulus artifact (Coombs et al. 1955 a)
Double-barrelled electrodes have the disadvantage of a relatively large stimulus
artifact consisting of a transient due to capacitative coupling between the barrels
plus a d.c. component due to the 'coupling resistance' (Rc) of the fluid shared by the closely apposed tips.
(i) Coupling resistance. Rc of usable electrodes selected as above ranged from
100 to approximately 500 KO, measured in the saline of the bath. When the tip of the electrode was pushed into the culture, Rc increased to a variable extent.
In some cells, an indirect estimate of the maximum extra coupling resistance could
be obtained from that remaining at the peak of the dielectric breakdowns described
in part II (p. 342); this ranged down to 300 KO. Ideally, however, a direct measure?
ment of this is required, using a separate intraeellular electrode to monitor the
record obtained from the recording barrel of the double-barrelled electrode. Because
of the small size and instability of the glial cells, such measurements could not be
made on them, but a series of experiments using similar electrodes has been
performed on frog sartorius muscle fibres (T. Tomita & W. M. Wardell, in prepara?
tion). It was found that although a few individual electrodes and impalements had much larger increases in Rc on impalement than estimated above, most in?
creases were relatively small and stable, the mean increase for the ten electrodes
in the twenty-nine fibres of the series being indeed extremely close to 300 KO.
In the calculations of membrane resistance and voltage displacements in this paper,
Rc with the electrode intraeellular has therefore been taken as the value of RG in the bath fluid after withdrawal, plus 300 KO. Since the mean membrane resis?
tance was approximately 10 times Rc, small errors in the latter were not serious, and the values given for membrane resistance and voltage displacements are
unlikely to be grossly wrong. (ii) Transients. The capacitative artifact obscured the initial 5 ms or so of the
voltage record. In most cases this did not affect the interpretation of the result and
so was ignored.
This content downloaded from 130.132.123.28 on Sat, 3 May 2014 20:05:02 PMAll use subject to JSTOR Terms and Conditions

332 W. M. Wardell
(b) Current measurement
The stimulating voltage source (a 100 V battery switched by a transistor flip-flop circuit) was earthed at one end, the indifferent electrode of the voltage-recording system being either earthed or connected to a floating electrode in the bath. The other end of the voltage source was connected through a high-value resistance
(either 100 or 1000 MO) to a current-measuring resistor (either 1-0 or 10 MO) which in turn was connected directly to the Ag/AgCl wire dipping into the electro?
lyte of the stimulating barrel. The voltage drop across the current-measuring resistor was amplified by a pair of cathode followers similar to those recording the membrane potential and displayed on the second channel of both Tektronix
oscilloscopes. Some difficulty was experienced due to the fact that at high currents
Table 2. Solutions of drugs prepared for electrophoresis
drug molarity pH 5-hydroxytryptamine ereatinine 0-04 3-3 sulphate (Koch-Light Labs. Ltd)
adrenaline, B.P. (Burroughs 1-0 3-0 (adjusted with HC1) Welleome and Co.)
L-noradrenaline bitartrate 0-4 3-1 (Koeh-Light Labs. Ltd)
acetylcholine bromide (B.D.H. Ltd) 3-0 3-6 L-glutamie acid (B.D.H. Ltd) 2-0 8-2 (sodium salt;
neutralized and adjusted with NaOH)
the resistance of the stimulating barrel of many electrodes increased, thus putting a larger common mode signal into the recording system and at times exceeding the
rejection capability of the Tektronix differential amplifiers, making the current
recording erratic, non-linear and asymmetrical. In some cases this could be over? come by some combination of increasing the series resistor or the current-recording resistor, or by attenuating the whole signal before feeding it into the Tektronix. Otherwise the records were rejected.
(a) By electrophoresis Application of drugs
The drugs were made up in nearly saturated aqueous solutions as described by other workers (Krnjevic, Mitchell & Szerb 1963; Krnjevic, Laverty & Sharman
1963; Curtis, Phillis & Watkins i960) and if necessary adjusted to the required pH; they were then used to fill micropipettes of 1 /xm tip diameter. Currents of the
appropriate polarity were passed and measured using the same circuit as for the
current-passing barrel of double-barrelled micro-electrodes, the maximum current
being from 1 to 5 x 10~7A, which was passed in the longest cases for 10 s with the
tip of the pipette almost touching the cell membrane. To minimize the possibility that technical errors were responsible for the nega?
tive results obtained, each drug solution was made up twice, using a different
ampoule of the drug each time; at least five cells were tested with each of two
pipettes from each batch of drug solution; and with each pipette the current was
passed in the 'wrong' direction while testing a few cells.
This content downloaded from 130.132.123.28 on Sat, 3 May 2014 20:05:02 PMAll use subject to JSTOR Terms and Conditions

Wardell Proc. Boy. Soc. B, volume 165, plate 47
Bk'.r ~, >. ?C?&>h
Figure 2 a. Low-power view of part of a typical culture, showing the dense, bevelled and marginal (including single-celled) zones. (Culture of 4-day-old rabbit cerebellum, after 5 days in vitro.) A cell in the single-celled layer is impaled by the recording electrode (right) while the stimulating electrode enters from the left. Scale =100 /mi.
Figure 26. Glial cell in the marginal zone of a 6-day culture of 4-day-old rabbit's cerebellum. It is impaled by the recording electrode entering from the right, while at the left is the stimulating electrode. The magnification at which both the experiments and the photo? graphs were made was x 640. Scale =10 fim. Phase-contrast optics.
(Facing p. 332)
This content downloaded from 130.132.123.28 on Sat, 3 May 2014 20:05:02 PMAll use subject to JSTOR Terms and Conditions

Wardell Proc. Boy. Soc. B9 volume 165, plate 48
Figure 2 c. Glial cell from the single-celled layer of a 5-day culture. Other details as for figure 26.
Figure 2d. Glial cell from the single-celled layer of a 7-day culture. Other details as for figure 26.
This content downloaded from 130.132.123.28 on Sat, 3 May 2014 20:05:02 PMAll use subject to JSTOR Terms and Conditions

Wardell Proc. Boy. Soc. B, volume 165, plate 49
Figure 2e. A large mesodermal cell, lying in a sheet containing many others, is impaled by the recording electrode entering from the right. The stimulating electrode enters from the left. This sheet of mesodermal cells occurred at the edge of the same culture as illustrated in figure 2c. Other details as for figure 26.
This content downloaded from 130.132.123.28 on Sat, 3 May 2014 20:05:02 PMAll use subject to JSTOR Terms and Conditions

Electrophysiology of neuroglia 333
(b) By injection
Each of the drugs was added to Hanks's solution in a concentration of 30 mM
and applied (within 1 h of this) by injection through a micropipette of 20 ftm tip
diameter, 10 jxm from the cell membrane. At least 10 cells were tested with each
drug.
RESULTS. PART I
General properties of cells in the cultures
Morphology
After 24 h in vitro, cells began to migrate from the dense explant to form a less
dense bevelled zone around it, and a marginal zone farther out in which single cells
were easily visible (figure 2a, plate 47). Membrane potentials could be obtained
by pushing the electrode into any part of the culture, but only in the marginal zone could single cells be reliably distinguished visually, and so most of the experi? ments were performed on cells in this part of the culture (figures 2b-d, plates 47, 48),
although these cells gave the least stable resting potentials. In some cultures, mesodermal cells were present, either growing in sheets (figure 2e, plate 49) or as
round, motile macrophages. They were presumably derived mainly from the
meninges, and could be almost completely eliminated from the cultures by
choosing the youngest animals and carefully dissecting off the meninges (Lumsden
1956, p. 142). These mesodermal cells were used as controls in some experiments.
Identification of neuroglial cells
Neuroglial cells can retain their morphological characteristics in tissue culture
for several weeks, and the criteria for identifying them are ultimately based on
this fact. In addition, their tissue culture appearances have been further character?
ized by dynamic studies (including cinematography) of gliomas and of purely
glial areas of brain. The following interpretation of the phase-contrast appearance is based on the accounts of Costero & Pomerat (1951), Pomerat & Costero (1956) and Lumsden (1956, 1963).
Identifying glia among the migrated cells involved firstly distinguishing glia from mesodermal elements and secondly distinguishing glia from nerves. The first
step was easy, since glia migrated as patches of cells of uniform type. The cell
bodies were globose or angular and often glowing, with thin processes arising
acutely or conically from the bodies, forming apparently anastomosing networks.
Such patches contrasted sharply with the areas of large spindle-shaped mesodermal
cells with dull cytoplasm. Intermediate forms were excluded from the results.
The second step was more difficult because it is probable that some of the smaller
nerve cells migrate with the glial cells and may eventually become indistinguish? able from them. Doubtful cells, including the occasional obviously polarized elements, were excluded and only cells from the anastomosing networks were included in the results. Any remaining error is unlikely to be serious because in
the migrating zone of the tissue cultures, the earlier and faster migration of the
This content downloaded from 130.132.123.28 on Sat, 3 May 2014 20:05:02 PMAll use subject to JSTOR Terms and Conditions

334 W. M. Wardell
glia tends to enhance the initial numerical preponderance of these cells, particu?
larly in the short-term cultures employed here. In common with Lumsden (1956) and Hild & Tasaki (1962) no attempt was made to distinguish between astrocytes and oligodendrocytes.
, v T L 7 .t.t Membrane potentials (a) Instability
r
In common with Hild et al. (1958) it was found that the membrane potentials were very poorly maintained. In most cells and particularly in small isolated ones, the recorded potential decayed rapidly after impalement, reaching a value of
?10 mV in less than one minute. The reasons for this are not entirely clear, but
it was probably due in large part to chloride leakage from the electrode tip
(Coombs et al. 1955&), plus short-circuiting and leakage at the site of impalement. This extreme instability of the membrane potential of most cells made it im?
possible to perform experiments lasting more than a few tens of seconds on single cells. The analysis of the 'glial response' was thus a trying technical task and one
difficult to express in rigorously quantitative terms, although the results were
qualitatively unequivocal. Single cells could be impaled long enough to examine
the effect of electrophoretically applied drugs but not long enough to change the
bathing solution, so that to study the effect on the membrane potential of changes of the ionic medium, a sampling method was used.
(b) Criteria for accepting membrane potentials
Although in all cells the membrane potential ultimately declined, 18% under?
went an initial 'sealing-in' hyperpolarization (Draper & Weidmann 1951; see
figure la). Thus in the sampling experiments, the problem arose of deciding at
which point the recorded potential was the best measure of the resting potential of the intact cell. Criteria had therefore to be devised which did not exclude delicate
cells with normally rapidly declining membrane potentials, yet did exclude both
frankly damaged cells and the mechanoelectric artifacts associated with the
impalement. The following criteria were chosen in an attempt to satisfy these
conflicting requirements: The potential 0-5 s after a sharp fall from the baseline was taken to be the mem?
brane potential, provided that:
(i) It did not decline by more than 10% during the next 2 s.
(ii) On withdrawing the electrode a few microns or pushing it further, the poten- tional rose sharply to within 3 mV of the baseline,
(iii) If the cell showed the 'sealing-in' hyperpolarization, the largest potential attained was taken,
(iv) Potentials smaller than ? 5 mV were not accepted because they could not
be distinguished from the artifacts associated with tip potentials and
mechanical effects.
In those experiments involving the analysis of the glial response, a much longer- term stability was required; suitable cells could be found in which the membrane
potential remained constant up to several minutes, but this inevitably involved
some selection of cells for these experiments.
This content downloaded from 130.132.123.28 on Sat, 3 May 2014 20:05:02 PMAll use subject to JSTOR Terms and Conditions

Electrophysiology of neuroglia 335
(c) Accuracy
Because of the high resistance of the electrodes and the presence of the plasma clot it was necessary to accept tip potentials of up to ? 20 mV. From Adrian's
(1956) data, this may mean that individual membrane potentials have been made
too small by up to 10 mV. The wide scatter and low mean of the membrane potentials, seen in figure 3, is
probably due largely to cell damage and the tip potential. One cannot evaluate
the extent of this error however, since no comparable figures exist for glial cells
in the intact mammalian brain.
30i
20
bX)
10
0 -5 -10 -20 -30 -40 -50 -60 -70
membrane potential (mV)
Figure 3. Histogram showing the frequency distribution of the membrane potentials of 100 glial cells from four cultures. The arrow marks the mean value, 31-0 mV? 1-9 mV.
Although the frequency distribution of membrane potentials was skewed
(figure 3), the statistical tests were calculated on the assumption of a normal
frequency distribution. In this paper, all mean values are followed by the value of the standard error and the number of observations. No attempt was made to
apply corrections for the skewness, for improvement in the accuracy of the results and of these tests would depend largely on the availability of improved technical
methods of recording the delicate membrane potentials.
(d) Membrane potentials of different cells from various areas of the cultures
(i) Fibroblasts and mesenchymal cells (figure 2e, plate 49). These were the largest cells, the easiest to impale, and had the most stable resting potentials. The mean
resting potential was ? 27-4 + 1-1 mV (n = 75). They were used as controls in the
experiments of Part II of the results, where further details are given. (ii) Macrophages. These were difficult to impale because of their mobility and
tendency to adhere to the electrode. Their membrane potentials ranged from ? 5 to ? 15 mV, agreeing with the values found by Hild & Tasaki (1962), with a mean of 9-3 + 0*56 mV (n = 30). They were also used as controls in the experiments of Part II.
(iii) Nerve cells. In the short-term cultures used in this study, there was not
enough time for the glial cells to migrate sufficiently to expose the large sedentary neurons in a manner suitable for impalement under visual control. It is possible,
This content downloaded from 130.132.123.28 on Sat, 3 May 2014 20:05:02 PMAll use subject to JSTOR Terms and Conditions

336 W. M. Wardell
as discussed earlier, that some of the smaller neurons migrated and were mistakenly identified as glia, but no action potentials were ever seen in migrated cells. On the
other hand, when the electrode was thrust blindly into the depths of the dense
central zone of the culture, many large (up to ? 70 mV) stable resting potentials were encountered. On examining these at fast sweep speeds, some were found to
show one injury discharge (a non-overshooting action potential lasting 5 ms) 5 ms
after the impalement. These cells were not studied systematically but the results
were sufficient to show that at least some of the neurons in these cultures, like
those in the experiments of Grain (1956) and Hild & Tasaki (1962), retained the
ability to fire action potentials.
(iv) Glial cells. In general the larger and more closely packed cells had larger and more stable membrane potentials than smaller isolated cells, but no sharp
dividing line could be drawn on morphological grounds between these two groups, and no obvious differences were seen between the electrical behaviour of any of
the morphological types of glia, in agreement with the findings of Hild & Tasaki
(1962). In cultures where the ependyma had been included, cilia remained beating for at least 4 h. The membrane potentials of these ependymal cells were within the
range of those of the other glia, and no fluctuations were observed accompanying the ciliary activity.
All subsequent experiments were performed on cells in the marginal and
bevelled zones, where cell outlines could be distinguished under phase contrast.
(e) The mean and frequency distribution of glial cell membrane potentials
One hundred glial cells were impaled as described above, twenty-five from each
of four different cultures from two different animals after 5 to 6 days in vitro. The
potentials ranged from 5 mV (the lowest accepted) to 65 mV, with a mean of
31*0 + 1-9 mV (n = 100). The frequency distribution, as shown in figure 3, was
skewed. The means of each of the four cultures were
26*6 ? 2*9 mV (n = 25) 33*3 ? 2*9 mV (n = 25) 31*3 ? 2*9 mV (n = 25) 32*6 ? 2-3 mV (n = 25)
The difference between the means of these four cultures could be due either to
significant differences between cultures, or to variations between random samples from a common population. To distinguish between these two possibilities an
analysis of variance was made (Snedecor 1956, ch. 10). The variance ratio, F, was
1*17, compared with the theoretical value of 2*70 for the 5% level. Thus, random
sampling variations from a common population would be sufficient to explain the
differences between the means of these four cultures. This finding is used in the
next section.
The effect of altered external potassium and chloride ion concentration
on the resting potential of neuroglial cells
The following experiments were designed to test whether the membrane poten? tial of cultured neuroglial cells depends largely on the concentration gradients of
potassium and chloride ions, or whether some totally different mechanism might
This content downloaded from 130.132.123.28 on Sat, 3 May 2014 20:05:02 PMAll use subject to JSTOR Terms and Conditions

Electrophysiology of neuroglia 337
be involved. Apart from its intrinsic interest, this question arose because of a
suggestion by Katzmann (i960) that some or all glial cells might act as a 'functional
extraneuronal space' by containing high concentrations of sodium ions instead of
potassium. To examine the question fully was beyond the scope of the method, but it was possible to test whether the membrane behaved as a potassium elec?
trode, in which case the cell would be unlikely to contain sodium as the main
intraeellular cation.
First, a solution of 150 mM KC1 was injected through a micropipette of 20 ^m
tip diameter, 20 ^m from the membrane. The cells were depolarized reversibly by this procedure, in a typical case a membrane potential of ? 50 mV being reduced
to ? 27 mV with complete recovery on cessation of the injection. The half-times
of the depolarization and repolarization were approximately 10 s, but since the
rate of change of ion concentration was unknown, the rate of onset of the action, and the possible existence of diffusion barriers, could not be determined.
Secondly, 100 mM/1. of extra KC1 was added to the bath fluid, membrane poten? tials being sampled before and after the addition. Again the qualitative effect was
clear: all membrane potentials were reduced to smaller than ? 10 mV. But in this
solution many of the cells became retractile and obviously damaged, and on
returning to the normal bathing fluid the recovery of membrane potentials was not
complete. Thirdly, therefore, solutions having a constant [K+] x [Cl~] product (Boyle &
Conway 1941; Hodgkin & Horowicz 1959) were used, with K+ concentrations
ranging up to 20 times normal (see 'Methods'). Recovery after immersion in these
solutions was complete: there was no significant difference (P > 0*5) in the mean
membrane potential of a sample of 25 cells before and after immersion for 30 min
in the highest potassium concentration used, 114 mM.
Four different potassium concentrations were used, one on each of the four
different cultures described in the section above. As the potassium concentration
was raised, so the cell membrane potential was reduced (figure 4). From the graph it can be seen that above a potassium concentration of 28 mM, the relation became
linear and attained its highest slope of 27 mV per tenfold change of external
potassium ion concentration.
This depolarizing effect of raised potassium concentrations in the presence of
lowered, normal and raised chloride concentrations makes it unlikely that Katz-
mann's hypothesis applies to the glial cells in this situation. The finding is similar
to that seen in glial cells of the leech, Hirudo medicinalis by Nicholls & Kuffler
(1964), except that the slope determined here is smaller. This difference could
result from the tendency of the selection criteria for membrane potentials (de? scribed above) to underestimate higher mean values relatively more than lower
ones.
The lack of effect of some drugs of physiological interest
The following substances were applied by both electrophoresis and injection as
described in 'Methods': acetylcholine, adrenaline, noradrenaline, 5-hydroxy?
tryptamine and sodium glutamate. In addition, barium ions were applied by
injection.
This content downloaded from 130.132.123.28 on Sat, 3 May 2014 20:05:02 PMAll use subject to JSTOR Terms and Conditions

338 W. M. Wardell
At least ten glial cells from two cultures were tested with each method of apply?
ing each drug. In no case was any effect on the membrane potential observed.
One must be wary about concluding from these experiments that all glial cells
in tissue culture are insensitive to any of these drugs. Because of the extreme
technical difficulty of applying the drugs close enough to the cell membrane while
holding the cell impaled, only those cells with large and well maintained membrane
potentials could be used, and in any case only gross, rapid changes in membrane
potential could have been detected.
Or
%
? -p ?
03
-10
-20
-30
I _L 57 14-2 28-5 57 114
external potassium concentration (uim)
Figure 4. Effect of raised external potassium concentration on membrane potential. (Solu? tions of constant [K+] x [Cl~] product.) Left-hand point is the mean of 100 cells from four cultures, ? the mean of the standard errors from the four cultures. Each remaining point is the mean, + s.e., of 25 cells from one culture.
RESULTS. PART II
Analysis of the 'response' of single neuroglial
cells in vitro to electrical stimulation
1. Present knowledge of the properties of the response
Hild et al. (1958) described an 'electrical response' of neuroglial cells in vitro
following electrical stimulation. In further papers (Tasaki & Chang 1958; Hild &
Tasaki 1962; Hild et al. 1965) this finding was confirmed and similar phenomena were observed in the intact brain and in cortical slices. This Part is concerned with
confirming the existence of the response in vitro and determining its mechanism; and with examining whether the same mechanism could account for the pheno? mena in the intact brain and in cortical slices.
Hild et al. (1958) impaled single glial cells with recording microelectrodes under
direct visual control at a magnification of x 600, and placed the tip of a second
pipette (having a diameter of 5 to 15 jicm and filled with the saline solution bathing the cells) within about 15 jim. of the cell membrane. When current pulses of 10 to
50 jitA lasting approximately 1 ms (range 0-2 to 20 ms) were passed through the
This content downloaded from 130.132.123.28 on Sat, 3 May 2014 20:05:02 PMAll use subject to JSTOR Terms and Conditions
Electrophysiology of neuroglia 339
extracellular pipette, a transient reduction of membrane potential could be pro? duced provided that the initial resting potential was greater than 15 to 20 mV.
The abrupt depolarization (figure 5) was followed by a slow return to the resting state, the \\e decay time being approximately 4 s at 27 ?C. It is this abrupt
depolarization with slow return to the resting state which was called by Hild
et al. (1958) the electrical response of neuroglia. Several other properties of the response were described (Hild et al. 1958; Hild &
Tasaki 1962; Hild et al. 1965): it was not affected by cooling the cells to room
temperature; it could be produced by both anodal and cathodal current pulses, and in certain situations cathodal pulses were the more effective; it could be made
to summate if the stimuli were spaced closely enough; 'on several occasions a
strong but reversible suppression of the response of the glia cells' was demon?
strated with 0*1% cocaine or 2% urethane (Hild et al. 1958, p. 221); it appeared to be a specialized property of neuroglial cells, including ependymal cells, since
it could not be elicited in macrophages growing in the same culture, although it
resembled very closely the 'electric response' of the slime mould described by Tasaki & Kamiya (1950).
Two further papers provided evidence which suggested that the glial response occurred also in the intact brain and was not restricted to cells growing in tissue
culture; Tasaki & Chang (1958) showed that similar responses could be obtained
from otherwise inexcitable (and hence possibly glial) cells in the cat's brain in vivo
following massive extracellular stimulation; and Chang & Tasaki (in Hild &
Tasaki 1962) showed that if currents were passed through slices of cat's cortex,
they elicited a fall of impedance having the same time course as the glial response. Later it was also shown (Chang & Hild 1959) that the glia in tissue culture respon? ded to such electrical stimulation with a slow contraction (time to peak = 5 min).
Before proceeding with the experimental analysis it is necessary to examine
carefully the attempts which have been made to explain these phenomena. Hild et al. (1958) concluded that the response in vitro was due to 'a mechanism
similar to that of the nerve or muscle fibre membrane'.
If the glial response is indeed a regenerative response of this type, a number of
questions arise calling for closer examination:
(a) How does the response come to be graded, with no threshold?
(b) How can it be elicited by both cathodal and anodal currents?
(c) How does its similarity to the effect of mechanical stimulation of the slime
mould and other cells arise ?
(d) How does its similarity to ' dielectric breakdown' arise ?
These questions will be considered in relation to the relevant literature. The
interesting points which emerge suggested the plan of the experimental analysis.
(a) The graded nature of the response with absence of threshold
In principle (Hodgkin 1951) a graded response could arise either by a graded area of membrane responding or by graded activity in a given area of membrane.
Hild & Tasaki have suggested in different papers that each of these two possible mechanisms might be responsible for the graded nature of the response. Hild et al.
This content downloaded from 130.132.123.28 on Sat, 3 May 2014 20:05:02 PMAll use subject to JSTOR Terms and Conditions

340 W. M. Wardell
(1958) suggested that part of the membrane undergoes a regenerative response, but that 'the interaction between the "responding" and the resting area of the
membrane is not strong enough to cause restimulation of the resting area by the
electric current arising from the responding area'. An increased stimulus strength was supposed to act by increasing the area of responding membrane. On the other
hand, Hild & Tasaki (1962) likened the graded responses to those seen in nerve
and muscle fibres which had been injured or heavily narcotized. There is so far no
evidence to allow the relative contribution of each of these proposed mechanisms
to be assessed; indeed, apart from Hild et al.'s (1958) passing mention that 'on
several occasions a strong but reversible suppression of the response of the glia cells was demonstrated' with 0-1 % cocaine or 2% urethane, there is no evidence
that an active response is involved at all.
(b) The fact that the response can be elicited by both anodal and cathodal currents
One could postulate either that cathodal shocks caused a response of the mem?
brane nearest the electrode while anodal shocks caused a response of the mem?
brane furthest from the electrode; or that anodal shocks caused the membrane
nearest the stimulating electrode to undergo anodal-break excitation.
These explanations all suffer from the fact that no measurements have been
made of the transmembrane voltages reached while the stimulating currents were
being passed, so that there is no evidence even that the effective stimulus is in fact
depolarization of the membrane. Indeed, the only evidence available suggests that
the membrane is conventionally inexcitable: Hild & Tasaki (1962), passing trans-
membrane currents via a second intraeellular electrode, found that the current-
voltage relation in glial cells was approximately linear for current in both directions
up to a displacement of about 20 mV. From their records there is no evidence that
depolarizing current left any persistent depolarization such as would be expected if the glial response were similar to that of other excitable tissues; following a
depolarization of approximately 10 mV, the membrane voltage had declined to
the initial level within 2 ms of the end of the current pulse. Since Hild & Tasaki
depolarized the cell by 20 mV and did not report the slowly returning glial
response, then either the response does not normally appear until the cell is
depolarized still further, or depolarization is not the factor usually causing the
response.
(c) The resemblance of the glial response to the effect of mechanical stimulation on the
slime mould and the lobster giant axon
Hild et al. (1958) noted that the response of glial cells resembled that of the
slime mould Physarum polycephalum studied by Tasaki & Kamiya (1950). In the
latter experiments, a strand of the plasmodium was suspended from three elec?
trodes spaced along its length. Stimulating currents were passed between the
centre electrode and one end electrode; and voltage changes were recorded between
the common centre electrode and the other end electrode. The 'response' to
stimulating currents recorded by the centre electrode was an abrupt negative-
This content downloaded from 130.132.123.28 on Sat, 3 May 2014 20:05:02 PMAll use subject to JSTOR Terms and Conditions

Electrophysiology of neuroglia 341
going step (which can now be further specified as a depolarization of the mem?
brane, since Tauc (1954) showed that the mean membrane potential in the same
cells is 80 mV, inside negative) followed by a slow, roughly exponential decay with a time constant of 1 to 1*5 s. The 'response' was thus similar in sign, shape and
time course to the glial response. It could be elicited in two ways: most readily by
giving the membrane a light mechanical tap; but also by passing currents in either
direction across the membrane. Responses to mechanical and electrical stimuli
could summatewith each other, and the responses were graded and not propagated.
Accompanying the electrical 'response' and having the same time course, was a
change of impedance to 50 c/s a.c. (although the direction of the change was not
stated). There is no evidence in this paper concerning the ionic mechanism of the
depolarization nor the membrane voltage change needed to produce it; at this
stage it is sufficient to note that the response of neuroglial cells to electrical
stimulation does indeed resemble very closely the 'response' of the slime mould
to electrical and mechanical stimulation.
The effect of mechanical stimulation has, however, been analysed further in the
case of the giant axon of the lobster Homarus americanus in which mechanical
stimulation produced a depolarization very similar to that seen in the slime mould.
Julian & Goldman (1962) recorded the membrane potential of lobster giant axons
using the sucrose gap method. The part of the membrane from which the potential was being recorded was subjected to a brief mechanical blow by means of a crystal- driven stylus. (Tip diameter of stylus, 1 mm; excursion of stylus 10 /xm or greater; duration 0-5 to 10 ms.) This mechanical compression of the axon produced a
depolarization and increase of conductance which developed immediately, but
took several seconds to recover. The conductance increase was a direct result of the
mechanical stimulation, and did not depend on depolarization, for it occurred even
when the depolarization had been prevented by a hyperpolarizing current or by
voltage clamping. Julian & Goldman concluded that mechanical compression caused stretching of the membrane and hence an increase of ion permeabilities. Because the depolarization was reduced greatly by procaine (0-1%) and by sodium replacement, it appeared that the increase of permeability to sodium was
more important than that to other ions; but the fact that some depolarization still
remained after these procedures, and the large size of the conductance increase
accompanying the response, suggested that the permeability to other ions was
likely to be increased also.
In view of their electrical similarity, it is possible that the mechanically induced
depolarizations of both the slime mould and the lobster giant axon are due to a
similar mechanism: passive breakdown of the selective permeability of the mem?
brane at the point of stimulation, without the need for an intervening depolariza? tion. Furthermore, since the 'electrical response' of the slime mould is similar
in many respects to its 'mechanical response', one might ask whether the electrical
response itself were also passive. There is no direct evidence to answer this point, but the circumstantial evidence suggests that the 'electrical response' of the slime
mould could be an example of dielectric breakdown, the phenomenon reviewed
in the next section.
This content downloaded from 130.132.123.28 on Sat, 3 May 2014 20:05:02 PMAll use subject to JSTOR Terms and Conditions

342 W. M. Wardell
The point made in this section is that Hild et al.'s (1958) comparison of the glial
response with the response of the slime mould does little to support their conclu?
sion that the glial response is' similar to that of the nerve or muscle fibre membrane'.
If anything, it tends to refute that conclusion.
(d) The similarity of the glial response to 'dielectric breakdown'
A slowly-returning depolarization indistinguishable from the 'glial response' has been observed in other cells subjected to large transmembrane currents. It has
often been obtained in some voltage-clamp experiments where it was preceded by a fall of membrane resistance which has become known rather loosely as 'dielectric
breakdown'. There appears to be a common property of cell membranes that when
hyperpolarized to more than about 150 rnV, a delayed increase of membrane
conductance occurs. The ionic nature of the conductance change appears to vary in different cases, but is less specific than that underlying the well-known responses of nerve and muscle. After termination of the hyperpolarizing current the con?
ductance falls to normal over some seconds and may be accompanied by a depolari? zation of several millivolts having the same time course. The cells in which this
has been observed include peripheral nerve (Hodgkin 1947); Nitetta (Weidmann
1949); skeletal muscle (Fatt & Katz 1951); cardiac muscle (Weidmann 1951); mammalian spinal motoneurons (Coombs et al. 1955a, p. 299); amphibian spinal
ganglion cells (Ito 1957); Onchidium ganglion cells (Hagiwara & Saito 1959); and
Aplysia ganglion cells (Tauc 1955).
2. Questions to be answered experimentally
From the foregoing review of the literature, it will be seen that there is no firm
evidence to support the conclusion by Hild et al. (1958) and Hild & Tasaki (1962) that the '
response' of neuroglia is due to a regenerative mechanism similar to that
of nerve and muscle fibre membranes. The exact membrane voltage needed to
elicit the response has not been established, and neither has the existence of a
selective, regenerative increase in the sodium permeability of the membrane.
On the contrary, the ' response' is very similar to two other phenomena (which
might share some common mechanisms) occurring in a number of unrelated cells:
the increase of conductance, with slowly returning depolarization, which follows
mechanical distortion of the cell membrane; and ' dielectric breakdown' with or
without subsequent depolarization, following the imposition of a large trans-
membrane voltage. In the following experimental analysis of the glial response, attention has there?
fore been directed to three main questions:
(a) Is the glial response specific to neuroglial cells ?
(b) Is it in fact due to a regenerative, depolarization-activated increase of
sodium permeability?
(c) Is mechanical or dielectric breakdown of the membrane involved ?
This content downloaded from 130.132.123.28 on Sat, 3 May 2014 20:05:02 PMAll use subject to JSTOR Terms and Conditions
Electrophysiology of neuroglia 343
3. General description (summarized in table 3)
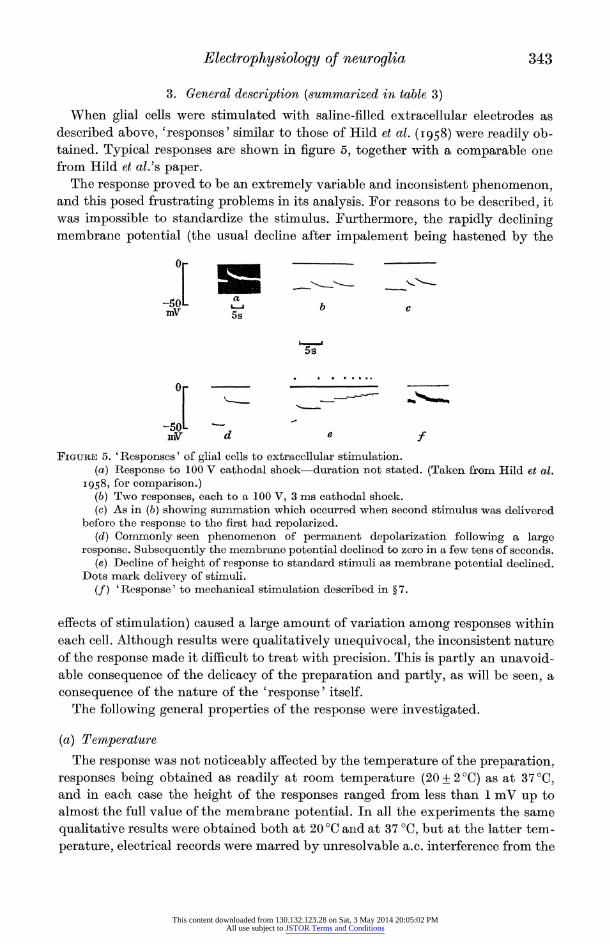
When glial cells were stimulated with saline-filled extracellular electrodes as described above, 'responses' similar to those of Hild et al. (1958) were readily ob? tained. Typical responses are shown in figure 5, together with a comparable one from Hild et aL's paper.
The response proved to be an extremely variable and inconsistent phenomenon, and this posed frustrating problems in its analysis. For reasons to be described, it was impossible to standardize the stimulus. Furthermore, the rapidly declining membrane potential (the usual decline after impalement being hastened by the
-50L ? ,
-50L -~ mV d e f
Figure 5. 'Responses' of glial cells to extracellular stimulation. (a) Response to 100 V cathodal shock?duration not stated. (Taken from Hild et al.
1958, for comparison.) (b) Two responses, each to a 100 V, 3 ms cathodal shock. (c) As in (b) showing summation which occurred when second stimulus was delivered
before the response to the first had repolarized. (d) Commonly seen phenomenon of permanent depolarization following a large
response. Subsequently the membrane potential declined to zero in a few tens of seconds. (e) Decline of height of response to standard stimuli as membrane potential declined.
Dots mark delivery of stimuli. (/) 'Response' to mechanical stimulation described in ?7.
effects of stimulation) caused a large amount of variation among responses within each cell. Although results were qualitatively unequivocal, the inconsistent nature of the response made it difficult to treat with precision. This is partly an unavoid? able consequence of the delicacy of the preparation and partly, as will be seen, a
consequence of the nature of the 'response' itself.
The following general properties of the response were investigated.
(a) Temperature
The response was not noticeably affected by the temperature of the preparation, responses being obtained as readily at room temperature (20 + 2?C) as at 37 ?C, and in each case the height of the responses ranged from less than 1 mV up to almost the full value of the membrane potential. In all the experiments the same
qualitative results were obtained both at 20 ?C and at 37 ?C, but at the latter tem?
perature, electrical records were marred by unresolvable a.c. interference from the
This content downloaded from 130.132.123.28 on Sat, 3 May 2014 20:05:02 PMAll use subject to JSTOR Terms and Conditions

344 W. M. Wardell
bath heater. For this technical reason the results obtained at 20?C are the ones used in this part.
(b) The stimulus
The effects of changing the stimulus parameters were studied by producing a
sequence of responses in a cell while changing one parameter progressively. The ' effectiveness' of the stimulus was determined from the size of the response it
produced compared with those before and after in the same cell.
(i) Distance. No responses were produced if the tip of the stimulating pipette was more than 30 ^m distant from the cell. As the tip was brought closer, the
effectiveness of the stimulus increased, becoming maximal when the tip actually touched the cell membrane.
(ii) Current strength and current density. No responses were obtained with
currents smaller than 5 jjlA. The effectiveness of the stimulus increased with
increasing current up to the maximum available, i.e. 75 /xA for a 2 MO stimulating electrode. But a large current alone was not sufficient; it was also necessary to have a small tip diameter. For a given applied voltage, a tip size of 2 to 10 ^m in dia?
meter was most effective. If the tip was then broken off to a diameter of, for
example, 30 fjan, no responses could be obtained with it, despite the fact that the
current increased greatly with the fall in electrode resistance. This suggested that
current density, as well as current strength, was an important factor determining the effectiveness of the stimulus. In a typical experiment, breaking the tip from
5 to 20 ^m diameter caused the current to increase from 50 to 210 //A, while the
calculated current density fell from 2-5 to 0-6 ^A/^m2, and the electrode became
ineffective.
(iii) Stimulus duration. Responses were seldom obtained with current pulses shorter than 1 ms unless the current was very large. The effectiveness increased with
increasing duration up to 20 to 50 ms; with longer duration, e.g. 500 ms, the stimuli
were even more effective, but the chances of damaging the cell became very high. (iv) Polarity. The response did not depend critically on the polarity of the
stimulus, since both anodal and cathodal currents were usually effective (figure 5). The results of changing the polarity of the stimulus were variable and rather
complex, involving both the stimulus and the response itself. Each time the
polarity was reversed, the effectiveness immediately increased several-fold and
then dwindled to its preceding level over the course of 10 pulses, although the
current remained constant throughout. A comparable effect was seen in the
amplitude of the mechanical pulse (see below) accompanying the current flow, and this seemed to be related to the fact that small particles inside the pipette, on reversing their direction of movement as the current reversed, appeared to
become jammed at each end of a limited traverse. This observation is important because it is the only situation which could be found in which the mechanical
and electrical parts of the stimulus could be separated to any useful extent. It is
considered again later. At present it is sufficient to note that following a reversal
of current, the current strength remained constant but the effectiveness of the
stimulus changed in parallel with the amplitude of the mechanical pulse.
This content downloaded from 130.132.123.28 on Sat, 3 May 2014 20:05:02 PMAll use subject to JSTOR Terms and Conditions

Electrophysiology of neuroglia 345
In an attempt to eliminate the grossest mechanical changes in the stimulus on
reversing its polarity, experiments were performed in which the current was re?
versed after each stimulus. Sixteen comparisons were made in four cells. In two- thirds (10) of the cases, cathodal pulses were more effective than anodal, while in the remaining third, anodal pulses were the more effective. Cathodal stimuli
ranged up to three times more effective than anodal, but anodal stimuli were
never more than 50% more effective than cathodal. It may be concluded that
cathodal stimuli were usually but not consistently more effective than anodal; a more precise comparison was prevented by the variable nature of both the
stimulus and of the response itself.
(v) The mechanical pulse accompanying the electrical pulse. As noted above, currents strong enough to cause a response also caused a brief but plainly visible
movement of small particles both inside and just outside the tip of the stimulating
pipette. The excursion of these movements ranged up to 20 jam in amplitude and
in many cases movement was transmitted to the cell membrane. Later it will be
shown that the phenomenon was a combination of electro-osmosis and electro?
phoresis. It is introduced at this point because it serves to define completely a
stimulus sufficient to produce a response: provided that the membrane potential was greater than ? 20 mV, a stimulus which produced a visible movement of the
cell membrane always produced a response. It was apparently not necessary for a
stimulus to cause movement of the membrane in order to produce a response, but
since the movements involved were sometimes at the limit of the optical resolution
available, it was not possible to be precise on the latter point.
(vi) Adoption of a standard stimulus. The following stimulus parameters were
thus chosen to give as far as possible a uniform, effective stimulus which would not
cause too much damage to the cell: (the importance of the last criterion is discussed
below). Electrode tips of 5 to 10 ^m diameter were placed (as nearly as could be judged)
5 to 10 jLtm from the cell membrane.
100 V, 3 ms cathodal pulses were delivered to the electrodes, the latter having
passed at least 20 cathodal pulses since the last change of polarity. These standard stimuli have been used in the first instance in the rest of this
study unless otherwise stated. They were by no means identical and were some?
times ineffective, in which case stronger stimuli had to be used.
(c) Cell damage at high stimulus intensities
The type of response described so far, in which the membrane potential returned
to the initial level, was typical only for small responses. As the intensity of the
stimulus (and hence the size of the response) was increased by any of the three
methods available (reduced distance, increased current, or increased duration) the
amount of repolarization usually became less. The effect of such stimulation was thus to accelerate the normal decline in the resting potential of the impaled cell. After very large responses the cell was likely to remain permanently depolarized
(figure 5d). Total, permanent depolarizations were always associated with frank damage to
23 Vol. 165. B.
This content downloaded from 130.132.123.28 on Sat, 3 May 2014 20:05:02 PMAll use subject to JSTOR Terms and Conditions

346 W. M. Wardell
the cell due to the mechanical pulse from the stimulating pipette. In severe cases
this ruptured the cell membrane allowing visible leakage of intraeellular granules into the bath fluid. But there was no clear dividing line between fully repolarizing
responses and total, permanent depolarizations; nor was there a clear dividing line between varying degrees of cellular damage. It is possible indeed that all
responses might have involved some degree of cellular damage.
Although the stimulus intensity was limited to produce only small responses,
complete repolarization seldom occurred and there were only a few instances out
of the hundreds of cells stimulated in which a sequence of three or more responses, each starting from the same initial membrane potential, could be obtained in
the same cell.
(d) Responses to repeated stimulation
If one stimulus produced a response, then provided that the membrane potential remained greater than ? 20 mV, subsequent identical stimuli delivered to the
same cell always produced responses. If a second stimulus was delivered before the
response to the first had repolarized, summation could be produced (figure 5 c).
Repeated stimulation greatly increased the probability of damaging the cell: it was
seldom possible to produce more than five responses in one cell before the mem?
brane potential declined irreversibly to a level of approximately 10 mV where
responses could no longer be produced (figure 5e). There was no detectable re?
fractory period following the response; the effect of reducing the interval between
two identical stimuli was indistinguishable from the effect of doubling the duration
of the first stimulus.
(e) The effect of membrane potential
The fact that the membrane potential of most impaled cells fell to near zero in
approximately 1 min (and more rapidly when stimulated) made it a simple matter
to study the effect of membrane potential on the height of responses, by applying standard testing stimuli at intervals during the decline. As the membrane potential declined, so did the height of the responses. A typical experiment is illustrated in
figure 5e, while in figure 6 the data from this and five other cells have been plotted to show the relationship between membrane potential and the height of the
response. Although the slope varied from cell to cell, the relationship was approxi?
mately linear, the height of the responses tending towards zero at a membrane
potential of between ? 20 and ? 5 mV. In eleven cells from three cultures the mean
membrane potential at which responses became zero (i.e. less than 1 mV) was
10-3 ? 1-1 mV.
(/) Existence of an absolute value of membrane potential limiting the maximum
positive excursion of the response
The amplitude of the response in any cell could not be increased indefinitely by
increasing the strength of the stimulus. Nor could the summation to rapidly
repeated stimuli proceed indefinitely. In both cases further increase in the height of the response was limited at a value of membrane potential between ?15 and
This content downloaded from 130.132.123.28 on Sat, 3 May 2014 20:05:02 PMAll use subject to JSTOR Terms and Conditions

Electrophysiology of neuroglia 347
? 5 mV. In the case of repetitive stimulation, a plateau occurred at a mean
membrane potential of 9-2 + 1-9 mV (n = 7). It was not possible to give a com?
parable 'mean maximum' figure for single responses because of the merging of
the largest responses with frank cellular damage. These observations, and those of the two sections immediately above, show that
there is an absolute level of membrane potential (mean value approximately ? 10 mV) limiting the maximum positive excursion of the response.
-40 -20 w 0 membrane potential at the moment before
stimulus was delivered (mV)
Figure 6. Decline of height of response with membrane potential. Records from six different cells in which standard stimuli were delivered at intervals while the membrane potential declined.
(g) The rising and repolarizing phases of the response
The exact time course of the rising phase was obscured by the unavoidable
stimulus artifact, lasting 5 ms, which accompanied the large stimulating currents. The rise was complete within this 5 ms period.
The extent of the repolarization was, as described above, variable and seldom
complete. Of the 61 % of responses which repolarized by more than half, the mean
half time was 1*5 ? 0*2 s (n = 25) (for cells from four cultures). The shape of the
repolarizing phase was also variable; it ranged from exponential (tested by re?
drawing on a semilogarithmic scale) to a straight line, while bizarre variations
were occasionally observed.
(h) Conclusions from the general description
The properties of the response are summarized in table 3. The main point emerg?
ing from this description is that with the high currents required, the method of
stimulating through saline-filled micropipettes had a powerful mechanical com?
ponent which could cause visible mechanical damage to the cells with the same
current strength as that needed to produce the response. At least three of the
23-2
This content downloaded from 130.132.123.28 on Sat, 3 May 2014 20:05:02 PMAll use subject to JSTOR Terms and Conditions

348 W. M. Wardell
properties of the response are indeed consistent with an explanation of its mech? anism in terms of mechanical breakdown of the membrane:
(i) The amplitude of the responses became zero at a mean membrane potential of approximately ? 10 mV, which is the likely value of the liquid junction potential between intraeellular and extracellular fluids, after allowing for the tip potentials present (Del Castillo & Katz 1954).
(ii) The repolarizing phase had a shape and time course similar to that of the ' sealing-in' phenomenon which followed the puncture of a membrane by a micro-
pipette (Part I and table 3).
Table 3. Summary of the general properties of the membrane potentials and responses of neuroglial cells
membrane potential 31-0 mV? 1-9 (n = 100) proportion showing post-impalement increase 18 % (n = 68)
amount of increase 8-0 mV+ 1-4 (n = 12) half-time of increase l-ls?0-2(n= 12)
proportion of responses which repolarized by more 61 % (n = 44) than half
highest amplitude of response observed 30 mV mean amplitude of responses 8-0mV?0-7 (n = 25) mean half-time of repolarization 1*5 + 0-2 s (n = 25) membrane potential at which responses failed 9-2 mV? 1-9 (n = 7)
during repetitive stimulation membrane potential at which responses failed 10-3 mV? 1*1 (n = 11)
during slow decay
(iii) In a situation where the mechanical pulse varied while the current did not
(that is, immediately following the reversal of polarity at the start of a train of
pulses) the effectiveness of the stimulus varied in parallel with the amplitude of the mechanical pulse.
Thus an important part of the remainder of the analysis is the determination of the significance of this mechanical effect, and whether other factors contribute to the response.
(4) Specificity of the response
Hild & Tasaki (1962) failed to obtain responses from macrophages growing in the same cultures, and concluded that the response was specific to glial cells. But since the macrophages had a membrane potential of ?5 to ?15 mV, this con? clusion does not take account of an earlier published observation (Hild et al. 1958, p. 221) (confirmed in this part, above) that 'no clear glial response was observed when the resting potential was less than 15 to 20 mV. Therefore, in the present series, control experiments were performed on HeLa cells and fibroblasts with
resting potentials greater than the value at which the response disappeared in
glial cells.
(a) Macrophages
The resting potentials of thirty macrophages in one culture of rabbit cerebellum
ranged from ? 5 to ? 15 mV; mean = ? 9-3 + 0*56 mV (n = 30).
This content downloaded from 130.132.123.28 on Sat, 3 May 2014 20:05:02 PMAll use subject to JSTOR Terms and Conditions

Electrophysiology of neuroglia 349
Twelve macrophages in two cultures were stimulated in the same manner as the
neuroglial cells using the same stimulating electrodes with which responses had
been obtained in the glia, and passing the maximum available currents. In two-
thirds of the cells, no sign of a response could be detected. In the remaining third, a
trace of a 'response' could just be distinguished from the stimulus artifact; but this
was never very clear, and in no case was the effect larger than 2-5 mV in amplitude.
(b) Fibroblasts
Fibroblasts and mesenchymal cells growing in the same cultures as the neuroglia were impaled and stimulated in the usual manner. Provided that the membrane
potential was greater than ?20 mV, 'responses' to standard stimuli were always
-50 mV
-50 mV
5s
d
Figure 7. 'Responses' to stimulation of fibroblasts and HeLa cells. (a) After the impalement, this fibroblast showed 'sealing-in'. On stimulation with a
3 ms cathodal pulse of 17 /xA there was a large 'response' which repolarized at approxi? mately the same rate as the sealing-in.
(b) Response of another fibroblast to a 3 ms anodal pulse of 20 //A. (c) Response of a HeLa cell to a 3 ms cathodal pulse of 22 /xA. (d) Responses of another HeLa cell to two 3 ms anodal pulses of 25 /xA. (e) The sealing-in phenomenon in a HeLa cell.
obtained. Sample records are illustrated in figure la, b and the numerical data are
summarized in table 4. Satisfactory impalements were made of seventy-five fibroblasts in five cultures. Forty per cent of thirty-two cells examined showed
sealing-in (figure 7 a) while the rest did not. Eighty-nine responses to stimulation
were obtained in twenty-one cells. Responses could be produced by both cathodal
currents (figure la) and anodal currents (figure 76). In 24% of the responses the
membrane potential failed to return half-way. Summation could be produced if
the stimuli were spaced closely enough. As observed with glia, if the membrane
potential fell to a certain low level either during repetitive stimulation or during the slow decline, the responses failed. The mean potentials at which failure
ocurred were 9*2 and 7-1 mV respectively.
This content downloaded from 130.132.123.28 on Sat, 3 May 2014 20:05:02 PMAll use subject to JSTOR Terms and Conditions

350 W. M. Wardell
(c) HeLa Cells
HeLa cells, grown in monolayers on plasma clots as described, were impaled and
stimulated in the same manner as the glial cells and fibroblasts. The same results
were obtained: provided that the membrane potential was greater than ? 20 mV,
'responses' indistinguishable from those in glia were always produced. The relevant
measurements have been set out in table 5 and sample records are illustrated in
figure 7c, d.
Table 4. Membrane potentials and 'responses' of fibroblasts
These measurements were made using the criteria applied to glial cells.
membrane potential 27-4 ? 1-1 mV (n = 15) proportion showing sealing-in 40 % (n = 32)
potential on impaling 18-3 ? 2-1 mV (n = 13) amount of increase 8-9 + 2-0 mV (n = 13) half-time of increase 2-5 + 0-44 s (n = 13)
proportion of responses which repolarized to more 76 % (n = 86) than half-way
highest amplitude of response observed 30 mV mean amplitude of response 9-4 + 0-76 mV (n = 67) half-time of repolarization 1-4 + 0-25 s membrane potential at which responses failed 9-2 + 0-46 mV (n = 9)
during repetitive stimulation membrane potential at which responses failed 7-1 + 0-61 mV (n = 6)
during slow decay
Table 5. Membrane potentials and 'responses' of HeLa cells
These measurements were made using the criteria applied to glial cells.
membrane potential 27-9 ? 0-88 mV (n = 154) proportion showing sealing-in 40 %
potential on impaling 20-4+ 1-24 mV (n = 61) amount of increase 9-0 + 0-87 mV (n ? 61) half-time of increase 0-8 ?0-071 s (n ? 61)
proportion of responses which repolarized to more 69 % (n = 86) than half-way
highest amplitude of response observed 35 mV mean amplitude of response 9-0 ? 1-6 mV (n = 22) half-time of repolarization 1-26 ? 0-15 s (n = 60) membrane potential at which responses failed 5-8 + 0-39 mV (n = 23)
during repetitive stimulation membrane potential at which responses failed 6-5 ? 0-71 mV (n = 14)
during slow decay
Satisfactory impalements were made of 154 HeLa cells in five cultures. Forty
per cent of these showed 'sealing-in' (figure le) while the rest did not. Eighty-six
responses were produced in thirty-one cells from three cultures. Responses could
be produced by both cathodal currents (figure 7c) and anodal currents (figure Id). In 31 % of responses the membrane potential failed to return half-way. Summation
could be produced if stimuli were delivered frequently. As with the glial cells and fibroblasts, if the membrane potential fell to a certain
low level either during repetitive stimulation or while the membrane potential was
This content downloaded from 130.132.123.28 on Sat, 3 May 2014 20:05:02 PMAll use subject to JSTOR Terms and Conditions

Electrophysiology of neuroglia 351
declining slowly, the amplitude of the response finally became zero. In two cells, both measurements could be made, and in each cell both failures occurred at the
same membrane potential: ? 7-0 mV in one cell and ? 9-0 mV in the other. The mean potentials at which failure occurred in the other cells were 5-8 and 6-5 mV
respectively.
(d) Other cells
Some brief preliminary experiments were performed on cultures of chick-
embryo skin tissue. Although a quantitative study was not made, it was found that
'responses' could readily be obtained from cells in this preparation also.
(e) Conclusions concerning the specificity of the response
The 'response' of fibroblasts and HeLa cells demonstrated here is indistinguish? able from that of glial cells. Both the response itself and the conditions needed to
produce it had the same characteristics as those of the neuroglia. The behaviour of the macrophages is similar to that of neuroglial cells having a membrane poten? tial of comparable magnitude.
The ' glial response' to extracellular stimulation is thus not specific to neuroglia,
but appears to be a general property of isolated cells.
(5) Tests for a regenerative sodium-carrier mechanism
The evidence supporting the conclusion of Hild et al. (1958) that the glial response is similar to that of nerve and muscle fibre membranes, is their finding that 'in
many cases the responses were reversibly abolished by 0-1 % cocaine or 2 % urethane solution'. In this section the possible existence of a regenerative sodium-
permeability change is tested in two ways: by observing the effects of sodium
replacement and anaesthetic agents; and of depolarizing and hyperpolarizing electrical stimuli.
(a) Sodium replacement and local anaesthetics
Two different substances were used in separate experiments to substitute for the sodium chloride in Hanks's solution: Tris (trishydroxymethyl amino methane) chloride, and sucrose. The exact compositions of the substituted solutions are described under 'methods'. The residual sodium ion concentration, determined by calculation and by flame photometric measurement of the actual bath fluid after the experiments, was less than 6 mequiv./l. Two different anaesthetics were used
(cocaine, 0-1%, and urethane, 2%) at concentrations in the bath sufficient to block conduction in peripheral nerve (Goodman & Gilman 1955; Tasaki, Mizu-
guchi & Tasaki 1948). In each of these four solutions the result of standard stimulation was the same:
responses of normal amplitude (ranging from less than 1 mV up to almost the full value of the membrane potential, with mean heights as shown in table 6) could be obtained as readily as in normal solutions. Examples are shown in figure 8.
This content downloaded from 130.132.123.28 on Sat, 3 May 2014 20:05:02 PMAll use subject to JSTOR Terms and Conditions

352 W. M. Wardell
Table 6. Mean height of glial responses to standard extracellular
stimulation in the four solutions used in ? 5 a
solution cocaine urethane tris sucrose
height of response 9-6?2-0mV (n = 11) 8'1 + 1-OmV (n = 20) 7-2?0-4mV (n = 25) 7-9?0-5mV (n = 20)
-50 mV
-501 mV
b
5s
JcXVX.
d
Figure 8. Glial responses to standard extracellular stimuli in experiments testing for the presence of a sodium-carrier mechanism. The composition of the bathing solution had been modified as follows:
(a) Contained 0-1 % of added cocaine hydrochloride. (b) Contained 2 % of added urethane. (c) Sodium ion concentration reduced to less than 6 mequiv./l. by replacement with
tris. (d) and (e) Sodium ion concentration reduced to less than 6 mequiv./l. by replacement
of NaCl with sucrose. (In (e) dots have been added to mark the top of each excursion in the original record.)
The only clear difference in the nature of the response occurred in the case of cells in the sucrose solution, in which an early brief positive-going phase was frequently (but not always) superimposed on the normal, slower component (figure 8 e). This early component could be made to summate and was not an electrical artifact since it was not present in control experiments with the recording electrode extracellular. The early component was not analysed further since the main point of interest was that the response was not abolished in the sucrose solution. It is possible that it was due to the altered ionic strength of the bathing solution, or the altered chloride equilibrium potential across the cell membrane, in both of which respects the low- sodium sucrose solution differed from the low-sodium tris solution.
Whether the height of the responses, or the proportion of cells responding, was
affected at all was a more difficult question to answer because, as discussed earlier, the extremely variable nature of the response required that the stimulus be maxi?
mized to a certain extent for each cell. No clear effect either on the height of the
response (table 6, compare table 3) nor on the proportion of cells responding, could
be observed, but this finding should be interpreted cautiously since it is doubtful
whether the method would reveal a reduction even as large as 50 %. Qualitatively, however, the result was unequivocal: responses were not abolished, nor even
detectably reduced, in these bathing solutions.
This content downloaded from 130.132.123.28 on Sat, 3 May 2014 20:05:02 PMAll use subject to JSTOR Terms and Conditions

Electrophysiology of neuroglia 353
(b) The effect of relatively small changes of transmembrane voltage
If the response in glia is regenerative like that in other excitable tissues, then it
should be evoked by a depolarizing stimulus, or by the termination of a hyper-
polarizing one. Hild & Tasaki (1962), using separate intraeellular polarizing and
recording electrodes to polarize up to 20 mV from the resting potential in either
direction, found that the membrane of cultured neuroglial cells showed no rectifi?
cation, and no sign of a response was reported. In the present experiments using double-barrelled electrodes, once a cell had
been impaled and a membrane potential was being recorded, square-wave current
pulses were passed through one barrel of the pipette while voltage-changes were
recorded through the other. Current and voltage were each recorded simultaneously on two separate recording systems (one using moving film and the other a swept time base) at appropriate amplifications.
.v^. 50mVl
I 10~7A[ _
V2 a 500 r mVL
|W is
Y 3-8 3-8 2-5 1-4
Figure 9. Production of 'responses' by dielectric breakdown. Cultured glial cell, intraeellular recording and stimulation through double-barrelled micropipette of 250 KQ coupling resistance. Trace Vt is high gain, low-speed recording of membrane potential to show responses. Traces i" and V2 are simultaneous recordings, at higher speed, of current and membrane voltage (the latter at much lower gain than Vx) during the stimulus. Dashed rise and fall strokes have been added. Numbers at the bottom give the membrane resis? tance, in megohms, 100 ms after the beginning of each stimulus. During the first two stimuli (marked by gaps in the Vx record) in which the membrane voltage is changed by 38 mV, the input resistance is relatively high, remains constant during the pulse, and no responses are produced. During the remaining two stimuli, in which the current is 13 times as great, the resistance falls during the first 100 ms and 'responses' are produced.
Using pulses ranging in duration from 5 to 500 ms and longer, it was found that
the membrane potential could be displaced up to 200 mV in either direction with?
out producing any sign of a response. Particular attention was paid to the effects
of the shorter (e.g. 25 ms) depolarizing pulses, and (in view of the possibility of
anode-break excitation) to the longer (e.g. 300 ms) hyperpolarizing pulses. Over
200 pulses in 70 cells were studied in this way, and no responses were ever obtained
to displacements smaller than 200 mV in either direction. Figure 9 (first two pulses) illustrates the lack of effect of two of the longer pulses which displaced the mem?
brane potential by 38 mV in each direction.
(c) Input resistance of glial cells
(i) Time dependence. With voltage displacements smaller than ?150 mV from
zero in either direction, the membrane voltage change produced by a square
This content downloaded from 130.132.123.28 on Sat, 3 May 2014 20:05:02 PMAll use subject to JSTOR Terms and Conditions

354 W. M. Wardell
current pulse was (within limits of approximately 20%) square. The first 5 ms
of the pulse was usually obscured by the stimulus artifact, but apart from this the
input resistance was thus found to be not time-dependent. (ii) Voltage dependence. In some cells the resistance to outward currents was
greater than that to inward currents, but the majority of cells did not show this, and when present the difference was usually less than 20%. Within the limits of
error of these experiments, therefore, the input resistance in the range ? 50 mV
from the resting potential was found to be not voltage dependent. The results of
one of these experiments are given in figure 10.
current (10~8A)
Figure 10. V/I relationship in one cell. Potentials recorded at the end of 100 ms current pulses. Points (O) obtained with electrode intraeellular, recording a membrane poten? tial of 50 mV. Points ( ?) obtained on withdrawing electrode from cell. Coupling resis? tance = 130 KO, Total resistance with electrode intraeellular = 1-64 MQ. Therefore corrected membrane resistance = 1*2 MQ,.
Although the input resistance in these experiments was thus found to be neither time nor voltage dependent, it should not be assumed that this necessarily repre? sents the behaviour of the cell membrane itself. As Noble (1962) has shown, in
some experimental situations of complicated geometry, the geometry of the
membrane can to a large extent mask real non-linearities of the membrane
resistance.
(iii) Value of input resistance. The value of the input resistance (determined from
the voltage-current relationship after correction for the coupling resistance as
described under 'Methods') was determined in sixty-two cells from four cultures. The resistance ranged from 0-5 to 10-5 MO (mean = 4-2 ?0-35 MO). The larger
This content downloaded from 130.132.123.28 on Sat, 3 May 2014 20:05:02 PMAll use subject to JSTOR Terms and Conditions

Electrophysiology of neuroglia 355
cells with high, well-maintained membrane potentials tended?as might be
expected?to occupy the lower part of this range.
(d) Conclusions concerning the existence of a regenerative sodium-carrier mechanism
The lack of effect of these intraeellular stimuli, together with the lack of detect?
able effect of anaesthetics and sodium substitutes showed that the glial response did not involve a conventional depolarization-dependent, regenerative sodium-
carrier mechanism. The glial cell membranes were indeed electrically passive, and
thus resembled those of the leech Hirudo medicinalis studied by KufHer & Potter
(1964). (6) Production of the 'response' by dielectric breakdown
In experiments using double-barrelled electrodes similar to those of the previous section, further tests were made to determine whether there was any specific transmembrane voltage at which the response could be produced. In particular
(in view of the possible role of dielectric breakdown discussed in the introduction
to this part) very strong currents were passed across the membrane, sufficient to
polarize it to the level at which dielectric breakdown occurred. It was found that
responses could readily be produced in this way.
Table 7. Production of 'responses' by dielectric breakdown
(A) Characteristics of the dielectric breakdown
The resistance values represent the mean input resistance of thirty-four cells in a 7-day culture, 100 ms after the beginning of a 300 ms current pulse. Each small pulse was of strength 1 x 10~8 A, and produced a mean voltage change of 59 mV, depending in each cell on its membrane resistance. The large pulses were thirteen times this strength. The right-hand column gives the transmembrane voltage remaining at the end of the pulse in the cells in which breakdown had finished.
resistance during resistance during small pulse large pulse plateau voltage
inward 5-3 ? 0-11 MQ (n = 34) 1-0 ? 0-09 MQ (n = 38) 189 ? 10 mV (n = 33) currents outward 6-5 ? 0-23 MQ (n = 35) l-8?0-13MQ(n = 39) 191 ? 13 mV (n = 16) currents
(B) Characteristics of the responses produced
(Pooled results of thirty-two responses in nineteen cells from two cultures, using either 25 ms or 300 ms pulses.)
proportion repolarizing by more than half 65 % mean amplitude of response 12-0 ? 1-2 mV (n = 32) mean half-time of repolarization 1-1 ? 0-03 s (n ? 32)
(a) Dielectric breakdown produced with long (300 ms) pulses
These experiments were performed on thirty-four cells and are illustrated in
figure 9 and summarized in table 7. In each cell, two relatively small testing pulses were first given, one in each direction, to confirm that the cells were?in the
conventional sense?inexcitable, and to measure the initial membrane resistance.
The membrane resistance remained constant throughout the pulse, and no re?
sponses were produced. The current was then increased 13 times and the two pulses
This content downloaded from 130.132.123.28 on Sat, 3 May 2014 20:05:02 PMAll use subject to JSTOR Terms and Conditions

356 W. M. Wardell
repeated, one in each direction. If the membrane resistance had remained constant, this current would have produced a mean transmembrane voltage-change of 770 mV. However, dielectric breakdown occurred during the first few tens of milli?
seconds of every pulse (mean fall of membrane resistance in the first 100 ms =
78 %); and provided that the initial membrane potential was greater than 20 mV, termination of the current always revealed a 'glial response' of characteristic
amplitude and time course (table 7).
(b) Production of the 'response' by short pulses
The above experiments did not indicate whether the breakdown could be
produced by shorter pulses. This question is important because Tasaki & Chang
(1958), in their experiments on silent cells in the intact cat's cortex, obtained
'responses' with extracellular pulses of 5 to 20ms duration. In that situation
mechanical effects were not involved and if, as seems possible, dielectric break?
down were the cause, it would have to occur within 20 ms.
Experiments were therefore performed to determine as far as possible the manner
in which the dielectric breakdown depended on time and voltage.
Using a series of 300 ms pulses of increasing strength in each cell, it was found
that the breakdown did not happen instantaneously. The higher the initial imposed
voltage, the earlier and faster was the breakdown, so that to produce for example a breakdown of 20% in 25 ms, the initial imposed transmembrane voltage had
to be approximately 400 mV in either direction.
It followed, therefore, that short pulses should produce dielectric breakdown
and 'responses' provided that they were strong enough. This was confirmed in another series of cells in which 'responses' were readily
evoked with 25 ms pulses in either direction. A minimum transmembrane voltage of 290 to 550 mV was necessary and in three cells the mean breakdown required to produce a 'response' was between 2% and 61 % of the initial membrane resist?
ance.
Finally, qualitative tests were made on fibroblasts from the skin of chick embryos. It was found that depolarizing 'responses' could indeed be produced in these cells
by strong intraeellular stimulation, confirming that the phenomenon of dielectric
breakdown and the resulting depolarization were not specific to neuroglial cells.
(c) Conclusions
The membrane of neuroglial cells resembles that of other cells in that it undergoes dielectric breakdown when the imposed transmembrane voltage exceeds approxi?
mately 250 mV. The phenomenon is non-specific, and has previously been de?
scribed in other cells only as a result of inward currents, but as seen in these
experiments identical results have been obtained with outward currents as well.
Provided that the amount of breakdown was at least 25 to 60%, and that the
membrane potential was initially greater than ? 20 mV, then a depolarizing
'response' could always be produced.
This content downloaded from 130.132.123.28 on Sat, 3 May 2014 20:05:02 PMAll use subject to JSTOR Terms and Conditions

Electrophysiology of neuroglia 357
(7) Production of the 'response' by a purely mechanical pulse; the relative contribu?
tions of mechanical and dielectric breakdown
As described earlier in this Part, successful extracellular stimuli were accom?
panied by a mechanical pulse which often caused plainly visible damage to the
cell. In this section it is shown that a purely mechanical pulse alone was sufficient
to produce the response, and an attempt is made to assess the relative contribu?
tions, to the production of the response, of the mechanical and electrical properties of the stimulus.
(a) Source of the mechanical pulse
When current is passed through an electrolyte-filled glass capillary, the voltage
gradient causes the fluid inside to move electro-osmotically with respect to the
glass wall, since the latter is fixed (Maclnnes 1939). The actual movement in the glass stimulating pipettes was more complicated
than that expected simply from electro-osmosis. Measurement of the streaming
potential (occurring when fluid was forced out of the pipettes) confirmed that the
sign of the zeta potential was the same as predicted and that the main direction of
movement could be reversed by adding appropriate cations to the internal
solution (e.g. A1C13 (5 x 10~4 m); Quist & Washburn 1940). The direction of mech?
anical movement was not the same in all parts of the pipette, and it is possible that
part of the complexity of the mechanical effects arises from a combination of the
effects of both electrophoresis and electro-osmosis; the analysis was not pursued further since the main point at issue was simply that a large mechanical pulse existed at the tip of the electrode regardless of the direction of the stimulating current.
(b) Production of the response by a purely mechanical pulse
A simple mechanical pulse generator was connected through a closed fluid
column to the fluid filling a stimulating pipette. No electrical stimuli were delivered.
The amplitude of the mechanical pulse visible at the tip of the pipette was ad?
justed until it was, as far as could be judged, the same as that produced by the
standard electrical stimuli. The result was that 'responses' very similar to those
produced by electrical stimuli were readily produced in both fibroblasts and glia. Of those responses in glial cells which repolarized by more than half, the mean
amplitude was 7-7 ? 0-9 mV (n = 14) and the mean half-time of repolarization was 1-2 + 0-2 s (n = 14). The other events typically accompanying electrical stimula?
tion (permanent depolarization and visible cell damage) were also frequently seen.
(c) Attempts to eliminate the mechanical component of the electrical stimulus
The obvious way to eliminate the electrokinetic mechanical pulse would be to
use a metal stimulating electrode. Metal-filled glass stimulating pipettes were
therefore tried, but it was found that when the usual stimulating currents were
passed through these pipettes, a large gas bubble (1 to 50 /xm diameter) appeared with each pulse. The volume of the bubble was approximately equal to that
This content downloaded from 130.132.123.28 on Sat, 3 May 2014 20:05:02 PMAll use subject to JSTOR Terms and Conditions

358 W. M. Wardell
expected from the charge passed, and was only slightly reduced by silver plating the tip of the metal?presumably because of the extremely high current density (calculated to be 100 to 1000 A/cm2). A new mechanical pulse accompanying the
formation of this gas bubble was particularly destructive to the culture. In the
few cases where frank damage to the cells was prevented, 'responses' were readily
produced. Using smaller currents, e.g. less than 1 fjuA (so that no gas bubbles were
formed) no responses were seen, but since these currents did not produce responses with saline-filled electrodes either, it became clear that metal electrodes were of
no use in the attempt to separate mechanical and electrical effects.
Further attempts were made to abolish the mechanical pulses by filling glass
pipettes with very stiff (5%) agar in saline; or with a concentration of A1C13
(5 x IO-5 m) at which the zeta potential (as measured by the streaming potential), and hence the electro-osmotic movement, was abolished; (or, at a higher concen?
tration, reversed). These all failed because with the first few pulses, the saline-agar in the tip of the electrode was ejected by the mechanical pulse, leaving the tip filled with the bath fluid and the mechanical pulses unaltered.
For technical reasons, therefore, it was impossible to determine precisely the
relative contributions of mechanical and dielectric breakdown to the response of
glial cells in tissue culture to extracellular stimulation. However, in view of:
(i) the invariable association of a mechanical pulse with successful extracellular
stimuli,
(ii) the frankly damaging effect of extracellular stimulation, and
(iii) the parallel effects of the reversal of stimulus polarity on both the mech?
anical pulse and the effectiveness of the stimulus, it is likely that mechanical breakdown of the cell membrane is the main
mechanism of the 'response' of neuroglial cells in vitro to extracellular stimulation.
Discussion and conclusions
Experimentally, it has been possible to answer the three questions arising from
the introductory review of the 'response' as follows:
(a) It is not specific to glial cells.
(b) It is not due to a regenerative, depolarization-activated increase of sodium
permeability.
(c) It is produced mainly by mechanical breakdown of the cell membrane, and
can also be produced by dielectric breakdown. The mechanisms proposed here to explain the response also account for those
of its properties reviewed earlier in the introduction: its graded nature, absence of
threshold, and production by both anodal and cathodal currents.
The 'glial response' is thus neither specifically 'glial', nor (in the physiological sense of being active) a 'response'; it is a general cellular property representing the
behaviour of an electrically passive cell membrane under conditions of stress. The
phenomenon is an artifact and the term 'response' should therefore be abandoned
in describing it. The glial cell membranes, being electrically passive, resemble those
of the leech Hirudo medicinalis studied by Kuffler & Potter (1964).
This content downloaded from 130.132.123.28 on Sat, 3 May 2014 20:05:02 PMAll use subject to JSTOR Terms and Conditions

Electrophysiology of neuroglia 359
There remain some important matters which it has not been possible to study further with this preparation:
(a) The exact ion permeability changes involved in the breakdown
In the case of the depolarization produced by the mechanical pulse, the simplest
explanation is that the membrane temporarily acquired a hole, which acted as a
low resistance shunt tending to bring the potential at that point to the value of the
liquid junction potential between the intraeellular and extracellular fluids. The
fact that the maximum positive excursion of the responses was limited at approxi?
mately ? 10 mV is consistent with this explanation, since this is the likely value
of the junction potential (in other cells (Del Castillo & Katz 1954)) after allowing for the effects of the tip potential. Also consistent with this explanation is the fact
that the time course of the repolarizing phase of the response resembled that of
'sealing-in' after the impalement of a cell by a micropipette. On the other hand, there is some evidence (Julian & Goldman 1962) that in other
cells mechanical distortion of the membrane causes a relatively larger increase of
permeability to sodium than to other ions, and may even involve the sodium-
carrier mechanism if present. No such specificity has been detected in these
experiments with the glia, but in view of the limited accuracy of the methods, the
possible occurrence of a selective permeability increase cannot be ruled out.
Very little is known about the conductance changes underlying dielectric
breakdown, although there is a little evidence (Fatt & Ginsborg 1958; Fatt 1961; Ito 1957) that an increase of chloride permeability might be important in some
experimental situations. In the experiments described here, however, something more than an increase in chloride ion permeability must be involved in order to
explain the after-depolarization, unless the chloride equilibrium potential is much
smaller than the membrane potential.
(b) The response in the intact brain
Although all the results here have been obtained from cells in vitro, it is possible that they may have a bearing on the mechanism of the 'response' which Tasaki &
Chang (1958) obtained from silent (presumed glial) cells in the intact cat's cortex, and of the impedance change having the same time course which Chang & Tasaki
(in Hild & Tasaki 1962) found in slices of cat's cortex. Although a mechanical stimulus was absent in Tasaki & Chang's experiments, it is possible (in view of the
extremely large currents needed to produce the response) that dielectric break?
down might have occurred. At present there is no indication of what trans?
membrane voltage changes were necessary to produce Tasaki & Chang's effects,
although in the slice experiments the voltage gradient was such that a cell 20 /xm in diameter may have had more than 400 mV across it. It is interesting to note that the silent cells in the spinal cord studied by Coombs et al. (1955a) were inexcitable to intraeellular stimulation by double-barrelled electrodes, even though the de?
polarization could be made 'quite large'. In view of the similar results obtained here with cells in vitro, the possibility that dielectric breakdown (or some other
non-specific phenomenon) was occurring in Tasaki & Chang's experiments on the
This content downloaded from 130.132.123.28 on Sat, 3 May 2014 20:05:02 PMAll use subject to JSTOR Terms and Conditions

360 W. M. Wardell
intact cat and on cortical slices should be carefully excluded before the reported responses are assumed to depend on active properties of the membranes. If di?
electric breakdown is shown to be involved it is probable that the phenomenon has
no physiological significance, because of the large transmembrane voltages required to produce it (as realized by Hild & Tasaki 1962). On the other hand, if the glial cells in the intact brain are found indeed to be excitable in the conven? tional sense, this would emphasize the uncertainty of trying to argue by too close
an analogy with a system as far removed from the normal state as it is in tissue
culture.
(c) The membrane resistance of neuroglial ceils
The mean value obtained for the input resistance of these tissue-cultured rabbit
neuroglial cells is approximately four times that found by Hild & Tasaki (1962) for tissue-cultured kitten and rat neuroglia, although more comparable with those
found for silent cells in the intact cat's spinal cord by Coombs et al. (1955a). It is
possible that the difference is due to different methods, for the technique Hild &
Tasaki used?inserting two separate electrodes?is presumably applicable only to
the largest cells, and their results fall within the lower end of the range found here.
Had more histological data been available for this study (for example, informa?
tion about the detailed geometry of the cells and the number and length of their
processes) it would have been interesting to calculate their specific membrane
resistance. In the absence of this histological information it was not feasible to
make an independent check of Hild & Tasaki's conclusion that the specific membrane resistance of cultured glial cells had the surprisingly low value of 3 to
10 Q.cm2 (i.e. only 1/100 to 1/500 the value usually found for neurons). It should
be noted, however, that in order to simplify the calculation, Hild & Tasaki
ignored all the glial processes, while Rail (1959) has calculated that in the case of
motoneurons the conductance of the dendrites may range up to nearly 50 times
that of the soma. This last objection appears not to apply to the calculations of
Hild et al. (1965) which also gave a low value for the specific resistance. More
studies need to be made, particularly of the membrane area and geometry of
neuroglia, before these low values for the specific membrane resistance can be
fully accepted.
It is a pleasure to thank Professor W. D. M. Paton, F.R.S., for his support, advice and encouragement; Professor C. E. Lumsden, Department of Pathology, Leeds University, for teaching me the techniques of nervous tissue culture; the
Medical Research Council for a grant for apparatus and the Christopher Welch
Trustees for my own financial support; and Misses Barbara Humphries, Barbara
Phillips and Vicki Rowley for technical assistance.
References
Adrian, R. H. 1956 J. Physiol. 133, 631-658. Boyle, P. & Conway, E. 1941 J. Physiol. 100, 1-63. Chang, J. J. & Hild, W. 1959 J. Cell. Comp. Physiol. 53, 139-144. Coombs, J. S., Eeeles, J. C. & Fatt, P. 1955 a J. Physiol. 130, 291-325.
This content downloaded from 130.132.123.28 on Sat, 3 May 2014 20:05:02 PMAll use subject to JSTOR Terms and Conditions

Electrophysiology of neuroglia 361
Coombs, J. S., Eccles, J. C. & Fatt, P. 19556 J. Physiol. 130, 326-373. Costero, I. & Pomerat, C. M. 1951 Amer. J. Anat. 89, 405-467. Crain, S. 1956 J. Comp. Neurol. 104, 285-330. Crill, W., Rumery, R. & Woodbury, J. 1959 Amer. J. Physiol. 197, 733-735. Curtis, D. R., Phillis, J. & Watkins, J. i960 J. Physiol. 150, 656-682. Del Castillo, J. & Katz, B. 1954 J. Physiol. 125, 546-565. Draper, M. H. & Weidmann, S. 1951 J. Physiol. 115, 74-94. Fatt, P. 1961 in Nervous Inhibition (Flory E. (ed.)), pp. 87-91. Oxford: Pergamon Press. Fatt, P. & Ginsborg, B. L. 1958 J. Physiol. 142, 516-543. Fatt, P. & Katz, B. 1951 J. Physiol. 115, 320-370. Goodford, P. J. & Ing, H. R. 1959 Brit. J. Pharmacol. 14, 358-363. Goodman, L. & Gilman, A. 1955 The pharmacological basis of therapeutics (2nd edition).
New York: The Macmillan Company. Hagiwara, S. & Saito, N. 1959 J. Physiol. 148, 161-179. Hild, W., Chang, J. J. & Tasaki, I. 1958 Experientia, 14, 220-221. Hild, W., Takenaka, Y. & Walker, F. 1965 Exptl. Neurol. 11, 493-501. Hild, W. & Tasaki, I. 1962 J. Neurophysiol. 25, 277-304. Hodgkin, A. L. 1947 J. Physiol. 106, 319-340. Hodgkin, A. L. 1951 Biol. Rev. 26, 339-409. Hodgkin, A. L. & Horowicz, P. 1959 J. Physiol. 148, 127-160. Ito, M. 1957 Jap. J. Physiol. 7, 297-323. Julian, F. & Goldman, D. 1962 J. Gen. Physiol. 46, 297-313. Katzmann, R. i960 Neurology 11, 27-36. Krnjevic, K., Laverty, R., & Sharman, D. 1963 Brit. J. Pharmacol. 20, 491-496. Krnjevic, K., Mitchell, J. & Szerb, J. 1963 J. Physiol. 165, 421-436. Kuffler, S. W. & Potter, D. 1964 J. Neurophysiol. 27, 290-320. Lumsden, C. E. 1951 Anat. Rec. 110, 145-179. Lumsden, C. E. 1958 Ch. 9, of Biology of neuroglia, (Windle, W. F. (ed.)). Springfield, 111.:
Charles C. Thomas, (1958). Lumsden, C. E. 1963 Ch. 14 in Pathology of tumours of the nervous system (Russell, D. S. and
Rubinstein, L. J. (eds.)), (2nd edition, 1963). London: Edward Arnold. Liittgau, H. C. & Niedergerke, R. 1958 J. Physiol. 143, 486-505. Maclnnes, D. A. 1939 The principles of electrochemistry. New York: Dover Publications Inc.
(1961, ch. 23, pp. 423-446.) Nicholls, J. & Kuffler, S. 1964 J. Neurophysiol. 27, 645-671. Noble, D. 1962 Biophys. J. 2, 381-393. Paul, J. i960 Cell and tissue culture. London: E. and S. Livingstone Ltd. Pomerat, C. M. & Costero, I. 1956 Amer. J. Anat. 99, 211-247. Quist, J. D. & Washburn, E. R. 1940 J. Amer. Chem. Soc. 62, 3169-3172. Rail, W. 1959 Exptl. Neurol. 1, 491-527. Snedecor, G. 1956 Statistical methods (5th edition). Iowa State University Press. Svaetichin, G., Laufer, M., Mitari, G., Fatehchand, R., Vallecalle, E. & Villegas, J. 1961 In
The visual system, pp. 445-496 (Jung, R. and Kornhuber, H. (eds.)). Berlin: Springer -
Verlag. Tasaki, I. & Chang, J. J. 1958 Science 128, 1209-1210. Tasaki, I. & Kamiya, N. 1950 Protoplasma, 39, 333-343. Tasaki, I., Mizuguchi, K. & Tasaki, K. 1948 J. Neurophysiol. 11, 306-315. Tauc, L. 1954 J. Physiol. Path. Gen, 46, 659-669. Tauc, L. 1955 J. Physiol. Path. Gen. 47, 769-792. Villegas, R., Villegas, L., Gimenez, M. & Villegas, G. 1963 J. Gen. Physiol. 46, 1047-1064. Wardell, W. M. 1963 J. Physiol. 169, 25-26P. Wardell, W. M. 1964 J. Physiol. 175, 52-54P. Weidmann, S. 1949 Acta Physiol. Scand. 19, 230-236. Weidmann, S. 1951 J. Physiol. 115, 227-236.
24 Vol. 165. B.
This content downloaded from 130.132.123.28 on Sat, 3 May 2014 20:05:02 PMAll use subject to JSTOR Terms and Conditions