electrical and comp eng - naval postgraduate school
TRANSCRIPT

Cotton – Textile-Apparel
Value Chain Report
Zambia
August 2003
Presented to
The RATES Center P.O. Box 1555-00606
Nairobi, Kenya email:[email protected]
Regional Agricultural Trade Expansion Support Program P.O. Box 1555-00606, Nairobi, Kenya; [email protected]

Enhanced Regional Cotton Trade- National Report
2
Table of contents
Table of contents ............................................................................................................. 2 1.0 BACKGROUND ........................................................................................................ 4
1.1 CLIMATIC CONDITIONS OF ZAMBIA .............................................................. 4 1.2 ECONOMIC POSITION OF ZAMBIA ................................................................. 4 1.3 ZAMBIAN AGRICULTURAL SECTOR OVERVIEW ...................................... 5 1.4 AGRICULTURE SECTOR PERFORMANCE ....................................................... 6 1.5 MARKETING OF AGRICULTURAL PRODUCTS .............................................. 7
2.0 ZAMBIA’S REGIONAL TRADE COMMITMENTS .............................................. 8 3.0 SUPPLY AND DEMAND ANALYSIS ................................................................... 10
3.1 RAW COTTON (COTTON, NOT CARDED OR COMBED HS 5201.00) ......... 10 3.1.1 CLIMATIC CONDITIONS FOR COTTON GROWING ............................ 10 3.1.2 ZAMBIA’S COTTON INDUSTRY ............................................................... 10 3.1.3 SEED COTTON PRODUCTION .................................................................. 11 3.1.4 COTTON PRODUCING ORGANISATIONS ............................................. 13 3.1.5 COTTON PRODUCTION POTENTIAL........................................................ 19 3.1.6 MARKETING OF SEED COTTON ............................................................ 20
3.2 COTTON LINT (COTTON, CARDED OR COMBED HS 5203.00) .................. 20 3.2.1 GINNERIES .................................................................................................... 20 3.2.2 LINT PRODUCTION ..................................................................................... 21 3.2.3 LINT QUALITY ........................................................................................ 21 3.2.4 MARKETING OF LINT .............................................................................. 22 3.2.5 GINNERY SECTOR INSTITUTIONAL STRUCTURE ............................. 23 3.2.6 COTTON LINT EXPORTS ........................................................................ 23
3.3 COTTON YARN (HS 52.05) ................................................................................ 24 3.3.1 SPINNERS ...................................................................................................... 24
3.4 WOVEN FABRICS OF COTTON (HS 52 . 09, 52.10, 52.11, 52.12) ............... 27 3.4.1 WEAVERS .................................................................................................... 27 3.4.2 OWNERSHIP STRUCTURE OF WEAVERS ............................................ 30
3.5 APPAREL / GARMENT ..................................................................................... 30 4.0 COTTON SECTOR DEVELOPMENT INITIATIVES ......................................... 32 4.1 COTTON PRODUCTION DEVELOPMENT ....................................................... 32 4.2 TEXTILE SECTOR DEVELOPMENT .............................................................. 34
5.0 VALUE CHAIN ANALYSIS ................................................................................... 37 5.1 VALUE CHAIN CHART ..................................................................................... 37
5.1.2 COTTON TRADE FLOW LEADERS ............................................................ 37 5.2 COTTON AVAILABILITY CALENDAR AND PROJECTIONS FOR THE YEAR 2002/2003 SEASON ....................................................................................... 37 5.3 VALUE CHANGE ALONG THE CHAIN .......................................................... 38 5.4 ISSUES, PROBLEMS AND CONSTRAINTS ...................................................... 39
5.4.1 COTTON AND LINT PRODUCERS ............................................................. 39 5.4.2 COTTON LINT AND YARN ......................................................................... 40
6.0 POLICY AND REGULATORY ENVIRONMENT ................................................ 41 6.1 IMPORT / EXPORT PROCEDURES AND LICENSING .................................... 41
6.1.1 PROCEDURES................................................................................................ 41

Enhanced Regional Cotton Trade- National Report
3
6.1.2 EXPORT / IMPORT LICENSING .................................................................. 41 6.1.3 TARIFF AND NON-TARIFF CHARGES ...................................................... 42 6.1.4 STANDARDS.................................................................................................. 42 6.1.5 PHYTOSANITARY REQUIREMENTS ........................................................ 42 6.1.6 FOOD QUALITY AND SAFETY STANDARDS ......................................... 42
7.0 TOWARDS ENHANCED REGIONAL COTTON TRADE ................................... 44 APPENDIX I ............................................................................................................ 45 APPENDIX II .......................................................................................................... 47 APPENDIX III .......................................................................................................... 48

Enhanced Regional Cotton Trade- National Report
4
1.0 BACKGROUND 1.1 CLIMATIC CONDITIONS OF ZAMBIA Zambia is a landlocked country situated between latitudes 8 degrees and 18 degrees South of the equator and longitudes 22 degrees and 33 degrees East. It has a total area of over 750 000 square Km, consisting mostly a series of plateaux varying in altitude between 900 meters in the West and 1500 meters in the North- East. The climate is a modified three –year season of Sudanian type with a warm wet season from mid-November to April, a cool dry season from May to August and a hot dry season from September to November. Mean annual rainfall tends to increase from 600 millimeters (mm) in the South to over 1400 mm in some Northern and North – Western areas. There is a single peak of rainfall in January over the greater part of the country, however the rain pattern has changed drastically and become unpredictable in the last 10 years, sometimes with an abnormal drought during December – January and heavy or normal rain in March – April period. Mean daily maximum temperatures range from around 15 degrees in July to around 32 degree in October. 1.2 ECONOMIC POSITION OF ZAMBIA Strategically situated in the Southern Region of Africa, Zambia shares borders with the Democratic Republic of Congo and Tanzania in the North, Malawi and Mozambique in the East, Botswana, Namibia and Zimbabwe in the South and Angola in the West. This aspect certainly puts Zambia at an advantage in terms of easy access to ever expanding economic opportunities in the region. Though landlocked, Zambia boast of many water resources – lakes and rivers. Zambia is rich in mineral resources and its mining industry is its dominant sector and major earner of the much needed foreign exchange (Trade Africa , 2003). The fall in the copper prices has severely damaged Zambia’s economy. Primary agriculture sector and Textile industry are the most promising growing industries in Zambia. The Copperbelt Province, which was known to be a mining area has presently seen many people shifting from mining as their main source of livelihood to agriculture. The agriculture sector’s contribution to employment creation is quite significant for instance, in the cotton industry alone, if a dependency rate of 8 people to each contracted small – scale farmer is assumed, then cotton provides employment (cash earnings) for one million rural people. Further more with the multiple effect of other people associated with the industry through direct employment, transporters, government and others, it more than likely reaches to two million people in Zambia (EBZ Primary Agriculture Sector Report, 2001).

Enhanced Regional Cotton Trade- National Report
5
Table 1: Sector Contribution to Total Non-Traditional Exports (NTE). YEAR TOTAL
NTE (US$) TOTAL PRIMARY AGRICULTURE EXPORTS (US$)
PRIMARY AGRICULTURE CONTRIBUTION TO NTE (%)
TOTAL TEXTILE & GARMETS EXPORTS (US$)
TEXTILE & GARMETS CONTRIBUTION TO NTE (%)
1997 1998 1999 2000 2001 2002
329,490,000 313,390,000 304,500,000 263,630,000 318,376,870 326,696,425
90,918,650 62,244,740 72,501,110 37,102,500 48,548,203 65,796,660
28 20 24 14 15 20
50,897,330 42,787,300 37,446,810 36,428,080 34,341,290 22,902,254
15 14 12 14 11 7
1.3 ZAMBIAN AGRICULTURAL SECTOR OVERVIEW The Zambian agricultural sector is abundantly endowed with natural resources needed to stimulate national economic growth and rural development. Zambia has good climate abundant arable land, labour availability and good water resources (Edwards and Hamusimbi, 2003). The sector has accessible cultivatable land to a tune of 42 million hectares with only 14% (estimated a million hectares) of arable land currently under utilization. The underground water rivers, dambos and lakes provide the country with significant irrigation potential of 500 000 hectares of which only 65 000 hectares (13%) is developed. The sector in Zambia is divided into three categories of farmers (i) Small scale subsistence (with occasional surpluses) (ii) Medium scale farmers that produce maize and few other cash crops and, (iii) Large scale farmers that produce export crops and local food. In between small scale and medium scale farmers, there is a transitional stage of improving farmers known as emergent farmers. Table 2 gives estimates of farmers by category.

Enhanced Regional Cotton Trade- National Report
6
Table 2: Farming Sector Composition Characteristics Small Scale Emergent Medium Scale Large Scale Number (1999) 459,000 119 200 25 –30 740 Total Hectare 0.5-9.0 10-20 20-60 60 and Above Crops grown Food Crops Food/ Cash Crops Food/Cash Crops Cash Crops Production Focus
Subsistence Commercial/Subsistence
Commercial/ Subsistence
Commercial
Source: CSO 2001a and 2001b The major food crops produced are maize, sorghum, cassava, millet and groundnuts. Major cash crops include cotton, tobacco, soyabeans, sunflower, sugar and a variety of vegetables. During the past decade, there has been a general upward trend for most crops except for maize, in terms of area cultivated and production. The total planted area under crops has declined by 10% since 1990/91 and this decline is mostly due to the reduction in maize planting, although it still remains the major staple food and cash crop for most Zambians. The contributing factors of maize reduction have been significant losses of draught power (due to drought and diseases) and an important shift in the economics of production reflecting unavailability of credit access to inputs and removal of subsidies on agricultural inputs. Other reasons for the shift from maize to other crop enterprises have been due to diversification into relative more profitable farming enterprises; unstable market, and droughts/or floods. The major cash crops particularly among small-scale farmers are ranked as follows: Cotton, 29%; Maize, 20%; Sunflower, 14%; Soyabeans, 13%; Vegetables, 10%; Paprika, 7%; and Others, 7%.
1.4 AGRICULTURE SECTOR PERFORMANCE In contrast to Zambia’s agricultural potential and past interventions, its sector has continued to perform below expectations. The agricultural sector growth has failed to keep pace with that of the population for many years. Its annual growth rate averaged on 2.5 % between 1986 and 1995. Analysis of trends in the sector indicates a highly variable sector output: for example sector output rose by 18% in 1996 but fell by 6% in 1997 due to the drought (CSO, 2000 a) To an extent, there has been some indications of growth in the Non- Traditional Exports (NTE) sub-sector as enhanced by the increased diversification out-grower schemes and a significant increase in both the value and variety of export commodities. The agricultural sector contribution to Gross Domestic Product (GDP) averaged 18% over the past decade in comparison to 27% and 55%% contributions by the industries and

Enhanced Regional Cotton Trade- National Report
7
services sectors respectively. Agriculture provides livelihood (in terms of food resources and income) for more than 50% of the population and employs 67% of the labour force. 1.5 MARKETING OF AGRICULTURAL PRODUCTS After the liberalization of agricultural marketing policies, input and output prices have been expected to be market driven. However, this market factor suffers from undue Government interference and inconsistent policy pronouncements made every season (Edwards And Hamusimbi, 2003). This undue government interference is mostly on maize production as it is the staple food for Zambians. For example in the 2002/2003 agricultural season, government through its agricultural input support programme supplied a total of 48 000 metric tonnes of fertilizer and about 2 400 metric tonnes of maize seed at 50% matching grant to 120 000 small scale farmers. The government thought that one limiting factor for improving cotton output was the level of pre-financing for the cotton sector as the existing pre-financing facilities from the private sector are unable to meet the demand from farmers. As the result the government through ministry of Agriculture has introduced pre-financing scheme whose funds are disbursed through the cotton Development Trust to cotton associations for their members to access, and about US $ 200 000 was allocated for season 2002/2003.(CDT Report, 2003).This interference by the government has a bearing on the market price and in cotton this will help the small-scale farmers to obtain maximum possible price of the product. Liberalization of agricultural market hasn’t worked as expected for some farmers who still lack marketing and negotiation skills and access to marketing information. Most of the small and medium scale farmers in remote arrears become vulnerable particularly during the early parts of the marketing season as they are desperate for cash and will on most occasions forego profits for cash payments . This makes the farmer unable to repay his seasonal loans. Lack of competition among the major buyers and / or suppliers has affected agricultural marketing. Because of limited number of players in the agricultural markets, those few buyers tend not to compete fully (sometimes fully monopolistic in some areas) to allow gainfull participation and mutual terms between the farmers and the buyers / suppliers. This situation result into depressed market prices particularly in remote and inaccessible areas. Regulatory bodies or policies to allow commodity floor prices could assist to reverse this trend. Poor crop prices, lack and unaffordable transportation cost, lack of appropriate post harvest storage capacity have characterized crop marketing for small-scale farmers under the Zambian liberalized market.

Enhanced Regional Cotton Trade- National Report
8
2.0 ZAMBIA’S REGIONAL TRADE COMMITMENTS Zambia is a member of COMESA. The trade agreement among the COMESA countries is that those countries are in a Free Trade Area, which guarantee free movement and trade in goods and services. However, it only applies to Djibouti, Egypt, Kenya, Madagascar, Malawi, Mauritius, Sudan, Zambia and Zimbabwe. The major problem in the Zambian textiles is that most of the COMESA countries produce cheaper textile materials than Zambia, hence Zambia cannot export to those countries. Zambia is also a member of the Southern African Development Community (SADC) which comprises Angola, Congo DR, Lesotho, Malawi, Mauritius, Mozambique, Namibia, Seychelles, South Africa, Swaziland, Tanzania, Zambia and Zimbabwe. As a way of fostering trade development, SADC launched a SADC Free Trade Area in 2000 through the SADC Trade Protocol, which put up measure to ensure equitable distribution of the benefits of trade integration for all member states. By ratifying the SADC Trade Protocol, Zambia would enjoy preferential treatment (duty rate) for export to other member states. South Africa is currently Zambia’s largest market for the non-traditional exports and has a potential to increase Zambia’s share of exports to over US $ 100 millions annually given the preferential access. Zambia textiles and clothing manufacturers have through the SADC and MMTZ trade agreement preferential access to SACU (South African Customs Union – comprising of South Africa, Botswana, Namibia and Swaziland) markets. However, the duty free quota limits on cotton yarn to Zambia, 1 700 metric tonnes compared to Mozambique’s 2 600, Malawi’s 3 600 and Tanzania’s 2 100 is too low to warrant meaningful growth in exports. It is proposed that this be increased to 10 000 metric tonnes. The objective of the trade agreement is to stimulate intra-regional trade and will assist Zambian companies with selling into the SADC markets and / or sourcing raw materials. South Africa’s SADC duty structure to the SADC members is as follows: Table 3: South Africa’s (SACU) Duties For SADC Members (Ad Valorem Duty Rates %) CATEGORY 2001 2002 2003 2004 2005 2006
Fibres 7 4 0 0 0 0 Yarn 10 7 4 0 0 0 Fabrics 15 12 9 5 0 0Garments 30 25 20 15 10 0 Made-up textiles
22 18 14 10 5 0
Enhanced Regional Cotton Trade- National Report
9
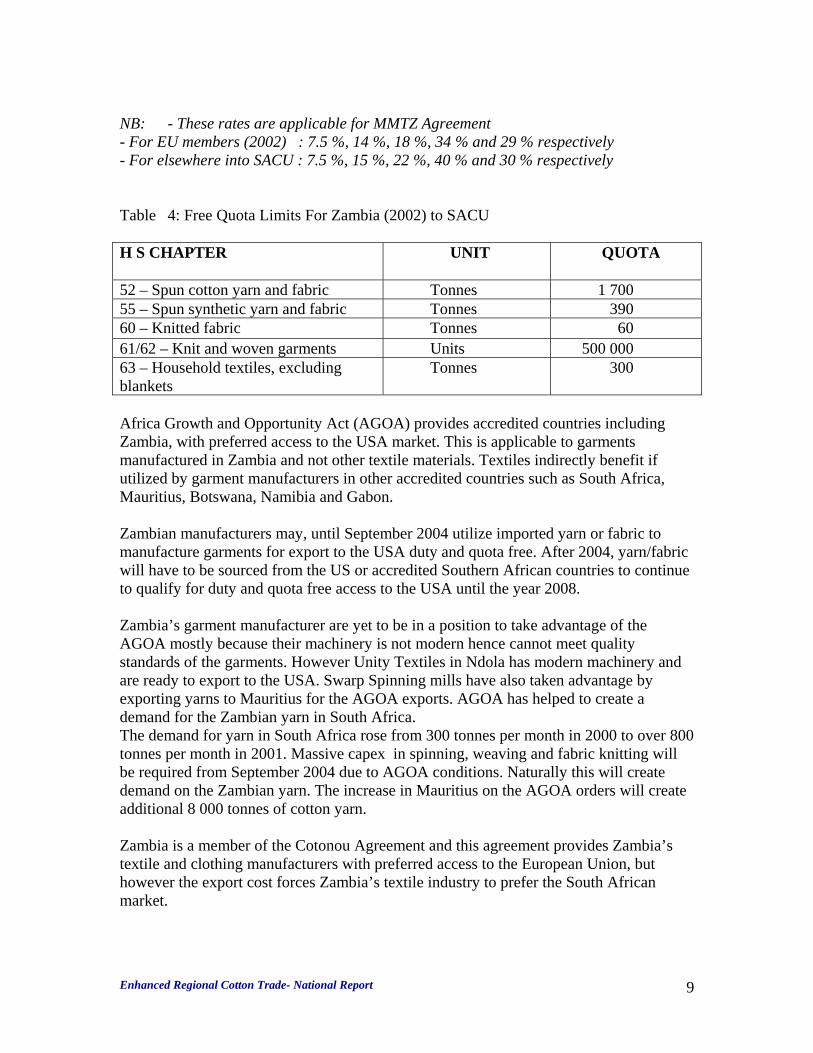
NB: - These rates are applicable for MMTZ Agreement - For EU members (2002) : 7.5 %, 14 %, 18 %, 34 % and 29 % respectively - For elsewhere into SACU : 7.5 %, 15 %, 22 %, 40 % and 30 % respectively Table 4: Free Quota Limits For Zambia (2002) to SACU H S CHAPTER UNIT QUOTA
52 – Spun cotton yarn and fabric Tonnes 1 700 55 – Spun synthetic yarn and fabric Tonnes 390 60 – Knitted fabric Tonnes 60 61/62 – Knit and woven garments Units 500 000 63 – Household textiles, excluding blankets
Tonnes 300
Africa Growth and Opportunity Act (AGOA) provides accredited countries including Zambia, with preferred access to the USA market. This is applicable to garments manufactured in Zambia and not other textile materials. Textiles indirectly benefit if utilized by garment manufacturers in other accredited countries such as South Africa, Mauritius, Botswana, Namibia and Gabon. Zambian manufacturers may, until September 2004 utilize imported yarn or fabric to manufacture garments for export to the USA duty and quota free. After 2004, yarn/fabric will have to be sourced from the US or accredited Southern African countries to continue to qualify for duty and quota free access to the USA until the year 2008. Zambia’s garment manufacturer are yet to be in a position to take advantage of the AGOA mostly because their machinery is not modern hence cannot meet quality standards of the garments. However Unity Textiles in Ndola has modern machinery and are ready to export to the USA. Swarp Spinning mills have also taken advantage by exporting yarns to Mauritius for the AGOA exports. AGOA has helped to create a demand for the Zambian yarn in South Africa. The demand for yarn in South Africa rose from 300 tonnes per month in 2000 to over 800 tonnes per month in 2001. Massive capex in spinning, weaving and fabric knitting will be required from September 2004 due to AGOA conditions. Naturally this will create demand on the Zambian yarn. The increase in Mauritius on the AGOA orders will create additional 8 000 tonnes of cotton yarn. Zambia is a member of the Cotonou Agreement and this agreement provides Zambia’s textile and clothing manufacturers with preferred access to the European Union, but however the export cost forces Zambia’s textile industry to prefer the South African market.

Enhanced Regional Cotton Trade- National Report
10
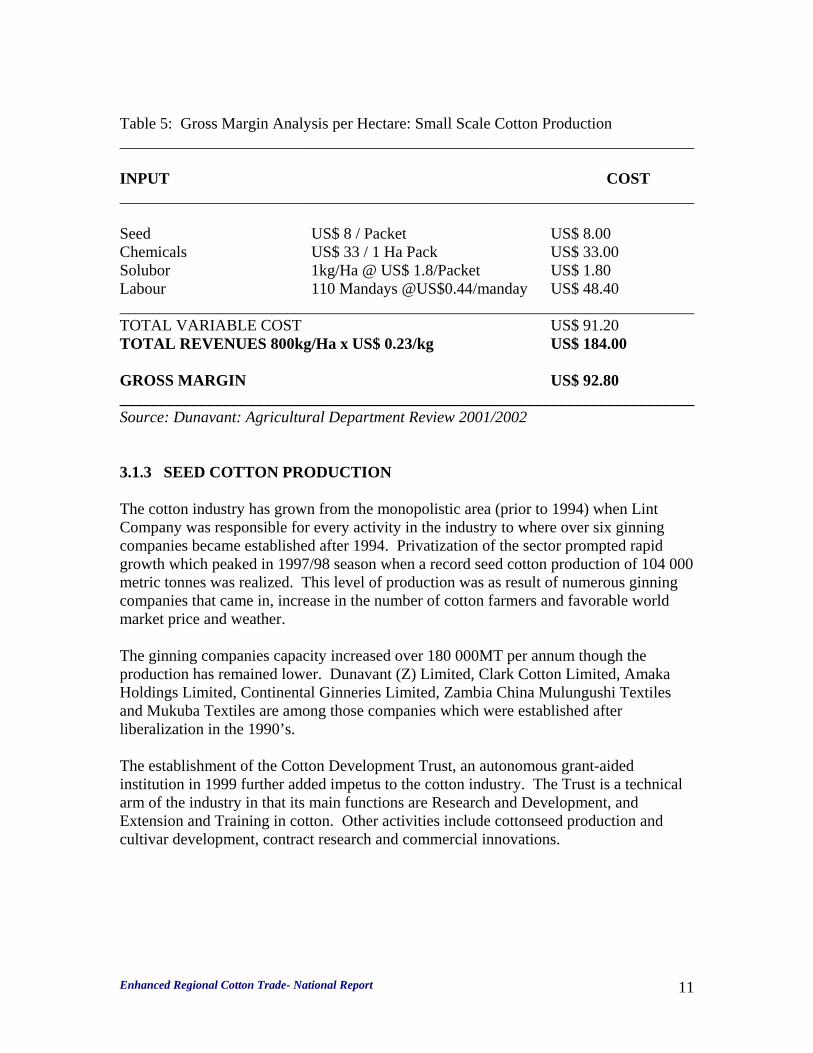
3.0 SUPPLY AND DEMAND ANALYSIS 3.1 RAW COTTON (COTTON, NOT CARDED OR COMBED HS 5201.00) 3.1.1 CLIMATIC CONDITIONS FOR COTTON GROWING Cotton requires a long growing season of 5 – 6 month of warm frost free growing conditions and a well-distributed 600 to 900mm of rain during this period. Sunshine is important for boll retention. Cloudy conditions can cause bolls at the bottom of the plant to shed, and the crop won’t grow properly (Cotton Development Trust Zambia - Cotton Handbook, 2001).In Zambia cotton is grown from about 750 to 1200m above sea level. If grown above 1500m altitudes, low night temperatures in April and May will prevent lint development and cause lower yields. Cotton is a deep-rooted crop that makes good use of natural soil fertility. It therefore does better on fertile clay and sandy clay loam soils than on sand. However, drainage is important as cotton cannot stand wet feet. (Zambia cotton Handbook, 2001) These conditions entails that cotton production is suitable in the regions of Eastern, Central, Southern and the Upper part of Western (around Kaoma) provinces (Mambo: suitability for cotton in Zambia, 2002). 3.1.2 ZAMBIA’S COTTON INDUSTRY In Zambia, Cotton is grown for its fibre both for the local textile industry and for the export market. Cotton is mainly grown as a cash crop by small scale farmers. Cotton industry has substantial small holder (out- grower) participation, with an average of 140 000 small scale farmers contracted to grow cotton each your (Zambia cotton Handbook, 2001, EBZ: Primary Agriculture Sector Report, 2002). The average output per worker per year in the industry is US$ 208(Dunavant Agricultural Department Review, 2002). The table 5.shows the Gross margin Analysis per Hectare for a small scale cotton production. The average grower cultivates 1.6 hectares of cotton with average yields of 700kg/ha.
Enhanced Regional Cotton Trade- National Report
11
Table 5: Gross Margin Analysis per Hectare: Small Scale Cotton Production ________________________________________________________________________ INPUT COST ________________________________________________________________________ Seed US$ 8 / Packet US$ 8.00 Chemicals US$ 33 / 1 Ha Pack US$ 33.00 Solubor 1kg/Ha @ US$ 1.8/Packet US$ 1.80 Labour 110 Mandays @US$0.44/manday US$ 48.40 ________________________________________________________________________ TOTAL VARIABLE COST US$ 91.20 TOTAL REVENUES 800kg/Ha x US$ 0.23/kg US$ 184.00 GROSS MARGIN US$ 92.80 ________________________________________________________________________ Source: Dunavant: Agricultural Department Review 2001/2002 3.1.3 SEED COTTON PRODUCTION The cotton industry has grown from the monopolistic area (prior to 1994) when Lint Company was responsible for every activity in the industry to where over six ginning companies became established after 1994. Privatization of the sector prompted rapid growth which peaked in 1997/98 season when a record seed cotton production of 104 000 metric tonnes was realized. This level of production was as result of numerous ginning companies that came in, increase in the number of cotton farmers and favorable world market price and weather. The ginning companies capacity increased over 180 000MT per annum though the production has remained lower. Dunavant (Z) Limited, Clark Cotton Limited, Amaka Holdings Limited, Continental Ginneries Limited, Zambia China Mulungushi Textiles and Mukuba Textiles are among those companies which were established after liberalization in the 1990’s. The establishment of the Cotton Development Trust, an autonomous grant-aided institution in 1999 further added impetus to the cotton industry. The Trust is a technical arm of the industry in that its main functions are Research and Development, and Extension and Training in cotton. Other activities include cottonseed production and cultivar development, contract research and commercial innovations.
Enhanced Regional Cotton Trade- National Report
12
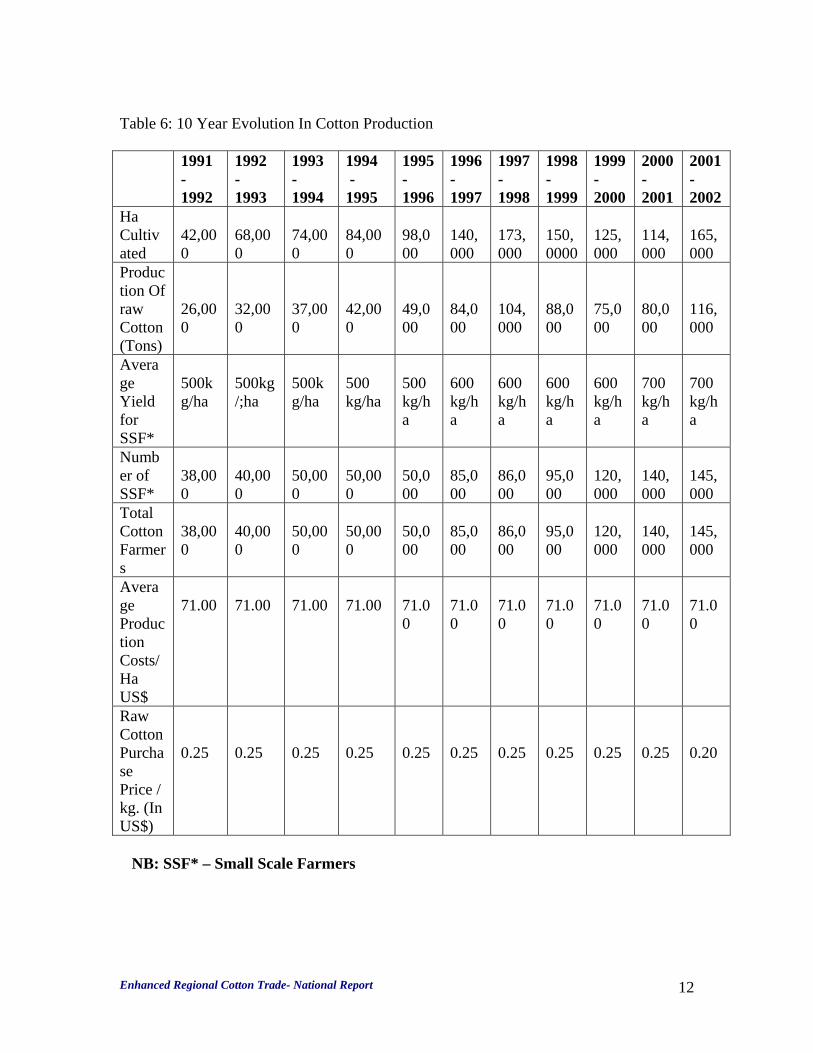
Table 6: 10 Year Evolution In Cotton Production 1991
- 1992
1992 - 1993
1993 - 1994
1994 - 1995
1995 -1996
1996 -1997
1997- 1998
1998 - 1999
1999 - 2000
2000 -2001
2001 -2002
Ha Cultivated
42,000
68,000
74,000
84,000
98,000
140,000
173,000
150,0000
125,000
114,000
165,000
Production Of raw Cotton (Tons)
26,000
32,000
37,000
42,000
49,000
84,000
104,000
88,000
75,000
80,000
116,000
Average Yield for SSF*
500kg/ha
500kg/;ha
500kg/ha
500 kg/ha
500 kg/ha
600 kg/ha
600 kg/ha
600 kg/ha
600 kg/ha
700 kg/ha
700 kg/ha
Number of SSF*
38,000
40,000
50,000
50,000
50,000
85,000
86,000
95,000
120,000
140,000
145,000
Total Cotton Farmers
38,000
40,000
50,000
50,000
50,000
85,000
86,000
95,000
120,000
140,000
145,000
Average Production Costs/Ha US$
71.00
71.00
71.00
71.00
71.00
71.00
71.00
71.00
71.00
71.00
71.00
Raw Cotton Purchase Price / kg. (In US$)
0.25
0.25
0.25
0.25
0.25
0.25
0.25
0.25
0.25
0.25
0.20
NB: SSF* – Small Scale Farmers

Enhanced Regional Cotton Trade- National Report
13
The growth in cotton production in Zambia has largely been achieved through an increased recruitment of farmers. The yields at farm level have remained low, due to a lack of intensification in cotton production and also due to inadequate production management skills for farmers. The production constraints affecting cotton production at farm level, particularly among the small holder farmers in Zambia are as follows:
• Late planting • Low plant population • Untimely and inadequate weed control • None – use of fertilizers • Ineffective control of pests and disease • Inappropriate tillage, soil and water management practices. • Inadequate improved varieties for different agro-ecological zones • Poor seed quality • Inadequate information flow • Inadequate extension services and training.
3.1.4 COTTON PRODUCING ORGANISATIONS There are two major cotton growers in the industry, namely Dunavant in the Central, Eastern and Southern Provinces of Zambia and Clark cotton, which is based in the Eastern Province. Dunavant is also operating in the province of Tete in Mozambique and this project started in October 2001. Other producers are: Zambia China Mulungushi Textiles based in Kabwe operating in most cotton growing areas, Continental Ginnery in Kalomo and Livingstone. Amaka Cotton Ginneries in Kabwe have closed as they have undergone receivership. Eastern Province is the most important area for cotton production and accounts for over 50% of Zambia’s total output. Central and Southern Provinces are also important cotton production areas and generally account for the balance of national production. During the 1997/98 season, cotton production showed a sharp increase of over 104,000 metric tonnes due to the fact that over the same period, the number of small scale producers increased dramatically to an estimated 86 000 farmers cultivating about 173 00 hectares. However the hectarage fell-off to 150 00 and 125 000 ha the next two years due to unfavorable prices and the restructuring and eventual pull out of Lonrho Cotton, which was the leading operator of smallholder out-grower programmes. The year 2001/2002 has shown an increase in production, 116 00 metric tonnes, though lint prices are still volatile. As a result major cotton growers Dunavant and Clark Cotton have invested heavily to improve the efficiency of its out-grower operations.

Enhanced Regional Cotton Trade- National Report
14
(i) DUNAVANT ZAMBIA LIMITED Dunavant is the leading company in cotton growing and has ginnery capacity of 95 000 tonnes of seed cotton. Lonrho bought the Southern and Central Provinces operational parts of Lint Company in 1995. Later in 2001 Lonrho Cotton was sold to Dunavant. The table below shows the seed cotton production by Dunavant in the last five seasons. Table 7: Dunavant / Lonrho Seed Cotton Production SEASON NATIONAL
PRODUCTION (MT) DUNAVANT PRODUCTION (MT)
2001/2002 2000/2001 1999/2000 1998/1999 1997/1998
116 000 80 000 75 000 88 000 104 000
68 000 40 000 20 000 30 000 56 000
Dunavant contracts out – grower farmers by providing them with inputs, much of it supplied on credit terms. Dunavant is working with about 2000 distributors each managing 20 to 40 small scale farmers to whom they lend inputs and recover the input loans at harvest. Dunavant is working with more than 100 000 cotton producing small scale farmers. During the season of 2001/2002 Dunavant provided input loans worth more than US$ 4.2 million out of which they recovered 80% of it (Dunavant Agricultural Department 2001 / 2002 Review - 2002). The average loan per farmer was US$ 43. (a) DUNAVANT OUTGROWER AND DISTRIBUTOR SCHEMES The cotton out grower scheme operates a training and extension services provision programme across all its small scale producers. The out grower scheme recruits the farmers and aims at improving productivity and quality standards of cotton produced under small scale. Training also emphasizes on agronomic skills and judicious use of pesticides. Dunavant through its Area Credit Managers select Distributors. These Distributors recruit farmers and are responsible for the input loans and loan recoveries of farmers. The scheme of using local distributors by Dunavant helps streamlining the services delivery and spreads the risk burden across the three major actors (Dunavant, Distributors and the farmer). Using their local knowledge and peer pressure the input distributors are expected to achieve a minimum of 65% loan recovery rate. An agreed upon commission is paid for any better recovery rates above the minimum recovery rate. The Distributors are encouraged to run their operation on business principles.
Enhanced Regional Cotton Trade- National Report
15
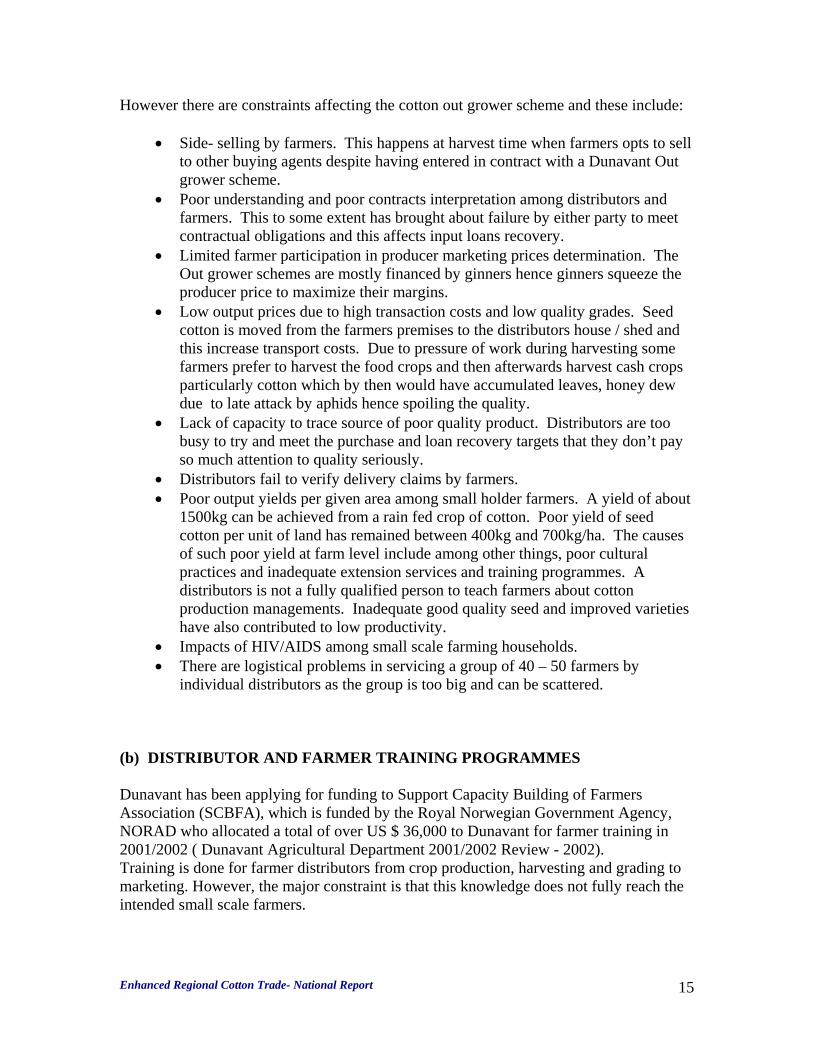
However there are constraints affecting the cotton out grower scheme and these include:
• Side- selling by farmers. This happens at harvest time when farmers opts to sell to other buying agents despite having entered in contract with a Dunavant Out grower scheme.
• Poor understanding and poor contracts interpretation among distributors and farmers. This to some extent has brought about failure by either party to meet contractual obligations and this affects input loans recovery.
• Limited farmer participation in producer marketing prices determination. The Out grower schemes are mostly financed by ginners hence ginners squeeze the producer price to maximize their margins.
• Low output prices due to high transaction costs and low quality grades. Seed cotton is moved from the farmers premises to the distributors house / shed and this increase transport costs. Due to pressure of work during harvesting some farmers prefer to harvest the food crops and then afterwards harvest cash crops particularly cotton which by then would have accumulated leaves, honey dew due to late attack by aphids hence spoiling the quality.
• Lack of capacity to trace source of poor quality product. Distributors are too busy to try and meet the purchase and loan recovery targets that they don’t pay so much attention to quality seriously.
• Distributors fail to verify delivery claims by farmers. • Poor output yields per given area among small holder farmers. A yield of about
1500kg can be achieved from a rain fed crop of cotton. Poor yield of seed cotton per unit of land has remained between 400kg and 700kg/ha. The causes of such poor yield at farm level include among other things, poor cultural practices and inadequate extension services and training programmes. A distributors is not a fully qualified person to teach farmers about cotton production managements. Inadequate good quality seed and improved varieties have also contributed to low productivity.
• Impacts of HIV/AIDS among small scale farming households. • There are logistical problems in servicing a group of 40 – 50 farmers by
individual distributors as the group is too big and can be scattered. (b) DISTRIBUTOR AND FARMER TRAINING PROGRAMMES Dunavant has been applying for funding to Support Capacity Building of Farmers Association (SCBFA), which is funded by the Royal Norwegian Government Agency, NORAD who allocated a total of over US $ 36,000 to Dunavant for farmer training in 2001/2002 ( Dunavant Agricultural Department 2001/2002 Review - 2002). Training is done for farmer distributors from crop production, harvesting and grading to marketing. However, the major constraint is that this knowledge does not fully reach the intended small scale farmers.

Enhanced Regional Cotton Trade- National Report
16
(c) FUTURE FOR DUNAVANT IN COTTON PRODUCTION Dunavant Limited aimed at producing 80,000 metric tonnes of cotton during the 2002/2003 season compared to 68,000 metric tonnes for 2001/2002 season, however their expected yield is 60,000 metric tonnes. This drop is due to the bad drought period between January and February. They have recruited over 109,000 small-scale farmers to produce cotton. Out of the expected 212,000 ha of planted cotton the whole country, Dunavant has recorded over 152,000 ha as their crop (Dunavant Agricultural Department Review, 2002/2003). The aim of the company is to capture and maintain 60% of the market share of seed cotton production. They aim also to improve on field grading of seed cotton to improve the lint quality, which improves income. Over 50% of the total Zambian seed cotton is grown in Eastern Province. To increase production, Dunavant has developed production areas in Mozambican province of Tete. During the 2001/2002 season production from Mozambique was 690 metric tonnes and the target for 2002/2003 is 1,300 metric tonnes of seed cotton. The total target from the Eastern region for 2002/2003 seasons is over 31,000 metric tonnes. To manage to gin this quantity and reduce transport cost that could be incurred in transporting seed cotton to Lusaka ginnery, Dunavant are currently building a ginnery at Petauke to cater for the crop volumes from Nyimba, Petauke and also from Mozambique. This will increase the ginning capacity for Dunavant to 104,000 metric tonnes. The programme of cotton production in Mozambique will face stiff competition from Cotton Company (COTCO) of Zimbabwe. This may be that COTCO will be having a better price than Dunavant. For example during 2001/2002 season, the farm – gate price to Dunavant farmers was US $ 0.16 Grade A; US $15 Grade B; and US $ 13 Grade C in Mozambique while in Zambia, the price was at average US $ 0.20 per Kg. Table 8: Dunavant Proposed Pre-planting Cotton Prices For 2002/2003 for Commercial Seed Cotton in Zambia. DELIVERY PRICE (US$/Kg) Delivered to Ginnery US$ 0.23 Delivered to shed ‘A’ category US$ 0.20 Delivered to shed ‘B’ category US$ 0.19 (ii) CLARK COTTON Clark Cotton is based in the Eastern Province however it has small operations in the Southern Province. Clark Cotton has recruited farmers, about 57 000 for their cotton

Enhanced Regional Cotton Trade- National Report
17
production and last season, 2001/2002 produced 38 000 metric tonnes of seed cotton. Of the 38 000 metric tonnes over 90% was produced in Eastern Province. Clark cotton purchased the Lint Company in Eastern Province and their ginning capacity is 55 000 metric tonnes for the two ginneries. In the initial stages Clark Cotton like most companies, had contracted agricultural based companies as out growers. The company would give inputs to these organizations who would also distribute the inputs to their recruited farmers. However, most of these organizations were based in Lusaka and all they did was after distribution of inputs they would go back to Lusaka and continue with other business. They would probably leave one or two supervisors to check on their farmers. When harvesting time come, those contracted organizations would go to Clark Cotton and get packing materials and financial assistance to purchase the crop from their contracted farmers and resell it to Clark Cotton. Various experiences were noticed and these included the following:
• The contracted Out-grower companies normally used the loaned money for other business rather than purchasing cotton. Normally they would assess and find out the most profitable crop and use that cotton money.
• Most of these Out-grower companies were also buying maize hence their concentration on cotton purchase was low as maize was a money spinner especially if the cotton price was not attractive.
• The farmers for these Out-grower schemes never received training hence their production levels were low.
• These Out-growers , most of them loaned out insufficient inputs. The lack of inputs made their farmers to turn to other companies for more inputs hence tying the crop to more than one loan. When time for selling cotton, the farmers would sell to the first comer hence unable to pay the other input provider the loan. Most of the company executives spent their times in courts of Law suing each other over breaching contracts.
• Side selling was at its worst as the Out-grower scheme owners did not have effective logistics to buy, collect the crop and recover loans.
• The expected production statistics was never correct as two Out-grower companies would each register the same hectare.
(iii) ZAMBIA CHINA MULUNGUSHI TEXTILES Zambia China Mulungushi Textile Limited (ZCMT) is a joint venture between the Chinese and the Zambian Governments. This company is located in Central Province in the town of Kabwe. ZCMT is the only company who apart from growing seed cotton, ginning and spinning have machinery to weave yarn into cloth and finally produce garments. Their industry adds value to the seed cotton over 24 folds such that they can afford to give farmers a better price for seed cotton between US$ 0.25 – US$ 0.30. ZCMT has also set up an oil processing plant such that all their delinted fuzzy seed will be used for oil expelling and the cake will be made into stock feeds for livestock.

Enhanced Regional Cotton Trade- National Report
18
The capacity for ZCMT in ginning is about 10 000 metric tonnes of seed cotton, however they have never operated at full capacity and last season, 2001/2002 season, they produced 7500 metric tonnes. ZCMT runs an out grower scheme with only about 5000 farmers. ZCMT like most companies originally used to contract out grower companies to produce seed cotton. After seeing the poor loan recoveries and spending time suing these out grower companies for non-payment of loans, ZCMT has also employed extension staff in their agriculture department and these are responsible for recruitment of farmers, input distribution, purchasing of the crop and loan recoveries, Due to their better price than all other seed cotton producers, ZCMT wherever they are operating encourages farmers belonging to their organizations in side selling and this is how they managed to buy the 7500 metric tonnes of cotton. Wherever they operate, there are always fights with other companies due to side-selling by farmers of other organizations. With the increase in staffing their agricultural department, this side-buying may reduce as they will increase their loan portfolio among farmers and this will make them concentrate on loan recoveries. (iv) CONTINENTAL GINNERY Continental ginnery is based in Kalomo and operated in the peripheral areas of the ginnery. This ginnery is owned by Continental Textiles based in Livingstone Continental ginnery has also invested in Eastern province. They have recruited 16000 farmers with about 15, 000 hectares and their target this season 2002/2003 is to produce 4,000 metric tonnes of seed cotton. During the season 2001/2002, Continental ginnery produced 3000 metric tonnes of seed cotton yet their ginnery capacity is 8,000 metric tonnes. Continental ginnery runs an out grower scheme which contract farmers or private business men. This contracted person will be loaned inputs that he himself loans and distributes to the farmers recruited in the organization. During harvest this contract person will buy and weigh the cotton at the farmers houses, and will pay and deduct the loans. He will try and move the cotton immediately to Continental ginnery where he has negotiated a gin-gate price that will leave him with profit. However this system is not affective due to the following reasons:
• Most contract buyers have no transport hence any delay in collecting the cotton from the farmer might cause the farmer to sell it elsewhere again.
• Loan recoveries are poor as the contract person has logistical and financial problems – insufficient funds, little knowledge of the farmers he is dealing with.
• If advanced with money, the contract person might redirect the funds elsewhere. (v) OTHER COTTON PRODUCERS Amaka Ginnery that was once a major cotton producer in Kabwe region has been put under liquidation hence all operations are halted.

Enhanced Regional Cotton Trade- National Report
19
Mukuba Textiles used to contract farmers to grow cotton. This seed cotton was transported to Amaka who used to gin it for them and then send the lint to Mukuba for spinning and weaving. The Amaka Ginnery Capacity is 21000 metric tones. 3.1.5 COTTON PRODUCTION POTENTIAL Cotton was however not a significant crop in Zambia until the late 1970’s. The Lint company of Zambia (Lintco) was set up by Government in 1976 to develop cotton in Zambia. Lintco recorded its best production your during the 1987/88 season, with planting of close on to 78 000 hectares and production of about 64 000 metric tones of seed cotton. However, due to Lintco’s inefficiency and poor crop price to farmers, commercial farmers gradually switched to substitute crops. Lintco was then privatized in 1995, and Lonrho and Clark cotton bought its gins. Most of the seed cotton in Zambia is produced by small scale farmers, about 150 000 farmers cultivating over 212 000 hectares of planted seed cotton with expected yield of about 130 000 metric tonnes. The cotton industry in Zambia has the potential to grow into a big player in the region. Companies like Dunavant and Clark cotton have currently invested substantially in out-grower schemes to improve small holder yields through improved access to inputs and extension services. In the areas where these companies have supported out-grower farmers, cotton yield has gone up (from 500 – 600kg seed cotton per hectare in 2000 to 700 – 800kg seed cotton per hectare in 2001) The future of the industry also is in investing heavily in Agriculture Research and Development, input marketing, extension services credit and collection services. The Cotton Development Trust (CDT) and ginners should work together to harmonize and improve cotton production. The Government in its budget allocated about US$ 200 000 for out-grower scheme inputs. This fund is given to the companies that have out-grower scheme to acquire inputs for their farmers. The CDT controls the fund. Genetically improved seed, increase use of fertilizer and up grading of the infrastructure roads, rail and communication will all be required to meet the needs for improved efficiency and increased volumes (EBZ, 2002) Zambia clearly has the ability to more than double existing seed cotton production. However, this will require a partnership between Government, farming community, ginning industry and even spinning industry in order to:
• Expand extension services / out-grower schemes (i.e. training, education, financing, etc)
• Improve yields per hectare. • Provide farmers with access to affordable farming inputs such as cottonseed. • Educate the farming community about their obligations in terms of these input
cost provisions. Limit the side selling potential.

Enhanced Regional Cotton Trade- National Report
20
• Identify areas suitable for irrigation cotton farming and develop infrastructure accordingly (water distribution, electrification etc)
• Ensure that cultivars are limited in line with the needs of the spinning industry regionally and overseas.
A profound increase (doubling) of cotton growing should reduce the incidence of side-selling. However, farmer education of their contract growing obligations remain a priority to combat side-selling (ZAMTIE, 2002)
3.1.6 MARKETING OF SEED COTTON
All the seed cotton produced in Zambia is ginned in Zambia and nothing is exported. Zambia also does not import seed cotton from anywhere.
3.2 COTTON LINT (COTTON, CARDED OR COMBED HS 5203.00) 3.2.1 GINNERIES The ginning companies capacity in Zambia has increased to over 180,000 tonnes per annum though the production of seed cotton still remains lower. There are 10 ginneries in Zambia owned by five companies . Table 9: Ginneries Operating In Zambia
NAME OWNER YEAR
INSTALLEDLOCATION ( TOWN )
CAPACITY (MT)
2001/2002COTTON GINNED (MT)
Eastern Ginners
Dunavant 1999 Katete 22,000 21,000
Gwembe Dunavant 1979 Gwembe 19,000 17,620 Lusaka Dunavant 1979/80 Lusaka 10,000 3, 579 Mumbwa Dunavant 1986 Mumbwa 35,000 25,051 Petauke* Dunavant 2003 Petauke - - ZCMT* ZCMT 2000 Kabwe 10,000 7,500 Amaka* Amaka
Ginnery 2000 Kabwe 21,000 550
Continental Continental Textiles
2000 Kalomo 8,000 2,700
Clark A & B
Clark Cotton
1979/80 Chipata 55,000 38,000
TOTAL 116,000

Enhanced Regional Cotton Trade- National Report
21
Petauke* - Currently Being Installed ZCMT* - Zambia China Mulungushi Textiles Amaka* - Currently Not In Operation Continental* - This Is A Roller Gin
3.2.2 LINT PRODUCTION Table 10: Lint Production in Zambia
PRODUCTION YEAR SEED COTTON
THROUGH PUT (MT) LINT PRODUCTION (MT)
2001/2002 116,000 43,000 2000/2001 80,000 30,000 1999/2000 75,000 28,000 1998/1999 88,000 33,000 1997/1998 104,000 38,500
Lint production is based on a Gin Out Turn (GOT) of 40%. However the average lint production in Zambia is 37% as the 3% is waste blown off during production. The current gin utilization in the Zambia’s ginning industry is 58 %.of the total capacity.
Dunavant has the largest ginning capacity of about 90,000 metric tonnes. Dunavant and Clark bought most of their ginneries from Lintco hence most of the machinery are the same, Lummus ginneries. The Lint bales produced are compressed to a weight of about 200 kg which conforms to most of the World’s Textile automated spinning machinery. ZCMT and Amaka have Chinese ginneries and these produce lint bales of about 40-70 kg weight. These don’t conform to most textile machinery only the Chinese machinery, hence their export market is mostly China. Though also Mukuba Textiles used the lint bales from Amaka ginnery. Continental Ginnery is using old technology of roller gins . This is slow technology which require small capacity but however it produces the best lint as the staple length is not affected during ginning .Their GOT is 39% . 3.2.3 LINT QUALITY The harvesting of cotton requires careful management to obtain the maximum value for the lint and seed cotton harvested inappropriately can be damaged by excessive moisture, trash and other contaminants, which are difficult to remove in ginning without damaging the spinning quality of the fibre. Zambia’s cotton is hand picked and this is still by far the most efficient method of harvesting cotton. Even though Zambia produces more lint than local demand, spinners import about 2000 metric tonnes of lint with longer staple from Zimbabwe for blending

Enhanced Regional Cotton Trade- National Report
22
with the Zambian medium sized staple lint to ensure good quality of yarn. It is expensive to import lint from Zimbabwe but there is no choice, as Zambia doesn’t grow long staple cotton cultivars. In order to achieve growing of good quality lint of long staple, the ginners will have to work with farmers and CDT to improve out grower schemes and extension services by targeting the development of irrigated cotton cultivation schemes. These long staple cultivar require to be grown in the valleys where light intensity (heat units) is high and for a long time. CDT is already looking at the programme of inter crossing the long (Egyptian and Sudanian Cultivars) and the local medium staple cultivars. The element of using suitable cultivars is very paramount to lint industry and also the ginning industry should have knowledge of international user needs, the local and regional spinning industry needs and these needs to be consulted. Zimbabwean lint, due to using improved cultivars, commands a premium over the Liverpool A index indicator on the export market and is best suited for fine count yarn spinners. 3.2.4 MARKETING OF LINT Cotton lint consumption by Zambia’s spinning industry is approximately 14,500 metric tonnes and local lint production has far most years exceeded local demand (ZAMTIE, 2002). Export markets will therefore remain a key element in the marketing of Zambia’s cotton lint. Cotton lint produced in the country is sold both locally and outside mainly to South Africa. Swarp Spinning Limited is the major local buyer of cotton Lint, about 12 000 metric tonnes required per annum., About 30% of cotton lint produced is sold locally, 40% is sold to South Africa, 20% goes to the EU market and 10% to the far East. South Africa is the key export destination for lint exporters from Zambia. South Africa’s cotton lint consumption ranges between 70 – 80 000 metric tonnes per year yet its local lint production is only 20 000 metric tonnes. Other countries in Southern Africa, Namibia and Swaziland have small output. However, Zimbabwe is the largest producer and exporter of cotton lint in the SADC region and an important source of supply to South Africa spinners. The sector has experienced problems over the past two seasons with low international prices. Cotton lint in Zambia is priced according to world prices as quoted in the Liverpool/Cot look A index. World prices for cotton lint have decreased from US$ 0.70 per pound (US$ 1.55/Kg) in 1997 to less than US$0.40 per pound (US$0.88/Kg) in April/ May 2002 (the lowest price recorded in 30 years). The current price on Cot look A index is US$.1.08/Kg. The local spinners normally sign contracts with ginners with pre-season prices. There prices are based on Liverpool A index and are charged on import parity basis which

Enhanced Regional Cotton Trade- National Report
23
include freight charges instead of FOB based. The ginners sell lint to local spinners at US$ 1.24/Kg whereas the export market price is pegged at US$ 1.20/Kg.This is discouraging most spinners as they find the price expensive. The ginners when pricing for a local spinner they even add a cost that covers holding risk as ginners hold the cotton for them. However, exports of cotton lint increased by over 6%, the overall growth again seems headed in the right direction with considerable potential for continued expansion. The SACU/SADC Trade Protocol and the AGOA Trade Agreement hold the key to the marketing of the Zambian lint. According to the International Cotton Advisory Committee ( ICAC) most resent cotton market Report (August, 2002) there will be a shortfall of seed cotton by about 1.2 million tonnes, hence this gives Zambia the chance to export their cotton lint at a premium. 3.2.5 GINNERY SECTOR INSTITUTIONAL STRUCTURE All ginneries in Zambia are private owned, with single ownership apart from Katete’s Eastern Ginners Limited which is co-owned by Dunavant and Sable Transport (as a minority shareholder), and ZCMT a joint venture between Chinese and Zambian Governments. All the ginners are members of the Cotton Ginners Association (CGA). This is an association, which represents the interest of all ginners in Zambia. The CGA consists of all its members (the ginners), representative from Zambia National Farmers Union, representative from the Ministry of Agriculture and Cooperatives, representative from Cotton Development Trusts, representative from the Textile Producers Association. Some of the major functions for CGA are:
• All ginners have out-grower schemes hence they have to liase to ensure side-selling of the crop by their farmers is minimized.
• They strategize to find a way on how to expand and increase cotton production. • They assess the market prices and normally liase on prices especially for local
spinners. 3.2.6 COTTON LINT EXPORTS The table below shows the amount of cotton Lint and value of Exports.

Enhanced Regional Cotton Trade- National Report
24
Table 11: 5 Years Cotton Lint Exports. YEAR COTTON LINT EXPORT (Mt) US$ VALUE 2002 2001 2000 1999 1998
28,500 15,500 13,000 18,500 24,000
30,217,000 11,620,500 9,187,500 38,867,000 22,468,600
Table 12 : 2002 Cotton Lint Exports DESTINATION SOURCE QUANTITY
EXPORTED (Mt)
US$ VALUE
South Africa China Germany and other EU countries
Dunavant, Continental Ginnery, Clark Cotton. ZCMT Dunavant, Clark Cotton
16,287 4,071 8,142
17,266,857 4,316,714 8,633 429
3.3 COTTON YARN (HS 52.05) 3.3.1 SPINNERS The cotton spinning industry grew from capacity of 12 000 metric tonnes around 1993 to a capacity of 23 500 tonnes by 1997. Cheap finance available by then, enabled this sector of the textile industry to expand and major export orientated investment took place between 1994 and 1997. However, due to company closures outstanding capacity as at now is 18500 metric tonnes of yarn per annum (EBZ/UNCTAD/WTO(ITC), 2001). The textiles sector Zambia is of paramount importance to the economy in terms of contribution to GDP (between 16 and 20%), export earning and employment creation, especially with its backward linkage with agriculture (cotton growing), and forward linkage with garment production. Export earnings, however, have since 1997 been declining because of limited market access and declining international prices for cotton textile, following the 1997/98 Asian economic crisis. Europe, which was once market to over 80% of Zambia’s textiles, has in past four years suffered some economic down turn resulting in reduced demand for textiles and devaluation of all major currencies against the US dollar. The emergence of new former Eastern bloc country suppliers, who are closer to the market, has equally not helped matters to the extent that some mills have lost the market completely.
Enhanced Regional Cotton Trade- National Report
25
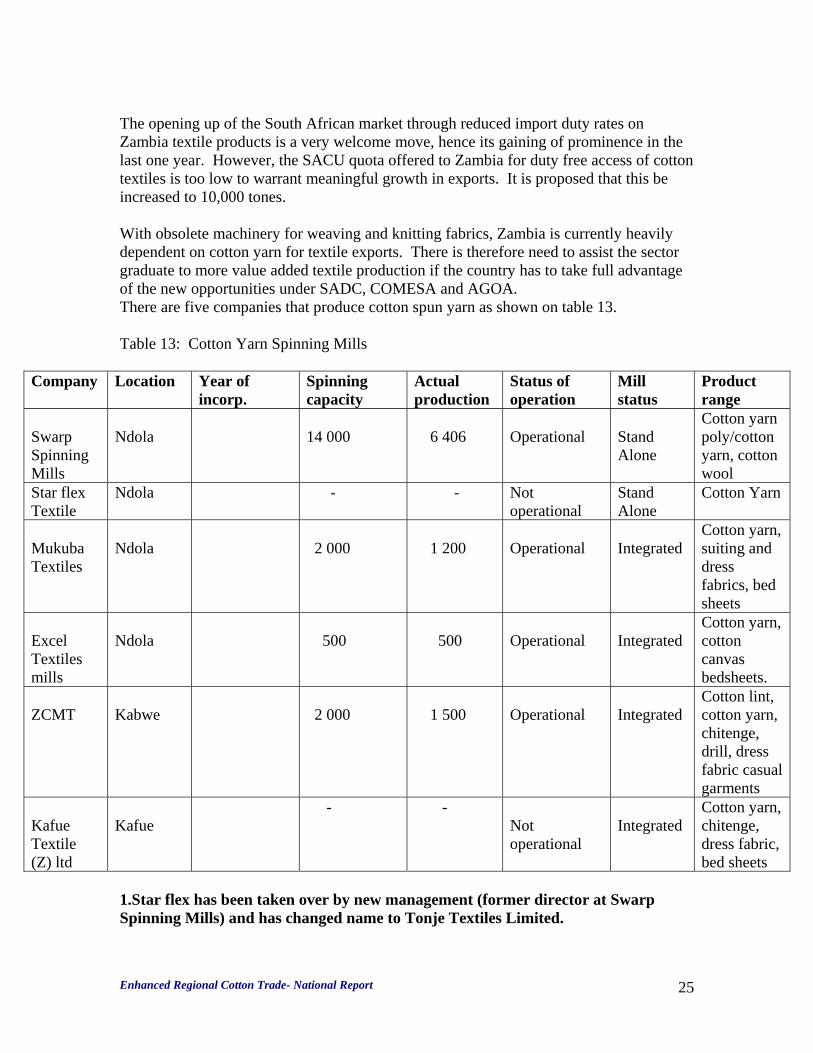
The opening up of the South African market through reduced import duty rates on Zambia textile products is a very welcome move, hence its gaining of prominence in the last one year. However, the SACU quota offered to Zambia for duty free access of cotton textiles is too low to warrant meaningful growth in exports. It is proposed that this be increased to 10,000 tones. With obsolete machinery for weaving and knitting fabrics, Zambia is currently heavily dependent on cotton yarn for textile exports. There is therefore need to assist the sector graduate to more value added textile production if the country has to take full advantage of the new opportunities under SADC, COMESA and AGOA. There are five companies that produce cotton spun yarn as shown on table 13. Table 13: Cotton Yarn Spinning Mills
Company Location Year of incorp.
Spinning capacity
Actual production
Status of operation
Mill status
Product range
Swarp Spinning Mills
Ndola
14 000
6 406
Operational
Stand Alone
Cotton yarn poly/cotton yarn, cotton wool
Star flex Textile
Ndola - - Not operational
Stand Alone
Cotton Yarn
Mukuba Textiles
Ndola
2 000
1 200
Operational
Integrated
Cotton yarn, suiting and dress fabrics, bed sheets
Excel Textiles mills
Ndola
500
500
Operational
Integrated
Cotton yarn, cotton canvas bedsheets.
ZCMT
Kabwe
2 000
1 500
Operational
Integrated
Cotton lint, cotton yarn, chitenge, drill, dress fabric casual garments
Kafue Textile (Z) ltd
Kafue
- - Not operational
Integrated
Cotton yarn, chitenge, dress fabric, bed sheets
1.Star flex has been taken over by new management (former director at Swarp Spinning Mills) and has changed name to Tonje Textiles Limited.

Enhanced Regional Cotton Trade- National Report
26
2.Kafue Textiles is a parastatal company owned by the government. It has really undergone severe financial crisis with the government trying to pump in money. Buyers are not keen as its machinery is obsolete and needs new investment. 3.Owners are not keen to tell when they incorporated their companies Table 14: Cotton Yarn Production and Exports YEAR COTTON
YARN PRODUCED
DOMESTIC DEMAND
EXPORTED YARN
US$ VALUE
2001/2002 2000/2001 1999/2000 1998/1999 1997/1998
11,106 14,500 12,900 11,659 23,500
1,500 321 1,008 2,247 9,250
9,606 14,179 11,892 9,412 14,250
20,906,000 31,364,000 25,979,000 33,617,000 40,172,000
Table 15: Cotton Yarn Production and Exports (2002) NAME OF SPINNER
COTTON LINT PURCHASED
COTTON YARN PRODUCED
COTTON YARN EXPORDED
Swarp Spinning Mills Starflex Textiles Ltd Mukuba Textiles Ltd Excel Textile Mills ZCMT
12 000
6 606 - 1 700 700 2 000
6 406 - 1 200 500 1 500
From the tables presented on cotton yarn, we have enough for domestic use and huge amounts for export.

Enhanced Regional Cotton Trade- National Report
27
Table 16: Export of Cotton Yarn (2002) NAME OF EXPORTER
DESTINATION QUANTITY OF YARN EXPORTED (MT)
US$ VALUE
Swarp Spinning Mills Mukuba Textiles Excel Textiles ZCMT
SACU Countries EU Countries Mauritius EU Countries SACU Countries SACU Countries Asia – China
2 000 3 800 606 720 480 500 1 500
4 352 696 8 270 123 1 318 867 1 566 971 1 044 647 1 088 174 3 264 522
Table 17: Regional Demand for Cotton Yarn COUNTRY COTTON YARN
PRODUCED (MT) COTTON YARN REQUIRED (MT)
COTTON YARN IMPORTED (MT)
Zambia Zimbabwe South Africa Botswana Namibia Lesotho Mauritius
18 500 20 000
1 500 80 000
- 60 000
3.4 WOVEN FABRICS OF COTTON (HS 52 . 09, 52.10, 52.11, 52.12) 3.4.1 WEAVERS The sector of weaving and knitting since the early 1990s has been hit hard by trade liberalization. Vast imports (legal and illegal) of fabric, garments and second – hand clothing drastically reduced demand for cotton based fabrics (ZAMTIE, 2002). This industry was in- ward focused and failed to up grade and modernize their technology.

Enhanced Regional Cotton Trade- National Report
28
Most of the machinery (95%) of existing weaving companies are more than 15 to 20 years, some even second hand when originally installed. Many of the companies in this sector also experience competitiveness problems due to low utilization rates, high consumption of spare part (old machinery), inadequate cashflows, debts and an inability to add value. Their obsolete machinery makes them fail to reach the export standards of quality requirement. Over half of the weaving and knitting companies have closed down due to this unfavorable unprotected market. Table 18: Weavers Name Year of
incorp. Location Status of
operation Weaving capacity
State of technology
Mill status
ZCMT
Kabwe Operational
- Good condition
Integrated
Kafue Textiles
Kafue Closed - - Integrated
Excell
Ndola Operational
- Modern, 11 years old
Integrated
Mukuba Textiles
Ndola Operational
- Good Condition
Integrated
North West Textiles
Ndola Operational
- Old Stand alone – weaving
Towel Textiles
Kitwe Operational
- Old Stand alone . Medical Textiles
Townap
Ndola Closed - - Stand alone. Terry Toweling Woven fabric
Sambro
Ndola Closed - - Stand alone. Circular knitting
Zambia Knitting
Ndola Closed - - Stand alone. Circular knitting
Ndola Ndola Operatio - Old Stand

Enhanced Regional Cotton Trade- National Report
29
Knitting nal alone. Circular and warp knitting
Deetex
Ndola Operational
- Good Condition
Stand alone. Mutton cloth
Rain knit
Ndola Operational
- Not Known
Stand alone. Mutton cloth
Swarp Limited
Ndola Operational
- Good Condition
Stand alone. Mutton cloth
NB: Firms are not keen to give year of incorporation Table 19: Woven Fabric Production YEAR WOVEN FABRIC
PRODUCED (M) WOVEN FABRIC EXPORTED
US$VALUE FOR EXPORTS
2002 2001 2000 1999 1998
12,000,000 12,000,000 14,500,000 8,708,000 14,739,000
1 831 735 1 686 090 2 363 293 610 469 1 146 153
NB: Quantities of Exports of Fabrics are not Accurate Quantities are measured in Metres(m) Table 20: Woven Fabric Exports (2002)
DESTINATION WOVEN FABRIC EXPORTED
US$ VALUE
EU Countries SADC Countries
Chitenge and Suiting materials Chitenge and Suiting Materials, Blankets, Carpets, Woven Fabric Cloth
549 521 1 282 214

Enhanced Regional Cotton Trade- National Report
30
3.4.2 OWNERSHIP STRUCTURE OF WEAVERS Apart from Kafue Textiles which is wholly owned by the Government of Zambia under the Ministry of Commerce and Industries and Zambia China Mulungushi Textiles which is a joint venture between the Chinese Government and the Zambian Government. All weavers are private owned by business families most of Asian origin. The weavers belong to the Textile Producers Association of Zambia, and the contact is: (i) Ramesh J. Patel (chairman) Director Swarp Group of Companies P.O Box 71846 NDOLA (ii) Christopher Q Mtonga (Secretary) Director of Administration Swarp Spinning Mills PLC P.O. Box 71846 NDOLA 3.5 APPAREL / GARMENT This industry in the 1980s had about 140 manufacturers employing over 15 000 people and now there are only a mere 10 or less companies as all have closed down. The industry itself is however also to blame. Prior is the economic liberalization garment manufacturers operated behind high protective barriers with low technology sewing machines, reflecting in part low labour costs. They were not equipped or productive enough to meet the challenges of competition. When parastatals and other private companies started closing this reduced purchasing power in circulation hence further reduced the local market demand (ZAMTIE, 2002). Second – hand clothing (Salaula) took over the lower to middle market garment sector accounting for approximately 60 – 65 % of the total market. South African retail stores moved in, selling internationally sourced and in particular South African products to satisfy the medium to upper end of the market (Pep Stores, Woolworth, Truworth, and Smart Centre, which has since closed due to unpaid hire purchase debts). Estimates are that they account for 25% of the market hence leaving only 10 – 15 % of the garment for local manufacturers. The bulk of garment types produced today are uniform, protective wear and schools wear, all less import quality products. The old technology used in weaving restricts the manufacturers choice of garment to be made due to poor quality of fabrics. The lack of modern technology (old sewing machine used) cannot produce export quality garment. Export markets on garments have a tight margin and emphasis on quality is important.

Enhanced Regional Cotton Trade- National Report
31
Table 21: Garment Manufacturers In Zambia COMPANY LOCATION PRODUCTION
SCALE PRODUCT
ZCMT (Golden Ocean)
Kabwe Large Board/Beach shorts,
Amalgamated Dress Ndola Medium Protective wear, Uniforms School wear
Caress Lingerie Ndola Small Protective wear, Uniforms
Carol Exclusive Fashion
Ndola Small Casual / Designer wear Uniforms (Defense Force)
City Clothing manufacturers
Lusaka Medium School wear, Uniforms, Protective wear
Colwyn Group Ndola Large Rain wear mainly Gaurock Ropes and canvas
Ndola Large Protective and Rain wear
Lusaka clothing Lusaka Medium School wear, Protective wear
Modern clothing Lusaka Medium Protective wear Naran Bros Small Protective wear Swarp Limited Ndola Medium Shirts / School
Shirts Unity Garments Ndola Large Protective wear,
Uniforms, Constructed Trousers
Table 22: Garment Exports (2002) COMPANY GARMENTS
PRODUCED GARMENTS EXPORTED
EXPORT VALUE US$
ZCMT Unity Garments
Beach Shorts, T-shirts, Shirts, Casual/Constructed Trousers, and Defense Uniforms. Protective wear, Uniforms, Constructed Trousers
Beach Shorts, Defense Uniforms Protective wear
500 000 300 000

Enhanced Regional Cotton Trade- National Report
32
4.0 COTTON SECTOR DEVELOPMENT INITIATIVES Agriculture Sector in Zambia forms a reliable raw material supply base to the manufacturing industry. Most manufacturing companies in the industry depend on raw materials from the agriculture sector. The agriculture sector’s contribution to employment creation is quite significant. Primary agriculture nets about 16% of the over US $ 300 million per annual of the total Non-Traditional Exports. The production of 116 000 metric tonnes of seed cotton (US $ 30 million) in the season 2001/2002 provided the much required raw material for textiles. The textile sector contributes between 16 and 20 % to the Zambian GDP. 4.1 COTTON PRODUCTION DEVELOPMENT Cotton is the main raw material input for Zambia’s textile industry and it is successfully grown locally. This availability of domestic cotton explains why some of the textile mills have survived the effects of economic and market liberation. National cotton production in Zambia hit a record 116,000 tonnes in the 2001/2002 season, the highest figure so far record in 10 years, though the prices for the commodity have continued to be depressed for the local producers, an average of US$ 0.20/ kg to small scale farmers. The ginning capacity for the national cotton out is 180,000 metric tonnes. This is the amount of seed cotton that can be ginned within the ginnery operation calendar of about 152 days per year. Improved cotton production normally like the season’s (2001/2002) harvest is due to various factors which include weather, and a well organized system of pre-financing (provision of inputs and capital investment requirements of the season) to be done by cotton producers. Zambia still produces in capacities that are not adequate to meet the volumes required under the African Growth Opportunity Act (AGOA) facility. Worse still the ginning out turn (the percentage of actual lint from a given quality of seed cotton) is 40 % which needs to be improved. Yield in Zambia is still low at 700 kg/ha, yet ideally this rain fed crop can even average 1 500 kg/ha once crop management has been kept at the top. The level of pre-financing for the cotton sector is a limiting factor in production because the facility is not able to meet the demand from growers. Side selling by farmers or private buyers of the commodity discourages pre-financing. Looking at the above-mentioned factors hindering the improvement in increased cotton production, the following will assist to reverse the situation.
• Cotton in Zambia, unlike crops like maize is financed by private ginning companies. These ginneries provide the inputs and any necessary pre-finance to the small scale farmers. This empowers the ginners to fix a price for the seed cotton, which normally is very low and discourages farmers from increasing production.

Enhanced Regional Cotton Trade- National Report
33
The government has now allocated some funds on its budget to help in pre-financing of crops to the small-scale farmers. This fund is disbursed through the Cotton Development Trust which in turn gives it to the out grower managing companies, normally the ginners, for input sourcing. What is needed is a strong Cotton Growers Association. The funds from the government though not enough could have been channeled through the Cotton Growers Association to the farmers and this could give farmers bargaining power on prices. Hence we need to strengthen the Cotton Growers Association to represent farmers’ interests.
• After the liberalization of the economy and markets in the early 1990’s, there were mass reductions of personnel from companies. This also affected the staff in the cotton industry. After streamlining operations, the cotton producing companies engaged private cotton out-grower companies. These companies most of them if not all were also involved in maize marketing. The ginning companies would finance these companies to give inputs and buy cotton from farmers and then resell it to the ginning company. This method did not work properly as money was misused and never paid back. Companies spent their precious time in courts of law, suing each other. Dunavant later designed an out grower scheme that filled the gap between the ginners (Dunavant) and the farmers. This was done by selecting among the farmers some to be distributors of inputs and these would also buy the crop and recover loans on behalf of the company. The scheme of using local distributors by Dunavant helps streamlining the services delivery, spreads the risk burden across the three major actors (Dunavant, Distributors and the farmers). An agreed upon bonus is paid for any better loan recovery rates above the minimum recovery rate. This distributor scheme has installed responsibilities in a lot of farmers such that most of them have stopped side-selling and have improved their loan repayments. The cotton outgrower scheme operates a training and extension services provision programme across all its small scale producers. Farmer training is focused mostly on improved agronomic skills on cotton production to improve productivity, quality standards of cotton and on judicious use of pesticides. Financing of the distributor and farmer training is required. Dunavant has been applying for funding to Support Capacity Building of Farmers Association (SCBFA), which is funded by the Royal Norwegian Government Agency, NORAD. The only problem of this training is that knowledge does not fully reach the intended small scale farmers. RATES can assist in funding training of the small scale farmers as SCBFA funded Dunavant training concentrates mainly on Distributors.
• The cotton Development Trust should intensify their training programmes especially for small scale producers to improve production of cotton. The Extension system in Zambia broke down due mass redundancies in institutions that employed them. There is need to put up a strong extension team at CDT that would reach all farmers. The trust should improve the productivity of the cultivars used through their genetic research. The issue of low production of

Enhanced Regional Cotton Trade- National Report
34
cotton in Zambia result from poor crop production management and also the non-improved exhausted cultivars we are using in Zambia. A programme of intercrossing our cultivars with the Egyptian/Sudanian long staple varieties will help us improve both production and quality of the staple length of lint.
• Zambia has abundant water resources and also at the same time has very suitable soils for cotton production. With ever increasing South African market for our lint and yarn, it is important that we take advantage of it. To increase production, even up to 3000 kg/ha irrigation is required. RATES could do an irrigation feasibility study for cotton production especially in the valley areas where the soil and weather are suitable. This would not only increase the cotton production but also improve livelihood of the people in these areas.
• Cotton is very susceptible to weed and pests. The use of genetically modified organism (GMO) in cotton in some countries within the region have shown successful results. In South Africa the GMO Act, Act 15 of 1997, passed in 1997 and implemented in 1999 paved way to the introduction and commercialization of GMO, mainly in the insect resistant Bt crops in South Africa. The use of the GMO crops, either the Bt or Roundup Resistant crop will help increase production in cotton. Results in South Africa (ZAMTIE, 2002) showed increase in yields, more efficient land usage and reduction of environmental impact of pest control in cotton production. The Agricultural Biotechnology and Biosafety Report in Zambia (June 2002), indicates no research and development is underway in Zambia on genetically modified crops. Technology and service providers are awaiting the adoption of Government’s biotechnology and biosafety policy and legislation before conducting evaluations. The delay in executing this policy is depriving the cotton industry in Zambia the chance to grow.
4.2 TEXTILE SECTOR DEVELOPMENT Cotton lint consumption by Zambia’s spinning industry is approximately 14 500 metric tonnes and local lint production has for most years exceeded local demand. Export markets still remain a key element in the marketing of Zambia’s cotton lint with South Africa being the key export destination. With the high demand of lint and yarn in South Africa and Zambia’s recent accession to the US market through AGOA (textiles and Clothing provision) passed by the US congress as a result of meeting visa requirements demanded by the US government, it is expected that the export earning of textiles will improve. Swarp Spinning Mills has already been given Export Certificates by Zambia Revenue Authority and is already exporting yarn to the LDC regions under AGOA. The following development initiatives should be looked at in order to improve the textile industry.

Enhanced Regional Cotton Trade- National Report
35
• Export Processing Zones (EPZ) Act has been passed by the Zambian government
for economically depressed towns like Ndola and Luanshya; this implies manufacturers of goods for export will enjoying tax concessions or incentives on raw materials and other inputs. Ndola hosts most of the textile companies hence this will help the companies
. • Spinners obtained the cotton lint from local suppliers. Zambian spinning mills
have to buy their annual requirement of cotton lint during the marketing season (May to October) and then bear the cost of storage and finance, directly or indirectly. These mills are made to pay import parity prices plus premium to cover both storage costs and the inherent holding risk of the ginners. The result is that Zambian mills procure cotton lint at total costs that are substantially above the international world market price compared to spinners in other countries in Asia who are able to secure cotton at predetermined prices, below international prices, through government scheme. It is proposed that a scheme be put in place that allows spinners to obtain cotton requirements for the spinners by government, through a crop-marketing agency (e.g. Crop Marketing authority, CMA), or some other financing mechanism to maintain an affordable price.
Under the SADC Trade Protocol, the SADC-MMTZ quotas negotiated for Zambia are very small and cover a small percentage in its textile capacity; this needs to be increased substantially, especially for yarn industry, and later for other products. Zambia can supply 10, 000 metric tonnes of textile produce without any problem. Zambia should negotiate for further quota allocation.
• Most of the Zambian weaving and garment factories have old technology. This entails the Zambian products cannot compete on the international market. Investment in new machinery will improve the quality of the materials and the garments, and it will also reduce costs as old machinery have high repair costs. Making available to the sector short term loans, trade finance and technical assistance facilities at favorable and attractive terms and conditions will encourage weaving and garment production. Also required is training in modern cloth designing and production – RATES could help in sourcing out training materials for garment producing industry. Dealing in Garments is a very timely business as fashion goes with time and season hence already existing market is required. Most Zambian garment manufacturers have lost their markets or don’t have markets in USA hence need help in finding market for their products and RATES could help.
• Importation of second hand clothes as already said has taken over 60 % of the domestic cloth requirement hence suppressing the textile industry. The government recently announced duty on those second hand cloth, US $ 0.50 per kilogram which is not enough to discourage the dealers or make them increase

Enhanced Regional Cotton Trade- National Report
36
prices. These clothes are priced cheaply and not all are second hand because some are factory rejects or overstayed stocks in shops. A restriction ( issuing quotas ) by the Government in importation of second hand clothes is the only way to save the industry. Import restrictions and additional duty on these clothes should be put to discourage importation. Lobbying can be done by Zambia Association of Manufacturers, Textiles Producers of Zambia and EBZ to the government.
Enhanced Regional Cotton Trade- National Report
37
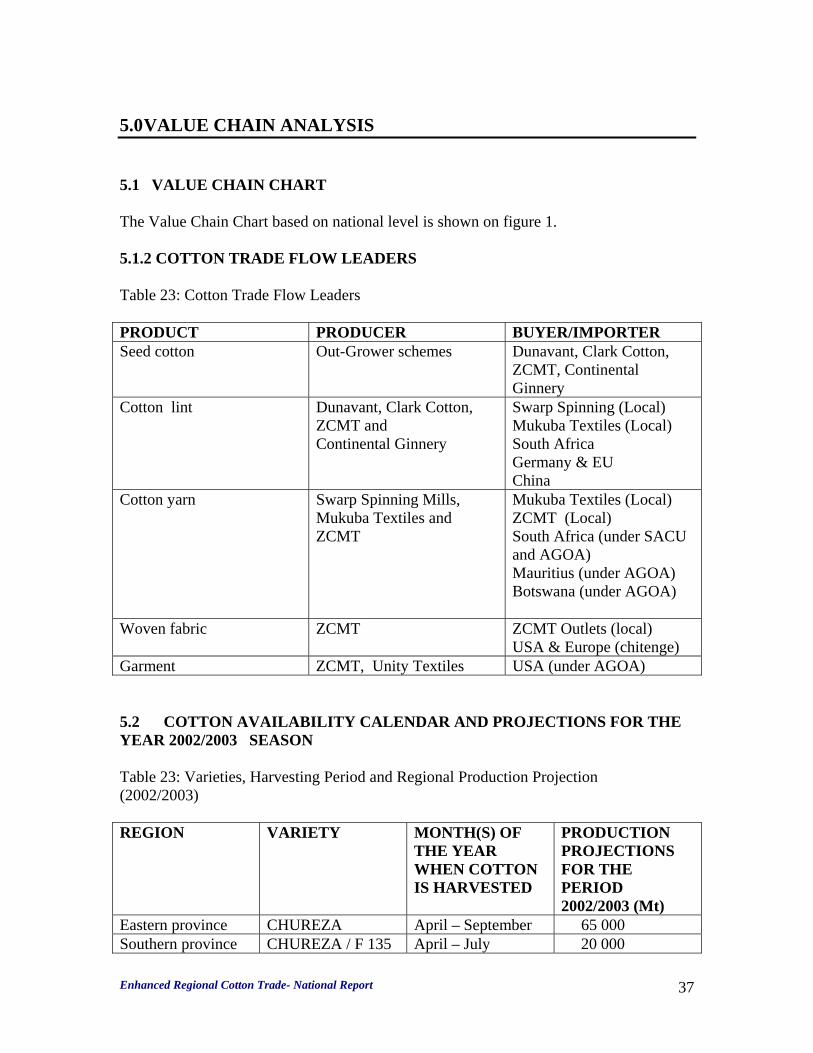
5.0 VALUE CHAIN ANALYSIS 5.1 VALUE CHAIN CHART The Value Chain Chart based on national level is shown on figure 1. 5.1.2 COTTON TRADE FLOW LEADERS Table 23: Cotton Trade Flow Leaders PRODUCT PRODUCER BUYER/IMPORTER Seed cotton Out-Grower schemes Dunavant, Clark Cotton,
ZCMT, Continental Ginnery
Cotton lint Dunavant, Clark Cotton, ZCMT and Continental Ginnery
Swarp Spinning (Local) Mukuba Textiles (Local) South Africa Germany & EU China
Cotton yarn Swarp Spinning Mills, Mukuba Textiles and ZCMT
Mukuba Textiles (Local) ZCMT (Local) South Africa (under SACU and AGOA) Mauritius (under AGOA) Botswana (under AGOA)
Woven fabric ZCMT ZCMT Outlets (local) USA & Europe (chitenge)
Garment ZCMT, Unity Textiles USA (under AGOA) 5.2 COTTON AVAILABILITY CALENDAR AND PROJECTIONS FOR THE YEAR 2002/2003 SEASON Table 23: Varieties, Harvesting Period and Regional Production Projection (2002/2003) REGION VARIETY MONTH(S) OF
THE YEAR WHEN COTTON IS HARVESTED
PRODUCTION PROJECTIONS FOR THE PERIOD 2002/2003 (Mt)
Eastern province CHUREZA April – September 65 000 Southern province CHUREZA / F 135 April – July 20 000
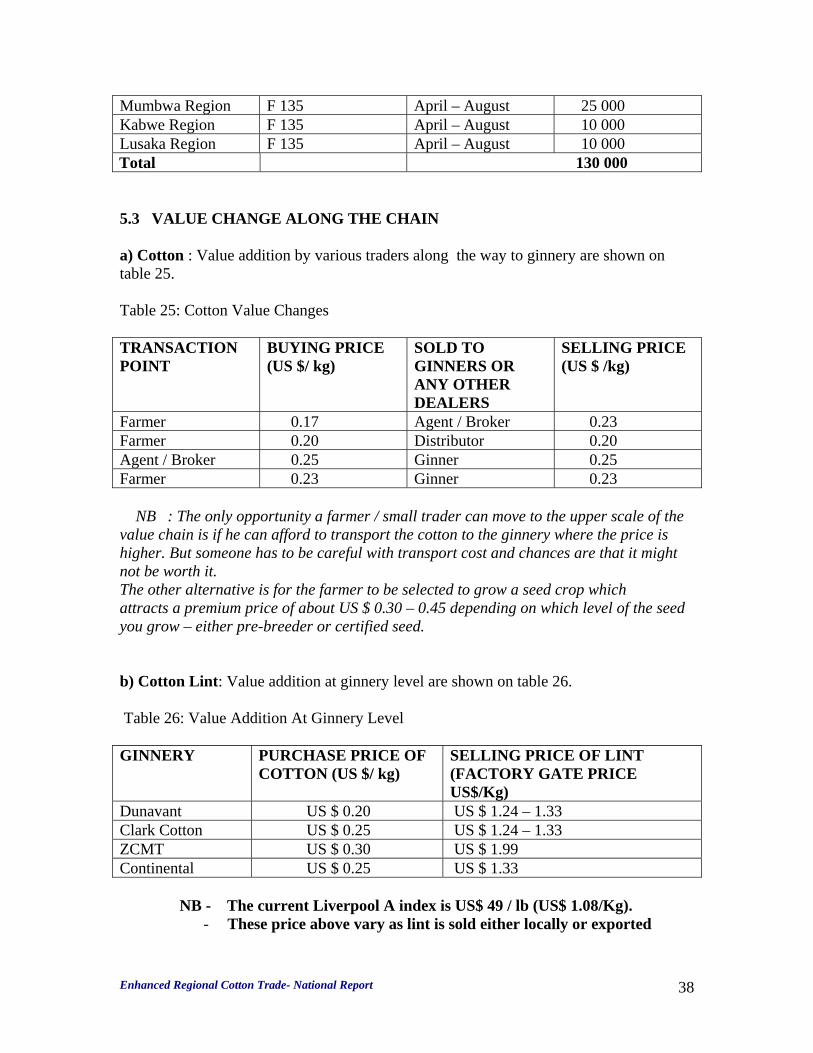
Enhanced Regional Cotton Trade- National Report
38
Mumbwa Region F 135 April – August 25 000 Kabwe Region F 135 April – August 10 000 Lusaka Region F 135 April – August 10 000 Total 130 000 5.3 VALUE CHANGE ALONG THE CHAIN a) Cotton : Value addition by various traders along the way to ginnery are shown on table 25. Table 25: Cotton Value Changes TRANSACTION POINT
BUYING PRICE (US $/ kg)
SOLD TO GINNERS OR ANY OTHER DEALERS
SELLING PRICE (US $ /kg)
Farmer 0.17 Agent / Broker 0.23 Farmer 0.20 Distributor 0.20 Agent / Broker 0.25 Ginner 0.25 Farmer 0.23 Ginner 0.23 NB : The only opportunity a farmer / small trader can move to the upper scale of the value chain is if he can afford to transport the cotton to the ginnery where the price is higher. But someone has to be careful with transport cost and chances are that it might not be worth it. The other alternative is for the farmer to be selected to grow a seed crop which attracts a premium price of about US $ 0.30 – 0.45 depending on which level of the seed you grow – either pre-breeder or certified seed. b) Cotton Lint: Value addition at ginnery level are shown on table 26. Table 26: Value Addition At Ginnery Level GINNERY PURCHASE PRICE OF
COTTON (US $/ kg) SELLING PRICE OF LINT (FACTORY GATE PRICE US$/Kg)
Dunavant US $ 0.20 US $ 1.24 – 1.33 Clark Cotton US $ 0.25 US $ 1.24 – 1.33 ZCMT US $ 0.30 US $ 1.99 Continental US $ 0.25 US $ 1.33 NB - The current Liverpool A index is US$ 49 / lb (US$ 1.08/Kg).
- These price above vary as lint is sold either locally or exported

Enhanced Regional Cotton Trade- National Report
39
- Local lint buyers complain as the producers use import parity prices with
an additional storage and risk fee. - ZCMT has good contracts with the Chinese market and sell their
lint at a premium. c) Cotton Yarn Table 27: Value Addition At Spinning Level SPINNER PURCHASE PRICE OF
COTTON LINT (US$/Kg) SELLING PRICE OF COTTON YARN (FACTORY GATE PRICE, US$/Kg )
IMPORTED COTTON LINT
LOCAL COTTON LINT
Swarp Spinning Mill US$ 1.20 US$ 1.24 US$ 2.00 ZCMT - US$ 1.08 US$ 2.00 Mukuba Textiles US$ 1.20 US$ 1.24 US$ 2.00 5.4 ISSUES, PROBLEMS AND CONSTRAINTS The trade flow leaders in cotton, cotton lint and yarn expressed various issues, problems and constraints that they faced in their day-to-day operations and these include. 5.4.1 COTTON AND LINT PRODUCERS
• Seed cotton in Zambia is produced by small scale farmers and these have no proper representation in their interest. These small scale farmers need an active cotton growers association, which would help in negotiation of input and output prices and other requirements
• The production of cotton in Zambia is private sector driven. The ginneries recruit farmers and finance the cotton production but however, they do not manage to give inputs to all farmers and those that get it, do not get all they require. Hence there is limited access to finance.
• The yield in Zambia is still low, 700 kg/ha when potential of rain fed crop is 1500 kg/ha and irrigated crop is 3 000 kg/ha. The level of farmers’ education on crop husbandry and farm management is low. The cotton Development Trust and the ginneries running the out growers schemes should plan an effective training and extension system for the farmers.
• Since Zambia has not exploited her water resources in irrigating cotton, there is normally a profound impact of adverse weather conditions on crop sustainability.
• The government’s unwilling to let farmers grow GM cotton is retarding progress on increasing cotton yields.

Enhanced Regional Cotton Trade- National Report
40
• Ginners complained of lack of protection on investment. The Agriculture Credit Act is not adequate to curb crop piracy, consequently financiers of the crop tend to lose when the out growers are side-selling the crop.
• Inconsistent Government policy on provision of inputs: The government provision of subsidized inputs for some crops like maize creates big swing out of other crops like cotton to maize hence disturbing the production plan.
• Due to poor infrastructure: the transaction costs are too high due to poor infrastructure in the areas of operation - Roads, communication, limited rural banking.
In summary the future of cotton production lies in investing heavily in Agriculture research and development, input marketing, extension services, credit and collection services, genetically improved seed, increased use of fertilizer. Upgrading of the infrastructure - roads, rail and communication will all be required to meet the need for improved efficiency and increased volumes.
5.4.2 COTTON LINT AND YARN
• The ginning capacity in Zambia is 180 000 metric tonnes and any excess from the domestic consumption is exported. Hence the ginners still have a short fall of seed cotton to maximize their ginnery utilization. The inability of the ginning industry to reach optimum utilization rates restricts their ability to plough back money into the industry from the cotton growing (increasing the crop, improving yields, uniformity of crop/quality and modernizing/ expanding ginning capacity).
• Local yarn spinners are charged very uncompetitive high prices for local lint quoted at import parity basis with additional storage and risk costs.
• The limited small quota allocation for duty free textile goods for Zambia by SADC – MMTZ trade protocol and the high tariffs for the remaining exports makes Zambia not to maximize her export potential. The government should negotiate for increased duty free quota allocation and also renegotiate the trade tariffs, especially the SADC-MMTZ treaty, as South Africa is the biggest market in the region.
• Most of the textile companies lack access to finance at competitive rates. Provision should be made by the government to provide cost-effective funding for seed processing capital, new projects, refinancing and working capital requirements
• The EU market is still dependable but the prohibitive high transport and export costs for Zambian products make it unprofitable.
• The influx, particularly from Asia and South Africa and some COMESA countries, of subsidized textiles and garments; and the second hand (Salaula) imports have drastically reduced the demand of cotton yarn among the local weavers/garment manufactures.
• Cheaper yarn from the other regional countries is not available to the Zambian weavers as it is all used by those countries’ industry.
Enhanced Regional Cotton Trade- National Report
41
6.0 POLICY AND REGULATORY ENVIRONMENT
A number of trade policy measures have been introduced by the government in order to create a favorable environment for export development. These measures include: removal of import controls and quantitative restrictions, simplification of the export licensing system, abolition of a market – determined exchange rate, adoption of a new investment code and various exemptions and facilities allowed under the new investment Act of 1996, and simplification of export procedures and documentation. Zambia has also introduced a streamlined scheme of duty draw back. Majority of the NTE products are exported to Southern Africa and as a deliberate policy Zambia has one of the simple and Hurdle –free export procedures in Southern Africa and the COMESA region. 6.1 IMPORT / EXPORT PROCEDURES AND LICENSING
6.1.1 PROCEDURES
The Zambia Government policy on export is that it liberalized export marketing giving companies the liberty to sell to or buy from whoever they want based on market forces of supply and demand. It is government policy to have all the major raw materials for industrial production zero rated for duty, though some are still at 5%. The regulations of export policy in Zambia are that no export permit is required except for those products that require mandatory international certification e.g. food items.
Export of textile products do no attract VAT. VAT on electricity is reclaimable for exporters. 6.1.2 EXPORT / IMPORT LICENSING The Textiles industry is one of Zambia’s leading NTE sectors offering the greatest hope for economic development and export growth. To encourage growth of the textile industry, government has therefore created several export incentives and these include:
• Zero rating of selected agricultural equipment and manufacturing equipment and machinery while that on other raw materials is only 5%.
• Corporate tax for Non – Traditional Exporters has been fixed at 15% compared to the standard rate of company tax of 35%
• 100% retention of export earnings • Exports are zero rated for VAT purposes • Liberalized foreign exchange market such that exporters can convert their hard
currency into local currency from any registered bureau. • The Duty Draw – Back Scheme (DDB) enables an exporter to claim duty on
imported raw materials used in the production of export goods.

Enhanced Regional Cotton Trade- National Report
42
• Exporters are entitled to utilize bonded warehouse facilities (manufacturing under Bond Scheme) in order to recover tax on export products and allow a smooth cash flow of payment by the importer.
• Government’s introduction of Export Processing Zones, particularly Ndola where most of the Textile processing companies are and Kabwe were you find one of the largest textile company, will encourage growth of the industry.
• The Export Development Revolving Funds lent out to exporters at concessional rates will help the Textile industry.
6.1.3 TARIFF AND NON-TARIFF CHARGES
Zambia is a member of COMESA and SADC. Zambia enjoys both the COMESA-FTA and SADC’s Trade Protocol agreements. Zambia can export to COMESA at zero or low duty rates but however the biggest market for its Textile industry is South Africa which is not a COMESA member. Zambia exports most of its textile exports to South Africa under the SADC-SACU Trade protocol. The SACU – MMTZ Trade Agreement allows Zambia to export to South Africa duty free for a given quota limit. However the quota limit allocated to Zambia is not enough to allow it attain economic growth through export development. Also the current tariffs in South Africa for Zambia Textile products are still high though they have started lowering (see table 3 on page 5). Zambia will only enjoy exporting to South Africa when the tariffs especially for yarn become zero-rated. However, the government under its economic wing can negotiate with the SACU countries to increase its duty – free Quota. Zambia claim it would easily export 10 000 metric tonnes of textile product mainly cotton yarn.
6.1.4 STANDARDS Most textile mills in Zambia have adopted a total quality management system consistent with requirements of 1S0 9002. And as Europe and South Africa are the major market, textiles meet European and South African standards.
Quality control in Zambia is administered by the Zambia Bureau of standards in conjunction with Certified International Quality Assurance Organizations such as DNV, SGS and SABS. Pre-shipment inspection are carried by same organizations..Use of Internationally recognized certification companies is essential as the shipment has no problems on quality once certified.
6.1.5 PHYTOSANITARY REQUIREMENTS
In Zambia we don’t import or export seed cotton hence we don’t need phytosanitary certification. 6.1.6 FOOD QUALITY AND SAFETY STANDARDS
The food Quality and Safety standards in most countries have a tough stance on GMO related by- products. For example on cooking oil from GMO cotton seed.

Enhanced Regional Cotton Trade- National Report
43
However, nobody is using any GMO varieties in Zambia hence our export destinations are not a problem. For any import, the Zambian government has not yet allowed any GMO product in the country.

Enhanced Regional Cotton Trade- National Report
44
7.0 TOWARDS ENHANCED REGIONAL COTTON TRADE
Due to the enabling environment of the cotton industry in the region due to AGOA facility, the demand by the already AGOA exporting countries will mean Zambia has to increase her production to cope up with the lint and yarn demand in South Africa, Botswana, Namibia and Mauritius.
South Africa, Botswana and Namibia, under the AGOA II Amendments, were granted the Less Developed Countries (LDC) status hence can export under AGOA. These countries together with Mauritius will need cotton yarn and fabric to meet their orders. As from September 2004, all AGOA eligible countries will have to source fabrics and yarn from local producers. Estimated annual requirements will be between 100 000 – 120 000 tonnes (ZAMTIE,2002) of cotton yarn/yarn equivalent . All this yarn/fabric demand will mean also Zambian stepping up her production.
Also the reduction of duty rates by SACU on SADC yarn and fabric will encourage exports to SACU countries ( by 2004 yarn will be duty free and fabrics will attract 5% duty). Zambia’s major textile export is yarn and there will be no quota limit for exports of yarn by 2004.
With a capacity of only 180 000 tonnes of seed cotton for ginning, lint production capacity is 72 000 tonnes. The Zambian Yarn production capacity is only 18 500 tonnes at the moment.
Therefore there is need to expand and modernize spinning , weaving and
knitting operations when the demand increases. Garment manufacturing companies should be assisted through funding for capex requirement and modernization so as to be able to produce exportable garments.
To be able to reach Zambia’s ginning capacity, recruitment of farmers should be done and these farmers together with the existing ones should be financed for inputs. Irrigation facilities should be made available in high producing areas. Government should finalize the stand on the use of GM cotton.

Enhanced Regional Cotton Trade- National Report
45
APPENDIX I
LIST OF IMPORTANT INSTITUTIONS/ORGANISATIONS INVOLVED IN TEXTILE INDUSTRY
NAME OF Organization/CONTACT
OPERATION ADDRESS AND CONTACT DETAILS
Dunavant (Z) Limited Mr. Patric Nyumbu (Projects Manager)
Cotton Growers and Ginners
Plot 4970, Mzilikazi Road Box 30178 Lusaka Tel: 01-287104 E-mail: [email protected]
Clark Cotton Limited Jerome Phiri (General Manager)
Cotton Grower and Ginners
1489 Nasser Street, Box 510274 Chipata Tel: 062-21790 Fax: 062-21035 E-mail:
Continental Ginneries Mr. V. Sundararaman (Group Financial Controller)
Cotton Grower and Ginners
Plot 1015, Chifubu Road Box 60010 Livingstone Tel: 03-320175 E-mail: [email protected]
Zambia China Mulungushi Textiles Mr. G.V. Sampa (Seed Cotton Project Manager)
Cotton Grower, Ginner, Spinner and Weaver
Great North Road, Box 81091 Kabwe Tel: 05-222311 Fax: 05-224916 E-mail: [email protected]
Swarp Spinning Mills PLC Christopher Q Mtonga (Director of Administration)
Spinner Plot 5258, Nakambala Road Industrial Area Box 71846 Ndola Tel: 02-650821/5 Fax 02-650172 E-mail: [email protected]
Mukuba Textiles Mr. Mahendra Naik (Managing Director)
Spinners and Weavers
Zambia Road, Industrial Area Box 70358 Ndola Tel: 02-651397 Fax 02-651813 E-mail: [email protected]
Textile Producers Association of Zambia Ramesh J. Patel
C/o Swarp Spinning Mills Ltd Box 71846 Ndola

Enhanced Regional Cotton Trade- National Report
46
(Chairman) Cotton Development Trust Dr. W. Mwale (Director)
P.O Box 670057, Mazabuka Tel: 032-30683 Fax: 032-30683 E-mail: [email protected]
Cotton Ginners Association Nick Wilkinson (Chairman)
C/o Dunavant (Z) Limited P.O Box 30178 Lusaka Tel: 01-287104
Cotton Growers Association of Zambia Boston Chisenga (Chairman)
Room 3, 1st Floor, Nsefu House, Dar-es-Salaam Place Box 32442, Lusaka Tel/fax: 01-226684 E-mail: [email protected]
Ministry of Commerce, Trade and Industry Boniface Kunda (Senior Economist - (Regional) )
Kwacha House Annex Cairo Road Box 31968 Lusaka Tel: 01-228301/9 Fax: 01-226673 E-mail: [email protected]
Export Board of Zambia Chiwama Musonda (Market Research Officer)
Woodgate House, Fifth floor Box 30064 Lusaka Tel: 01-228106/7 Fax: 01-222509 E-mail [email protected]
Zambia Agribusiness Technical Assistance Center Wiggan Kanchela (Account Manager)
191A Chindo Road, Kabulonga Private Bag 207, Woodlands, Lusaka. Tel: 01-263512 Fax: 01-263502 E-mail: wiggan [email protected]
Ministry of Agriculture and Cooperatives Planning and Cooperative Department Green Mbozi (Deputy Director)
Mulungushi House, 4th Floor Box 50595, Lusaka Tel: 01-251233 Fax: 01-250308 E-mail: [email protected]

Enhanced Regional Cotton Trade- National Report
47
APPENDIX II
SOURCES OF INFORMATION/REFERENCES Cotton Development Trust – Cotton Hand Book, 2001 Sub-regional Trade Expansion in Southern Africa Supply Survey On Zambia’s Cotton and Textile Products – EBZ/UNCTAD/WTO (ITC), 2001 The Zambian Economy- Export Board of Zambia, 2003 State Of The Textile and Clothing Industries In Zambia and Tax and Other Policies Required to Revive These Industries For the Promotion of Export – Led Growth – Ramesh J. Patel and Christopher Q Mtonga, 2002. Primary Agricultural Sector Report, 2001. Exporter Audit – Export Board of Zambia,2002. Textiles Sector Report for 2001 – Export Board of Zambia, 2002. Agricultural Department 2001/2002 Review and 2002/2003 Seed Cotton Production Plan Dunavant Zambia Limited, 2002. Intra Region Export Promotion ( Southern Africa ) – Trade Africa, 2003 Stimulating Growth of Trade and Investment on Zambia’s Cotton to Apparel Pipeline – Zambia Trade and Investment Enhancement Project (ZAMTIE), 2002 Trade and Investment Opportunities in Zambia’s Cotton Through Apparel Industries, Executive Summary – ZAMTIE, 2002 Suitability for Cotton in Zambia – Mambo Sector Reports – CDT, 2002 Zambia and the African Growth and Opportunity Act (AGOA) – American Embassy Economic and Commercial Section, 2002 Agricultural Training Needs Assessment (Africa Agricultural Capacity Development Training Initiative) – Edwards and Hamusimbi, 2002. The Cotton Act - Caps 227( Draft ) and 340 of the Laws of Zambia. Agricultural Department Reporters – Central Statistics Office of Zambia, 2001 a and b. Other Sources: Newspaper Articles, Internet, Interviews with senior officers in various organization.

Enhanced Regional Cotton Trade- National Report
48
APPENDIX III