electric flight – potential and limitations · electric flight – potential and limitations ......
TRANSCRIPT
9 - 1 STO-MP-AVT-209
UNCLASSIFIED
UNCLASSIFIED
Electric Flight – Potential and Limitations
Martin Hepperle German Aerospace Center
Institute of Aerodynamics and Flow Technology
Lilienthalplatz 7, D-38108 Braunschweig, Germany
ABSTRACT
During the last years, the development of electric propulsion systems is pushed strongly, most notably for automotive applications. For ground based transportation, the system mass is relevant, but of relatively low importance. This paper addresses the application of electric propulsion systems in aeronautics, where all systems are much more constrained by their mass. After comparing different propulsion system architectures the focus is cast on the energy storage problem and here especially on battery storage systems. Using first order principles the limitations and required technology developments are demonstrated by introducing battery powered electric propulsion systems to small and medium sized aircraft.
Abbreviations and Symbols
b = wing span [m]
C = capacity [Wh]
D = drag force [N]
*E = mass specific energy content [Wh/kg]
ef = empty mass fraction
em /m
g = gravity acceleration [m/s2]
L = lift force [N]
m = mass [kg]
initialm = initial mass at takeoff [kg]
em = empty mass without fuel and payload [kg]
finalm = final mass at landing [kg]
batterym = battery mass [kg]
payloadm = payload mass [kg]
paxm = mass per passenger [kg]
PAX = number of passengers
P = power [W]
batteryP = electric power provided by battery [W]
R = range [m]
t = time [s]
T = thrust [N]
*V = volume specific energy content [Wh/m3]
v¥ = flight speed [m/s]
h = efficiency
¥r = density of air [kg/m3]

9 - 2 STO-MP-AVT-209
UNCLASSIFIED
UNCLASSIFIED
1.0 INTRODUCTION
Stimulated by the progress in technology developments in the entertainment, toy and car industries, the interest in electric propulsion systems for aircraft has grown considerably during the last years. According to many scientific and general publications the storage of electric energy in battery systems promises a clean new world with fantastic new opportunities. This paper highlights the differences between conventional aircraft propulsion systems, burning fossil fuel and aircraft propelled by electric motors. It tries to show the potential but also the limitations of electric propulsion technology for aircraft. This paper contains assumptions about specific weights, energy densities and efficiencies which are sometimes subject to large uncertainties. Therefore all results must be considered with care but the author believes that the main trends and relations are well represented. The numerical data should not be used to derive final conclusions about the performance of any specific product which is mentioned in this paper.
2.0 MOTIVATION
There are several reasons to study alternative propulsion systems and especially electric systems. The observed growth of air transport is clearly visible despite any temporary drawbacks (Figure 1). This growth leads to increased fuel burn and a stronger impact of aviation on the environment. The aviation industry (manufacturers as well as operators) are currently introducing new technologies and operating schemes to achieving a strong reduction in fuel consumption per flight in the order of 15-20%. However it will take many years until all aircraft are replaced with new generation vehicles and on the other hand the growth of air traffic will to lead to increasing overall fuel consumption and hence emissions from air traffic.
Besides the problem of emissions and pollution the amount of oil is limited (Figure 2). Even if it is not clear when the oil resources will be depleted, the price of oil has been steadily climbing for many years following a rather unsteady but clearly visible trend.
Attractive features of electric propulsion systems are that they benefit from better efficiency in the energy conversion chain and that they can be considered as locally zero-emission – albeit depending on how the electric energy is produced.
However, introducing electric propulsion systems into ground transportation seems to be relatively simple compared to the implementation in aviation. While ground based vehicles can easier cope with additional mass due to not fully developed electric storage and propulsion systems, aircraft are much more sensible to mass. Furthermore typical trip distances as flown by aircraft are much larger that trips in ground vehicles (cars, buses, trains) and safety standards in aviation are extremely high. Finally one must acknowledge the fact that current aircraft are already very efficient in terms of fuel burn per payload and distance.
All these facts make it no easy task to develop electric propulsion system concepts for aviation, but it is of strong interest and necessary to determine the physical limitations of using electric energy for aircraft propulsion and to work out the requirements and guidelines for future development.

Electric Flight – Potential and Limitations
STO-MP-AVT-209 9 - 3
UNCLASSIFIED
UNCLASSIFIED
Figure 1 Expected growth of air traffic according to Airbus [1].
1940 1950 1960 1970 1980 1990 2000 2010 2020 2030
Oil P
roduct
ion [M
bar
rel/
day
]
20
40
60
80
100
120
Middle EastAfricaLatin AmericaSouth AsiaEast AsiaChinaTransition EconomiesOECD PacificOECD EuropeOECD North America
Demand [35]
OECD Europe
OECD North America
Middle East
Africa
Latin America
Transition Economies20
40
60
80
100
120
Year
Figure 2 Daily oil production versus time. Extrapolation of oil required by the world [34].
Electric Flight – Potential and Limitations
9 - 4 STO-MP-AVT-209
UNCLASSIFIED
UNCLASSIFIED
3.0 THERE IS NOTHING NEW UNDER THE SUN
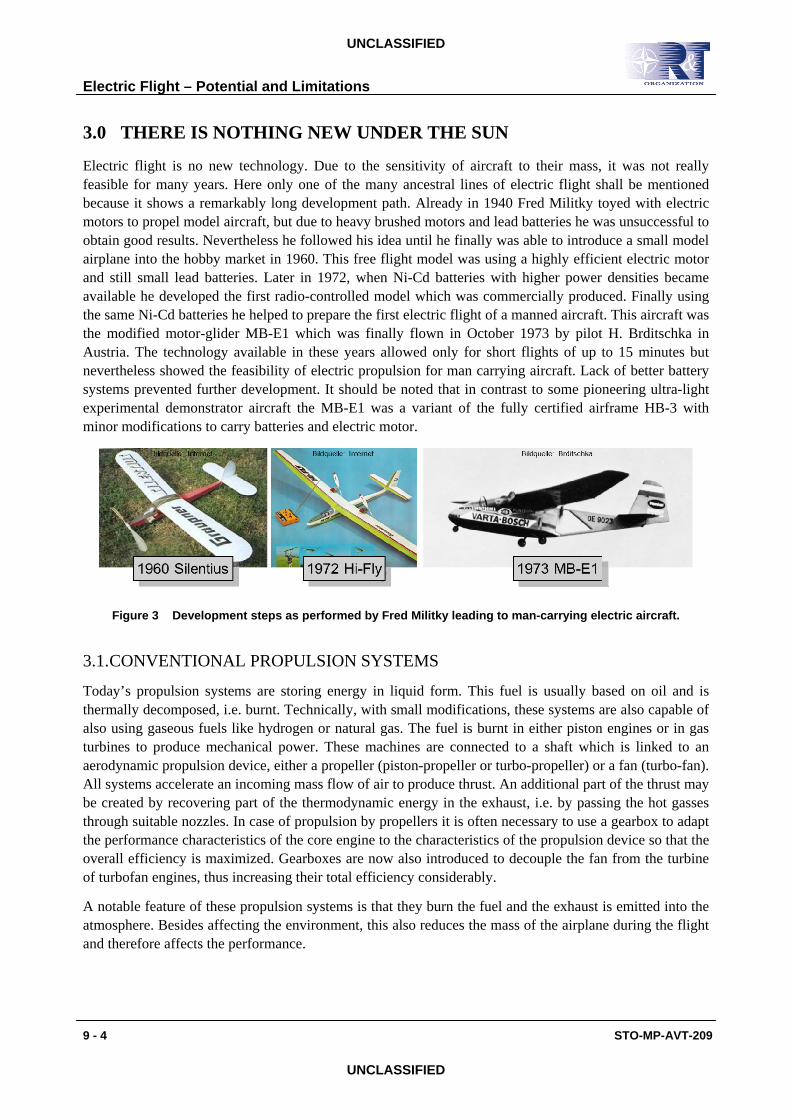
Electric flight is no new technology. Due to the sensitivity of aircraft to their mass, it was not really feasible for many years. Here only one of the many ancestral lines of electric flight shall be mentioned because it shows a remarkably long development path. Already in 1940 Fred Militky toyed with electric motors to propel model aircraft, but due to heavy brushed motors and lead batteries he was unsuccessful to obtain good results. Nevertheless he followed his idea until he finally was able to introduce a small model airplane into the hobby market in 1960. This free flight model was using a highly efficient electric motor and still small lead batteries. Later in 1972, when Ni-Cd batteries with higher power densities became available he developed the first radio-controlled model which was commercially produced. Finally using the same Ni-Cd batteries he helped to prepare the first electric flight of a manned aircraft. This aircraft was the modified motor-glider MB-E1 which was finally flown in October 1973 by pilot H. Brditschka in Austria. The technology available in these years allowed only for short flights of up to 15 minutes but nevertheless showed the feasibility of electric propulsion for man carrying aircraft. Lack of better battery systems prevented further development. It should be noted that in contrast to some pioneering ultra-light experimental demonstrator aircraft the MB-E1 was a variant of the fully certified airframe HB-3 with minor modifications to carry batteries and electric motor.
Figure 3 Development steps as performed by Fred Militky leading to man-carrying electric aircraft.
3.1. CONVENTIONAL PROPULSION SYSTEMS
Today’s propulsion systems are storing energy in liquid form. This fuel is usually based on oil and is thermally decomposed, i.e. burnt. Technically, with small modifications, these systems are also capable of also using gaseous fuels like hydrogen or natural gas. The fuel is burnt in either piston engines or in gas turbines to produce mechanical power. These machines are connected to a shaft which is linked to an aerodynamic propulsion device, either a propeller (piston-propeller or turbo-propeller) or a fan (turbo-fan). All systems accelerate an incoming mass flow of air to produce thrust. An additional part of the thrust may be created by recovering part of the thermodynamic energy in the exhaust, i.e. by passing the hot gasses through suitable nozzles. In case of propulsion by propellers it is often necessary to use a gearbox to adapt the performance characteristics of the core engine to the characteristics of the propulsion device so that the overall efficiency is maximized. Gearboxes are now also introduced to decouple the fan from the turbine of turbofan engines, thus increasing their total efficiency considerably.
A notable feature of these propulsion systems is that they burn the fuel and the exhaust is emitted into the atmosphere. Besides affecting the environment, this also reduces the mass of the airplane during the flight and therefore affects the performance.

Electric Flight – Potential and Limitations
STO-MP-AVT-209 9 - 5
UNCLASSIFIED
UNCLASSIFIED
Kerosene
Bio Fuel
liquid fuel
TurboshaftPiston Engine
Gearbox
H2
H gas2
Turbine
H2
H gas2
TurboshaftPiston Engine
Gearbox
Propeller
Fan
Propeller
Kerosene
Bio Fuel
liquid fuel
Turbine
Fan
Kerosene
Bio Fuel
liquid fuel
TurbineFan
Gearbox
Figure 4 Different propulsion systems exploiting the energy in the fuel by burning it.
3.2. ELECTRIC PROPULSION SYSTEMS
In case of electric propulsion systems there are a large number of possible concepts. They differ in energy storage and conversion. Today mainly two systems are of interest: battery based systems and fuel cell based systems. Both systems are under constant development, driven by automotive and other mobile applications. Most of these developments are currently aiming at power consumptions below 100 kW.
3.2.1 Fuel Cell Systems
These systems store energy in liquid or gaseous form and convert it to electric power by fuel cells. These perform a more or less cold decomposition of the fuel with relatively high efficiency and low emissions. Fuel cell systems have been built for many years for specific applications and a range of power requirements. Still these systems are quite complex and heavy. When the by-products are exhausted to the atmosphere, they lead to a mass reduction during flight like on classical combustion engines. When hydrogen is used for fuel, the emissions contain more water vapor then the emissions of kerosene based fuels and may create more severe contrails in the atmosphere.

Electric Flight – Potential and Limitations
9 - 6 STO-MP-AVT-209
UNCLASSIFIED
UNCLASSIFIED
3.2.2 Turbo-Electric Systems
In [3] one of the main motivations to used turbo-electric drive systems is given by the fact that such a system allows to decouple turbine speed and fan speed and thus may be the enabler for distributed multi-fan propulsion systems. The first argument is weakened by recent developments of highly efficient geared turbofan engines (decoupling turbine and fan allows to increase the overall efficiency by 10-20%). However the second argument still holds some opportunities for the development of distributed propulsion systems to improve the propulsive efficiency. These systems can either be driven by conventional fuel or by hydrogen, which still leads to high emission levels and contrail formation.
3.2.3 Battery Systems
Here the energy is stored in batteries which allows for a direct extraction of electric power. The efficiency is limited by the chemical processes occurring during charging and discharging. In most cases the mass of the system is usually not changing, except for some specific air breathing cells like Li-O2.
Figure 5 Components of different electric propulsion systems.

Electric Flight – Potential and Limitations
STO-MP-AVT-209 9 - 7
UNCLASSIFIED
UNCLASSIFIED
3.2.4 Energy Storage
The energy required for a flight must be stored on-board. For application in aircraft the most important parameters are the energy per mass *E and to a lesser extent the energy per volume *V . These specific values are shown in Figure 6 for various energy storage systems. It can be seen that even the most advanced current battery storage systems fall short of the parameters of Kerosene. While the factor in specific volume is only about 18, the factor in mass specific energy density is in the order of 60. This is a core problem for application in aviation and imposes strict limits for battery powered systems. The lower volume specific energy content is less critical as long as the aircraft design is not limited by internal volume. Otherwise the vehicle would require larger wings or fuselages or additional external “energy pods” which would lead to losses in overall aircraft efficiency due to larger wetted surface. Of course there are ideas to incorporate batteries and other storage systems into the primary structure, but these are still rather far from practical application. In case of fuel cells hydrogen can e.g. be stored in porous metal, but the weight of these foams is very high and appears unsuitable for aeronautical application. However, such systems have been used in marine applications, where the additional mass is less critical. Table 1 lists some characteristics, advantages and disadvantages of energy storage systems.
As a side-note it is interesting to note that some “bio-fuels”, like milk or cream have rather high energy densities – unfortunately efficient high power conversion technology is still lacking.
1
10
100
1000
10000
1 10 100 1000 10000 100000
mass specifc energy E* [Wh/kg]
NiCd-BatteryNiCd-Battery
Pb-BatteryPb-Battery
300 bar compressed air300 bar compressed air
LiOH BatteryLiOH Battery
volu
me
spec
ifc
ener
gy V
*
[Wh/lite
r]
NiMH BatteryNiMH Battery
H O2 2H O2 2
TNTTNT
MethanolMethanol
EthanolEthanol
H liquid2H liquid2
KeroseneKerosene
LPG PropaneLPG Propane
H 1 bar2H 1 bar2
�factor 60�factor 60
�factor 18�factor 18
H 700 bar2H 700 bar2
LiOH Nano-Wire BatteryLiOH Nano-Wire Battery
3.5% Milk3.5% Milk
CreamCream
FlywheelsFlywheels
Figure 6 Volume and mass specific energy characteristics of different energy storage systems.
Electric Flight – Potential and Limitations
9 - 8 STO-MP-AVT-209
UNCLASSIFIED
UNCLASSIFIED
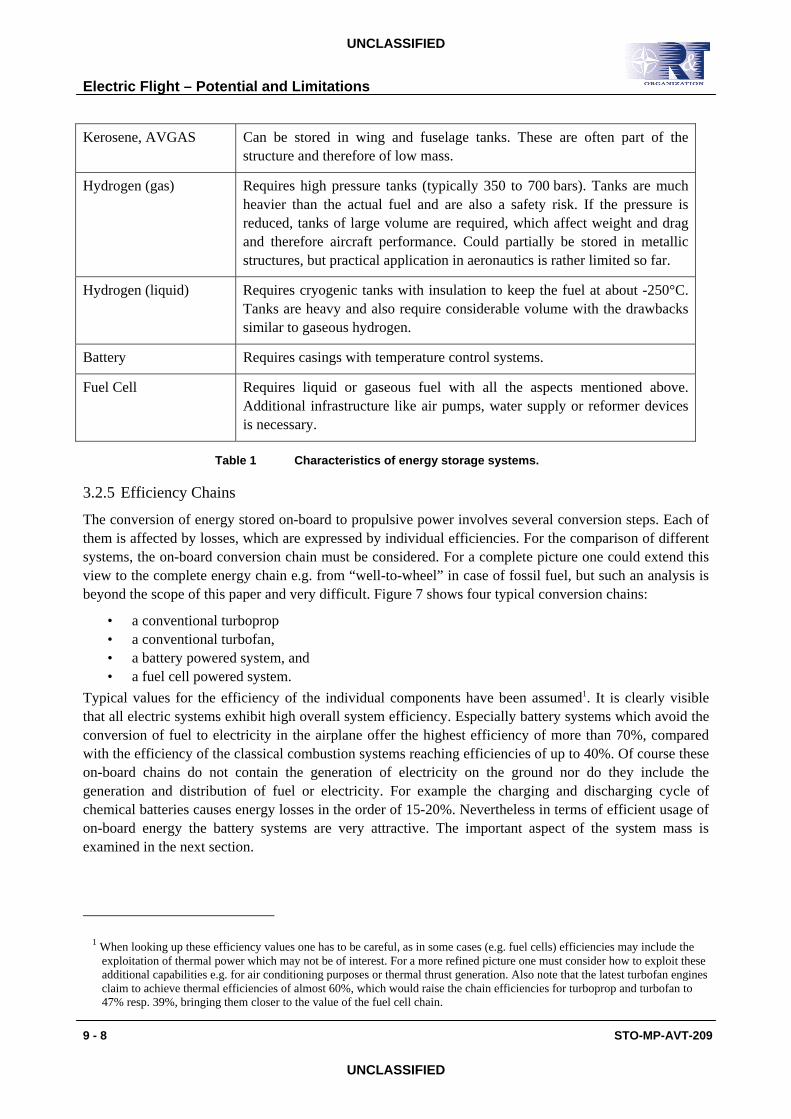
Kerosene, AVGAS Can be stored in wing and fuselage tanks. These are often part of the structure and therefore of low mass.
Hydrogen (gas) Requires high pressure tanks (typically 350 to 700 bars). Tanks are much heavier than the actual fuel and are also a safety risk. If the pressure is reduced, tanks of large volume are required, which affect weight and drag and therefore aircraft performance. Could partially be stored in metallic structures, but practical application in aeronautics is rather limited so far.
Hydrogen (liquid) Requires cryogenic tanks with insulation to keep the fuel at about -250°C. Tanks are heavy and also require considerable volume with the drawbacks similar to gaseous hydrogen.
Battery Requires casings with temperature control systems.
Fuel Cell Requires liquid or gaseous fuel with all the aspects mentioned above. Additional infrastructure like air pumps, water supply or reformer devices is necessary.
Table 1 Characteristics of energy storage systems.
3.2.5 Efficiency Chains
The conversion of energy stored on-board to propulsive power involves several conversion steps. Each of them is affected by losses, which are expressed by individual efficiencies. For the comparison of different systems, the on-board conversion chain must be considered. For a complete picture one could extend this view to the complete energy chain e.g. from “well-to-wheel” in case of fossil fuel, but such an analysis is beyond the scope of this paper and very difficult. Figure 7 shows four typical conversion chains:
• a conventional turboprop • a conventional turbofan, • a battery powered system, and • a fuel cell powered system.
Typical values for the efficiency of the individual components have been assumed1. It is clearly visible that all electric systems exhibit high overall system efficiency. Especially battery systems which avoid the conversion of fuel to electricity in the airplane offer the highest efficiency of more than 70%, compared with the efficiency of the classical combustion systems reaching efficiencies of up to 40%. Of course these on-board chains do not contain the generation of electricity on the ground nor do they include the generation and distribution of fuel or electricity. For example the charging and discharging cycle of chemical batteries causes energy losses in the order of 15-20%. Nevertheless in terms of efficient usage of on-board energy the battery systems are very attractive. The important aspect of the system mass is examined in the next section.
1 When looking up these efficiency values one has to be careful, as in some cases (e.g. fuel cells) efficiencies may include the exploitation of thermal power which may not be of interest. For a more refined picture one must consider how to exploit these additional capabilities e.g. for air conditioning purposes or thermal thrust generation. Also note that the latest turbofan engines claim to achieve thermal efficiencies of almost 60%, which would raise the chain efficiencies for turboprop and turbofan to 47% resp. 39%, bringing them closer to the value of the fuel cell chain.

Electric Flight – Potential and Limitations
STO-MP-AVT-209 9 - 9
UNCLASSIFIED
UNCLASSIFIED
Thermodynamic Cycleη= %50
Fan and Nozzlesη= %65
Kerosene100%
33%33%
Turbofan
Thermodynamic Cycleη= %50
Gearboxη= %98
Kerosene100%
39%39%
Turboprop
Propellerη= %80
Controllerη= %98
Electric Motorη= %95
Propellerη= %80
Battery100%
73%73%
Battery
Gearboxη= %98
Controllerη= %98
Electric Motorη= %95
Propellerη= %80
Hydrogen100%
44%44%
Fuel Cell
Gearboxη= %98
Fuel Cellη= %60
Figure 7 Typical on-board conversion chains with typical component efficiencies and total chain efficiency.
3.2.6 Equivalent Energy Density of Electric Power Sources
In order to compare different electric power sources with a battery system it is necessary to transform their parameters into an equivalent mass specific energy *E of the complete system. First, we compare the systems as electric power sources, i.e. the chain up to the electric connector where the motor controller would be plugged in. Figure 8 relates the stored energy to the mass of the electric power source.
The example assumes identical flight performance of a general aviation airplane requiring a propulsive power of 50 kW for fast cruise. The required energy is determined from the respective efficiency chains so that 100 kWh are finally available for the mission. As the airplane has not been adapted to the mass of the propulsion system, this is yields an optimistic view for the heavier systems.
The mass given below the fuel tanks are for the fuel and the additional mass of the tank with its fuel systems. It can be seen that a high pressure tank for hydrogen outweighs the fuel mass almost by a factor of 20.
In Figure 9 we can add the motor controller and the electric motor so that the chain extends up to the propeller shaft. This allows comparing the chain with an internal combustion engine.
The results show that the classical internal combustion engine offers the lowest mass and hence an effective specific energy of almost 1600 Wh/kg, which is about 14% of the specific energy content of the raw kerosene fuel. This propulsion system is followed by the hybrid electric system which adds a generator and an electric motor to the drive train.

Electric Flight – Potential and Limitations
9 - 10 STO-MP-AVT-209
UNCLASSIFIED
UNCLASSIFIED
Battery E* = 180 Wh/kg
Hydrogen
Fuel Cell
FC
=55%�
(50 kg)
H2 gas
Reformer
=75%�
(33.3 kg)
liquid fuel
Kerosene
(20.5 kg + 12 kg)
Battery
(556 kg)
50kW
0 100 200 300 400 500 600
m [kg]
H2 gas
FC
=55%�
(50 kg)
H
(5.5 kg + 95.5 kg)
2
E* = 862 Wh/kg
(Kerosene: 211 800 Wh/kg)
E* = 862 Wh/kg
(Kerosene: 211 800 Wh/kg)
Kerosene
Reformer
Fuel Cell
700bar
50kW
E* = 662 Wh/kg
(H : 33 306 Wh/kg)2
E* = 662 Wh/kg
(H : 33 306 Wh/kg)2
50kW
E* = 1105 Wh/kg
(Kerosene: 211 800 Wh/kg)
E* = 1105 Wh/kg
(Kerosene: 211 800 Wh/kg)
Kerosene
I/C engine
Generator Generator
=95%�
(25 kg)
shaft
I/C engine
=35%�
(25 kg)
liquid fuel
Kerosene
(25.5 kg + 15 kg)
Fuel Cell
Reformer
Tank
Fuel
I/C engine
Generator
Figure 8 Mass and equivalent energy density of electric power generation systems delivering an electric power of 50 kW for 2 hours.
Battery E* = 172 Wh/kg
Hydrogen
Fuel Cell
50kW
0 100 200 300 400 500 600
m [kg]
E* = 701 Wh/kg
(Kerosene: 211 800 Wh/kg)
E* = 701 Wh/kg
(Kerosene: 211 800 Wh/kg)
Kerosene
Reformer
Fuel Cell
700bar
50kW
E* = 551 Wh/kg
(H : 33 306 Wh/kg)2
E* = 551 Wh/kg
(H : 33 306 Wh/kg)2
E* = 850 Wh/kg
(Kerosene: 211 800 Wh/kg)
E* = 850 Wh/kg
(Kerosene: 211 800 Wh/kg)
Kerosene
I/C engine
Generator
Hybrid
50kW
Fuel Cell
Reformer
Tank
Fuel/Battery
I/C engine
Generator
Electric Motor
E* = 1575 Wh/kg
(Kerosene: 211 800 Wh/kg)
E* = 1575 Wh/kg
(Kerosene: 211 800 Wh/kg)
Kerosene
I/C engine shaft
I/C engine
=35%�
(25 kg)
liquid fuel
Kerosene
(25.5 kg + 15 kg)
Motor
=95%�
(25 kg)
Generator
=95%�
(25 kg)
shaft
I/C engine
=35%�
(25 kg)
liquid fuel
Kerosene
(25.5 kg + 15 kg)
shaft
Motor
=95%�
(25 kg)
Battery
(556 kg)
shaft
Motor
=95%�
(25 kg)
H2 gas
FC
=55%�
(50 kg)
H
(5.5 kg + 95.5 kg)
2
shaft
Motor
=95%�
(25 kg)
FC
=55%�
(50 kg)
H2 gas
Reformer
=75%�
(33.3 kg)
liquid fuel
Kerosene
(20.5 kg + 12 kg)
shaft
Figure 9 Mass and equivalent energy density of propulsion systems providing a shaft power of 50 kW for 2 hours.

Electric Flight – Potential and Limitations
STO-MP-AVT-209 9 - 11
UNCLASSIFIED
UNCLASSIFIED
3.2.7 Battery Technology
Today, most electric powered aircraft are using battery systems of the Lithium-Ion type. These are mass produced mainly as power sources for mobile devices and are readily available. Such batteries can be produced relatively cheap and can be scaled to build larger systems of several hundred kWh energy capacity. Currently available systems provide a mass specific energy content of up to 200 Wh/kg (see Figure 10). Further developments may lead to values in the order of 250 Wh/kg, which is insufficient for automotive and larger aerial applications. Today, the development of other Lithium based battery systems is pushed forward. Lithium-Sulfur and Lithium-Oxygen are two systems on which research and development are focused. While sulfur-based systems have reached practical prototype status (after more than 50 years of development), oxygen based systems are still in their infancy. All these systems offer energy densities which are larger by a factor of about 3 to 10. A very complete survey of Lithium based battery technology is given in [3]. Table 2 contains values taken from this publication and shows the expected development of these systems. Concerning the possible application of the air breathing, oxygen based battery systems in aviation many questions are still open and cannot be expected to be answered within the next 10 years. Therefore it seems to be more realistic to expect the application of sulfur based systems within the next 20 years in mobile applications as well as in unmanned and possibly manned air vehicles.
Figure 10 Specific energy density of current Lithium Ion battery systems.
System theoretical specific energy expected in 2025
Li-Ion (2012) 390 Wh/kg 250 Wh/kg
Zn-air 1090 Wh/kg 400-500 Wh/kg
Li-S 2570 Wh/kg 500-1250 Wh/kg
Li-O2 3500 Wh/kg 800-1750 Wh/kg
Table 2 Specific energy density of current and future chemical battery systems.

Electric Flight – Potential and Limitations
9 - 12 STO-MP-AVT-209
UNCLASSIFIED
UNCLASSIFIED
0 500 1000 1500 2000 2500 3000 3500 4000
Li-Ion (1/2C Li + Li CoO <> 3C + LiCoO )6 0.5 2 2
Zn-air (Zn + 1/2O <> ZnO)2
Li-S (2Li + S <> Li S)2
Li-O (non aqueuous)2 (2Li + O <> Li O )2 2 2
Li-O (aqueuous)2 (2Li + 1/2O + H O <> 2 LiOH)2 2
specific energy [Wh / kg]
expected within next 10-20 years
theorectically possible
today and within next 5 years
Figure 11 Current battery technology and expected development.
3.2.8 Electric Motor Technology
Electric motors for application in aviation must be designed for continuous operation at cruise power. Motors for hybrid automotive applications or for model aircraft are often designed for short power boost applications so that one must be careful when comparing data. Figure 12 plots the power specific mass of various piston engines and electric motors. The few electric motors available today for aircraft propulsion have a power output of less than 100 kW. Large electric motors are also used in trains, ships and submarines, but here the mass is less important. Today it seems to be possible to build electric motors having a specific mass of about 2 to 4 kW/kg. This compares favorably with the specific mass of larger turboshaft and turbofan engines at cruise power (see Figure 13 and Figure 14). Future developments may extend the range of electric motors to values of up to 8 kW/kg, but there is a strong need for the development of lightweight electric motors, specifically designed for application in aircraft. In the literature assumptions of up to 14 (e.g. in [5]) can be found, but assume superconducting motors with cryogenic cooling systems.
0
2
4
6
8
10
12
14
1 10 100 1000 10000 100000
electric motors
piston engines
e-Genius
Antares
Honda FCX
Tesla
NASA
(AIAA-2010-276)
P [kW]
P/m [kW/kg]
BMW V10 F1
GE Marine Turboshaft
GE-90 Turbofan
turbine engines
Figure 12 Specific power density of current piston engines (squares) and electric motors (circles).

Electric Flight – Potential and Limitations
STO-MP-AVT-209 9 - 13
UNCLASSIFIED
UNCLASSIFIED
Figure 13 Specific power density of turboshaft engines.
Figure 14 Specific power density of turbofan engines, derived from cruise thrust.

Electric Flight – Potential and Limitations
9 - 14 STO-MP-AVT-209
UNCLASSIFIED
UNCLASSIFIED
4.0 RANGE EQUATIONS
The range of an aircraft depends on the available energy, the propulsion system, the mass of the aircraft and the aerodynamic properties of the aircraft. The range equations for classical, fuel burning aircraft with variable mass are well known and have been derived for various cruise flight conditions. In case of battery powered electric aircraft the mass of the aircraft stays constant and hence the range equation is simplified.
The range of an aircraft is defined by flight speed and flight time
R v t¥= ⋅ . (1)
In case of a battery powered aircraft, the flight time is equal to the time to drain the battery, which, under ideal conditions, is
*
battery
battery
m Et
P
⋅= . (2)
Inserting this flight time into the definition of the range (1) yields
*
battery
battery
m ER v
P¥
⋅= ⋅ . (3)
The power drawn from the battery is related to the propulsive power required by the aircraft
aircraftbattery
total
PP =
h (4)
where the power required by the aircraft is linked to its weight, lift over drag ratio and flight speed:
aircraft aircraft
m gP D v v
L / D¥ ¥
⋅= ⋅ = ⋅ . (5)
With (5), the battery power (4) finally becomes
battery
total
m gP v
L / D ¥
⋅= ⋅
⋅ h (6)
and can be inserted into equation (3)
*
battery
total
m ER v
m gv
L / D
¥
¥
⋅= ⋅
⋅⋅
⋅ h
. (7)
This equation can be simplified to the range equation for battery electric flight
battery*
total
m1 LR E
g D m= ⋅h ⋅ ⋅ ⋅ . (8)
Interestingly the range is independent of the flight speed v¥ which is only indirectly affecting the result via lift to drag ratio and the total efficiency totalh .
This equation clearly shows that for maximum range the following parameters should be maximized:

Electric Flight – Potential and Limitations
STO-MP-AVT-209 9 - 15
UNCLASSIFIED
UNCLASSIFIED
• the ratio of battery mass to total mass batterym /m , • the specific energy capacity *E of the battery, • the lift over drag ratio L/D , and • the total system efficiency totalh (from battery to propulsive power).
On the other hand
• the aircraft mass m
should be minimized.
0
500
1000
1500
2000
2500
3000
100 200 300 400 500 600 700 800 900 1000
E* [Wh/kg]
�total = 0.75, R for powered level flight
0
1000
2000
3000
4000
5000
6000
R [km]
10
L/D
0
2000
4000
6000
8000
10000
12000
2040
m /m=1.0batterym /m=1.0battery
m /m=0.8batterym /m=0.8battery
m /m=0.6batterym /m=0.6battery
m /m=0.4batterym /m=0.4battery
m /m=0.2batterym /m=0.2battery
battery *total
m L 1R E
m D g� � � � � �
Status2012
Status2012
Figure 15 Range versus specific energy for different battery mass fractions. The vertical axes are for three different ratios of lift over drag, ranging from small General Aviation aircraft to sailplanes.
The range obtained from this equation is plotted in Figure 15 versus the specific energy of the battery system *E . The shaded triangle indicates the range of technically feasible battery mass fractions. It can be seen that for larger ranges the battery technology must be improved to at least five-fold values compared to the state in 2012.
Comparing the range equation for battery powered aircraft with one form of the classical range equation for kerosene burning jet engines
*
total
fuel
1 L 1R E ln
g D 1 m / m
öæ ÷ç ÷ç= ⋅ h ⋅ ⋅ ⋅ ÷ç ÷÷ç -è ø. (9)
shows that the two equations only differ in the last term. Figure 16 compares this term for aircraft having different fuel mass fractions respectively ranges. It can be seen that the drawback of maintaining constant mass increases with range and may grow to more than 20% for long range flights. This drawback is inherent in battery powered aircraft and must be compensated by additional energy respectively efficiency.

Electric Flight – Potential and Limitations
9 - 16 STO-MP-AVT-209
UNCLASSIFIED
UNCLASSIFIED
0
0.1
0.2
0.3
0.4
0.5
0.6
0.7
0 0.05 0.1 0.15 0.2 0.25 0.3 0.35 0.4 0.45 0.5
m/mf
ln(1/(1-m/m))f
Boeing 747 SP
Cessna 182
23% low
6% low
m/mf
battery*total
m1 LR E
g D m� � � � � �
*total
fuel
1 L 1R E ln mg D 1
m
� �� � � �� � � � � � � � ��� �
ln(1
/(1-
m/m
))f
m/m f
Figure 16 Range terms versus fuel respectively battery mass fraction.
4.1. MAXIMUM RANGE
To gain more insight into typical aircraft design parameters we replace the battery mass
battery empty payloadm m m m= - - (10)
to obtain
empty payload*
total
m m1 LR E 1
g D m m
öæ ÷ç ÷ç= ⋅ h ⋅ ⋅ ⋅ - - ÷ç ÷ç ÷÷çè ø. (11)
Reducing the payload mass to zero allows finding the ultimate range
empty*
ultimate total
m1 LR E 1
g D m
öæ ÷ç ÷ç= ⋅ ⋅ h ⋅ ⋅ - ÷ç ÷ç ÷÷çè ø. (12)
For the given technology parameters, this range can never be exceeded. Also note that for this hypothetical range the aircraft mass would grow to infinity. Therefore the practical range must be lower that this hard limit.
Equation (11) can be solved for the airplane mass which is required for a desired range and payload using a given technology level in structures, aerodynamics and propulsion system:
payload
e *
total
PAX mm
g1 f R
E L / D
⋅=
- - ⋅⋅ h ⋅
. (13)

Electric Flight – Potential and Limitations
STO-MP-AVT-209 9 - 17
UNCLASSIFIED
UNCLASSIFIED
Equation (13) can be used for a very quick first order assessment of the required size of an airplane, using only a few basic technology parameters. The structural design of the aircraft is represented by the empty mass fraction e emptyf m /m= ; for a given structural technology and typical design parameters, like aspect ratio and wing thickness, one can assume a certain value for ef (which is typically between 0.4 and 0.7, see Figure 17). Of course, this ratio should be as low as possible to obtain the lowest aircraft mass. The aerodynamics is represented by the lift over drag ratio, which should as large as possible to minimize the mass.
In order to obtain a valid solution of (13) with a finite and positive aircraft mass the following conditions must be fulfilled:
The lift over drag ratio must be at least
( ) *
e total
L R g
D 1 f E
⋅>
- ⋅ ⋅ h, (14)
the specific energy of the battery must be larger than
( )
*
e total
R gE
1 f L / D
⋅>
- ⋅ h ⋅, (15)
and the empty mass fraction of the aircraft must be lower than
e *
total
R gf 1
E L / D
⋅< -
⋅ h ⋅. (16)
These limits are independent of the payload and can be used to define the required technology level in each discipline or to judge the feasibility of a proposed concept. If a design does not fulfill these constraints, it is unfeasible with the given the technology.
0
0.2
0.4
0.6
0.8
1
1000 10000 100000 1000000
takeoff mass [kg]
empty
mas
s /
take
off m
ass
propellerturbofan
approximation
AirbusBoeing
light airplanes
Figure 17 Empty mass fraction of aircraft versus take-off mass.

Electric Flight – Potential and Limitations
9 - 18 STO-MP-AVT-209
UNCLASSIFIED
UNCLASSIFIED
A more realistic range limit can be found by monitoring the mass growth per range increase. Differentiating (13) with respect to the range yields the mass growth per distance for a design for a given range
pax
2
*e total*
total
PAX m gm
R g R1 f E L / D
E L / D
⋅ ⋅¶=
¶ öæ ⋅ ÷ç ÷ç - - ⋅ ⋅ h ⋅÷ç ÷ç ÷⋅ h ⋅è ø
, (17)
where the payload mass has been replaced by payload paxm PAX m= ⋅ .
If we limit the mass growth per distance to a certain limit value ( )*m/ R¶ ¶ , we can solve (17) for the limit range maxR
( )ultimate
pax* *max total e total*
R
PAX mL 1 1 LR E 1 f E
D g g Dm
R
⋅= ⋅ h ⋅ ⋅ ⋅ - - ⋅ ⋅ ⋅ h ⋅
öæ¶ ÷ç ÷ç ÷ç ÷ç¶è ø
. (18)
The first term in this equation equals equation (12), the second term corresponds to the range reduction imposed by the mass growth limit.
A more complete analysis of existing and prospective electric aircraft showed that the acceptable mass growth depends on aircraft mass: for heavier aircraft a higher limit can be accepted. Based on the numerical results, the following empirical relation has been developed:
*
1.27m 1 kgm
R 4200 km
öæ é ù¶ ÷ç ê ú÷ = ⋅ç ÷ç ê ú÷ç¶è ø ë û. (19)
For lightweight single seat aircraft (m = 1000 kg) this equation yields limit values in the order of 1 kg/km, while the limit for heavy regional aircraft (m = 15 tons) reaches values of 50 kg/km.
Numerical values for a hypothetical 30 seat regional aircraft are shown in Figure 18. The realistic range limit is indicated by symbols. Two ways of exploiting an increase of the specific energy *E from 200 to 400 Wh/kg are shown. First one can maintain the aircraft mass and move horizontally to double the range from 325 to 650 km. At this point (hollow symbol) the mass growth limit is not yet reached so that the practical range can be extended further to about 820 km. Alternatively one could move vertically down, maintaining the range but reducing the aircraft mass from about 14 tons to 8.5 tons.

Electric Flight – Potential and Limitations
STO-MP-AVT-209 9 - 19
UNCLASSIFIED
UNCLASSIFIED
Figure 18 Total mass and battery mass for two values of the specific energy E* versus range. The solid sym-bols indicate the range limit imposed by a prescribed mass growth gradient dm/dR.
4.2. RANGE SENSITIVITIES
Equation 11 shows that in order to achieve maximum range for a given aircraft mass one should of course minimize the empty mass fraction e emptyf m /m= as well as the payload mass fraction
p payloadf m /m= so that the battery mass is maximized. At the same time one should also maximize the lift over drag ratio L/D . The sensitivities of equation 11 with respect to the mass parameters ef and pf
*total
e p
R R 1 LE
f f g D
¶ ¶= = - ⋅ ⋅ h ⋅
¶ ¶. (20)
show that a change in empty weight or payload weight fraction is more critical when the ratio L/D and the system efficiency totalh are high. The sensitivity with respect to the total mass
*
total battery 2
R 1 L 1E m
m g D m
¶= - ⋅ ⋅ h ⋅ ⋅ ⋅
¶ (21)
shows a strong dependency on the inverse of the mass. A lightweight aircraft is more sensible to a change in mass than a heavy aircraft.
The impact of the lift to drag ratio can be assessed from
( ) *e p total
R 11 f f E
L / D g
¶= - - ⋅ ⋅ ⋅ h
¶, (22)
which demonstrates that a lightweight aircraft is more sensitive to changes in L/D . Concerning the effect of the battery technology, the derivative is similar:
( )e p total*
R 11 f f L / D
gE
¶= - - ⋅ ⋅ h ⋅
¶. (23)

Electric Flight – Potential and Limitations
9 - 20 STO-MP-AVT-209
UNCLASSIFIED
UNCLASSIFIED
These sensitivities can be used to assess the robustness of a design with respect to changes in operating parameters. A numerical example is shown in Table 3 to demonstrate these sensitivities. The right hand side of the table shows the effect on range of increasing a parameter by 10% respectively of increasing the number of passengers by one. Additionally, derived sensitivities can be used to “trade” one discipline for another discipline; for example the derivative *
eE / f¶ ¶ shows that an increase of 10% of the empty mass
fraction (efD = 0.053) is has the same impact on range as a decrease of the specific energy of the battery
system by *ED = -31.9 Wh/kg.
assumptions
results
*E 200 Wh/kg maxR 173.1 km
L / D 16.35 - * *R / E 10% E¶ ¶ ⋅ ⋅ 28.2 km
ef 0.53 -
e eR / f 10% f¶ ¶ ⋅ ⋅ -44.9 km
totalh 0.7 - R / L / D 10% L / D¶ ¶ ⋅ ⋅ 28.2 km
PAX 32 - R / PAX¶ ¶ -3.4 km
paxm 90 kg derived sensitivity
( )*m / R¶ ¶ 52 kg/km *
e eE / f 10% f¶ ¶ ⋅ ⋅ -31.9 Wh/kg
Table 3 Set of parameters (left) for an electric powered aircraft and its range sensitivities (right). Note
that the assumed L/D ratio is lower than in Figure 18, therefore the range is lower.

Electric Flight – Potential and Limitations
STO-MP-AVT-209 9 - 21
UNCLASSIFIED
UNCLASSIFIED
5.0 ELECTRIC PROPULSION FOR REGIONAL AIRCRAFT
In order to assess the potential of an electric propulsion system in larger aircraft a more complete mission simulation tool was developed. Here the mission consists of a climb, a cruise and a descent segment. For each segment the aircraft is flown at minimum energy consumption. The simulation performs the time integration over the three segments for a given aircraft and propulsion system model.
�
climb
cruise
descent
x
z Rangetime
�
no reserves!
Figure 19 Simplified mission profile.
5.1. CLIMB SEGMENT
This segment is defined by either climb angle or climb rate. The simulation then determines the optimum flight speed for each altitude so that the energy drawn from the battery per altitude
batterydE / dz is
minimized. It is important to include the efficiency of the propulsion system to avoid the trivial solution of a vertical climb which provides minimum energy consumption of the airframe alone (Figure 20).
0
5
10
15
20
0 20 40 60 80 100
energy required by aircraftenergy required by aircraft
dE/dz [Wh/m]
� [°]
energy drawn from batteryenergy drawn from battery
min
min
90
Figure 20 Energy consumed per altitude for the aircraft and for the aircraft with propulsion system chain. The trivial optimum for the airframe would be to climb vertically and as slow as possible to
minimize total drag. Including the efficiency of the propulsion system yields a realistic minimum.

Electric Flight – Potential and Limitations
9 - 22 STO-MP-AVT-209
UNCLASSIFIED
UNCLASSIFIED
5.2. CRUISE SEGMENT
During cruise, the optimum flight speed is determined so that dE / dx is minimized. Again, the efficiency of the propulsion system chain including the propeller is taken into account, so that the optimum speed is not identical to the optimum of the aircraft alone.
5.3. DESCENT SEGMENT
The descent segment is flown with a given descent angle, which is steeper than the maximum of lift over drag ratio of the airframe to minimize the energy consumption. During this flight phase only auxiliary power for the aircraft systems has to be provided by the battery. No recuperation is considered here due to the high drag and low efficiency of the windmilling propellers, which would allow to recover about 5% of the total energy (in case of a 500 km flight of a regional aircraft at H = 3000 m the potential energy m g H⋅ ⋅ is about 20% of the total energy consumed during the flight).
5.4. APPLICATION
Applying this simulation model to a specific aircraft allows determining the possible performance and the technology improvements required to achieve the desired results. As a test case a regional aircraft similar to the Dornier Do 328 turboprop aircraft was modeled. Step by step several modifications were performed to optimize the aircraft for the electric propulsion system.
The range of the original aircraft with 32 passengers is about 1200 km. With a reduced payload of 28 passengers the maximum range is approximately 2200 km, while the lift-to-drag ratio is around 16.
The first modification consists of simply replacing the conventional fuel system and the turboprop engines with a battery electric system having the same mass. Using current (2012) technology this aircraft would reach a range of 202 km. The flight time would be about 40 minutes. Cruise speed would be about 300 km/h.
If an additional reserve of 30 minutes for holding at the destination airport would have to be considered, the practical range would drop to 50 km.
Figure 21 Modified baseline aircraft with drop-in electric propulsion system.

Electric Flight – Potential and Limitations
STO-MP-AVT-209 9 - 23
UNCLASSIFIED
UNCLASSIFIED
The next step tries to improve the aerodynamic performance by reducing the zero lift drag coefficient by 20%.
This could be achieved by optimizing the installation of the propulsion system (smaller nacelles or fully integrated motors, less cooling air flow) as well as many other detail improvements.
Part of these improvements could be achieved by introducing laminar flow on the wing and on the tailplanes. This is feasible as the wing is unswept and may be produced in composite material with the required smoothness.
Due to the lower drag, the optimum cruise speed would increase to 330 km/h. However, as the zero lift drag is only about half the total drag, this modification would increase the range by only 10% to 221 km.
Figure 22 Modified aircraft with reduced zero lift drag.
Next the induced drag is reduced through an increase in wing span of 50% without increasing the wing mass and the wing area. The new wing span is now 31.5 m compared to the initial 21.0 m.
This change would require substantial changes to the structure, possibly the introduction of a strut braced wing concept (while maintaining zero lift drag) and an optimized composite structure.
This modification would increase the range by about 40% to 302 km.
The higher aspect ratio would move the energy minimum to a lower cruise speed of 275 km/h.
Figure 23 Modified aircraft with increased wing span.

Electric Flight – Potential and Limitations
9 - 24 STO-MP-AVT-209
UNCLASSIFIED
UNCLASSIFIED
The next modification would reduce the empty mass of the aircraft by 20%. This would require introducing extreme lightweight design features. As many components are unlikely to be reduced in mass the main structural components would have to be reduced by probably 30%.
This modification would increase the range by another 10% to 339 km. Due to the lower mass, the optimum flight speed would be about 255 km/h.
Figure 24 Modified aircraft with reduced mass.
This step improves the battery technology by doubling the mass specific energy *E . Such an improvement is quite well possible with future development of Li-S battery systems within the next 15 years.
This modification would double the range to 711 km so that it at least comes into the order of the kerosene based aircraft.
Nevertheless, there is still a factor of 3 in range missing. In order to achieve the range of the original aircraft, the battery technology would have to be improved by this factor, i.e. a factor of 6 compared to todays (2012) technology.
Figure 25 Modified aircraft with improved battery technology.

Electric Flight – Potential and Limitations
STO-MP-AVT-209 9 - 25
UNCLASSIFIED
UNCLASSIFIED
The last modification doubles the mass specific energy density of the battery system again. Such an improvement may be possible with future development of Li-S battery systems in the next 30 years.
This modification would double the range again to 1455 km so that it is almost identical to the kerosene based aircraft. Such an aircraft could be operated profitable if the technology would be available at reasonable costs. Furthermore new infrastructure to replace and recharge the batteries on each airport would be required to make such an aircraft feasible.
However one must consider that this improvement also includes many very optimistic assumptions and improvements in structures and aerodynamics. Just using the improved batteries in the electrified baseline aircraft 328 E would lead to a range of 800 km at the same specific energy consumption of 124 Wh/PAX/km.
Figure 26 Modified aircraft with further improved battery technology.
Rult. Rult. Rult.
0
500
1000
1500
2000
2500
3000
3500
0 500 1000 1500 2000 2500 3000 3500 4000
Range [km]
Payload [kg]
328 E328 E
E* = 180E* = 180 360360 720720
328 TP328 TP
Rult.
1980 Wh/kg1980 Wh/kg
Rult.
16201620
Figure 27 Payload-range chart of the baseline and the electrified aircraft.
Comparing the payload-range characteristics of the baseline turboprop aircraft and the battery powered electric aircraft shows that trading payload for fuel respectively battery has a very beneficial effect in case of kerosene because of its high specific energy. The gain in case of the electric aircraft is smaller, even if the design range and payload are similar. As can be seen, the gradient depends on the specific energy

Electric Flight – Potential and Limitations
9 - 26 STO-MP-AVT-209
UNCLASSIFIED
UNCLASSIFIED
content *E of the battery system, which is always lower than that of kerosene. This means that the range flexibility of the battery powered aircraft is more limited than that of the kerosene powered turboprop variant. Similar payload range capability is obtained when the specific energy of the battery system exceeds about 1500 Wh/kg.
If, on the other hand, the final extremely modified aircraft 328-LBME2 would be equipped with a current turbo-prop engine, its fuel consumption would be as low as 1.5 liters per passenger per 100 km, which is about half that of the baseline aircraft.
6.0 CONCLUSIONS
Practical battery electric powered airplanes are today limited to small vehicles up to 2 passengers and by rather short ranges and endurance. Neglecting costs, the current technology is suitable for small Ultra-Light aircraft, but not for commercial aviation. In order to power larger aircraft a dramatic improvement in battery technology would be required. Comparing with today’s technology with specific energy values of 150 to 200 Wh/kg, the mass specific energy density would have to be increased at least by a factor of 5 to become useful. More realistic this factor would have to be in the order of 10 to attract commercial interest for larger (regional) aircraft. In this context we must note that all numerical studies presented in this paper did not consider reserves as required for commercial aircraft. These would add 30 to 45 minutes of flight time for holding at the destination airport and deviations.
Currently there is a lot of development in battery technology, mostly driven by mobile devices and by automotive applications. Development history hints that the required improvements may take about 20-40 years until they may become available.
Besides these basic considerations, there are still many questions which have to be and which are currently addressed:
• how does the total energy balance and the environmental footprint including manufacturing look like?
• are there enough raw materials for battery production (automotive plus aviation) available? • how to achieve the required level of safety and how to adapt certification rules? • which infrastructure and investment is required at the airport for battery replacement and
recharging? • how can the low noise features of electric propulsion systems be exploited better? • how does the battery technology compare to future fuel cell technology developments? • how do fuel cell powered aircraft compare to aircraft burning synthetic fuels or hydrogen?
Returning to the historic flight of the MB-E1 we can apply the same numeric analysis to study the option of repeating the experiment with the technology readily available in 2012. We can replace the Ni-Cd batteries ( *E = 20 Wh/kg) with Li-OH cells ( *E =180 Wh/kg) of the same mass and the brushed electric forklift motor ( h = 66%) with a specifically designed brushless motor ( h = 90%). This simple modification would extend the powered flight time of the MB-E1 from 7 minutes to 2 hours and 33 minutes. The range of the aircraft would grow from 17 km to 261 km. Mainly due to the improved efficiency of the electric motor the energy consumption of the single passenger (the pilot) per distance would be almost halved from *E = 135 Wh/PAX/km to *E = 80.8 Wh/PAX/km.

Electric Flight – Potential and Limitations
STO-MP-AVT-209 9 - 27
UNCLASSIFIED
UNCLASSIFIED
7.0 REFERENCES
[1] Airbus Global Market Forecast 2012 – 2031. http://www.airbus.com/company/market/forecast/, [retrieved 25 September 2012].
[2] World Economic Outlook April 2011, International Monetary Fund, ISBN 978-1-61635-059-8, http://www.imf.org/external/pubs/ft/weo/2011/01/, [retrieved 25 September 2012].
[3] C. A. Luongo, P. J. Masson, T. Nam, D. Mavris, H. D. Kim, G. V. Brown, M. Waters, D. Hall, “Next Generation More-Electric Aircraft: A Potential Application for HTS Superconductors”, IEEE Transactions on Applied Superconductivity, Vol 19, No. 3, pp. 1055-1068, 2009.
[4] P. G. Bruce, S. A. Freunberger, J. J. Hardwick, J.-M. Tarascon, “Li-O2 and Li-S batteries with high energy storage”, nature materials, Vol. 11, January 2012, Macmillan Publishers, 2012.
[5] A. R. Gibson, D. Hall, M. Waters, B. Schiltgen, T. Foster, J. Keuth, P. Masson, “The Potential and Challenge of TurboElectric Propulsion for Subsonic Transport Aircraft”, AIAA 2010-276, 48th AIAA Aerospace Sciences Meeting, 4-7 January 2010, Orlando, USA, 2010.
[6] A. S. Gohardani, G. Doulgeris, R. Singh, “Challenges of future aircraft propulsion: A review of distributed propulsion technology and its potential application for the all-electric commercial aircraft”, Progress in Aerospace Sciences, Vol. 47, pp.369-391, 2011.
[7] B. Sørensen, “Energy Storage”, Annual Review of Energy, Vol. 9, pp. 1-29, 1984.
[8] C. M. Shepherd, “Theoretical Design of Primary and Secondary Cells – Part III – Battery Discharge Equation”, U. S. Navy Research Laboratory Report 5908, .1963
[9] L. M. Nicolai, “Fundamentals of Aircraft Design”, METS Inc., 1984.
[10] D. P. Raymer, “Aircraft Design, A Conceptual Approach”, American Institute of Aeronautics and Astronautics, AIAA, 2nd edition, 1992.
[11] J. D. Anderson, “Aircraft Performance and Design”, McGraw-Hill, 1999.
[12] “Jane's All the World's Aircraft 2004-2005”, Jane’s Information Group Ltd., 2004.
[13] J. B. Heywood, “Internal Combustion Engines Fundamentals”, McGraw-Hill, 1988.
[14] Pipistel Taurus technical data, http://www.pipistrel.si/plane/taurus-electro/technical-data, [retrieved 12 October 2011].
[15] “Electric powered glider Lange Antares 20E”, http://www.lange-flugzeugbau.com/ [retrieved 27 June 2010].
[16] “Solar powered airplane Solar Impulse”, http://www.solarimpulse.com/ [retrieved 27 June 2010].
[17] R. Eppler, M. Hepperle, “A procedure for Propeller Design by Inverse Methods”, proceedings of the “International Conference on Inverse Design Concepts in Engineering Sciences” (ICIDES), pp. 445-460, Austin, October 17-18, 1984.
[18] E. Obert, “Aerodynamic Design of Transport Aircraft”, IOS Press, 2009.
[19] Nuvera Fuel Cells, http://www.nuvera.com/, [retrieved 1 November 2011].

Electric Flight – Potential and Limitations
9 - 28 STO-MP-AVT-209
UNCLASSIFIED
UNCLASSIFIED
[20] Anonymous, “Hydrogen, new energy technologies”, Commissariat à l'Énergie Atomique et aux Énergies Alternatives, Clefs CEA n°50/51, http://www.cea.fr/var/cea/storage/static/gb/library/Clefs50/contents.htm, [retrieved 11 November 2011].
[21] L. Chick, “Assessment of Solid Oxide Fuel Cell Power System for Greener Commercial Aircraft, Pacific Northwest National Laboratory, http://www.hydrogen.energy.gov/pdfs/review11/mt001_chick_2011_o.pdf, [retrieved 8 November 2011].
[22] C. Svoboda, “Turbofan engine database as a preliminary design tool”, Aircraft Design, Volume 3, 2000, pp.17-31.
[23] K. Hayashi, M. Yokoo, Y. Yoshida, H. Arai, “Solid Oxide Fuel Cell Stack with High Electrical Efficiency”, NTT Technical Review, NTT Energy and Environment Systems Laboratories, Japan, https://www.ntt-review.jp/archive/ntttechnical.php?contents=ntr200910sf3.pdf&mode=show_pdf, [retrieved 11 November 2011].
[24] The Green Box Systems Group, “Combined Heat and Power Systems”, University of Strathclyde, Glasgow, http://www.esru.strath.ac.uk/EandE/Web_sites/99-00/bio_fuel_cells/groupproject/library/chp/text.htm, [retrieved 9 October 2012].
[25] Anonymous, „328 Turboprop Fact Sheet“, 328 Support Services GmbH, www.328support.de, 2006.
[26] O. Tremblay1, L.-A. Dessaint, „Experimental Validation of a Battery Dynamic Model for EV Applications“, World Electric Vehicle Journal Vol. 3, 2009.
[27] K. M. Abraham, „A Brief History of Non-aqueous Metal-Air Batteries“, ECS Transactions, 3 (42) 67-71, The Electrochemical Society, 2008.
[28] European Aviation Safety Agency, EASA Type-Certificate for Lange Flugzeugbau EA 42 series engines, E.015, 2006.
[29] European Aviation Safety Agency, EASA Type-Certificate for Lange Flugzeugbau E1 Antares, TCDS No. A.092, 2006.
[30] C. Chiang, C. Herwerth, M. Mirmirani, A. Ko, S. Matsuyama, S. B. Choi, N. Nomnawee, „Systems Integration of a Hybrid PEM Fuel Cell/Battery Powered Endurance UAV“, AIAA 2008-151, 46th AIAA Aerospace Sciences Meeting and Exhibit, 7 - 10 January 2008, Reno, 2008
[31] K. A. Burke, „Fuel Cells for Space Science Applications“, AIAA-2003-5938, NASA TM-2003-212730, 2003.
[32] I. Moysan, „Onboard Storage of Hydrogen“, CLEFS CEA, No 50/51, Winter 2004-2005, 2005.
[33] H. W. Brandhorst, P. R. K. Chettyt, M. J. Doherty, G. L. Bennett, „Technologies for Spacecraft Electric Power Systems“, Journal of Propulsion and Power, Vol. 12, No. 5, 1996.
[34] J. Schindler, W. Zittel, “Zukunft der weltweiten Erdölversorgung”, 2008, http://www.lbst.de/ressources/studies_d.html, [retrieved 10 October 2012].
[35] International Energy Agency, “World Energy Outlook 2006”, Paris, 2006

Electric Flight – Potential and Limitations
STO-MP-AVT-209 9 - 29
UNCLASSIFIED
UNCLASSIFIED
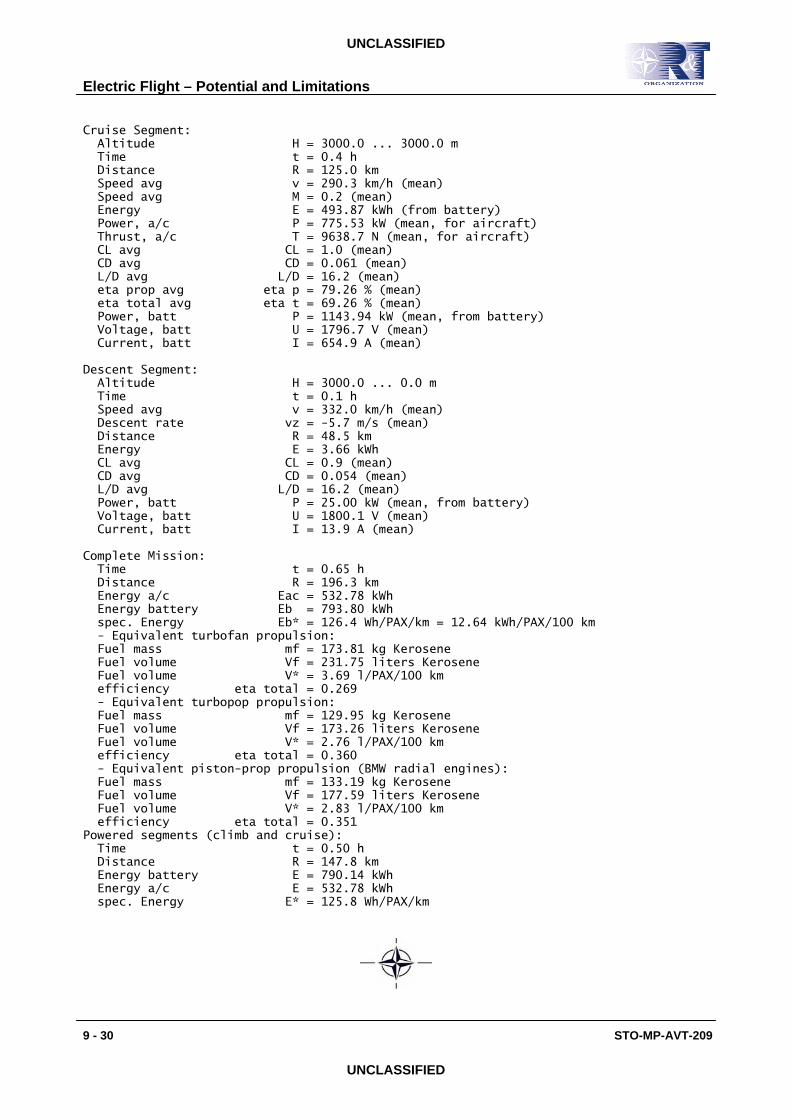
8.0 APPENDIX – RESULTS FOR BASELINE AIRCRAFT “328 E” Aircraft: Name Do 328 E Wing span b = 20.98 m Wing area S = 40.00 m^2 Aspect ratio AR = 11.00 k-Factor k = 1.060 L/D max L/D = 16.16 v_EAS(L/D max) v = 79.8 m/s = 287.1 km/h v_stall v stall = 53.7 m/s = 193.5 km/h climb CD0 = 0.0321 cruise CD0 = 0.0312 descent CD0 = 0.0306 passenger+crew load PAX = 32 @ 90.0 kg Mass total m = 15880.0 kg Mass empty me = 8500.0 kg Mass payload mp = 2880.0 kg (32 PAX) wing box volume Vw = 3260.1 liters empty weight fraction me/m = 0.535 payload weight fraction mp/m = 0.181 battery weight fraction mb/m = 0.283 wing loading m/S = 397.00 kg/m^2 span loading m/b^2 = 36.08 kg/m^2 range factor (m/b^2)/(m/S) = 0.091 ultimate range R ult = 347.4 km Range sensitivities for 51.5 kg/km, eta_total = 0.700: max. powered range R max = 143.0 km specific energy dR/dE* = 24.5 km/10% empty mass fraction dR/dfe = -40.0 km/10% lift over drag dR/d(L/D) = 24.5 km/10% passenger count dR/dPAX = -3.2 km/PAX payload distance E/(R*mp) = 119.5 - 138.0 Wh/km/PAX (range - endurance specific energy dE*/dfe = -29.4 Wh/kg/10% Battery: Energy E = 793.80 kWh Mass mb = 4500.0 kg Volume V = 793.8 liters Voltage U = 1800.0 V Capacity C = 441.0 Ah C spec. E* = 180.0 Wh/kg Limit I I max = 2205.0 A (5*C/h) Limit P P max = 3969.0 kW (5*C/h) Climb Segment: prescribed climb angle theta = 7.5 degrees. Altitude H = 0.0 ... 3000.0 m Time t = 0.1 h Distance R = 22.8 km Speed avg v = 333.7 km/h (mean) Climb rate vz = 12.1 m/s (mean) Energy E = 296.26 kWh (from battery) Power, a/c P = 2798.55 kW (mean, for aircraft) Thrust, a/c T = 30189.1 N (mean, for aircraft) CL avg CL = 0.8 (mean) CD avg CD = 0.054 (mean) L/D avg L/D = 15.655 (mean) eta, prop avg eta = 74.88 % (mean) eta total avg eta t = 65.44 % (mean) Power, batt P = 4296.77 kW (mean, from battery) Voltage, batt U = 1812.3 V (mean) Current, batt I = 2389.9 A (mean)
Electric Flight – Potential and Limitations
9 - 30 STO-MP-AVT-209
UNCLASSIFIED
UNCLASSIFIED
Cruise Segment: Altitude H = 3000.0 ... 3000.0 m Time t = 0.4 h Distance R = 125.0 km Speed avg v = 290.3 km/h (mean) Speed avg M = 0.2 (mean) Energy E = 493.87 kWh (from battery) Power, a/c P = 775.53 kW (mean, for aircraft) Thrust, a/c T = 9638.7 N (mean, for aircraft) CL avg CL = 1.0 (mean) CD avg CD = 0.061 (mean) L/D avg L/D = 16.2 (mean) eta prop avg eta p = 79.26 % (mean) eta total avg eta t = 69.26 % (mean) Power, batt P = 1143.94 kW (mean, from battery) Voltage, batt U = 1796.7 V (mean) Current, batt I = 654.9 A (mean) Descent Segment: Altitude H = 3000.0 ... 0.0 m Time t = 0.1 h Speed avg v = 332.0 km/h (mean) Descent rate vz = -5.7 m/s (mean) Distance R = 48.5 km Energy E = 3.66 kWh CL avg CL = 0.9 (mean) CD avg CD = 0.054 (mean) L/D avg L/D = 16.2 (mean) Power, batt P = 25.00 kW (mean, from battery) Voltage, batt U = 1800.1 V (mean) Current, batt I = 13.9 A (mean) Complete Mission: Time t = 0.65 h Distance R = 196.3 km Energy a/c Eac = 532.78 kWh Energy battery Eb = 793.80 kWh spec. Energy Eb* = 126.4 Wh/PAX/km = 12.64 kWh/PAX/100 km - Equivalent turbofan propulsion: Fuel mass mf = 173.81 kg Kerosene Fuel volume Vf = 231.75 liters Kerosene Fuel volume V* = 3.69 l/PAX/100 km efficiency eta total = 0.269 - Equivalent turbopop propulsion: Fuel mass mf = 129.95 kg Kerosene Fuel volume Vf = 173.26 liters Kerosene Fuel volume V* = 2.76 l/PAX/100 km efficiency eta total = 0.360 - Equivalent piston-prop propulsion (BMW radial engines): Fuel mass mf = 133.19 kg Kerosene Fuel volume Vf = 177.59 liters Kerosene Fuel volume V* = 2.83 l/PAX/100 km efficiency eta total = 0.351 Powered segments (climb and cruise): Time t = 0.50 h Distance R = 147.8 km Energy battery E = 790.14 kWh Energy a/c E = 532.78 kWh spec. Energy E* = 125.8 Wh/PAX/km