electric energy converter development and diagnostics in
TRANSCRIPT
ACTA IMEKO ISSN: 2221-870X March 2018, Volume 7, Number 1, 20-26
ACTA IMEKO | www.imeko.org March 2018 | Volume 7 | Number 1 | 20
Electric energy converter development and diagnostics in mixed-signal simulation environment Gábor Kohlrusz, Krisztián Enisz, Bence Csomós, Dénes Fodor
Dept. of Automotive Mechatronics, Institute of Mechanical Engineering, University of Pannonia, Egyetem 10, 8200 Veszprém,Hungary
Section: RESEARCH PAPER
Keywords: Discrete Fourier Transform; digitally controlled converter; capacitor degradation diagnostics; mixed-signal simulation
Citation: Gábor Kohlrusz, Krisztián Enisz, Bence Csomós, Dénes Fodor, Electric energy converter development and diagnostics in mixed-signal simulation environment, Acta IMEKO, vol. 7, no. 1, article 5, March 2018, identifier: IMEKO-ACTA-07 (2018)-01-05
Section Editor: Lorenzo Ciani, University of Florence, Italy
Received September 28, 2017; In final form February 3, 2018; Published March 2018
Copyright: © 2018 IMEKO. This is an open-access article distributed under the terms of the Creative Commons Attribution 3.0 License, which permits unrestricted use, distribution, and reproduction in any medium, provided the original author and source are credited
Funding: This work was supported by the Hungarian Government and co-financed by the European Social Fund and European Union
Corresponding author: Gabor Kohlrusz, e-mail: [email protected]
1. INTRODUCTION
A mixed-signal simulation environment is capable to prognosis failure or wear out phenomena during the design phase. The simulation results affect the controller design process and circuit components sizing. The purpose of this paper is to present the possibilities of a mixed-signal simulation in power converter or electric drive diagnostics. The analyzed converters or circuits are modelled in SPICE (Simulation Program with Integrated Circuit Emphasis) design environment introducing realistic nature of circuit. The connection of the SPICE model to an evaluation platform creates a mixed-signal simulation which is suitable for signal analysis based diagnostics in power converters. Signal-based diagnosis looks for the known fault signatures in quantities sampled from the actual system instead of analyzing capacitor material [1]. In order to identify fault or degradation in the analyzed system the sampled signals are evaluated by signal processing techniques. Typically, frequency analysis is used, but time-frequency analysis and other advanced methods can also be advantageous according to the literature [2].
In this work the input and output capacitors of a digitally
controlled Step-Down DC-DC converter (Buck converter) have been tested in 4 different cases with unused and worn out capacitors. The applied diagnostic technique focuses on both the detection of dominant frequency components occurred by degradation and change in operation-related components due to capacitor aging. The tests were performed by exploiting the advantages and possibilities of a mixed-signal simulation environment which is well-suited for energy conversion system modelling and analysis.
Many contributions can be found in literature dealing with capacitor aging diagnosis in PWM (Pulse-Width Modulation) converters, but they have a lack of considering the effect of signal conversion and signal processing or realistic noisy operational circumstances [3], [4], [5], [6]. In [3] the authors also analysed capacitor aging in switch mode DC-DC converter. However, the observation of frequency spectrum of capacitor current and voltage has been performed in a converter without digital control. In [4] the authors analyze the effect of capacitor degradation in digitally controlled PWM converter, but without
ABSTRACT In this work the input and output capacitors of a digitally controlled Buck converter have been tested in 4 different cases with unused and worn out capacitors. The information extracted from interactions between the subsystems of an electric energy conversion system requires the implementation of the whole system from network to load. A complex simulation environment has been implemented where digital and analogue domains can be connected. The input and output capacitor aging have a significant influence on time domain characteristics, but the evaluation of frequency-domain data is supposed to be required to extract information from the noisy and distorted time-domain signal. The presented diagnostic approach aims to analyze signals that are used by the control loop in order to avoid expensive additions to existing circuits.
ACTA IMEKO | www.imeko.org March 2018 | Volume 7 | Number 1 | 21
considering the discrete-time operation of the controller. It also assumes ideal DC voltage at the converter input.
In the related area, most of the diagnostic methods utilize dynamic model of the analyzed system [7], [8] while the presented diagnostic approach requires only signals that are necessary for normal operation of the controller. In [9] the author made experiments with frequency analysis of DC-link capacitor signal, but only the capacitor current has been analysed.
2. MODELLING IN MIXED-SIGNAL SIMULATION ENVIRONMENT
The digitally controlled power converters and electric drives are mixed-signal systems containing both analogue and digital signals. In order to analyze these systems close to realistic behaviour it is worthy to design and to model the analogue and digital subsystems separately. The electric part of the system can be modelled properly in a circuit design environment, while the digital environment and the control algorithm should be implemented in an environment that is capable to run numerical computations. In such a complex development and test environment it is possible to simulate signal conversion and signal processing processes which have a significant effect on the system behaviour and generally are neglected.
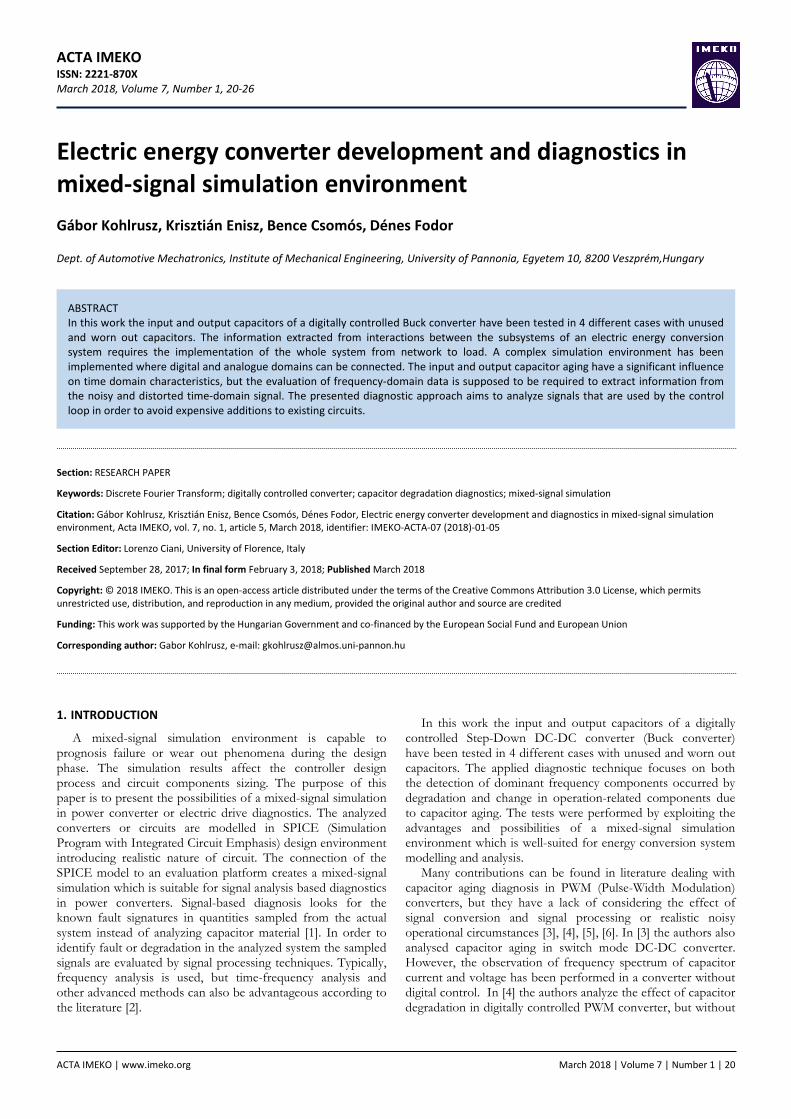
2.1. Electric energy converter development and diagnostics The mixed-signal environment fosters the hardware and
software development and testing (Figure 1). The interconnected environment plays an important role in hardware and software development process of electric drives and converters that has been highlighted by red transparent boxes in the figure.
The control algorithm and the circuit have been modelled individually at the modelling level.
MIL (Model-in-the-Loop) testing ensures the execution of functional tests of the developed control algorithm. The model of the control algorithm is tested at MIL level utilizing the interconnected OrCAD schematic which represents the controlled energy conversion system. The separate design of analogue and digital subsystems are connected via a software interface which handles data flow between the two platforms.
As a result of MIL tests, a software model has been created that meets functional and fundamental safety requirements. Therefore, the software model can be implemented on hardware in order to test it in real environment. A real-time executable prototype of the software has been created by RCP (Rapid Control Prototyping) process. Since the control algorithm is developed in Simulink environment the suitable target hardware components are dSPACE or NI VeriStand real-time environments. The RCP is not vital to create or generate code from software model. The schematic of the energy conversion system can be finalized with or without using RCP.
During the SIL (Software-in-the-Loop) test, the interaction of deployable software and schematic has been verified. The features of the interconnected simulation environment facilitate and support the target code generation and PCB design for hardware implementation and HIL (Hardware-in-the-Loop) tests.
The mixed-signal simulation environment also assists in product development processes. It makes possible to design, size or diagnose a circuit component if its model is integrated into the circuit schematic in OrCAD and is simulated together
with the digital subsystem in order to form realistic operational environment.
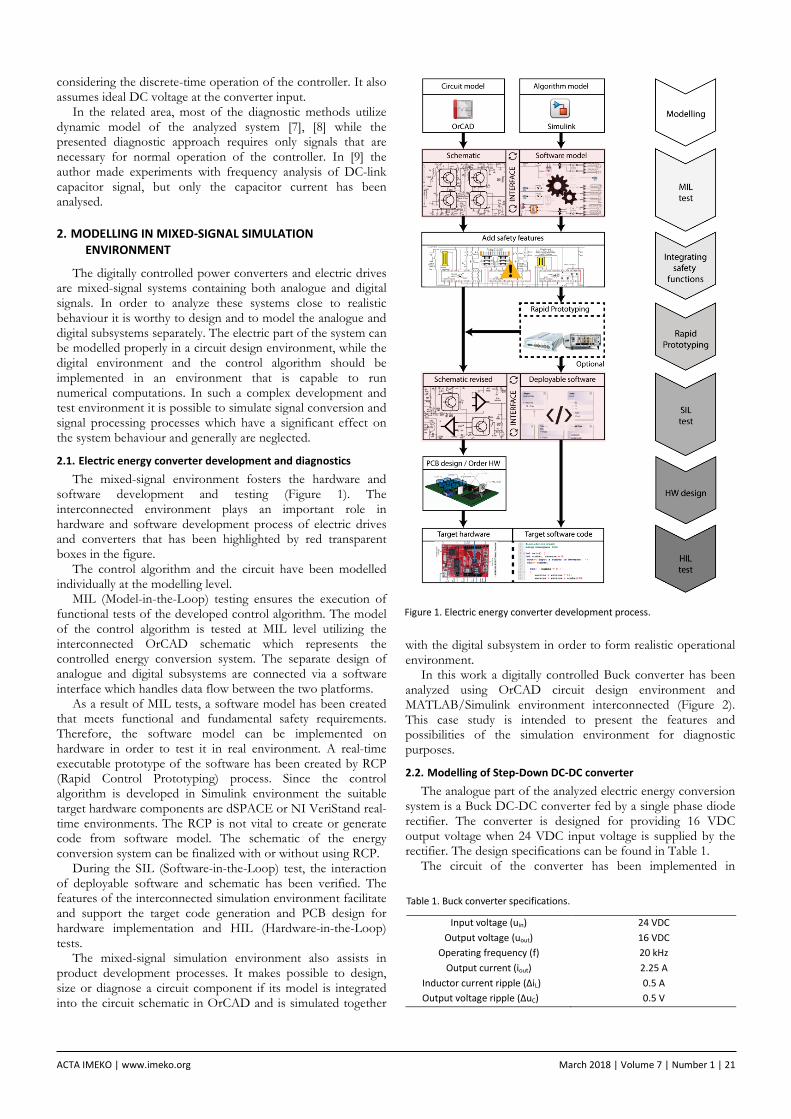
In this work a digitally controlled Buck converter has been analyzed using OrCAD circuit design environment and MATLAB/Simulink environment interconnected (Figure 2). This case study is intended to present the features and possibilities of the simulation environment for diagnostic purposes.
2.2. Modelling of Step-Down DC-DC converter The analogue part of the analyzed electric energy conversion
system is a Buck DC-DC converter fed by a single phase diode rectifier. The converter is designed for providing 16 VDC output voltage when 24 VDC input voltage is supplied by the rectifier. The design specifications can be found in Table 1.
The circuit of the converter has been implemented in
Figure 1. Electric energy converter development process.
Table 1. Buck converter specifications.
Input voltage (uin) 24 VDC Output voltage (uout) 16 VDC
Operating frequency (f) 20 kHz Output current (iout) 2.25 A
Inductor current ripple (ΔiL) 0.5 A Output voltage ripple (ΔuC) 0.5 V
ACTA IMEKO | www.imeko.org March 2018 | Volume 7 | Number 1 | 22
OrCAD environment. It was extended with additional components in order to reflect the realistic behaviour:
1) wire resistances and parasitic inductances; 2) inductor model extended by coil resistance; 3) standard model for input and output capacitor.
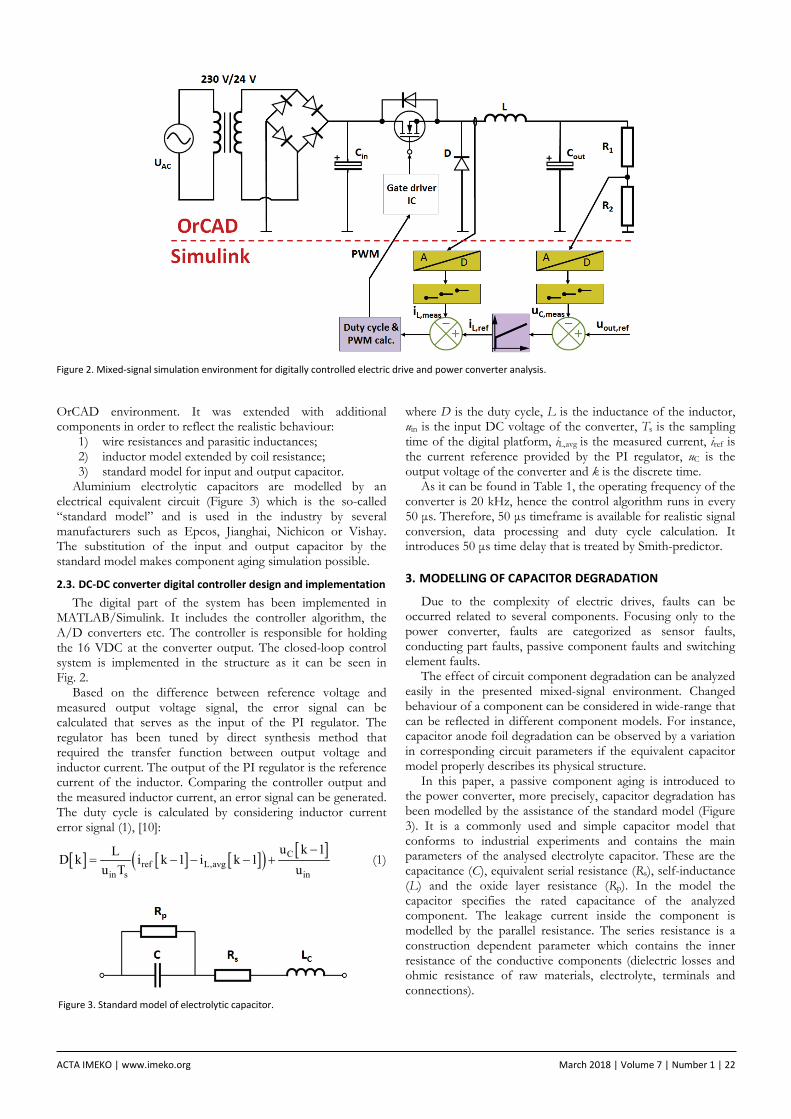
Aluminium electrolytic capacitors are modelled by an electrical equivalent circuit (Figure 3) which is the so-called “standard model” and is used in the industry by several manufacturers such as Epcos, Jianghai, Nichicon or Vishay. The substitution of the input and output capacitor by the standard model makes component aging simulation possible.
2.3. DC-DC converter digital controller design and implementation The digital part of the system has been implemented in
MATLAB/Simulink. It includes the controller algorithm, the A/D converters etc. The controller is responsible for holding the 16 VDC at the converter output. The closed-loop control system is implemented in the structure as it can be seen in Fig. 2.
Based on the difference between reference voltage and measured output voltage signal, the error signal can be calculated that serves as the input of the PI regulator. The regulator has been tuned by direct synthesis method that required the transfer function between output voltage and inductor current. The output of the PI regulator is the reference current of the inductor. Comparing the controller output and the measured inductor current, an error signal can be generated. The duty cycle is calculated by considering inductor current error signal (1), [10]:
[ ] [ ] [ ]( ) [ ]Cref L,avg
in s in
u k 1LD k i k 1 i k 1u T u
−= − − − + (1)
where D is the duty cycle, L is the inductance of the inductor, uin is the input DC voltage of the converter, Ts is the sampling time of the digital platform, iL,avg is the measured current, iref is the current reference provided by the PI regulator, uC is the output voltage of the converter and k is the discrete time.
As it can be found in Table 1, the operating frequency of the converter is 20 kHz, hence the control algorithm runs in every 50 μs. Therefore, 50 μs timeframe is available for realistic signal conversion, data processing and duty cycle calculation. It introduces 50 μs time delay that is treated by Smith-predictor.
3. MODELLING OF CAPACITOR DEGRADATION
Due to the complexity of electric drives, faults can be occurred related to several components. Focusing only to the power converter, faults are categorized as sensor faults, conducting part faults, passive component faults and switching element faults.
The effect of circuit component degradation can be analyzed easily in the presented mixed-signal environment. Changed behaviour of a component can be considered in wide-range that can be reflected in different component models. For instance, capacitor anode foil degradation can be observed by a variation in corresponding circuit parameters if the equivalent capacitor model properly describes its physical structure.
In this paper, a passive component aging is introduced to the power converter, more precisely, capacitor degradation has been modelled by the assistance of the standard model (Figure 3). It is a commonly used and simple capacitor model that conforms to industrial experiments and contains the main parameters of the analysed electrolyte capacitor. These are the capacitance (C), equivalent serial resistance (Rs), self-inductance (L) and the oxide layer resistance (Rp). In the model the capacitor specifies the rated capacitance of the analyzed component. The leakage current inside the component is modelled by the parallel resistance. The series resistance is a construction dependent parameter which contains the inner resistance of the conductive components (dielectric losses and ohmic resistance of raw materials, electrolyte, terminals and connections).
Figure 2. Mixed-signal simulation environment for digitally controlled electric drive and power converter analysis.
Figure 3. Standard model of electrolytic capacitor.
ACTA IMEKO | www.imeko.org March 2018 | Volume 7 | Number 1 | 23
Even the capacitor has significant degradation, the catastrophic failure should be avoided. It is sufficient to notice the wear out before it causes short-circuit through the capacitor and affects other components. In order to avoid damage, it is sufficient to notice faults as early as possible.
The aim of the presented analysis is to find quantities which may vary with the aging or carries information about degradation. The mixed-signal model environment is a tool to analyze signals that may not be accessible on a real device.
Four different case studies were performed during converter operation:
1) new/unused input and output capacitors; 2) only output capacitor is degraded; 3) degraded input and output capacitors; 4) only input capacitor is degraded.
In the four different simulations the Buck converter was operated under conditions detailed above, the new and aged capacitor values were determined based on Table 2.
Due to the PWM operation of converter and the harmonics occurred, the aging of the capacitor can be observed. The main wear out failure mechanism is the evaporation of the electrolyte solution which causes a decrease in capacitance (C) and an increase of the equivalent series resistance (ESR).
In the case of aged capacitor, the series resistance was increased by the factor 5 while the capacitance was decreased by 10 % compared to the unused capacitor values. The parallel resistance models the leakage current of the capacitor. The leakage current should be around 1-2 μA in the case of a new capacitor, however, this value is 8-10 μA for an aged capacitor [11]. The inductance of the capacitor foil is irrelevant since its value is less than 1 nH. The values shown in Table 2 belong to a capacitor used in practical application and do not concern with theoretical domain.
4. SIGNAL ANALYSIS BASED DEGRADATION DETECTION
The mixed-signal environment allows the execution of frequency spectrum analysis of measured signals due to realistic system modelling.
The presented approach utilizes measurement of voltage and current that are also required by the control system and it does not mean extra effort or cost. Consequently, the diagnostic approach aims to analyze the output voltage waveform, inductor current and input capacitor voltage. These signals serve as a basis of a diagnostic technique which focuses on the detection of dominant frequency components or distorted frequency spectrum of the measured signals caused by the aging.
Figure 3 shows the output voltages of the Buck converter when a 16 V output reference has been applied.
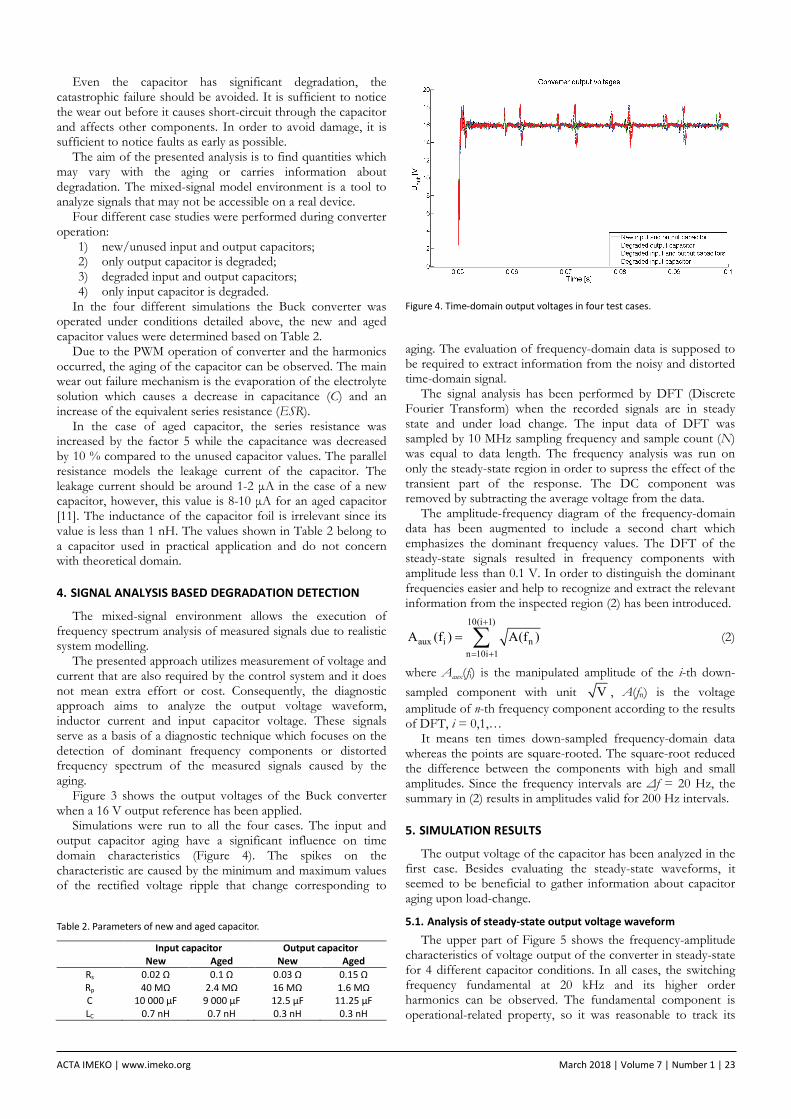
Simulations were run to all the four cases. The input and output capacitor aging have a significant influence on time domain characteristics (Figure 4). The spikes on the characteristic are caused by the minimum and maximum values of the rectified voltage ripple that change corresponding to
aging. The evaluation of frequency-domain data is supposed to be required to extract information from the noisy and distorted time-domain signal.
The signal analysis has been performed by DFT (Discrete Fourier Transform) when the recorded signals are in steady state and under load change. The input data of DFT was sampled by 10 MHz sampling frequency and sample count (N) was equal to data length. The frequency analysis was run on only the steady-state region in order to supress the effect of the transient part of the response. The DC component was removed by subtracting the average voltage from the data.
The amplitude-frequency diagram of the frequency-domain data has been augmented to include a second chart which emphasizes the dominant frequency values. The DFT of the steady-state signals resulted in frequency components with amplitude less than 0.1 V. In order to distinguish the dominant frequencies easier and help to recognize and extract the relevant information from the inspected region (2) has been introduced.
10(i 1)
aux i nn 10i 1
A (f ) A(f )+
= +
= ∑ (2)
where Aaux(fi) is the manipulated amplitude of the i-th down-sampled component with unit V , A(fn) is the voltage amplitude of n-th frequency component according to the results of DFT, i = 0,1,…
It means ten times down-sampled frequency-domain data whereas the points are square-rooted. The square-root reduced the difference between the components with high and small amplitudes. Since the frequency intervals are Δf = 20 Hz, the summary in (2) results in amplitudes valid for 200 Hz intervals.
5. SIMULATION RESULTS
The output voltage of the capacitor has been analyzed in the first case. Besides evaluating the steady-state waveforms, it seemed to be beneficial to gather information about capacitor aging upon load-change.
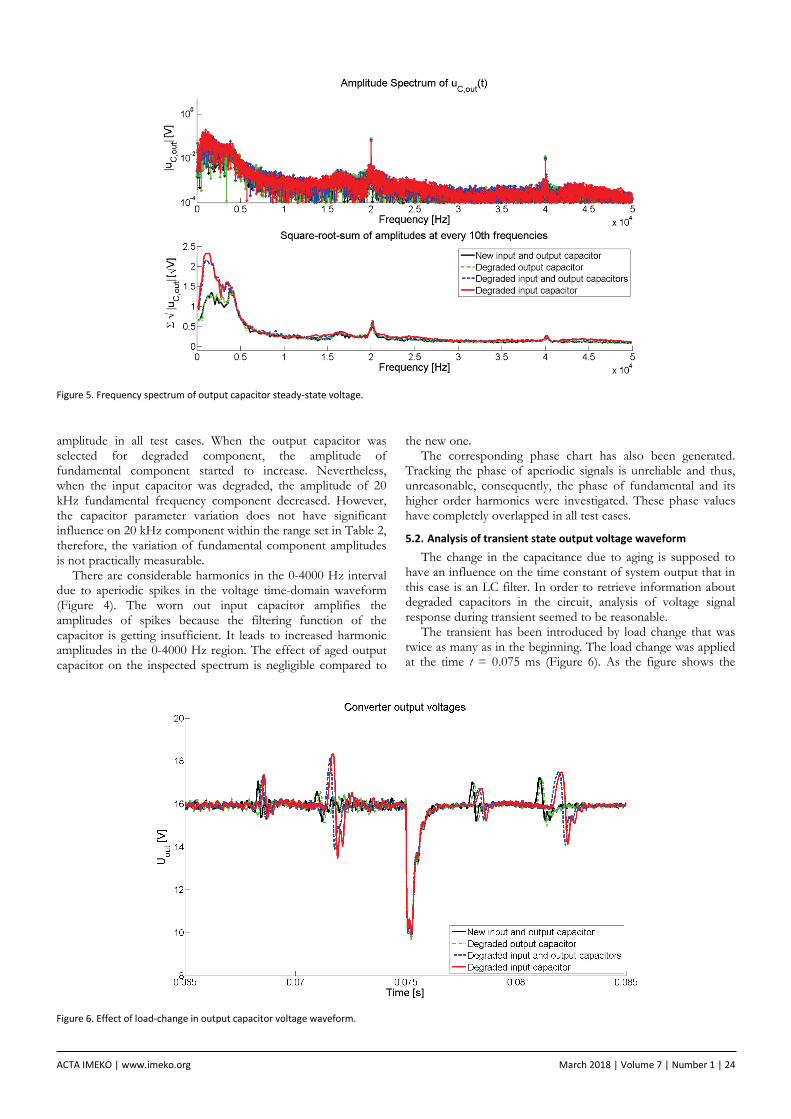
5.1. Analysis of steady-state output voltage waveform The upper part of Figure 5 shows the frequency-amplitude
characteristics of voltage output of the converter in steady-state for 4 different capacitor conditions. In all cases, the switching frequency fundamental at 20 kHz and its higher order harmonics can be observed. The fundamental component is operational-related property, so it was reasonable to track its
Figure 4. Time-domain output voltages in four test cases.
Table 2. Parameters of new and aged capacitor.
Input capacitor Output capacitor New Aged New Aged
Rs 0.02 Ω 0.1 Ω 0.03 Ω 0.15 Ω Rp 40 MΩ 2.4 MΩ 16 MΩ 1.6 MΩ C 10 000 μF 9 000 μF 12.5 μF 11.25 μF LC 0.7 nH 0.7 nH 0.3 nH 0.3 nH
ACTA IMEKO | www.imeko.org March 2018 | Volume 7 | Number 1 | 24
amplitude in all test cases. When the output capacitor was selected for degraded component, the amplitude of fundamental component started to increase. Nevertheless, when the input capacitor was degraded, the amplitude of 20 kHz fundamental frequency component decreased. However, the capacitor parameter variation does not have significant influence on 20 kHz component within the range set in Table 2, therefore, the variation of fundamental component amplitudes is not practically measurable.
There are considerable harmonics in the 0-4000 Hz interval due to aperiodic spikes in the voltage time-domain waveform (Figure 4). The worn out input capacitor amplifies the amplitudes of spikes because the filtering function of the capacitor is getting insufficient. It leads to increased harmonic amplitudes in the 0-4000 Hz region. The effect of aged output capacitor on the inspected spectrum is negligible compared to
the new one. The corresponding phase chart has also been generated.
Tracking the phase of aperiodic signals is unreliable and thus, unreasonable, consequently, the phase of fundamental and its higher order harmonics were investigated. These phase values have completely overlapped in all test cases.
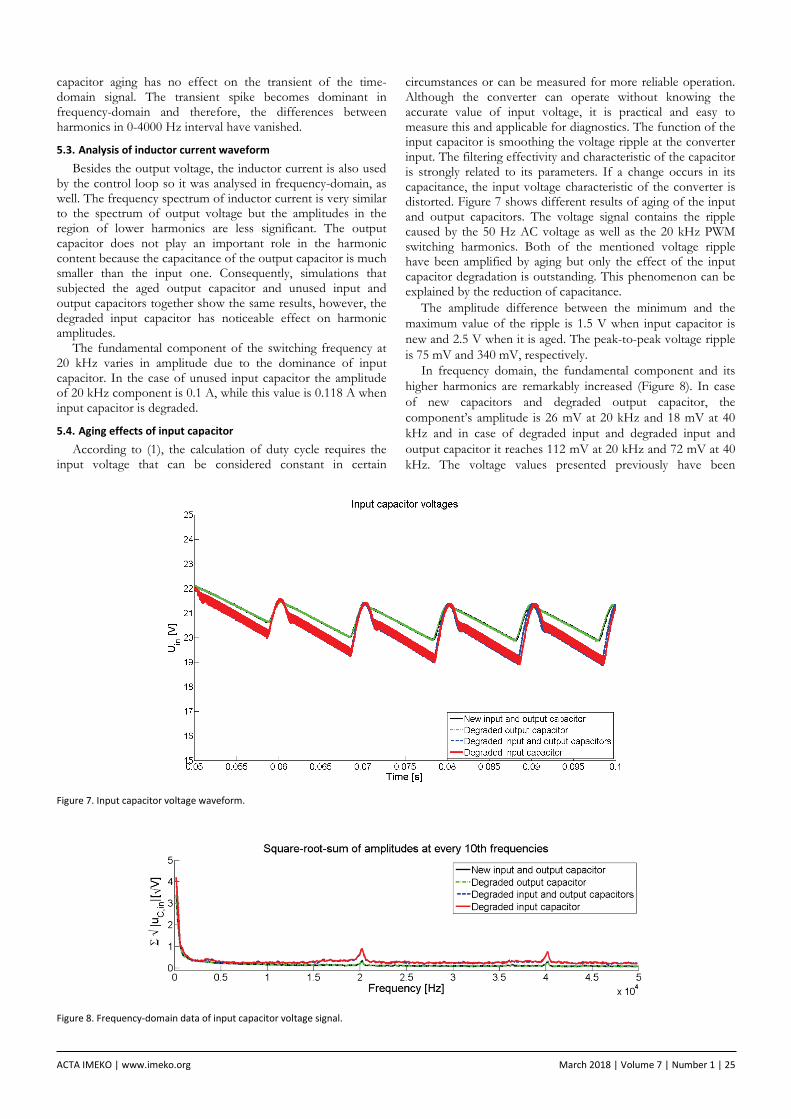
5.2. Analysis of transient state output voltage waveform The change in the capacitance due to aging is supposed to
have an influence on the time constant of system output that in this case is an LC filter. In order to retrieve information about degraded capacitors in the circuit, analysis of voltage signal response during transient seemed to be reasonable.
The transient has been introduced by load change that was twice as many as in the beginning. The load change was applied at the time t = 0.075 ms (Figure 6). As the figure shows the
Figure 5. Frequency spectrum of output capacitor steady-state voltage.
Figure 6. Effect of load-change in output capacitor voltage waveform.
ACTA IMEKO | www.imeko.org March 2018 | Volume 7 | Number 1 | 25
capacitor aging has no effect on the transient of the time-domain signal. The transient spike becomes dominant in frequency-domain and therefore, the differences between harmonics in 0-4000 Hz interval have vanished.
5.3. Analysis of inductor current waveform Besides the output voltage, the inductor current is also used
by the control loop so it was analysed in frequency-domain, as well. The frequency spectrum of inductor current is very similar to the spectrum of output voltage but the amplitudes in the region of lower harmonics are less significant. The output capacitor does not play an important role in the harmonic content because the capacitance of the output capacitor is much smaller than the input one. Consequently, simulations that subjected the aged output capacitor and unused input and output capacitors together show the same results, however, the degraded input capacitor has noticeable effect on harmonic amplitudes.
The fundamental component of the switching frequency at 20 kHz varies in amplitude due to the dominance of input capacitor. In the case of unused input capacitor the amplitude of 20 kHz component is 0.1 A, while this value is 0.118 A when input capacitor is degraded.
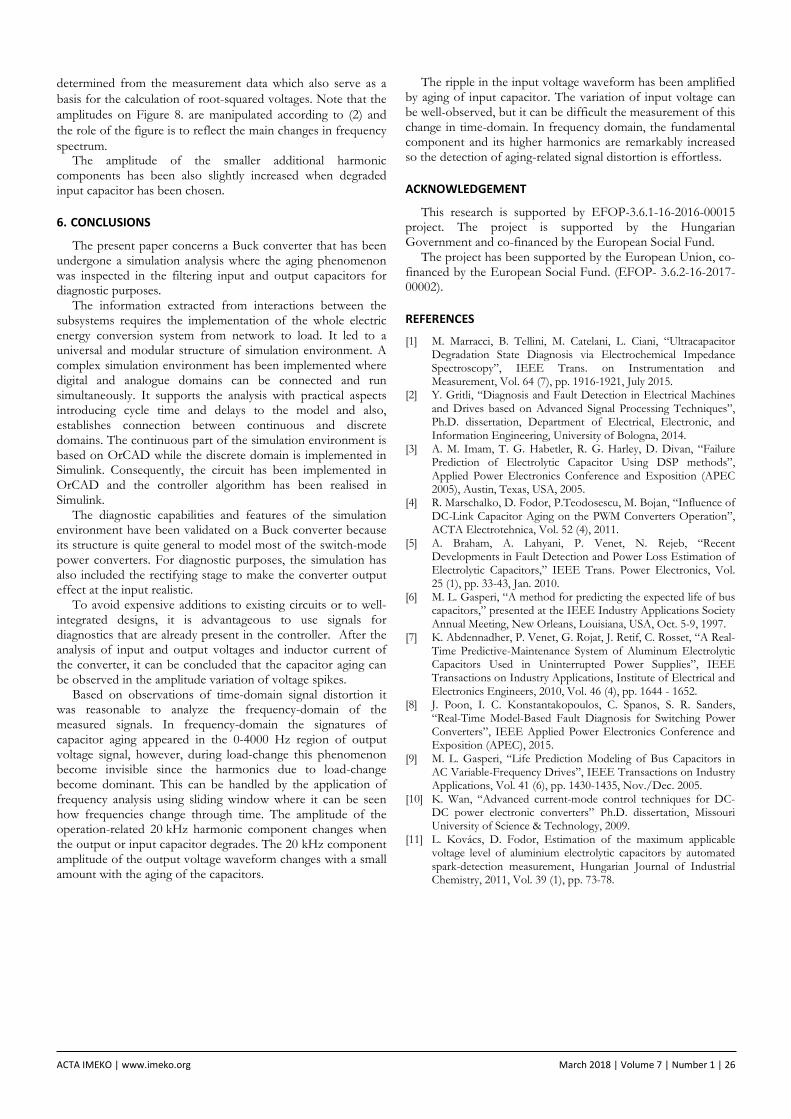
5.4. Aging effects of input capacitor According to (1), the calculation of duty cycle requires the
input voltage that can be considered constant in certain
circumstances or can be measured for more reliable operation. Although the converter can operate without knowing the accurate value of input voltage, it is practical and easy to measure this and applicable for diagnostics. The function of the input capacitor is smoothing the voltage ripple at the converter input. The filtering effectivity and characteristic of the capacitor is strongly related to its parameters. If a change occurs in its capacitance, the input voltage characteristic of the converter is distorted. Figure 7 shows different results of aging of the input and output capacitors. The voltage signal contains the ripple caused by the 50 Hz AC voltage as well as the 20 kHz PWM switching harmonics. Both of the mentioned voltage ripple have been amplified by aging but only the effect of the input capacitor degradation is outstanding. This phenomenon can be explained by the reduction of capacitance.
The amplitude difference between the minimum and the maximum value of the ripple is 1.5 V when input capacitor is new and 2.5 V when it is aged. The peak-to-peak voltage ripple is 75 mV and 340 mV, respectively.
In frequency domain, the fundamental component and its higher harmonics are remarkably increased (Figure 8). In case of new capacitors and degraded output capacitor, the component’s amplitude is 26 mV at 20 kHz and 18 mV at 40 kHz and in case of degraded input and degraded input and output capacitor it reaches 112 mV at 20 kHz and 72 mV at 40 kHz. The voltage values presented previously have been
Figure 8. Frequency-domain data of input capacitor voltage signal.
Figure 7. Input capacitor voltage waveform.
ACTA IMEKO | www.imeko.org March 2018 | Volume 7 | Number 1 | 26
determined from the measurement data which also serve as a basis for the calculation of root-squared voltages. Note that the amplitudes on Figure 8. are manipulated according to (2) and the role of the figure is to reflect the main changes in frequency spectrum.
The amplitude of the smaller additional harmonic components has been also slightly increased when degraded input capacitor has been chosen.
6. CONCLUSIONS
The present paper concerns a Buck converter that has been undergone a simulation analysis where the aging phenomenon was inspected in the filtering input and output capacitors for diagnostic purposes.
The information extracted from interactions between the subsystems requires the implementation of the whole electric energy conversion system from network to load. It led to a universal and modular structure of simulation environment. A complex simulation environment has been implemented where digital and analogue domains can be connected and run simultaneously. It supports the analysis with practical aspects introducing cycle time and delays to the model and also, establishes connection between continuous and discrete domains. The continuous part of the simulation environment is based on OrCAD while the discrete domain is implemented in Simulink. Consequently, the circuit has been implemented in OrCAD and the controller algorithm has been realised in Simulink.
The diagnostic capabilities and features of the simulation environment have been validated on a Buck converter because its structure is quite general to model most of the switch-mode power converters. For diagnostic purposes, the simulation has also included the rectifying stage to make the converter output effect at the input realistic.
To avoid expensive additions to existing circuits or to well-integrated designs, it is advantageous to use signals for diagnostics that are already present in the controller. After the analysis of input and output voltages and inductor current of the converter, it can be concluded that the capacitor aging can be observed in the amplitude variation of voltage spikes.
Based on observations of time-domain signal distortion it was reasonable to analyze the frequency-domain of the measured signals. In frequency-domain the signatures of capacitor aging appeared in the 0-4000 Hz region of output voltage signal, however, during load-change this phenomenon become invisible since the harmonics due to load-change become dominant. This can be handled by the application of frequency analysis using sliding window where it can be seen how frequencies change through time. The amplitude of the operation-related 20 kHz harmonic component changes when the output or input capacitor degrades. The 20 kHz component amplitude of the output voltage waveform changes with a small amount with the aging of the capacitors.
The ripple in the input voltage waveform has been amplified by aging of input capacitor. The variation of input voltage can be well-observed, but it can be difficult the measurement of this change in time-domain. In frequency domain, the fundamental component and its higher harmonics are remarkably increased so the detection of aging-related signal distortion is effortless.
ACKNOWLEDGEMENT
This research is supported by EFOP-3.6.1-16-2016-00015 project. The project is supported by the Hungarian Government and co-financed by the European Social Fund.
The project has been supported by the European Union, co-financed by the European Social Fund. (EFOP- 3.6.2-16-2017-00002).
REFERENCES
[1] M. Marracci, B. Tellini, M. Catelani, L. Ciani, “Ultracapacitor Degradation State Diagnosis via Electrochemical Impedance Spectroscopy”, IEEE Trans. on Instrumentation and Measurement, Vol. 64 (7), pp. 1916-1921, July 2015.
[2] Y. Gritli, “Diagnosis and Fault Detection in Electrical Machines and Drives based on Advanced Signal Processing Techniques”, Ph.D. dissertation, Department of Electrical, Electronic, and Information Engineering, University of Bologna, 2014.
[3] A. M. Imam, T. G. Habetler, R. G. Harley, D. Divan, “Failure Prediction of Electrolytic Capacitor Using DSP methods”, Applied Power Electronics Conference and Exposition (APEC 2005), Austin, Texas, USA, 2005.
[4] R. Marschalko, D. Fodor, P.Teodosescu, M. Bojan, “Influence of DC-Link Capacitor Aging on the PWM Converters Operation”, ACTA Electrotehnica, Vol. 52 (4), 2011.
[5] A. Braham, A. Lahyani, P. Venet, N. Rejeb, “Recent Developments in Fault Detection and Power Loss Estimation of Electrolytic Capacitors,” IEEE Trans. Power Electronics, Vol. 25 (1), pp. 33-43, Jan. 2010.
[6] M. L. Gasperi, “A method for predicting the expected life of bus capacitors,” presented at the IEEE Industry Applications Society Annual Meeting, New Orleans, Louisiana, USA, Oct. 5-9, 1997.
[7] K. Abdennadher, P. Venet, G. Rojat, J. Retif, C. Rosset, “A Real-Time Predictive-Maintenance System of Aluminum Electrolytic Capacitors Used in Uninterrupted Power Supplies”, IEEE Transactions on Industry Applications, Institute of Electrical and Electronics Engineers, 2010, Vol. 46 (4), pp. 1644 - 1652.
[8] J. Poon, I. C. Konstantakopoulos, C. Spanos, S. R. Sanders, “Real-Time Model-Based Fault Diagnosis for Switching Power Converters”, IEEE Applied Power Electronics Conference and Exposition (APEC), 2015.
[9] M. L. Gasperi, “Life Prediction Modeling of Bus Capacitors in AC Variable-Frequency Drives”, IEEE Transactions on Industry Applications, Vol. 41 (6), pp. 1430-1435, Nov./Dec. 2005.
[10] K. Wan, “Advanced current-mode control techniques for DC-DC power electronic converters” Ph.D. dissertation, Missouri University of Science & Technology, 2009.
[11] L. Kovács, D. Fodor, Estimation of the maximum applicable voltage level of aluminium electrolytic capacitors by automated spark-detection measurement, Hungarian Journal of Industrial Chemistry, 2011, Vol. 39 (1), pp. 73-78.