elcsd insurance survey report 2013
TRANSCRIPT

East Liverpool City Schools
Health Insurance Survey Of
Selected Peer Districts
At September 2013
Prepared For the East Liverpool City
School District Board of Education
November 14, 2013
By:
K-12 Business Consulting, Inc.
Christopher Mohr, MBA, RSBA, CGFM ~ President
Dale Miller, CPA ~ Associate
www.k12consulting.net

East Liverpool City Schools – Health Insurance Survey
TABLE OF CONTENTS
CONTENTS PAGE
Executive Summary i
Purpose of Survey and Peer Group Districts Selected for the Survey 1
Table 1 Health Insurance Survey Peer Group Districts 1
Health Insurance Survey Design 1
Key Findings of Survey 2
Cost of Health Insurance as a Percentage of Wages Paid FY12 2
Figure 1 Peer Group Percentage of Health Care Costs to Wages FY12 3
Figure 2 Peer Group Total Fringe Benefit Expenses as a % of Wage Expense FY12 4
Comparison of Family and Single Medical & Prescription Drug Insurances 4
Figure 3 Peer Group Monthly Family Medical Insurance Coverage at September 2013 5
Figure 4 Peer Group Percentage of Family Medical Insurance Coverage at September 2013 5
Figure 5 Peer Group Monthly Single Medical Insurance Coverage at September 2013 6
Figure 6 Peer Group Percentage of Single Medical Insurance Coverage at September 2013 7
Figure 7 Peer Group Monthly Family Dental Insurance Coverage at September 2013 8
Figure 8 Peer Group Percentage of Family Dental Insurance Coverage at September 2013 8
Figure 9 Peer Group Monthly Single Dental Insurance Coverage at September 2013 9
Figure 10 Peer Group Percentage of Single Dental Insurance Coverage at September 2013 10
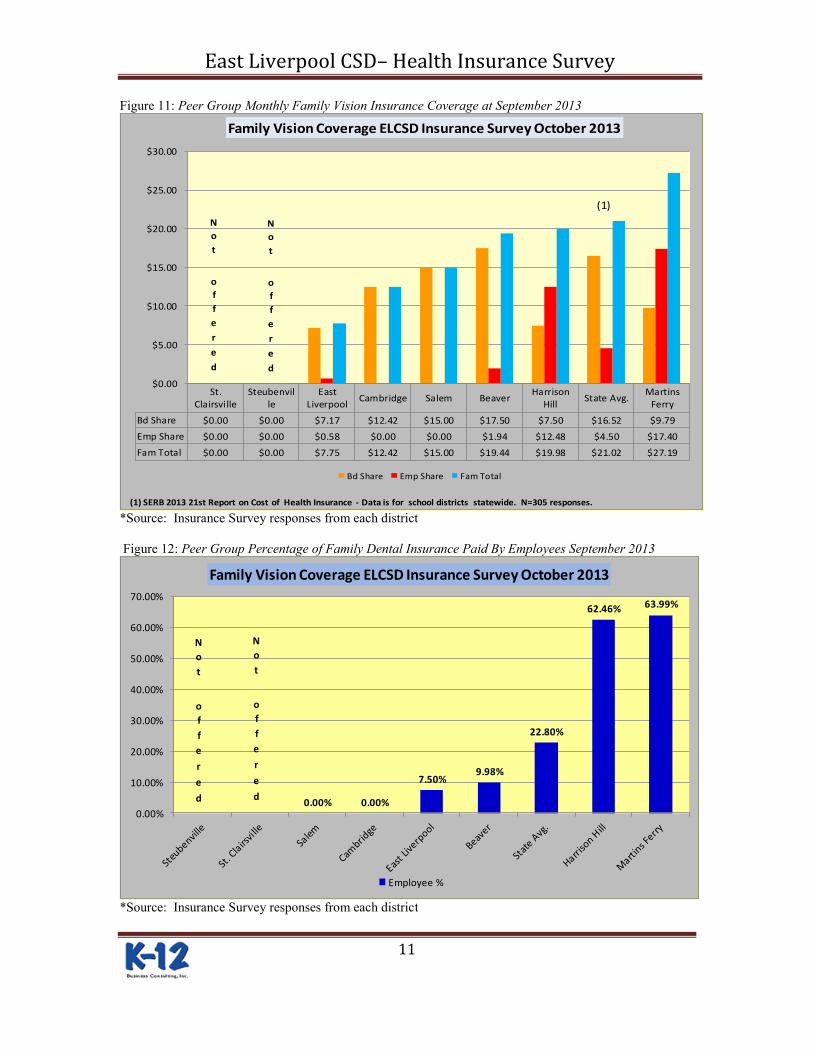
Figure 11 Peer Group Monthly Family Vision Insurance Coverage at September 2013 11
Figure 12 Peer Group Percentage of Family Vision Insurance Coverage at September 2013 11
Figure 13 Peer Group Monthly Single Vision Insurance Coverage at September 2013 12
Figure 14 Peer Group Percentage of Single Vision Insurance Coverage at September 2013 13
Affordable Care Act Cadillac Tax Insurance Projector for 2013 through 2022 13
Table 2 Affordable Care Act Cadillac Tax Projector Family Insurance Premiums 14
Figure 15 Projection of Family Insurance Premiums at 7% Trend to 2018 14
Table 3 Affordable Care Act Cadillac Tax Projector Single Insurance Premiums 15
Figure 16 Projection of Single Insurance Premiums at 7% Trend to 2018 15
Schedule of Medical Benefits 16
Table 4 Schedule of Medical Benefits 17
East Liverpool City Schools – Health Insurance Survey
Executive Summary Page i
Executive Summary
The purpose of this Health Insurance Survey is to comply with the Board of Education’s request to
objectively compare the East Liverpool City School District’s (ELCSD) health insurance costs and benefit
levels with other specifically identified locally proximate districts. The reason for the focus on health care
cost is that the district received data from an independent study received August 26, 2013 that showed
district fringe benefits as a percent of wages paid was essentially 50%, which is 9 percentage points higher
than the district state group amount of 41%. In a geographically local comparison with other districts the
district was 4 percentage points higher than selected peer group districts which had an average of 46%. The
peer group districts were selected because they are of a relative similar size in terms of student enrollment.
It is clear, whether in a local or state wide comparison of similar school districts; the East Liverpool City
School District has health care costs that are on average higher than other districts. With the upcoming 40%
Cadillac Tax on health care costs imposed by the Affordable Care Act effective in 2018, it is very important
to the long-term financial stability of the district to gain an understanding of its health care costs and how
other school districts are managing these costs.
Key Findings of the Survey The following are the key findings of the health care cost survey:
Most districts in the peer group are below state average for employee percentage contributions for
family and single medical and prescription drug insurance. Statewide family average employee
contributions are 13.10% and the group average was 7.92%. Statewide average single employee
contribution rate is 12.2% and the group average is 7.9%. East Liverpool contribution rates are
7.5% for both family and single medical insurance. These findings suggest employees should pay a
higher percentage of medical insurance costs. This is true for East Liverpool as well. While the
recent increase to 7.5% is a step in the right direction, employee contributions are routinely 13% to
15% of premiums which is well below private sector employee’s contribution to health care. On
October 21, 2013 the Society of Human Resource Management issued a report showing that private
sector employees will be asked to contribute 22% of the cost of health care premiums.
Medical insurance premiums for districts in the comparison group, with the exception of Beaver
Local, are generally higher than state averages and in some cases considerably higher. See Figures
3 and 5 for specific details. There are likely several key causes but low employee contributions to
premiums and low deductibles and Out-of-Pocket Maximums are likely two significant contributors
to the increased costs. This is true for East Liverpool as well where deductibles and Out-of-Pocket
Maximums are very low compared to state benchmarks and other peer group districts. See Table 4
at the end of this report for more details.
Dental and vision insurances appear to be mostly in line with statewide averages for both family
and single coverage’s for all school districts in the study.
Most districts in the comparison study need to be mindful of the 2018 Cadillac Tax that will be
implemented as a result of the Affordable Care Act. Projections show a high likelihood that most
districts in the comparison, including East Liverpool, will be impacted by the Cadillac Tax for both
family and single coverage’s by 2018. See Tables 2 and 3 and Figures 15 and 16 for assumptions
and calculations showing reason for the concern.
The East Liverpool City School District expresses thanks to the treasurers of each Peer Group Districts for
their enthusiastic response to this survey. It would not be possible without their cooperation.

East Liverpool CSD– Health Insurance Survey
1
District County ADM
Poverty as
% of ADM
% of
Population
Administra
tive or
Profession
al
Occupation
s
Median
Income
% of
Populati
on with
College
Degree
or More
%
Agricultu
ral
Property
Populati
on
Density
Non-
Residenti
al & Non-
Agricultu
ral Per
Pupil
%
Minority
Students
East Liverpool City Columbiana 2,213 56.9 21.4 24,992 18.0 2.3 1,223.0 16,326 13.2
Beaver Local Columbiana 2,063 45.5 26.4 30,554 19.2 20.4 143 23,965 2.4
Salem City Columbiana 2,093 47.9 24 26,403 21.5 2.6 940 41,583 3.6
Steubenville City Jefferson 2,253 66 26.2 23,217 21.7 0.3 2193 24,492 41.7
St Clairsville-Richland CityBelmont 1666 28.6 31.7 32,897 25 8 213 71,129 7.1
Cambridge City Guernsey 2361 63.9 24.8 22,963 17.6 7.1 209 30,828 9
Martins Ferry City Belmont 1565 56.2 24.9 25,096 20.2 6.9 395 16,181 11.9
Harrison Hills City Harrison 1631 50.5 19.9 27,603 16.1 43.8 37 30,150 6.3
Purpose of Survey and Peer Group Districts Selected for the Survey
The purpose of this Health Insurance Survey is to comply with the Board of Education’s request to
objectively compare the East Liverpool City School District’s (ELCSD) health insurance costs and benefit
levels with other similarly sized school districts that are located geographically close. Through the survey
process the district is seeking to gain insight into health care costs by:
1) Determining amounts paid by each district and their employees for Medical, Dental and Vision
Insurance Coverage’s compared to ELCSD.
2) Identifying significant deductible and out-of-pocket cost differences in medical coverage between each
district and ELCSD.
3) Determining if ELCSD’s rank in terms of costs reveals any areas of potential savings the district could
explore.
The main comparison group for this health insurance survey will be referred to as the “Peer Group” and is
made up of districts identified by the administration as good benchmarks for comparative purposes within
its region. These school districts are noted in Table 1 below. This group is mostly a geographic comparison
group to be a point of reference and even though these districts have socio-economic, demographic and
student enrollment differences, the cost data gathered for their health insurances are comparable.
Table 1: Health Insurance Survey Peer Group Districts Based on ODE Data for FY12
Source: ODE Data Warehouse FY12
Health Insurance Survey Design
After the Peer Group Districts were selected a spreadsheet was created to send to each district asking for
their most current health insurance costs for medical & prescription, dental and vision coverage’s. The
data was requested in a monthly cost format for single and family coverage, employee and employer share
of premium and the premium effective date. In addition, the Peer Group Districts were asked to provide
the “Schedule of Benefits” for the medical insurance plans so a comparison of key cost factors such as
deductible and out of pocket amounts could be compared.
Once this data was prepared an email was sent by the treasurer of ELCSD to each of the Peer Group
District treasurers. This request was sent on September 9, 2013 to each of the district treasurers. All Peer
Group districts responded with health insurance cost data by October 3, 2013. For Schedule of Medical
Insurance Benefit data six (6) peer districts responded.

East Liverpool CSD– Health Insurance Survey
2
The East Liverpool City School District expresses thanks to the treasurers of each Peer Group Districts for
their enthusiastic response to this survey. It would not be possible without their cooperation.
The final major source of data referred to in this report is the State Employee Relations Board 2013 21st
Annual Report on the Cost of Health Insurance in Ohio’s Public Sector. The report was released in the
Spring of 2013 and contains a mix of premium information from late 2012 and early 2013. It is the most
authoritative data available on school system health care costs available. 97.2% or 700 of the 720 school
districts and ESCs in the state responded to the survey which constituted this report.
Key Findings of the Survey
Most districts in the peer group are below state average for employee contributions to family and
single medical and prescription drug insurance. Statewide family average employee contributions
are 13.10% and the group average was 7.92%. Statewide average single employee contribution
rate is 12.2% and the group average is 7.9%. East Liverpool contribution rates are 7.5% for both
family and single medical insurance. These findings suggest employees should pay a higher
percentage of medical insurance costs. This is true for East Liverpool as well. While the recent
increase to 7.5% is a step in the right direction, employee contributions are routinely 13% to 15%
of premiums.
Medical insurance premiums for districts in the comparison group, with the exception of Beaver
Local, are generally higher than state averages and in some cases considerably higher. See
Figures 3 and 5 for specific details. There are likely several key causes but low employee
contributions to premiums and low deductibles and Out-of-Pocket Maximums are likely two
significant contributors to the increased costs. This is true for East Liverpool as well where
deductibles and Out-of-Pocket Maximums are very low compared to state benchmarks and other
peer group districts. See Table 4 at the end of this report for more details.
Dental and vision insurances are for the most part in line with statewide averages for both family
and single coverage’s for those districts who participate in these benefits.
Most districts in the comparison study need to be mindful of the 2018 Cadillac Tax that will be
implemented as a result of the Affordable Care Act. Projections show a high likelihood that most
districts in the comparison, including East Liverpool, will be impacted by the Cadillac Tax for
both family and single coverage’s by 2018. See Tables 2 and 3 and Figures 15 and 16 for
assumptions and calculations showing reason for the concern.
Cost of Health Insurance as a Percentage of Wages Paid in FY12
Figure 1 and 2 show the percentage of health insurances to wages paid in FY12 for each of the districts.
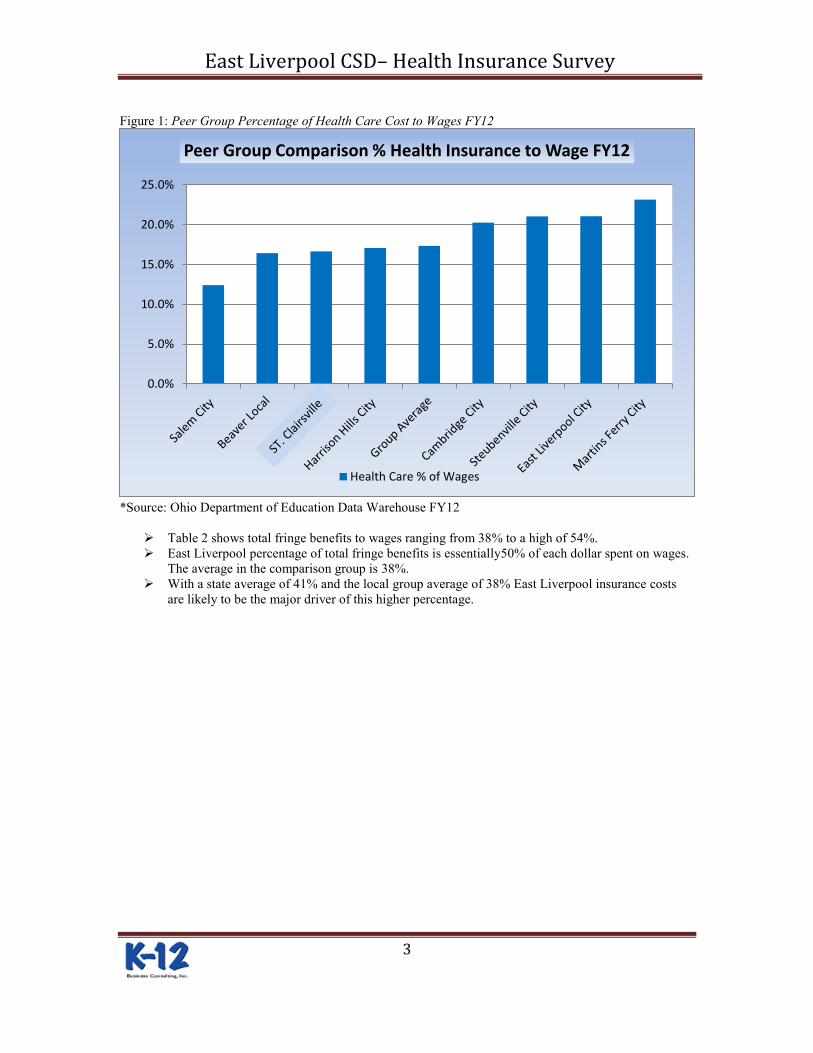
Health insurance as a percentage of wages ranged from a low of 12.5% to a high of 23% and a
group average of 17%.
East Liverpool is at the high side of the peer group and is roughly 4% above the average is the
peer group.
East Liverpool CSD– Health Insurance Survey
3
Figure 1: Peer Group Percentage of Health Care Cost to Wages FY12
*Source: Ohio Department of Education Data Warehouse FY12
Table 2 shows total fringe benefits to wages ranging from 38% to a high of 54%.
East Liverpool percentage of total fringe benefits is essentially50% of each dollar spent on wages.
The average in the comparison group is 38%.
With a state average of 41% and the local group average of 38% East Liverpool insurance costs
are likely to be the major driver of this higher percentage.
0.0%
5.0%
10.0%
15.0%
20.0%
25.0%
Peer Group Comparison % Health Insurance to Wage FY12
Health Care % of Wages

East Liverpool CSD– Health Insurance Survey
4
Figure 2: Peer Group Total Fringe Benefit Expenses as a % of Wage Expense FY12
*Source: Ohio Department of Education Data Warehouse FY12
Comparison of Family and Single Medical & Prescription Drug Insurances
The next several tables show comparisons of monthly premiums in effect at the date of this report for
family and single insurances coverage. Coverage’s shown are medical & prescription, dental and vision
insurances along with the percentage of total monthly premium paid by employees.
Figure 3 shows a monthly family insurance cost from a low of $1,222 to a high of $2,041. That is
an annual cost of $14,664 to a high of $24,492.
The state average monthly cost for school districts with ADM of 1,000 to 2,499 was $1,378 per
month or $16,500 annually.
Group average without East Liverpool in the total for family coverage is $1,657 per month or
$19,884 annually.
East Liverpool is $72 per month or $864 annually higher than the group average and $351 per
month or $4,212 annually higher than the state average for all school districts.
Figure 4 shows the percentage of family insurance paid by employees for family coverage. This
ranges from 2.5% to 12.15% in the peer group. The East Liverpool average is 7.5%.
The peer group employee cost average without East Liverpool is 7.92%.
Statewide average employee cost for all school districts is 13.10% for family insurance coverage.
0.0%
10.0%
20.0%
30.0%
40.0%
50.0%
60.0%
70.0%
80.0%
90.0%
0.00%
10.00%
20.00%
30.00%
40.00%
50.00%
60.00%
Pe
rso
nn
el S
erv
ice
Co
sts
as %
of
Tota
l Co
sts
Frin
ge B
en
efi
ts a
s a
% o
f W
age
s Peer Group Fringes Benefits as % of Wages FY12
Fringe/Wages Total PS

East Liverpool CSD– Health Insurance Survey
5
Figure 3: Peer Group Monthly Family Medical Insurance Coverage at September 2013
Beaver State Avg.St.
ClairsvilleSalem
EastLiverpool
CambridgeHarrison
HillSteubenvil
leMartins
Ferry
Bd Share $1,100 $1,191 $1,293 $1,376 $1,599 $1,570 $1,728 $1,780 $1,837
Emp Share $122 $187 $120 $120 $130 $217 $91 $45 $204
Fam Total $1,222 $1,378 $1,413 $1,495 $1,729 $1,787 $1,819 $1,825 $2,041
$0
$500
$1,000
$1,500
$2,000
$2,500
Family Medical & Drug Coverage ELCSD Insurance Survey October 2013
Bd Share Emp Share Fam Total
(1)
(1) SERB 2013 21st Report on Cost of Health Insurance - Data is for school districts with ADM 1,000 - 2,499 . N=328 responses.
*Source: Insurance Survey responses from each district
Figure 4: Peer Group Percentage of Family Medial Insurance Paid By Employees September 2013
2.47%
5.00%
7.50%8.00%
8.50%
10.00% 10.00%
12.15%
13.10%
0.00%
2.00%
4.00%
6.00%
8.00%
10.00%
12.00%
14.00%
Family Medical & Drug Coverage ELCSD Insurance Survey October 2013
Employee %
*Source: Insurance Survey responses from each district

East Liverpool CSD– Health Insurance Survey
6
Figure 5 shows a monthly single insurance cost from a low of $527 to a high of $821. That is an
annual cost of $6,324 to a high of $9,852.
The state average monthly cost for school districts with ADM of 1,000 to 2,499 was $538 per
month or $6,468 annually.
Group average without East Liverpool in the total for single coverage is $706 per month or $8,472
annually.
East Liverpool is $52 per month or $624 annually higher than the group average and $220 per
month or $2,640 annually higher than the state average for all school districts.
Figure 6 shows the percentage of family insurance paid by employees for single coverage. This
ranges from 2.55% to 12.15% in the peer group. East Liverpool’s average is 7.5%.
The peer group average employee cost without East Liverpool is 7.90%.
Statewide average employee cost for all school districts is 12.2% for single insurance coverage.
Figure 5: Peer Group Monthly Single Medical Insurance Coverage at September 2013
Beaver State Avg.St.
ClairsvilleSalem
EastLiverpool
CambridgeSteubenvill
eMartins
FerryHarrison
Hill
Bd Share $474 $474 $549 $566 $701 $684 $764 $734 $780
Emp Share $53 $64 $51 $49 $57 $95 $20 $82 $41
Total Cost $527 $538 $600 $616 $758 $778 $784 $816 $821
$0
$100
$200
$300
$400
$500
$600
$700
$800
$900Single Medical & Drug Coverage ELCSD Insurance Survey October 2013
Bd Share Emp Share Total Cost
(1)
(1) SERB 2013 21st Report on Cost of Health Insurance - Data for all school districts with ADM 1,000 - 2,499 . N=328 responses.
*Source: Insurance Survey responses from each district

East Liverpool CSD– Health Insurance Survey
7
Figure 6: Peer Group Percentage of Single Medial Insurance Paid By Employees September 2013
2.55%
5.00%
7.50%8.00%
8.50%
10.00% 10.00%
12.15% 12.20%
0.00%
2.00%
4.00%
6.00%
8.00%
10.00%
12.00%
14.00%
Single Medical & Drug Coverage ELCSD Insurance Survey October 2013
Employee %
*Source: Insurance Survey responses from each district
Comparison of Family and Single Dental Insurances
The next several tables show comparisons of monthly premiums in effect at the date of this survey for
family and single dental insurances coverage.
Figure 7 shows a monthly family dental insurance cost from a low of $61 to a high of $193. That
is an annual cost of $732 to a high of $2,316.
The state average monthly cost for school districts with ADM of 1,000 to 2,499 was $91 per
month or $1,092 annually.
Group average without East Liverpool in the total for family dental coverage is $87 per month or
$1,049 annually.
East Liverpool is $18 per month or $221 annually lower than the group average and $10 per
month or $120 annually lower than the state average for all school districts.
Figure 8 shows the percentage of family dental insurance paid by employees for family coverage.
This ranges from 0% to 100% in the peer group. East Liverpool’s average is 7.5% employee cost.
The peer group average employee cost without East Liverpool is 15.42%.
Statewide average employee cost for all school districts is 15% for family dental insurance
coverage.

East Liverpool CSD– Health Insurance Survey
8
Figure 7: Peer Group Monthly Family Dental Insurance Coverage at September 2013
St.Clairsville
Steubenville
HarrisonHill
MartinsFerry
EastLiverpool
Beaver Cambridge State Avg. Salem
Bd Share $56 $63 $0 $66 $64 $73 $83 $78 $177
Emp Share $5 $0 $66 $0 $5 $8 $0 $13 $15
Fam Total $61 $63 $66 $66 $69 $81 $83 $91 $193
$0
$50
$100
$150
$200
$250
Family Dental Coverage ELCSD Insurance Survey October 2013
Bd Share Emp Share Fam Total
(1)
(1) SERB 2013 21st Report on Cost of Health Insurance - Data is for school districts statewide. N=456 responses.
*Source: Insurance Survey responses from each district
Figure 8: Peer Group Percentage of Family Dental Insurance Paid By Employees September 2013
0.00% 0.00% 0.00%
7.50% 8.00% 8.50% 10.00%15.00%
100.00%
0.00%
20.00%
40.00%
60.00%
80.00%
100.00%
120.00%
Family Dental Coverage ELCSD Insurance Survey October 2013
Employee %
*Source: Insurance Survey responses from each district
East Liverpool CSD– Health Insurance Survey
9
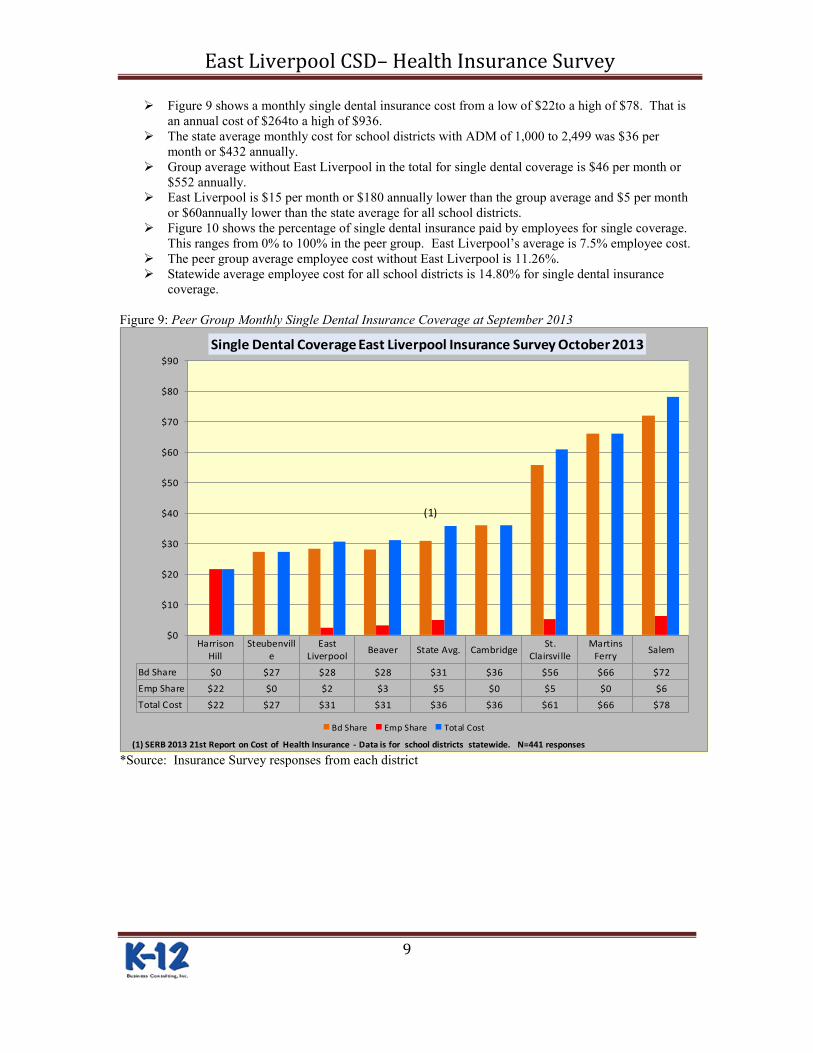
Figure 9 shows a monthly single dental insurance cost from a low of $22to a high of $78. That is
an annual cost of $264to a high of $936.
The state average monthly cost for school districts with ADM of 1,000 to 2,499 was $36 per
month or $432 annually.
Group average without East Liverpool in the total for single dental coverage is $46 per month or
$552 annually.
East Liverpool is $15 per month or $180 annually lower than the group average and $5 per month
or $60annually lower than the state average for all school districts.
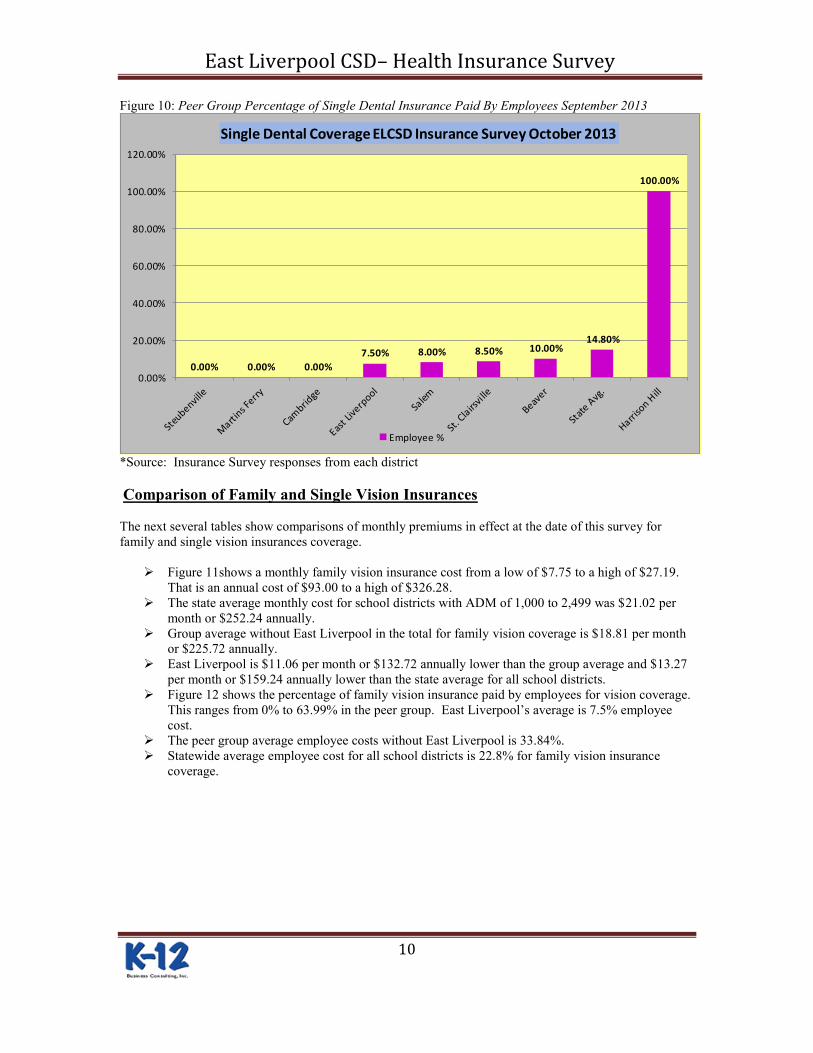
Figure 10 shows the percentage of single dental insurance paid by employees for single coverage.
This ranges from 0% to 100% in the peer group. East Liverpool’s average is 7.5% employee cost.
The peer group average employee cost without East Liverpool is 11.26%.
Statewide average employee cost for all school districts is 14.80% for single dental insurance
coverage.
Figure 9: Peer Group Monthly Single Dental Insurance Coverage at September 2013
HarrisonHill
Steubenville
EastLiverpool
Beaver State Avg. CambridgeSt.
ClairsvilleMartins
FerrySalem
Bd Share $0 $27 $28 $28 $31 $36 $56 $66 $72
Emp Share $22 $0 $2 $3 $5 $0 $5 $0 $6
Total Cost $22 $27 $31 $31 $36 $36 $61 $66 $78
$0
$10
$20
$30
$40
$50
$60
$70
$80
$90
Single Dental Coverage East Liverpool Insurance Survey October 2013
Bd Share Emp Share Total Cost
(1)
(1) SERB 2013 21st Report on Cost of Health Insurance - Data is for school districts statewide. N=441 responses
*Source: Insurance Survey responses from each district
East Liverpool CSD– Health Insurance Survey
10
Figure 10: Peer Group Percentage of Single Dental Insurance Paid By Employees September 2013
0.00% 0.00% 0.00%
7.50% 8.00% 8.50% 10.00%14.80%
100.00%
0.00%
20.00%
40.00%
60.00%
80.00%
100.00%
120.00%
Single Dental Coverage ELCSD Insurance Survey October 2013
Employee %
*Source: Insurance Survey responses from each district
Comparison of Family and Single Vision Insurances
The next several tables show comparisons of monthly premiums in effect at the date of this survey for
family and single vision insurances coverage.
Figure 11shows a monthly family vision insurance cost from a low of $7.75 to a high of $27.19.
That is an annual cost of $93.00 to a high of $326.28.
The state average monthly cost for school districts with ADM of 1,000 to 2,499 was $21.02 per
month or $252.24 annually.
Group average without East Liverpool in the total for family vision coverage is $18.81 per month
or $225.72 annually.
East Liverpool is $11.06 per month or $132.72 annually lower than the group average and $13.27
per month or $159.24 annually lower than the state average for all school districts.
Figure 12 shows the percentage of family vision insurance paid by employees for vision coverage.
This ranges from 0% to 63.99% in the peer group. East Liverpool’s average is 7.5% employee
cost.
The peer group average employee costs without East Liverpool is 33.84%.
Statewide average employee cost for all school districts is 22.8% for family vision insurance
coverage.
East Liverpool CSD– Health Insurance Survey
11
Figure 11: Peer Group Monthly Family Vision Insurance Coverage at September 2013
St.Clairsville
Steubenville
EastLiverpool
Cambridge Salem BeaverHarrison
HillState Avg.
MartinsFerry
Bd Share $0.00 $0.00 $7.17 $12.42 $15.00 $17.50 $7.50 $16.52 $9.79
Emp Share $0.00 $0.00 $0.58 $0.00 $0.00 $1.94 $12.48 $4.50 $17.40
Fam Total $0.00 $0.00 $7.75 $12.42 $15.00 $19.44 $19.98 $21.02 $27.19
$0.00
$5.00
$10.00
$15.00
$20.00
$25.00
$30.00
Family Vision Coverage ELCSD Insurance Survey October 2013
Bd Share Emp Share Fam Total
(1)
(1) SERB 2013 21st Report on Cost of Health Insurance - Data is for school districts statewide. N=305 responses.
N
o
t
o
f
f
e
r
e
d
N
o
t
o
f
f
e
r
e
d
*Source: Insurance Survey responses from each district
Figure 12: Peer Group Percentage of Family Dental Insurance Paid By Employees September 2013
0.00% 0.00%
7.50%9.98%
22.80%
62.46% 63.99%
0.00%
10.00%
20.00%
30.00%
40.00%
50.00%
60.00%
70.00%
Family Vision Coverage ELCSD Insurance Survey October 2013
Employee %
N
o
t
o
f
f
e
r
e
d
N
o
t
o
f
f
e
r
e
d
*Source: Insurance Survey responses from each district

East Liverpool CSD– Health Insurance Survey
12
Figure 13 shows a monthly single vision insurance cost from a low of $3.09 to a high of $15. That
is an annual cost of $37.08 to a high of $180.
The state average monthly cost for school districts with ADM of 1,000 to 2,499 was $9.02 per
month or $108.24 annually.
Group average without East Liverpool in the total for single vision coverage is $9.35 per month or
$112.20 annually.
East Liverpool is $6.26 per month or $75.12 annually lower than the group average and $5.93 per
month or $71.16 annually lower than the state average for all school districts.
Figure 14 shows the percentage of single vision insurance paid by employees for single coverage.
This ranges from 0% to 10% in the peer group. East Liverpool’s average is 7.5% employee cost.
The peer group average employee cost without East Liverpool is 2.87%.
Statewide average employee cost for all school districts is 20.80% for single vision insurance
coverage.
Figure 13: Peer Group Monthly Single Vision Insurance Coverage at September 2013
St.Clairsville
Steubenville
EastLiverpool
CambridgeHarrison
HillBeaver State Avg.
MartinsFerry
Salem
Bd Share $0.00 $0.00 $2.86 $5.41 $7.50 $7.73 $7.25 $9.79 $15.00
Emp Share $0.00 $0.00 $0.23 $0.00 $0.48 $0.86 $1.77 $0.00 $0.00
Total Cost $0.00 $0.00 $3.09 $5.41 $7.98 $8.59 $9.02 $9.79 $15.00
$0.00
$2.00
$4.00
$6.00
$8.00
$10.00
$12.00
$14.00
$16.00
Single Vision Coverage East Liverpool Insurance Survey October 2013
Bd Share Emp Share Total Cost
(1)
(1) SERB 2013 21st Report on Cost of Health Insurance - Data is for school districts statewide. N=301 responses.
N
o
t
o
f
f
e
r
e
d
N
o
t
o
f
f
e
r
e
d
*Source: Insurance Survey responses from each district

East Liverpool CSD– Health Insurance Survey
13
Figure 14: Peer Group Percentage of Single Vision Insurance Paid By Employees September 2013
0.00% 0.00% 0.00%
6.02%7.44%
10.01%
20.80%
0.00%
5.00%
10.00%
15.00%
20.00%
25.00%
Single Vision Coverage ELCSD Insurance Survey October 2013
Employee %
N
o
t
o
f
f
e
r
e
d
N
o
t
o
f
f
e
r
e
d
*Source: Insurance Survey responses from each district
Affordable Care Act Cadillac Tax Insurance Projector for 2013 through 2022
Table 2 and 3 along with Figure 15 and 16 on the following pages are presented to project where each of
the peer group districts may be in 2018 when the “Cadillac Tax” as authorized by the Affordable Care Act
will become law January 1, 2018. The Cadillac Tax is a 40% excise tax that will be collected from districts
on the value of family and single health care plans that exceed the targets of $10,200 for single plans and
$27,500 for family plans beginning January 1, 2018. The Cadillac Tax will not consider the value of
dental, vision and life insurance plans as part of the target values. What does count towards the thresholds
is any amount paid by employer, employee and any health savings or health reimbursement account
payments. Other assumptions in the following tables and figures are noted below:
After January 1, 2018, the thresholds will be adjusted for inflation (normal consumer price index
`CPI) +1% in 2019. Then from 2020 and beyond the thresholds will index to CPI only. The
concern is that medical trend grows at double and more of regular CPI. This will eventually
assure all districts and employers in the United States will at some point pay the 40% excise tax.
It is critical for districts to be looking long term now to help avoid the 40% tax if at all possible.
Table 2 assumes a medical trend factor of 7% growth per year beginning in 2014. Each district’s
actual trend may be higher or lower. The annual medical premiums in 2013 are actual premiums in
effect now for each of the districts. The “Model District” represents a district medical and
prescription drug annual cost in 2013 that when inflated by the 7% annual cost assumption would
reach $27,500 in 2018. This represents a point of reference for any district whose premium in
2013 is currently in excess of this benchmark. In other words, if a districts premium is higher than
the “Model District “level in 2013 they are in serious jeopardy of hitting the Cadillac Tax
threshold in 2018.
Table 3 shows the same data only for single medical and prescription drug coverage and uses the
Cadillac Tax threshold of $10,200 in 2018.

East Liverpool CSD– Health Insurance Survey
14
Any district whose 2013 annual family premium below in Table 2 is higher than the “Model
District” annual premium is in jeopardy of hitting the Cadillac Tax Threshold in 2018.
Table 2: Affordable Care Act Cadillac Tax Projector For Family Insurance Premiums
CPI Trend Est. 7.00%
Annualized Family Medical & Drug Premium ELCSD Insurance Survey October 2013
Cadillac Tax Projector 2013 to Est. 2022 - Current Family Medical Premiums
District Actual 2013 E14 E15 E16 E17 E18 E19 E20 E21 E22
Martins Ferry $24,492 $26,206 $28,041 $30,004 $32,104 $34,351 $36,756 $39,329 $42,082 $45,028
Steubenville $21,900 $23,433 $25,073 $26,828 $28,706 $30,716 $32,866 $35,167 $37,628 $40,262
Harrison Hill $21,828 $23,356 $24,991 $26,740 $28,612 $30,615 $32,758 $35,051 $37,505 $40,130
Cambridge $21,444 $22,945 $24,551 $26,270 $28,109 $30,076 $32,182 $34,434 $36,845 $39,424
East Liverpool $20,748 $22,200 $23,754 $25,417 $27,196 $29,100 $31,137 $33,317 $35,649 $38,144
Model District $19,607 $20,979 $22,448 $24,019 $25,701 $27,500 $29,425 $31,485 $33,688 $36,047
Salem $17,940 $19,196 $20,540 $21,977 $23,516 $25,162 $26,923 $28,808 $30,824 $32,982
St. Clairsville $16,956 $18,143 $19,413 $20,772 $22,226 $23,782 $25,446 $27,228 $29,134 $31,173
State Avg. $16,500 $17,655 $18,891 $20,213 $21,628 $23,142 $24,762 $26,495 $28,350 $30,335
Beaver $14,664 $15,690 $16,789 $17,964 $19,222 $20,567 $22,007 $23,547 $25,195 $26,959
CPI Est. 4% Post 2018 $27,500 $28,600 $29,744 $30,934 $32,171
*Source: Affordable Care Act Website and Current 2013 Premiums from Insurance Survey Responses from
each district
It is predicted below in Figure 15 that based on current 2013 family medical insurance rates and a
7% medical trend that East Liverpool, Harrison Hills, Steubenville, Salem, Martins Ferry and
Cambridge will all hit the Cadillac Tax threshold in 2018.
By2022 it is predicted that only St.Clairsville and Beaver may not be affected by the Cadillac Tax.
Figure 15: Projection of Family Insurance Premiums at 7% Trend to 2018 Cadillac Tax Point $27,500
$12,000
$14,500
$17,000
$19,500
$22,000
$24,500
$27,000
$29,500
$32,000
$34,500
$37,000
$39,500
$42,000
Actual 2013 E14 E15 E16 E17 E18 E19 E20 E21 E22
An
nu
al P
rem
ium
Cadillac Tax Projector 2013 to Est. 2022 - Current Family Medical Premiums
Steubenville
Harrison Hill
Cambridge
East Liverpool
Model District
Salem
St. Clairsville
State Avg.
Beaver
CPI Est. 4%Post 2018
= $27,500 ACA Cadillac Tax Point 2018
*Source: Affordable Care Act Website and Current 2013 Premiums from Insurance Survey Responses from
each district

East Liverpool CSD– Health Insurance Survey
15
Any district whose 2013 annual single premium below in Table 3 is higher than the “Model
District” annual premium is in jeopardy of hitting the Cadillac Tax Threshold in 2018.
All but Beaver local is projected to be affected by the Cadillac Tax by 2022.
Table 3: Affordable Care Act Cadillac Tax Projector For Single Insurance Premiums
CPI Trend Est. 7.00%
Annualized Single Medical & Drug Premium ELCSD Insurance SurveyOctober 2013
Cadillac Tax Projector 2013 to Est. 2022 - Current Single Medical Premiums
District Actual 2013 E14 E15 E16 E17 E18 E19 E20 E21 E22
Harrison Hill $9,852 $10,542 $11,280 $12,069 $12,914 $13,818 $14,785 $15,820 $16,928 $18,113
Martins Ferry $9,792 $10,477 $11,211 $11,996 $12,835 $13,734 $14,695 $15,724 $16,824 $18,002
Steubenville $9,408 $10,067 $10,771 $11,525 $12,332 $13,195 $14,119 $15,107 $16,165 $17,296
Cambridge $9,336 $9,990 $10,689 $11,437 $12,238 $13,094 $14,011 $14,992 $16,041 $17,164
East Liverpool $9,096 $9,733 $10,414 $11,143 $11,923 $12,758 $13,651 $14,606 $15,629 $16,723
Salem $7,392 $7,909 $8,463 $9,056 $9,689 $10,368 $11,093 $11,870 $12,701 $13,590
Model District $7,273 $7,782 $8,326 $8,909 $9,533 $10,200 $10,914 $11,678 $12,496 $13,370
St. Clairsville $7,200 $7,704 $8,243 $8,820 $9,438 $10,098 $10,805 $11,562 $12,371 $13,237
State Avg. $6,468 $6,921 $7,405 $7,924 $8,478 $9,072 $9,707 $10,386 $11,113 $11,891
Beaver $6,324 $6,767 $7,240 $7,747 $8,289 $8,870 $9,491 $10,155 $10,866 $11,626
CPI Est. 4% Post 2018 $10,200 $10,608 $11,032 $11,474 $11,933
*Source: Affordable Care Act Website and Current 2013 Premiums from Insurance Survey Responses from
each district
It is predicted below in Figure 16 that based on current 2013 single medical insurance rates and a
7% medical trend that East Liverpool, Harrison Hills, Steubenville, Martins Ferry, Salem, St.
Clairsville and Cambridge will all hit the Cadillac Tax threshold in 2018.
By2022 it is predicted that only Beaver Local may not be affected by the Cadillac Tax.
Figure 16: Projection of Single Insurance Premiums at 7% Trend to 2018 Cadillac Tax Point $10,200
$5,000
$6,500
$8,000
$9,500
$11,000
$12,500
$14,000
$15,500
$17,000
$18,500
$20,000
Actual 2013 E14 E15 E16 E17 E18 E19 E20 E21 E22
Ann
ual P
rem
ium
Cadillac Tax Projector 2013 to Est. 2022 - Current Single Medical Premiums
Harrison Hill
Martins Ferry
Steubenville
Cambridge
East Liverpool
Salem
Model District
St. Clairsville
State Avg.
Beaver
CPI Est. 4% Post2018
= $10,200 ACA Cadillac Tax Point 2018
*Source: Affordable Care Act Website and Current 2013 Premiums from Insurance Survey Responses from
each district

East Liverpool CSD– Health Insurance Survey
16
Schedule of Medical Benefits
Table 4 on the following page shows a condensed summary of the Schedule of Benefits for each
of the districts that supplied this information. There are many more items included in a full
schedule of benefits but generally speaking the amount of money that is charged for deductibles,
co-insurance, maximum out-of-pockets limits for In-network and Out-of-Network are key drivers
of health care plan dollars.
At the bottom of Table 4 the annual health insurance premiums for each district is noted as is the
percentage of annual premiums plus (+) or (-) the state wide average for all school districts which
is used as a benchmark for performance for the comparison districts.
Table 4 shows that the districts with the highest Out-of-Pocket maximums for both In-Network
and Out-of -Network also have the lowest annual premiums compared to the Statewide
Benchmark. Higher deductibles and coinsurance limits are generally known to lower insurance
premium costs overall.
Conversely, the districts with the lowest Out-of-Pocket generally have the highest annual
insurance cost.
East Liverpool has one of the lower Out-of-Pocket maximums of the peer group districts
compared. Increasing deductibles and adjusting In-Network Out-of-Pocket maximums to $1,000
single and $2,000 family and Out-of-Network to $2,000/$4,000 would likely lower costs for East
Liverpool.

East Liverpool CSD– Health Insurance Survey
17
Table 4: Schedule of Medical Benefits East Liverpool Insurance Survey
Medical Insurance Benefits - Schedule of Benefits 2013
Major C
omponents
of Medica
l Cost
s
East
Liverp
ool
Beaver
Cambrid
ge
Harriso
n Hills
Steubenvil
leSa
lem
- PPO P
lanSt
. Clairs
ville
- PPO
Marti
ns Fry
.
* Dat
a Not P
rovid
edSt
ate A
vg.
In-Network
Single Coverage
$0 Deductible 11.20%
$1 to $100 Deductible $100 $100 25.20%
$125-400 Deductible $150 $300 $175 $200 27.90%
$500 - $1,199 Deductible $500 19.80%
$1,200 or more Deductible 15.90%
Family Coverage
$0 Deductible 11.30%
$1 to $200 Deductible $200 $200 16.90%
$200-800 Deductible $300 $600 $350 $400 27.20%
$801- $2,399 Deductible $1,000 20.90%
$2,400 or more Deductible 23.70%
Out-Of-Network Single Coverage
$0 Deductible 11.20%
$1 to $100 Deductible 25.20%
$125-400 Deductible $150 $175 $200 $200 $200 27.90%
$500 - $1,199 Deductible $600 $1,000 19.80%
$1,200 or more Deductible 15.90%
Family Coverage
$0 Deductible 11.30%
$1 to $200 Deductible 16.90%
$200-800 Deductible $300 $350 $400 $400 $400 27.20%
$801- $2,399 Deductible $1,200 $2,000 20.90%
$2,400 or more Deductible 23.70%
Co-InsuranceIn-Network
Plan Pays 100% 100.00% 100.00% 26.10%
Plan Pays 90 - 99% 90.00% 90.00% 90.00% 90.00% 41.10%
Plan Pays 80 - 89% 80.00% 30.40%
Plan Pay 80% < 2.40%
Out-of-Network Plan Pays 90 -100% 90.00% 1.40%
Plan Pays 80 - 89% 80.00% 80.00% 33.50%
Plan Pays 70 - 79% 70.00% 70.00% 70.00% 70.00% 32.50%
Plan Pays 60 - 69% 27.60%
Plan Pay 60% < 5.00%
Out-of-Pocket Max In-
Network
Single Coverage Max $550 $800 $300 $250 $1,000 $500 $500 $1,000 Median
Family Coverage Max $700 $1,600 $600 $500 $2,000 $1,000 $1,000 $2,000 Median
Out-of-Pocket Max Out-
of-Network
Single Coverage Max $1,050 $1,600 $400 $750 $2,500 $1,000 $1,000 $2,000 Median
Family Coverage Max $1,200 $3,200 $800 $1,500 $5,000 $2,000 $2,000 $4,000 Median
Single Annual Premium $9,096 $6,324 $9,336 $9,852 $9,408 $7,392 $7,200 $9,792 $6,468
Family Annual Premium $20,748 $14,664 $21,444 $21,828 $21,900 $17,940 $16,956 $24,492 $16,500
Single Annual Premium 40.63% -2.23% 44.34% 52.32% 45.45% 14.29% 11.32% 51.39% $6,468
Family Annual Premium 25.75% -11.13% 29.96% 32.29% 32.73% 8.73% 2.76% 48.44% $16,500
Current 2013 Annual Premium Cost
% Higher (+)/Lower (-) Than State Average Costs -2013
*Source: Insurance Survey responses from each district