elastomer · rubber · material parameter optimisation of ... · mechanical properties strongly...
TRANSCRIPT
PRÜFEN UND MESSEN TESTING AND MEASURING
33KGK · 11-12 2015www.kgk-rubberpoint.de
Elastomer · rubber · material parameter · reverse engineering · nonlinear opti-misation · compression test
The determination of mechanical mate-rial parameters of elastomers is not ea-sily possible. This is due to the fact that mechanical properties strongly depend on the composition of the underlying rubber compound and its manufactu-ring process. Furthermore, in uniaxial compression tests, data free of friction is required to gain realistic hyperelastic material parameters. The procedure presented here is characterised by the deployment of suitable optimisation tools until the simulation results coinci-de with comparable low friction test re-sults. This method proves to be much more time and cost efficient rather than elaborate low friction compression test setups eventually yielding similar results.
Optimierung von nichtlinea-ren Materialparametern in uniaxialen Kompressionstests von Elastomerproben unter Einbeziehung von Reibung Elastomer · Gummi · Materialparame-ter · Reverse-Engineering · nichtlineare Optimierung · Drucktest
Die Ermittlung der mechanischen Ma-terialparameter von Elastomeren ist nicht ohne weiteres möglich. Dies liegt einerseits daran, dass die Eigenschaften der zu Grunde liegenden Mischungen stark von ihrer Zusammensetzung und dem Herstellprozess abhängen. Ande-rerseits werden für die realitätsnahe Anwendung hyperelastischer Material-modelle u. a. reibungsarme einachsige Drucktests benötigt. Das hier vorge-stellte Verfahren basiert auf einer com-puterbasierten Optimierung zunächst reibungsbehafteter Materialparameter. Durch die Optimierung werden die Pa-rameter so lange variiert, bis die Simu-lation zu vergleichbaren Ergebnissen führt wie ein reibungsarmer Testauf-bau. Diese Methode ist sehr viel zeit- und kosteneffizienter als der rein expe-rimentelle Ansatz, der am Ende ver-gleichbare Ergebnisse liefert.
Figures and tables:By a kind approval of the authors.
IntroductionElastomers consist of various compound ingredients, which usually do not under-lie any norm but the specifications of the particular manufacturer, instead. Fur-thermore, the properties of the end pro-duct highly depend on the manufactu-ring process. The corresponding mecha-nical material parameters are therefore often unknown as well as not automati-cally available. Nevertheless, it is impor-tant to gain knowledge of these parame-ters in order to accurately describe the mechanical behaviour of critical industri-al components made from elastomers. In particular the material parameters can be derived by means of stress-strain-curves that depend on various experi-mental test configurations. The mini-mum requirements to generate such curves are uniaxial tensile and compres-sion tests which can represent homoge-neous stress states. For a more detailed account on test requirements and the theory of nonlinear elasticity in general, the interested reader is referred to [1].
Preferably, the test samples come from finished components, due to the fact that the vulcanisation process and therefore the resulting material behavi-our is also influenced by the part geome-try. For tensile tests it is easily possible to measure homogeneous stress states. In that case the test samples just need to be long enough in order to respresent a homogenous stress state at the center of a test specimen. A subsequent determi-nation of the associated material para-meters does not represent any problems.
In contrast, the friction in between the clamping plates and the test speci-men in compression tests leads to in-tensly inhomogeneous stress states. However, the adaptation of the mechani-cal material parameters assumes fully homogeneous stress-strain-curves which ideally require friction free test setups in compression. In general it is very challen-ging if not even impossible to provide compression test setups that can replica-te homogeneous stress states. Friction
based interferences are always present to a certain extent and distort the resul-ting material parameters.
The computer based optimisation methods presented in this paper allow the retrieval of realistic mechanical ma-terial parameters even for friction based uniaxial compression tests. It proves to be very time and cost efficient and forms an economic way for realistic simulati-ons of critical elastomer components.
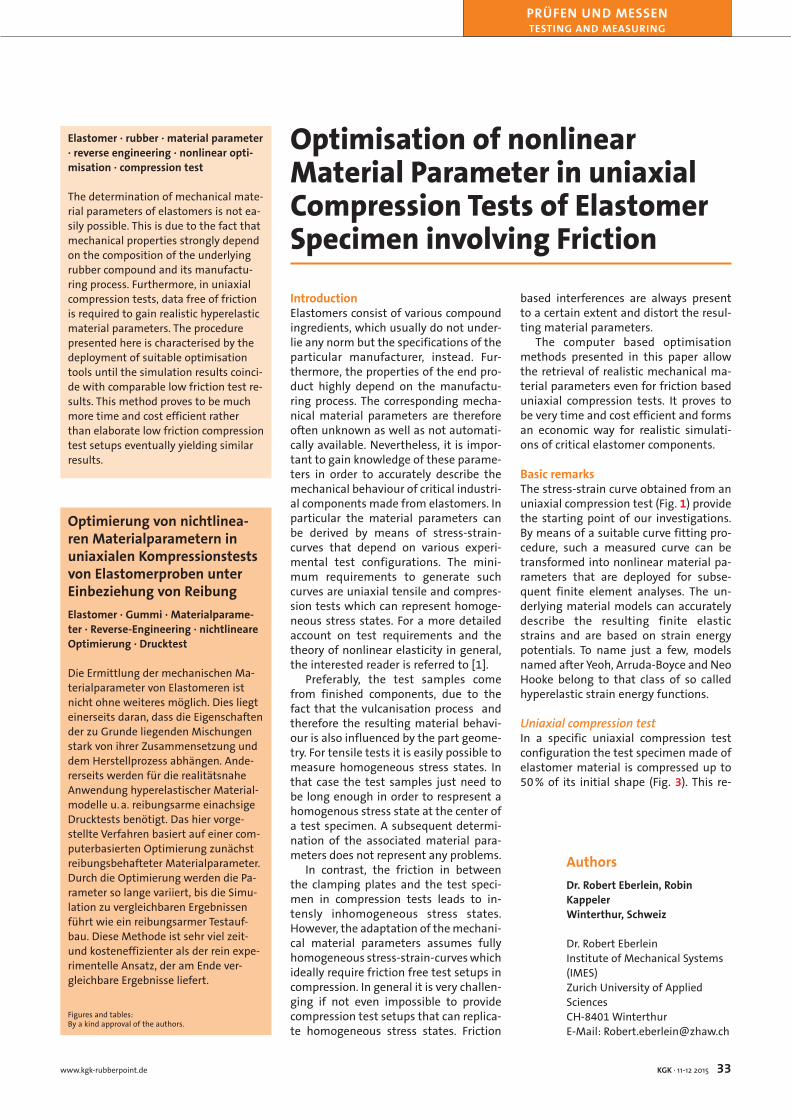
Basic remarksThe stress-strain curve obtained from an uniaxial compression test (Fig. 1) provide the starting point of our investigations. By means of a suitable curve fitting pro-cedure, such a measured curve can be transformed into nonlinear material pa-rameters that are deployed for subse-quent finite element analyses. The un-derlying material models can accurately describe the resulting finite elastic strains and are based on strain energy potentials. To name just a few, models named after Yeoh, Arruda-Boyce and Neo Hooke belong to that class of so called hyperelastic strain energy functions.
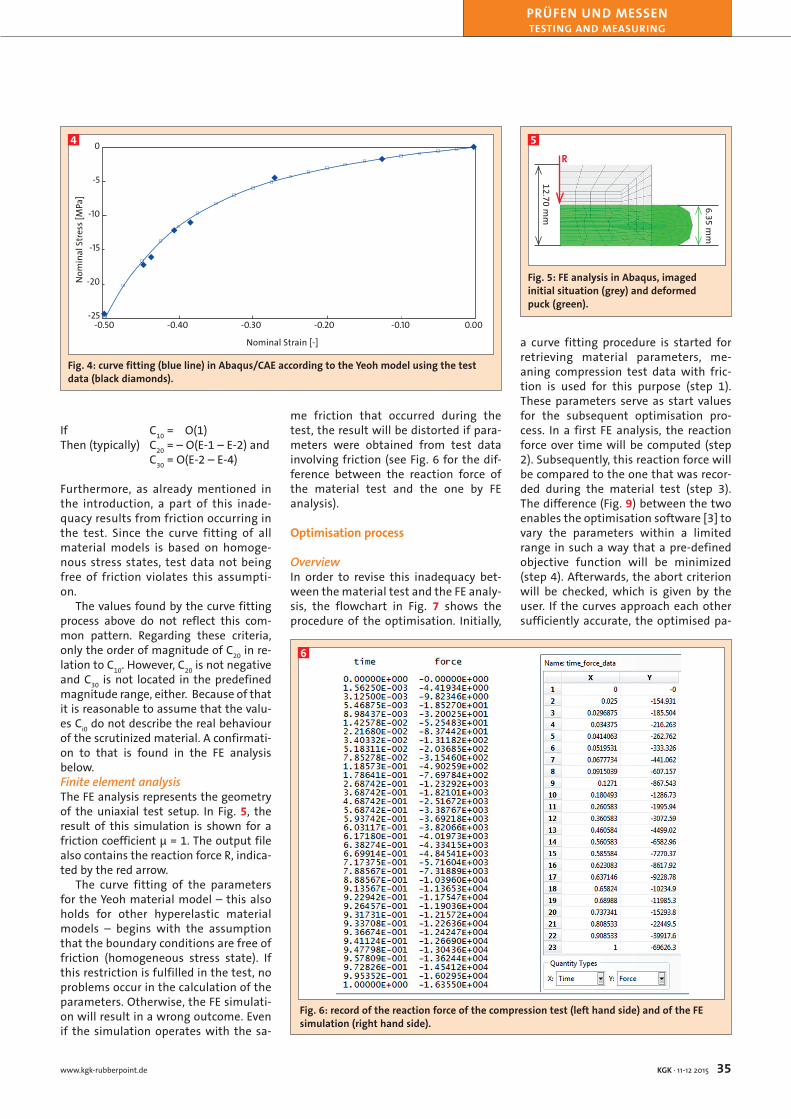
Uniaxial compression testIn a specific uniaxial compression test configuration the test specimen made of elastomer material is compressed up to 50 % of its initial shape (Fig. 3). This re-
Optimisation of nonlinear Material Parameter in uniaxial Compression Tests of Elastomer Specimen involving Friction
AuthorsDr. Robert Eberlein, Robin KappelerWinterthur, Schweiz
Dr. Robert EberleinInstitute of Mechanical Systems (IMES)Zurich University of Applied SciencesCH-8401 WinterthurE-Mail: [email protected]
PRÜFEN UND MESSEN TESTING AND MEASURING
34 KGK · 11-12 2015 www.kgk-rubberpoint.de
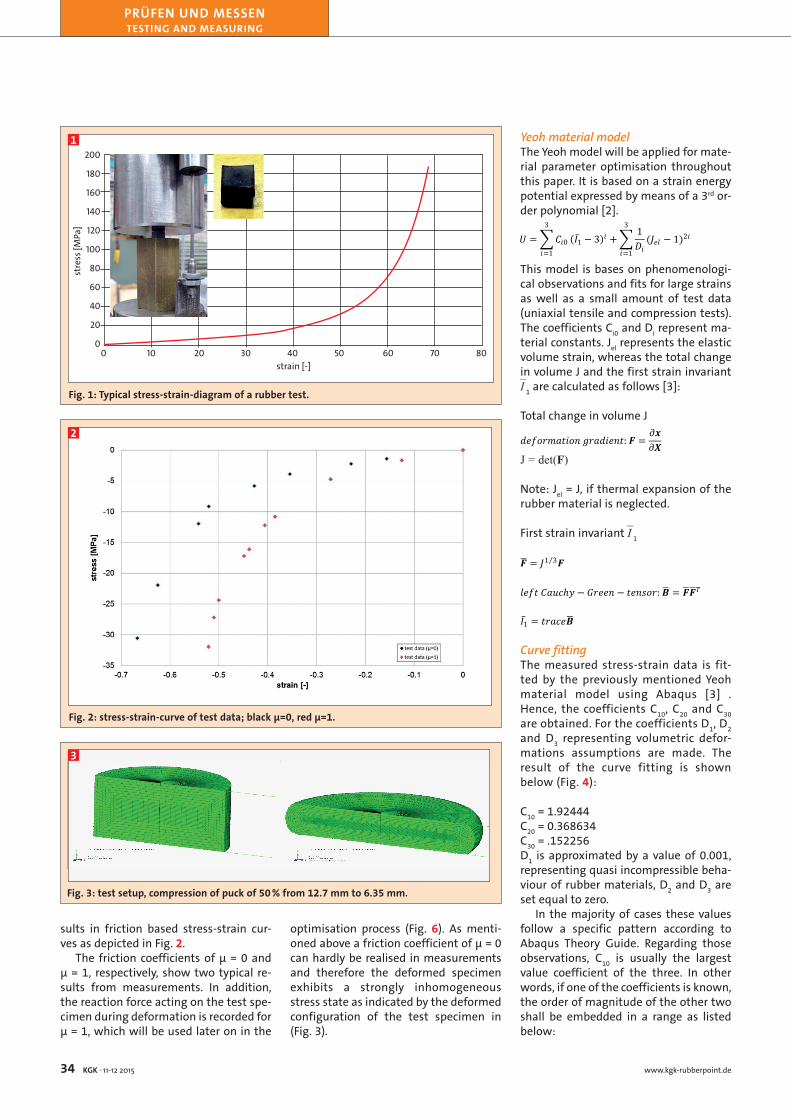
sults in friction based stress-strain cur-ves as depicted in Fig. 2.
The friction coefficients of μ = 0 and μ = 1, respectively, show two typical re-sults from measurements. In addition, the reaction force acting on the test spe-cimen during deformation is recorded for μ = 1, which will be used later on in the
optimisation process (Fig. 6). As menti-oned above a friction coefficient of μ = 0 can hardly be realised in measurements and therefore the deformed specimen exhibits a strongly inhomogeneous stress state as indicated by the deformed configuration of the test specimen in (Fig. 3).
Yeoh material modelThe Yeoh model will be applied for mate-rial parameter optimisation throughout this paper. It is based on a strain energy potential expressed by means of a 3rd or-der polynomial [2].
𝑈𝑈 = �𝐶𝐶𝑖𝑖0
3
𝑖𝑖=1
(𝐼𝐼1̅ − 3)𝑖𝑖 + �1𝐷𝐷𝑖𝑖
3
𝑖𝑖=1
(𝐽𝐽𝑒𝑒𝑒𝑒 − 1)2𝑖𝑖
This model is bases on phenomenologi-cal observations and fits for large strains as well as a small amount of test data (uniaxial tensile and compression tests). The coefficients Ci0 and Di represent ma-terial constants. Jel represents the elastic volume strain, whereas the total change in volume J and the first strain invariant I–
1 are calculated as follows [3]:
Total change in volume J
𝑑𝑑𝑑𝑑𝑑𝑑𝑑𝑑𝑑𝑑𝑑𝑑𝑑𝑑𝑑𝑑𝑑𝑑𝑑𝑑𝑑𝑑 𝑔𝑔𝑑𝑑𝑑𝑑𝑑𝑑𝑑𝑑𝑑𝑑𝑑𝑑𝑑𝑑: 𝑭𝑭 =𝜕𝜕𝒙𝒙𝜕𝜕𝑿𝑿
J = det(F)
Note: Jel = J, if thermal expansion of the rubber material is neglected.
First strain invariant I–
1
𝑭𝑭� = 𝐽𝐽1 3⁄ 𝑭𝑭
𝑙𝑙𝑙𝑙𝑙𝑙𝑙𝑙 𝐶𝐶𝐶𝐶𝐶𝐶𝐶𝐶ℎ𝑦𝑦 − 𝐺𝐺𝐺𝐺𝑙𝑙𝑙𝑙𝐺𝐺 − 𝑙𝑙𝑙𝑙𝐺𝐺𝑡𝑡𝑡𝑡𝐺𝐺: 𝑩𝑩� = 𝑭𝑭�𝑭𝑭�𝑇𝑇
𝐼𝐼1̅ = 𝑡𝑡𝑡𝑡𝑡𝑡𝑡𝑡𝑡𝑡𝑩𝑩�
Curve fittingThe measured stress-strain data is fit-ted by the previously mentioned Yeoh material model using Abaqus [3] .Hence, the coefficients C10, C20 and C30 are obtained. For the coefficients D1, D2 and D3 representing volumetric defor-mations assumptions are made. The result of the curve fitting is shown below (Fig. 4):
C10 = 1.92444C20 = 0.368634C30 = .152256D1 is approximated by a value of 0.001, representing quasi incompressible beha-viour of rubber materials, D2 and D3 are set equal to zero.
In the majority of cases these values follow a specific pattern according to Abaqus Theory Guide. Regarding those observations, C10 is usually the largest value coefficient of the three. In other words, if one of the coefficients is known, the order of magnitude of the other two shall be embedded in a range as listed below:
Fig. 1: Typical stress-strain-diagram of a rubber test.
1
strain [-]
stre
ss [M
Pa]
0 10 20 30 40 50 60 70 80
200
180
160
140
120
100
80
60
40
20
0
Fig. 2: stress-strain-curve of test data; black µ=0, red µ=1.
2
Fig. 3: test setup, compression of puck of 50 % from 12.7 mm to 6.35 mm.
3
PRÜFEN UND MESSEN TESTING AND MEASURING
35KGK · 11-12 2015www.kgk-rubberpoint.de
If C10 = O(1)Then (typically) C20 = – O(E-1 – E-2) and C30 = O(E-2 – E-4)
Furthermore, as already mentioned in the introduction, a part of this inade-quacy results from friction occurring in the test. Since the curve fitting of all material models is based on homoge-nous stress states, test data not being free of friction violates this assumpti-on.
The values found by the curve fitting process above do not reflect this com-mon pattern. Regarding these criteria, only the order of magnitude of C20 in re-lation to C10. However, C20 is not negative and C30 is not located in the predefined magnitude range, either. Because of that it is reasonable to assume that the valu-es Ci0 do not describe the real behaviour of the scrutinized material. A confirmati-on to that is found in the FE analysis below.Finite element analysisThe FE analysis represents the geometry of the uniaxial test setup. In Fig. 5, the result of this simulation is shown for a friction coefficient μ = 1. The output file also contains the reaction force R, indica-ted by the red arrow.
The curve fitting of the parameters for the Yeoh material model – this also holds for other hyperelastic material models – begins with the assumption that the boundary conditions are free of friction (homogeneous stress state). If this restriction is fulfilled in the test, no problems occur in the calculation of the parameters. Otherwise, the FE simulati-on will result in a wrong outcome. Even if the simulation operates with the sa-
me friction that occurred during the test, the result will be distorted if para-meters were obtained from test data involving friction (see Fig. 6 for the dif-ference between the reaction force of the material test and the one by FE analysis).
Optimisation process
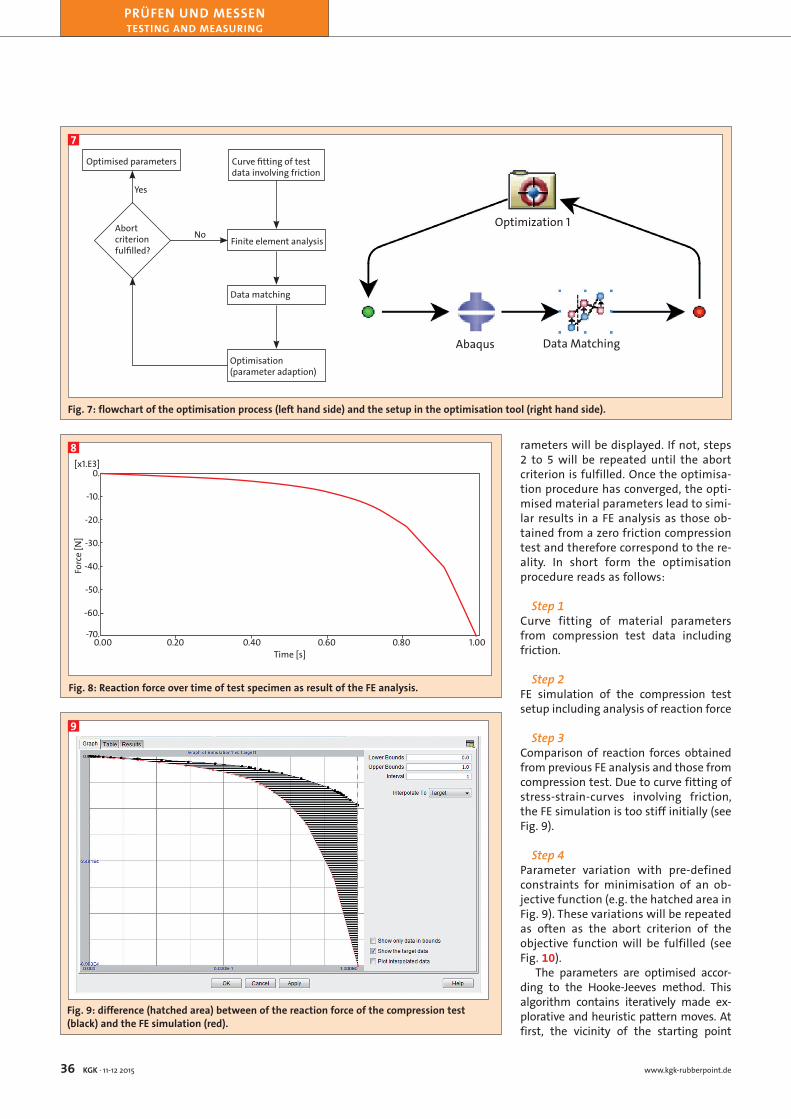
OverviewIn order to revise this inadequacy bet-ween the material test and the FE analy-sis, the flowchart in Fig. 7 shows the procedure of the optimisation. Initially,
a curve fitting procedure is started for retrieving material parameters, me-aning compression test data with fric-tion is used for this purpose (step 1). These parameters serve as start values for the subsequent optimisation pro-cess. In a first FE analysis, the reaction force over time will be computed (step 2). Subsequently, this reaction force will be compared to the one that was recor-ded during the material test (step 3). The difference (Fig. 9) between the two enables the optimisation software [3] to vary the parameters within a limited range in such a way that a pre-defined objective function will be minimized (step 4). Afterwards, the abort criterion will be checked, which is given by the user. If the curves approach each other sufficiently accurate, the optimised pa-
Fig. 4: curve fitting (blue line) in Abaqus/CAE according to the Yeoh model using the test data (black diamonds).
4
Nominal Strain [-]
-0.50 -0.40 -0.30 -0.20 -0.10 0.00
0
-5
-10
-15
-20
-25
Nom
inal
Str
ess [
MPa
]
Fig. 6: record of the reaction force of the compression test (left hand side) and of the FE simulation (right hand side).
6
Fig. 5: FE analysis in Abaqus, imaged initial situation (grey) and deformed puck (green).
5
R
12.70 mm
6.35 mm
PRÜFEN UND MESSEN TESTING AND MEASURING
36 KGK · 11-12 2015 www.kgk-rubberpoint.de
rameters will be displayed. If not, steps 2 to 5 will be repeated until the abort criterion is fulfilled. Once the optimisa-tion procedure has converged, the opti-mised material parameters lead to simi-lar results in a FE analysis as those ob-tained from a zero friction compression test and therefore correspond to the re-ality. In short form the optimisation procedure reads as follows:
Step 1Curve fitting of material parameters from compression test data including friction.
Step 2FE simulation of the compression test setup including analysis of reaction force
Step 3Comparison of reaction forces obtained from previous FE analysis and those from compression test. Due to curve fitting of stress-strain-curves involving friction, the FE simulation is too stiff initially (see Fig. 9).
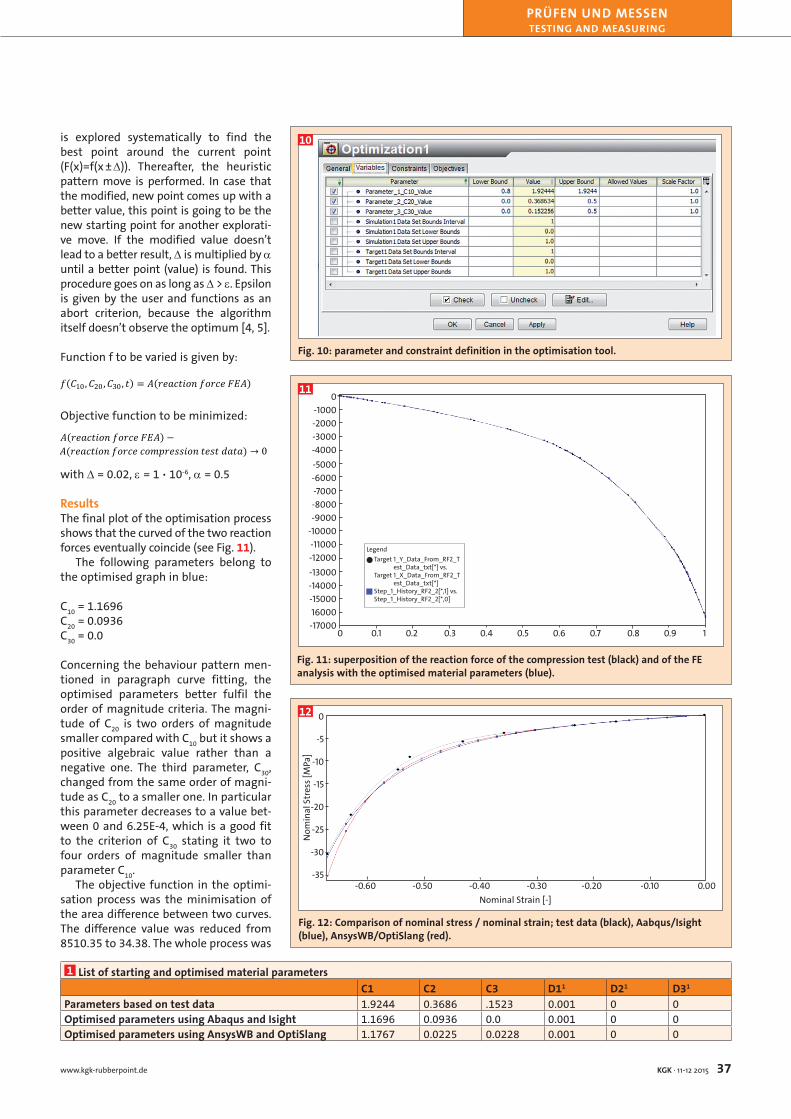
Step 4Parameter variation with pre-defined constraints for minimisation of an ob-jective function (e.g. the hatched area in Fig. 9). These variations will be repeated as often as the abort criterion of the objective function will be fulfilled (see Fig. 10).
The parameters are optimised accor-ding to the Hooke-Jeeves method. This algorithm contains iteratively made ex-plorative and heuristic pattern moves. At first, the vicinity of the starting point
Fig. 7: flowchart of the optimisation process (left hand side) and the setup in the optimisation tool (right hand side).
7
Optimised parameters
Yes
NoAbort criterion fulfilled?
Curve fitting of test data involving friction
Finite element analysis
Data matching
Optimisation(parameter adaption)
Optimization 1
Abaqus Data Matching
Fig. 8: Reaction force over time of test specimen as result of the FE analysis.
8
Time [s]0.00 0.20 0.40 0.60 0.80 1.00
[x1.E3]0.
-10.
-20.
-30.
-40.
-50.
-60.
-70.
Forc
e [N
]
Fig. 9: difference (hatched area) between of the reaction force of the compression test (black) and the FE simulation (red).
9
PRÜFEN UND MESSEN TESTING AND MEASURING
37KGK · 11-12 2015www.kgk-rubberpoint.de
1 List of starting and optimised material parametersC1 C2 C3 D11 D21 D31
Parameters based on test data 1.9244 0.3686 .1523 0.001 0 0Optimised parameters using Abaqus and Isight 1.1696 0.0936 0.0 0.001 0 0Optimised parameters using AnsysWB and OptiSlang 1.1767 0.0225 0.0228 0.001 0 0
Fig. 10: parameter and constraint definition in the optimisation tool.
10is explored systematically to find the best point around the current point (F(x)=f(x ± ∆)). Thereafter, the heuristic pattern move is performed. In case that the modified, new point comes up with a better value, this point is going to be the new starting point for another explorati-ve move. If the modified value doesn’t lead to a better result, ∆ is multiplied by α until a better point (value) is found. This procedure goes on as long as ∆ > ε. Epsilon is given by the user and functions as an abort criterion, because the algorithm itself doesn’t observe the optimum [4, 5].
Function f to be varied is given by: 𝑓𝑓(𝐶𝐶10,𝐶𝐶20,𝐶𝐶30, 𝑡𝑡) = 𝐴𝐴(𝑟𝑟𝑟𝑟𝑟𝑟𝑟𝑟𝑡𝑡𝑟𝑟𝑟𝑟𝑟𝑟 𝑓𝑓𝑟𝑟𝑟𝑟𝑟𝑟𝑟𝑟 𝐹𝐹𝐹𝐹𝐴𝐴)
Objective function to be minimized: 𝐴𝐴(𝑟𝑟𝑟𝑟𝑟𝑟𝑟𝑟𝑟𝑟𝑟𝑟𝑟𝑟𝑟𝑟 𝑓𝑓𝑟𝑟𝑟𝑟𝑟𝑟𝑟𝑟 𝐹𝐹𝐹𝐹𝐴𝐴) − 𝐴𝐴(𝑟𝑟𝑟𝑟𝑟𝑟𝑟𝑟𝑟𝑟𝑟𝑟𝑟𝑟𝑟𝑟 𝑓𝑓𝑟𝑟𝑟𝑟𝑟𝑟𝑟𝑟 𝑟𝑟𝑟𝑟𝑐𝑐𝑐𝑐𝑟𝑟𝑟𝑟𝑐𝑐𝑐𝑐𝑟𝑟𝑟𝑟𝑟𝑟 𝑟𝑟𝑟𝑟𝑐𝑐𝑟𝑟 𝑑𝑑𝑟𝑟𝑟𝑟𝑟𝑟) → 0
𝐴𝐴(𝑟𝑟𝑟𝑟𝑟𝑟𝑟𝑟𝑟𝑟𝑟𝑟𝑟𝑟𝑟𝑟 𝑓𝑓𝑟𝑟𝑟𝑟𝑟𝑟𝑟𝑟 𝐹𝐹𝐹𝐹𝐴𝐴) − 𝐴𝐴(𝑟𝑟𝑟𝑟𝑟𝑟𝑟𝑟𝑟𝑟𝑟𝑟𝑟𝑟𝑟𝑟 𝑓𝑓𝑟𝑟𝑟𝑟𝑟𝑟𝑟𝑟 𝑟𝑟𝑟𝑟𝑐𝑐𝑐𝑐𝑟𝑟𝑟𝑟𝑐𝑐𝑐𝑐𝑟𝑟𝑟𝑟𝑟𝑟 𝑟𝑟𝑟𝑟𝑐𝑐𝑟𝑟 𝑑𝑑𝑟𝑟𝑟𝑟𝑟𝑟) → 0
with ∆ = 0.02, ε = 1 10-6, α = 0.5
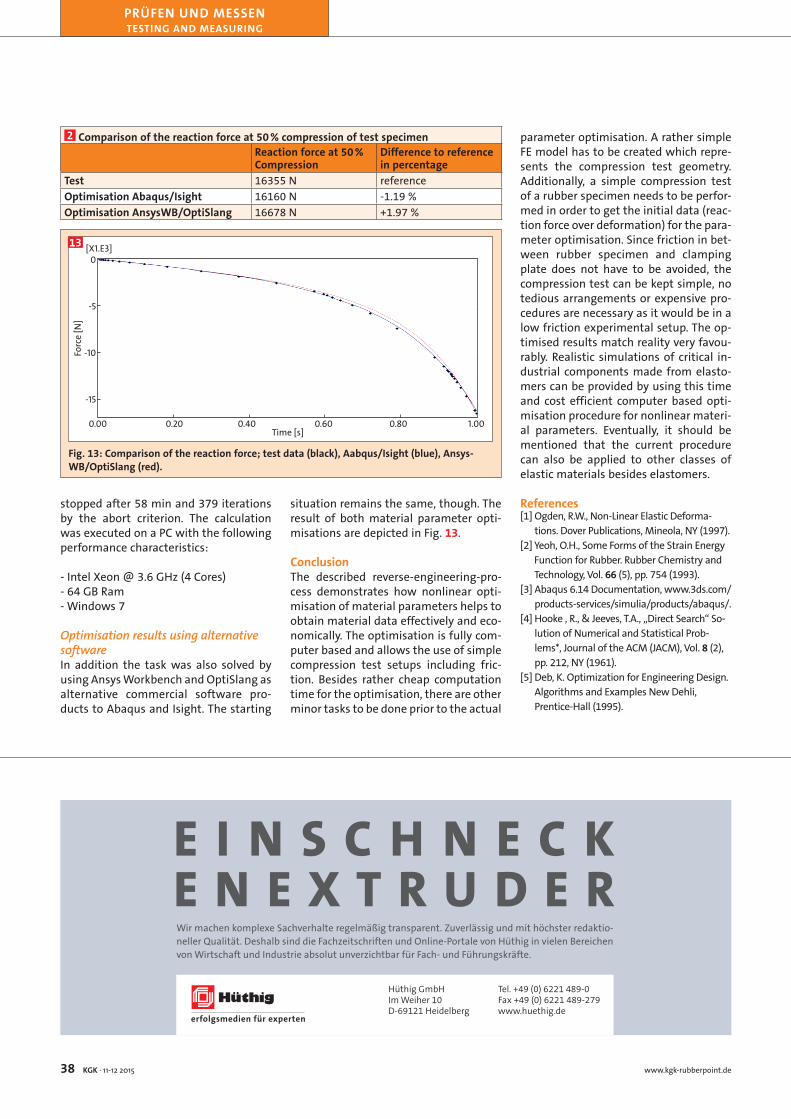
ResultsThe final plot of the optimisation process shows that the curved of the two reaction forces eventually coincide (see Fig. 11).
The following parameters belong to the optimised graph in blue:
C10 = 1.1696C20 = 0.0936C30 = 0.0
Concerning the behaviour pattern men-tioned in paragraph curve fitting, the optimised parameters better fulfil the order of magnitude criteria. The magni-tude of C20 is two orders of magnitude smaller compared with C10 but it shows a positive algebraic value rather than a negative one. The third parameter, C30, changed from the same order of magni-tude as C20 to a smaller one. In particular this parameter decreases to a value bet-ween 0 and 6.25E-4, which is a good fit to the criterion of C30 stating it two to four orders of magnitude smaller than parameter C10.
The objective function in the optimi-sation process was the minimisation of the area difference between two curves. The difference value was reduced from 8510.35 to 34.38. The whole process was
Fig. 11: superposition of the reaction force of the compression test (black) and of the FE analysis with the optimised material parameters (blue).
11
0 0.1 0.2 0.3 0.4 0.5 0.6 0.7 0.8 0.9 1
0-1000-2000-3000-4000-5000-6000-7000-8000-9000
-10000-11000-12000-13000-14000-1500016000-17000
LegendTarget 1_Y_Data_From_RF2_T
est_Data_txt[*] vs.Target 1_X_Data_From_RF2_T
est_Data_txt[*]Step_1_History_RF2_2[*,1] vs.Step_1_History_RF2_2[*,0]
Fig. 12: Comparison of nominal stress / nominal strain; test data (black), Aabqus/Isight (blue), AnsysWB/OptiSlang (red).
12
-0.60 -0.50 -0.40 -0.30 -0.20 -0.10 0.00
0
-5
-10
-15
-20
-25
-30
-35
Nominal Strain [-]
Nom
inal
Str
ess [
MPa
]
PRÜFEN UND MESSEN TESTING AND MEASURING
38 KGK · 11-12 2015 www.kgk-rubberpoint.de
2 Comparison of the reaction force at 50 % compression of test specimenReaction force at 50 % Compression
Difference to reference in percentage
Test 16355 N referenceOptimisation Abaqus/Isight 16160 N -1.19 %Optimisation AnsysWB/OptiSlang 16678 N +1.97 %
stopped after 58 min and 379 iterations by the abort criterion. The calculation was executed on a PC with the following performance characteristics:
- Intel Xeon @ 3.6 GHz (4 Cores)- 64 GB Ram- Windows 7 Optimisation results using alternative softwareIn addition the task was also solved by using Ansys Workbench and OptiSlang as alternative commercial software pro-ducts to Abaqus and Isight. The starting
situation remains the same, though. The result of both material parameter opti-misations are depicted in Fig. 13.
ConclusionThe described reverse-engineering-pro-cess demonstrates how nonlinear opti-misation of material parameters helps to obtain material data effectively and eco-nomically. The optimisation is fully com-puter based and allows the use of simple compression test setups including fric-tion. Besides rather cheap computation time for the optimisation, there are other minor tasks to be done prior to the actual
parameter optimisation. A rather simple FE model has to be created which repre-sents the compression test geometry. Additionally, a simple compression test of a rubber specimen needs to be perfor-med in order to get the initial data (reac-tion force over deformation) for the para-meter optimisation. Since friction in bet-ween rubber specimen and clamping plate does not have to be avoided, the compression test can be kept simple, no tedious arrangements or expensive pro-cedures are necessary as it would be in a low friction experimental setup. The op-timised results match reality very favou-rably. Realistic simulations of critical in-dustrial components made from elasto-mers can be provided by using this time and cost efficient computer based opti-misation procedure for nonlinear materi-al parameters. Eventually, it should be mentioned that the current procedure can also be applied to other classes of elastic materials besides elastomers.
References[1] Ogden, R.W., Non-Linear Elastic Deforma-
tions. Dover Publications, Mineola, NY (1997).[2] Yeoh, O.H., Some Forms of the Strain Energy
Function for Rubber. Rubber Chemistry and Technology, Vol. 66 (5), pp. 754 (1993).
[3] Abaqus 6.14 Documentation, www.3ds.com/products-services/simulia/products/abaqus/.
[4] Hooke , R., & Jeeves, T.A., „Direct Search“ So-lution of Numerical and Statistical Prob-lems*, Journal of the ACM (JACM), Vol. 8 (2), pp. 212, NY (1961).
[5] Deb, K. Optimization for Engineering Design. Algorithms and Examples New Dehli, Prentice-Hall (1995).
Fig. 13: Comparison of the reaction force; test data (black), Aabqus/Isight (blue), Ansys-WB/OptiSlang (red).
13
Time [s]0.00 0.20 0.40 0.60 0.80 1.00
Forc
e [N
]
0
-5
-10
-15
[X1.E3]
Hüthig GmbHIm Weiher 10D-69121 Heidelberg
Tel. +49 (0) 6221 489-0Fax +49 (0) 6221 489-279www.huethig.de
E i n s c h n E c k E n E x t r u d E rWir machen komplexe Sachverhalte regelmäßig transparent. Zuverlässig und mit höchster redaktio-neller Qualität. Deshalb sind die Fachzeitschriften und Online-Portale von Hüthig in vielen Bereichen von Wirtschaft und Industrie absolut unverzichtbar für Fach- und Führungskräfte.
hue_image_woerter_blau_178x62mm.indd 1 17.12.2013 18:04:34