elastic moduli and stiffness optimization in four-point bending of … · humanosphere, kyoto...
TRANSCRIPT

ORIGINAL ARTICLE
J Wood Sci (2006) 52:302–310 © The Japan Wood Research Society 2006DOI 10.1007/s10086-005-0766-z
T. Kawasaki (*) · M. Zhang · S. KawaiLaboratory of Sustainable Materials, Research Institute forSustainable Humanosphere, Kyoto University, Uji 611-0011, JapanTel. +81-774-38-3677; Fax +81-774-38-3678e-mail: [email protected]
K. KomatsuLaboratory of Structural Function, Research Institute for SustainableHumanosphere, Kyoto University, Uji 611-0011, Japan
Q. WangHokushin Co., Kishiwada 596-8521, Japan
Tamami Kawasaki · Min Zhang · Qian WangKohei Komatsu · Shuichi Kawai
Elastic moduli and stiffness optimization in four-point bending of wood-based sandwich panel for use as structural insulated walls and floors
Received: February 18, 2005 / Accepted: September 16, 2005 / Published online: March 2, 2006
Abstract Several wood-based sandwich panels with low-density fiberboard core were developed for structural insu-lated walls and floors, with different face material, panelthickness, and core density. The elastic moduli with andwithout shear effect (EL, E0) and shear modulus (Gb) wereevaluated in four-point bending. Generally, the stiffer face,thicker panel, and higher core density were advantageous inflexural and shear rigidity for structural use, but the weightcontrol was critical for insulation. Therefore, optimumdesigns of some virtual sandwich structures were analyzedfor bending stiffness in relation to weight for fixed coredensities, considering the manufactured-panel designs. Asa result, the plywood-faced sandwich panel with a panelthickness of 95mm (PSW-T100), with insulation perfor-mance that had been previously confirmed, was mostadvantageous at a panel density of 430kg/m3, showing thehighest flexural rigidity (ELI = 13 × 10−6 GNm2) among thesepanels, where EL, E0, and Gb were 3.5, 5.5, and 0.038GN/m2,respectively. The panel was found to be closest to the opti-mum design, which meant that its core and face thicknesswere optimum for stiffness with minimum density. Thepanel also provided enough internal bond strength and anexcellent dimensional stability. The panel was the most fea-sible for structural insulation use with the weight-savingstructure.
Key words Bending property · Wood-based sandwichpanel · Low-density fiberboard · Structural insulation wall/floor · Optimum design analysis
Introduction
There is a dire need for more effective measures for su-staining comfortable temperatures in living environmentsbecause of the emerging trend of global warming. Insula-tion materials are therefore required to demonstrate higherperformance so that temperatures in residences can bemoderated against the severe temperature changes that oc-cur diurnally and seasonally.
The current commercial insulators for houses, such asplastic foams and mineral wools, are inferior to the warmth-keeping property of low-density fiberboards. Low-densityfiberboard, the mechanical properties of which wereimproved in a previous study,1 is a promising insulationmaterial that provides low thermal conductivity. This char-acteristic of the fiberboards made the most of thewood resource, which came from the species of trees thathave survived severe climate changes throughout theearth’s history.
Structural insulated panels with a plastic foam coreare currently used in a sandwich structure with facematerials of oriented strand board (OSB).2 Wood-basedsandwich panel had been behind the development ofmany industrial sandwich structures for a long time.3
Following the studies of wood-based sandwich beam4 andpanels,5,6 we have developed plywood-faced sandwich(PSW)7 panels with low-density fiberboard for use as wood-based structural insulated walls/floors. We showed thatPSW had characteristics of well-balanced thermal insula-tion and warmth-keeping properties,8 as well as the feasibil-ity for structural use7 by evaluating the in-plane shearmodulus, which is required in structural calculations ofwalls/floors.
In the present work, some wood-based sandwich panelswith low-density fiberboard were manufactured with differ-ent thickness, core density, and face materials. A four-pointout-plane bending test was conducted, and the elastic andshear moduli were determined, which are also important forstructural calculations. The flexural rigidities of these panelsare discussed.

303
Weight control is critical for insulation use, because den-sity plays a dominant role in insulation performance. Theoptimization of sandwich structures between stiffness andweight and some stiffness analysis have been considered bya number of authors,3,9–16 but the optimization of wood-based sandwich panels, and particularly under concentratedtwo-point loading, appears to be much less well understood.Therefore, the optimum designs of some virtual wood-based sandwich structures were analyzed by consideringthe designs of the manufactured panels.
Experimental
Face and core materials
For core materials, fiber from lauan (Shorea spp.) was pre-pared, which was commercially produced using a pressur-ized double disk refiner (PDDR) (Hokushin). For facematerials, plywood (PW) and medium-density fiberboard(MDF) were prepared. The PW was commercially pro-duced weatherproof and boil-proof plywood (type special17)(Ishinomaki Plywood) with a thickness of 9mm and a den-sity of 600kg/m3, and consisted of three plies of 3-mm layersof Japanese larch (Larix gmelini Gordon). The MDF wascommercially produced from hardwood fiber using an adhe-sive of melamine–urea–formaldehyde resin (Hokushin)with a thickness of 9mm and a density of 700kg/m3.
Manufacture of sandwich panels
Six types of wood-based sandwich panels with fiberboardcore were manufactured as listed in Table 1; plywood-facedsandwich panels with a target thickness of 100mm (PSW-T100) at three density levels (types 1–3), and plywood-facedsandwich panels with a target thickness of 50mm (PSW-T50) at two density levels (types 4, 5), and a MDF-facedsandwich panel with a target thickness of 100mm (MSW-T100) (type 6).
The manufacturing procedure of sandwich panels was asfollows. The fiber was put into a cyclic-tube-type blenderand the commercial adhesive of polymeric methylenediphenyl diisocyanate (MDI) (Mitsui Takeda Chemical)
was sprayed into the fiber using a spray gun during thecycle. The resin content was 10% solid resin of MDI basedon the oven-dried fiber weight. The fiber was formed intofiber mats in a size of 0.26 (width) × 1.6m (length) using aforming box by hand forming. Some thicker fiber mats forhigher density panels were preliminarily pressed to obtainadequate mat heights using a cold pressing machine. Allface materials were prepared in a size of 0.26 (width) × 1.6m(length). Before pressing, MDI adhesive (UL-4811, Gun-eiChemical) was spread on the back side of each face materialat approximately 80g/m2 on solid basis using a hard plastichand roller. The face materials were then symmetricallyplaced on the top and bottom surfaces of each fiber mat sothat the grain of the plywood surface was parallel to thepanel length direction.
The assembled mats were pressed using a continuouspressing machine with steam injection on both sides.18 Thepressing space size of the machine was 300mm in width,100mm in height, and 1500mm in length. The mats forPSW-T100 and MSW-T100 were pressed one by onewhereas two mats for PSW-T50 were piled up and pressedtogether. The assembled mats were put into the pressingspace between the press platens heated to 170°C, moved bya steel belt at a velocity of 1m/min, and then heated bysteam (160°C) injected from both sides of three pairs ofsteam valves near the entrance of the machine for approxi-mately 2min. After the injection the belt was stopped, andthe mat was held and pressed for approximately 10min toobtain sufficient bonding. By moving the belt again, thesandwich panels were obtained from the exit of the pressingspace and then stabilized to an air-dried condition in a well-ventilated room for over 2 weeks. One piece of sandwichpanel for each type was then obtained in a size of 0.26(width) ×1.6m (length).
Property testing
A four-point bending test was conducted for PSW-T100,PSW-T50, and MSW-T100, according to the out-planebending test in JIS (Japanese Industrial Standard) A 1414,19
with modifications in specimen width and length. Threebeam specimens, 0.05m in width (b) and 1.6m in length (l),were taken from the center of each panel. As shown in
Table 1. Experimental geometric data of the manufactured sandwich panels
No. Specimen Face rSW rc rf c f h W(kg/m3) (kg/m3) (kg/m3) (m) (m) (m) (kg)
1 PSW-T100 PW 320 250 600 0.078 0.009 0.096 2.282 350 300 600 0.077 0.009 0.095 2.543 430 390 600 0.077 0.009 0.095 3.094 PSW-T50 430 350 600 0.035 0.009 0.053 1.745 480 400 600 0.026 0.009 0.044 1.586 MSW-T100 MDF 380 330 700 0.077 0.009 0.095 2.71
The data are average values of the specimens for the out-plane bending test. rSW, Panel density;rc, core density; rf, face density; c, core thickness; f, face thickness for each sheet; h, panelthickness; W, weight of a sandwich beam between the supporting points (W = bhL); b = 0.05 m(width), L = 1.5m (whole span). PW, plywood; MDF, medium-density fiberboard

304
Fig. 1, the whole span length (L) was 1.5m, and two loadingpoints were set to divide the span into three equal parts of0.5m each. The tests for PSW-T100 and PSW-T50 wereconducted in a direction parallel to the grain of the plywoodsurface. The load–deflection curve was recorded. Thedeflection at mid span (dL) was measured to determine theequivalent apparent elastic modulus (EL) including sheardeformation effect (Eq. 1). A relative deflection betweenthe loading points (d0) was measured (the distance of themeasuring points was Lh = 0.28m) to determine the equiva-lent pure elastic modulus (E0) excluding shear deformationeffect in pure bending (Eq. 2).
EP L L L
ILL
s s=−( )D
Dd3 4
48
2 3
(1)
EP LL
I00
2
48=
( )DDd
h(2)
where Ls is the span subjected to the shear deformation (Ls
= 0.5m), and I is the moment of inertia for a rectangularcross section of a beam. The slopes DP/DdL and DP/Dd0 aredefined from the linear portion of the relations between theload P and the deflections dL and d0, respectively. From theEL and E0 values (Eqs. 3 and 4), the equivalent shear modu-lus in bending (Gb) was calculated from Eq. 5:
dLs s
L
=−( )P L L L
E I
3 4
48
2 3
(3)
d kL
s s s
b
=−( )
+P L L L
E IPLG A
3 4
48 2
2 3
0
(4)
Gh E E
E E L Lb
L
L s
=−( ) −( )
2
3 4
20
02 2
k(5)
where the value k is a constant for a rectangular beam(k = 1.2), and h is the panel thickness.
Generally, the elastic modulus of a sandwich structure(ET) can be calculated from the elastic modulus of thecore (Ec) and face materials (Ef) using the composite theory(Eq. 6).
EE c E h c
hTc f=
− −( )33 3
3(6)
where the value c is the core thickness.For simulation of ET values of the sandwich panels, the
modulus of elasticity (MOE) of face materials and fiber-boards (FB) was determined as follows. The FB boardswere manufactured at densities of 280, 360, and 460kg/m3,similarly to the core densities, with a thickness of 12mmusing the same fiber prepared in the same manner withmodifications to the forming and pressing method: the fiberwas formed using a forming machine and pressed for 4minusing a hot-pressing machine. One piece of FB was ob-tained (0.36 × 0.37m in area) for each density level, andthen stabilized to an air-dried condition in a well-ventilatedroom for over 2 weeks.
A central-load bending test was conducted on PW,MDF, and FB, according to Japanese Agricultural Standard(JAS) for structural plywood17 and JIS A 5905,20 with amodification of the specimen width in the dimensions(width × length) for PW (0.05 × 0.29m), for MDF (0.05 ×0.23m), and for FB (0.03 × 0.23m). Five specimens wereprepared from each board. The test span was 0.18m for allspecimens. The test for PW was conducted in directions thatwere parallel and perpendicular to the grain of the plywoodsurface.
The MOE was determined for each specimen. The MOEvalues of faces and FB (EFB) were substituted for Ef and Ec
in Eq. 6, respectively, for the simulation of the ET values,which were compared with the E0 values. The MOR wasalso recorded for each specimen.
An internal bond (IB) test was conducted on four speci-mens (0.05m square × thickness) from each panel of PSW-T100 and FB. Thickness swelling (TS) and water absorption(WA) were tested on four specimens (0.05m square × thick-ness) from each panel of PSW-T100, PSW-T50, and MSW-T100. The thickness and weight of the specimens after watersoaking at 20°C for 24h were measured, and the TS andWA were then calculated. These tests were conducted ac-cording to the test for veneer-overlaid particleboard in JISA 5908.21 The density profiles of the core material in thethickness direction of the PSW-T100 panels were flat.8
Results and discussion
Elastic and shear moduli
Table 2 shows the experimental material constants in thebending of the manufactured sandwich panels and theseresults are shown plotted against panel density in Fig. 2. Asshown in Fig. 2A, the ELI (apparent flexural rigidity) valuesof PSW-T100 panels at the average densities of 350 and
Fig. 1. Four-point bending test. P, load; L, whole span; Lh, distancebetween the measuring points for d0; Ls, span subjected to shear defor-mation; l, length of specimen; dL, deflection at mid span; d0, relativedeflection between loading points

305
430kg/m3 (nos. 2 and 3) were more than twice (11 and 13 ×10−6 GNm2) those of the other panels.
The ELI values were related to two main components:pure flexural rigidity (E0I) and shear rigidity (GbA). The E0Ivalues differed due to the different thickness or face mate-rials (Fig. 2C), whereas the GbA values generally dependedon panel density (Fig. 2E). The trend in the ELI values wassimilar to that in the E0I values, although the ELI valuesdecreased due to the shear deformation effect. The decreas-ing trend was remarkable for a low panel density.
The EL (apparent elastic modulus) values generallydepended on panel density (Fig. 2B). The E0 (pure elasticmodulus) values varied more due to the difference of face
material than that of thickness (Fig. 2D). As a result, theEL/E0 ratios of the sandwich panels were generally close to1 at high density and decreased at low density (Table 2).Because the Gb (shear modulus) values strongly dependedon panel density (Fig. 2F), the shear deformation effect onthe EL values increased for low panel density.
A reverse trend was found in the panels of PSW-T100and PSW-T50 between the ELI and EL values: the ELI valueof the PSW-T100 panel (no. 3) was approximately threetimes that of the PSW-T50 panel (no. 4) at the same paneldensity (Fig. 2A), whereas the EL value of the PSW-T100panel (no. 3) was approximately half that of the PSW-T50panel (no. 4) in Fig. 2B. This was because the thicknessfactor had a great effect on the ELI value.
The panel thickness of PSW-T50 panels was half that ofthe PSW-T100 panels, whereas the face thickness was thesame. Therefore, the face-to-panel thickness ratio of PSW-T50 panels was twice that of PSW-T100 panels, which wasadvantageous for increasing the EL value of PSW-T50 pan-els. However, the advantage was cancelled by the decreas-ing ELI value, where the thickness was raised to the thirdpower.
As shown in Fig. 2A, the ELI value of MSW-T100 panel(no. 6) was less than half that of the PSW-T100 panel (no. 3)and somewhat more than that of the PSW-T50 panel(no. 4), whereas the EL value of the MSW-T100 was lessthan those of panel nos. 3 and 4 (Fig. 2B) at a similar paneldensity. The effect of face material was clearly observed onthe E0I values (Fig. 2C), but not on the GbA values (Fig.2E). This was because the difference of MOE values be-tween the face materials had a great effect on the E0 values.
The average MOE values of PW in the parallel andperpendicular directions were 13 and 0.70GN/m2, respec-tively, at the average density of 600kg/m3. The averageMOE value of MDF was 3.0GN/m2 at an average density of700kg/m3. The MOE of PW in the parallel direction wasapproximately four times that of MDF.
The PSW-T100 panel (no. 1) provided a high E0 value,similar to the other PSW-T100 panels (nos. 2 and 3). How-ever, the low density was disadvantageous in the Gb valueover the other panels (Fig. 2F), which caused the EL value tobe reduced (Fig. 2B). The higher density of the PSW-T50panel (no. 5) was advantageous in providing a higher Gb
value than those of the other panels, but the effect was notsignificant on the E0 and EL values. From the above results,the structure of PSW-T100 panel (no. 3) was the most effec-
Table 2. Experimental material constants in out-plane bending of the manufactured sandwich panels
No. Specimen rSW P/dL ELI EL E0I E0 GbA Gb EL/E0
(kg/m3) (MN/m) (×10−6 GNm2) (GN/m2) (×10−6 GNm2) (GN/m2) (×10−3 GN) (GN/m2)
1 PSW-T100 320 0.071 4.2 1.2 19 5.1 0.028 0.0060 0.242 350 0.18 11 3.0 22 6.2 0.11 0.022 0.483 430 0.21 13 3.5 20 5.5 0.18 0.038 0.654 PSW-T50 430 0.067 4.0 6.4 5.1 8.1 0.10 0.036 0.795 480 0.042 2.5 7.4 2.7 7.8 0.25 0.114 0.956 MSW-T100 380 0.086 5.1 1.4 6.5 1.8 0.13 0.026 0.79
The data are average values of the specimens for the bending test. P/dL, Stiffness; ELI, apparent flexural rigidity; EL, apparent elastic modulus; E0I,pure flexural rigidity; E0, pure elastic modulus; GbA, shear rigidity; Gb, shear modulus
Fig. 2A–F. Bending material constants of manufactured sandwich pan-els. A ELI, flexural rigidity; B EL, elastic modulus; C E0I, pure flexuralrigidity; D E0, pure elastic modulus; E GbA, shear rigidity; F Gb, shearmodulus. Numbers, models of the sandwich panels (1–3, filled dia-monds, PSW-T100; 4, 5, open diamonds, PSW-T50; 6, open circle,MSW-T100, see Table 1)

306
tive construction to improve the ELI values among thesesandwich panels.
For reference, the standard value of MOE for veneer-overlaid particleboard is 4.5GN/m2 according to JIS A5908.21 The E0 values (5.1–8.1GN/m2) of PSW-T100 andPSW-T50 panels (nos. 1–5) and the EL values (6.4 and7.4GN/m2) of PSW-T50 panels (nos. 4 and 5) were higherthan the standard, and thus met the requirements, althoughthey could not be exactly compared. According to the JASfor structural panels22 for reference, the standard MOEvalue depends on the thickness of the specimen. Class 1requires MOE values of approximately 0.24 and 0.030GN/m2 for panels with thicknesses of 0.05 and 0.1m, respec-tively. The EL values of all the PSW-T100, PSW-T50, andMSW-T100 panels were higher than the standard value forthe respective thickness, although they could not be exactlycompared.
The MOE value of PW in the parallel direction and thatof MDF were substituted into Ef in Eq. 6 for the simulationof the ET values. The averaged MOE values of FB at theboard densities of 280, 360, and 460kg/m3 were 0.21,0.51, and 1.1GN/m2, respectively. A regression curve (y =2.64 × 10−9x3.23, R2 = 0.99) was drawn for the MOE data of FBin Fig. 3, which approximated the data well. According tothe curve, the EFB values at the same densities of FB (rFB) asthe core material (rc) were evaluated, which were substi-tuted into Ec in Eq. 6 for the simulation.
The simulation results are shown in Table 3. The ET/E0
ratios were generally close to 1 for the PSW-T100, PSW-
T50, and MSW-T100 panels. The calculated ET values weresimilar to the experimental E0 values. There was a tendencyfor the ET values of PSW-T100 and PSW-T50 to be higherthan the E0 values, and the ET value for MSW-T100 waslower than the E0 value. As a result, the E0 values of sand-wich panels were simulated by using the ET values from theMOE data of PW, MDF, and FB.
The improvement of MOE by sandwiching fiberboardwith face materials was also estimated by considering theET/EFB ratios at the same density of rFB (Table 3). TheET values of PSW-T100, PSW-T50, and MSW-T100 wereapproximately 10–40, 15–20, and 4 times the EFB values,respectively. For example, the ET value of PSW-T100(6.3GN/m2) at a density of 430kg/m3 (at a core density of390kg/m3) was approximately 10 times the EFB value(0.62GN/m2) at a density of 390kg/m3. Higher improvementeffects were estimated at a lower density.
Optimum design analysis on stiffness
Equation 4 for deflection dL, which is the sum of the bendingand shear components, is generalized as Eq. 7:
dLb
= +PLB E I
PLB G A
3
1 0 2(7)
where the B1 and B2 are constants that depend on the geom-etry of bending; the constants for a four-point bendingbeam are B1 = 1296/23 and B2 = 6/k = 5 (where k is 1.2). Wewish to minimize the weight of the beam for a given bendingstiffness (P/dL). The faces are always much thinner thanthe core so that f + c ≈ c, where f is face thickness. Togood approximations,3,9 when Gc is shear modulus of corematerial,
E IE bfc
0
2
2≈ f (8)
G A G bcb c≈ (9)
Using Eqs. 7, 8, and 9, the compliance of the beam is
dL
f cPL
B E bfcL
B G bc= +2 3
12
2(10)
Fig. 3. Evaluation of modulus of elasticity (MOE) of fiberboard (EFB)values in the simulation by the composite theory according to theregression curve drawn for the MOE data of fiberboard (FB) (opensquares) in relation to the board density of FB (rFB)
Table 3. Parameters and results for E0 simulation based on the composite theory
No. Model rFB EFBa Ef ET ET/E0 ET/EFB
(kg/m3) (GN/m2) (GN/m2) (GN/m2)
1 PSW-T100 250 0.15 13 6.0 1.18 402 300 0.26 13 6.1 0.99 233 390 0.62 13 6.3 1.15 104 PSW-T50 350 0.44 13 9.2 1.14 215 400 0.67 13 10.3 1.32 156 MSW-T100 330 0.36 3.0 1.6 0.89 4.4
rFB, Density of fiberboard (FB); EFB, modulus of elasticity (MOE) of FB; Ef, MOE of parallel PW(nos. 1–5) and MDF (no. 6); ET, simulated elastic modulus of sandwich panel; E0, experimentalpure elastic modulus of sandwich panela Value of EFB is substituted into Ec in the calculation (Eq. 6)

307
The objective function, which is the equation to be mini-mized in optimization theory, is the weight (W) in this case:
W bLf bLc= +2r rf c (11)
The dimensions b and L, the face density rf, and thestiffness are fixed; the free variables are the face thickness(f), the core thickness (c), and the core density (rc). If thecore density (rc) is fixed, the weight (W) is simply differen-tiated with respect to c (Eq. 13), into which the solved Eq.10 for f is substituted (Eq. 12).
W
LB E
c cP
LB bG
c bL=−
+
4 4
1
2
r
dr
f
f
L
c
c (12)
dd
f
f
L
L
c
f
f
L
c
cWc
LB E P
c cP
LB bG
LB E
c cP
LB bG
bL= −
−
−−
+
4 44
1
2
2
4
1
2
2
r d
d
r
dr
(13)
Setting dW/dc equal to zero in Eq. 13 gives theoptimum core thickness (copt), and substituting this backinto Eq. 10 gives the optimum face thickness (fopt), wherethe plot of Eq. 12 draws a downward convex curve at W > 0and c > 0.
Therefore, this procedure of calculation was applied toinvestigate of the optimum design of some virtual plywood-faced and MDF-faced sandwich panels with fiberboard. Sixpatterns of virtual sandwich beams were proposed and theoptimum design point was analyzed for each pattern. Thegeometric parameters were fixed at b = 0.05m, L = 1.5m,Ls = 0.5m, B1 = 1296/23, and B2 = 5. The material parametersthat enter the analysis are listed in Table 4. The rc and rf
were set the same as those of the manufactured sandwichpanels (see Table 1). The Gc values were approximatedusing the Gb values of the manufactured panels because Eq.9 gives Gc ≈ Gb for thin faces. The Gf values were from theMOE data of parallel PW and MDF. The P/dL values wereset by considering the results of the manufactured panels(see Table 2). As a result, a solution for copt was obtained foreach pattern under the conditions of W > 0 and c > 0.
Additionally, the optimum design point is graphicallygiven as the point of contact in the following relationshipsbetween the two variables of the problem, f/L and c/L
(Eqs. 14 and 15). The stiffness constraint (Eq. 10) gives arelationship:
fL
BB
G
EcL
B bGP
cL
L
=
−
2 1
1
2
12
c
f cd (14)
Equation 11 gives a second relationship:
fL
WbL
cL
= −
2 22r
rrf
c
f(15)
Therefore, graphical analysis was applied to each patternand the optimum design point was identified, as illustratedin Fig. 4.
Table 5 shows the results of the analysis on the optimumdesign point of each virtual sandwich beam. Judging fromthe ratios of copt/c and fopt/f, each optimum design point wasgenerally not far from the corresponding manufactured-panel design. Among these analysis patterns, both ratioscopt/c and fopt/f were closest to 1 in pattern no. 3′: the opti-mum core and face thicknesses were 82 and 9.9mm, respec-tively. Therefore, the manufactured panel (no. 3) had themost effective structure for the weight. In the other pat-
Table 4. Material parameters of virtual sandwich beams
No. Face rc rf Gc Ef P/dL
(kg/m3) (kg/m3) (GN/m2) (GN/m2) (MN/m)
1′ PW 250 600 0.0060 13 0.0712′ 300 600 0.022 13 0.183′ 390 600 0.038 13 0.214′ 350 600 0.036 13 0.0675′ 400 600 0.114 13 0.0426′ MDF 330 700 0.026 3.0 0.086
Gc, shear modulus of core material; Beam width b = 0.05m, span L = 1.5m, two-concentrated loadin four-point bend at B1 = 1296/23 and B2 = 5
Fig. 4. Graphical analysis for the optimum design point of a virtualsandwich beam for pattern no. 3′ (see Table 4). The curve shows thestiffness constraint (Eq. 14) at P/dL = 0.21MN/m: points that lie to theright of this curve satisfy the constraint. The optimum design point,which defines the structure with the minimum weight, is at the pointwhere the curve and the line of the objective function (Eq. 15) comeinto contact. The thick line at W = 3.28kg contacts the thin curve.Plywood faces with rf = 600kg/m3, and Ef = 13 GN/m2; fiberboard corewith rc = 390 kg/m3, and Gc = 0.038 GN/m2. Beam width b = 0.05m, spanL = 1.5m, two-concentrated load in four-point bending at B1 = 1296/23and B2 = 5
308
terns, there were tendencies that the copt/c values were morethan 1, and that the fopt/f values were generally less than 1.This meant that thicker core and thinner face, resulting inthicker panel thickness, should be generally desired foroptimized manufacturing. The Wopt/W ratios were approxi-mately 1, and were not always less than 1 due to a calcula-tion error. The optimization was generally well applied tothe wood-based sandwich panels.
Other properties
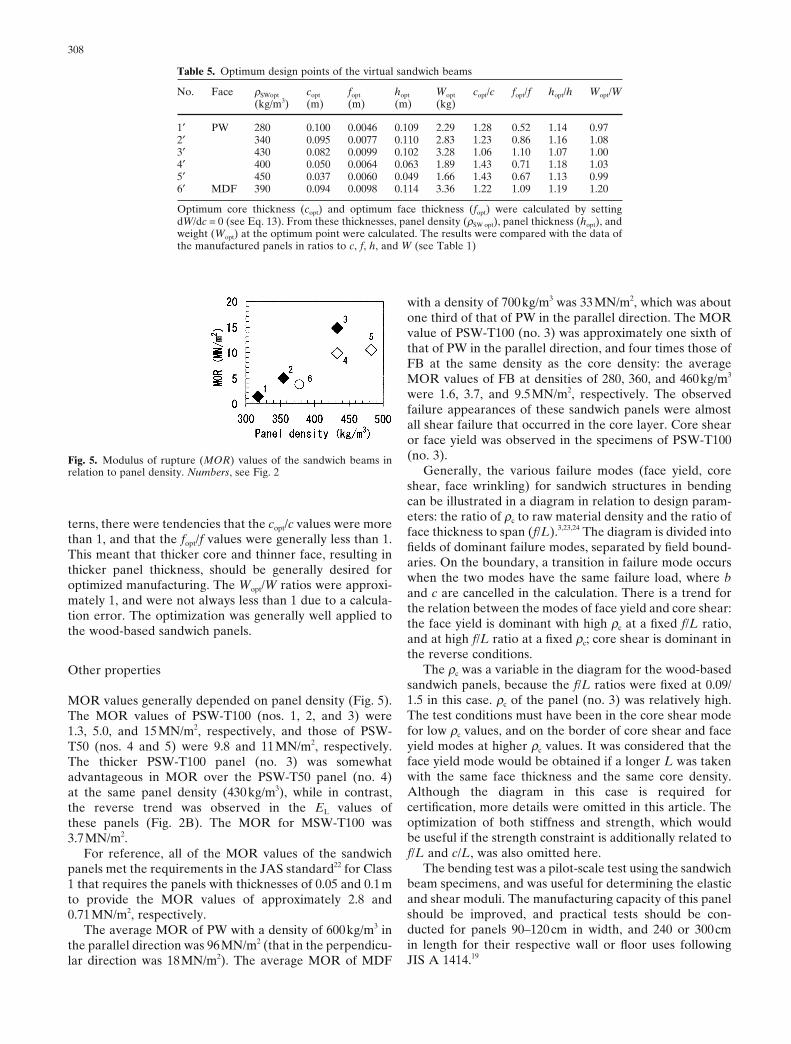
MOR values generally depended on panel density (Fig. 5).The MOR values of PSW-T100 (nos. 1, 2, and 3) were1.3, 5.0, and 15MN/m2, respectively, and those of PSW-T50 (nos. 4 and 5) were 9.8 and 11MN/m2, respectively.The thicker PSW-T100 panel (no. 3) was somewhatadvantageous in MOR over the PSW-T50 panel (no. 4)at the same panel density (430kg/m3), while in contrast,the reverse trend was observed in the EL values ofthese panels (Fig. 2B). The MOR for MSW-T100 was3.7MN/m2.
For reference, all of the MOR values of the sandwichpanels met the requirements in the JAS standard22 for Class1 that requires the panels with thicknesses of 0.05 and 0.1mto provide the MOR values of approximately 2.8 and0.71MN/m2, respectively.
The average MOR of PW with a density of 600kg/m3 inthe parallel direction was 96MN/m2 (that in the perpendicu-lar direction was 18MN/m2). The average MOR of MDF
with a density of 700kg/m3 was 33MN/m2, which was aboutone third of that of PW in the parallel direction. The MORvalue of PSW-T100 (no. 3) was approximately one sixth ofthat of PW in the parallel direction, and four times those ofFB at the same density as the core density: the averageMOR values of FB at densities of 280, 360, and 460kg/m3
were 1.6, 3.7, and 9.5MN/m2, respectively. The observedfailure appearances of these sandwich panels were almostall shear failure that occurred in the core layer. Core shearor face yield was observed in the specimens of PSW-T100(no. 3).
Generally, the various failure modes (face yield, coreshear, face wrinkling) for sandwich structures in bendingcan be illustrated in a diagram in relation to design param-eters: the ratio of rc to raw material density and the ratio offace thickness to span (f/L).3,23,24 The diagram is divided intofields of dominant failure modes, separated by field bound-aries. On the boundary, a transition in failure mode occurswhen the two modes have the same failure load, where band c are cancelled in the calculation. There is a trend forthe relation between the modes of face yield and core shear:the face yield is dominant with high rc at a fixed f/L ratio,and at high f/L ratio at a fixed rc; core shear is dominant inthe reverse conditions.
The rc was a variable in the diagram for the wood-basedsandwich panels, because the f/L ratios were fixed at 0.09/1.5 in this case. rc of the panel (no. 3) was relatively high.The test conditions must have been in the core shear modefor low rc values, and on the border of core shear and faceyield modes at higher rc values. It was considered that theface yield mode would be obtained if a longer L was takenwith the same face thickness and the same core density.Although the diagram in this case is required forcertification, more details were omitted in this article. Theoptimization of both stiffness and strength, which wouldbe useful if the strength constraint is additionally related tof/L and c/L, was also omitted here.
The bending test was a pilot-scale test using the sandwichbeam specimens, and was useful for determining the elasticand shear moduli. The manufacturing capacity of this panelshould be improved, and practical tests should be con-ducted for panels 90–120cm in width, and 240 or 300cmin length for their respective wall or floor uses followingJIS A 1414.19
Table 5. Optimum design points of the virtual sandwich beams
No. Face rSWopt copt fopt hopt Wopt copt/c fopt/f hopt/h Wopt/W(kg/m3) (m) (m) (m) (kg)
1′ PW 280 0.100 0.0046 0.109 2.29 1.28 0.52 1.14 0.972′ 340 0.095 0.0077 0.110 2.83 1.23 0.86 1.16 1.083′ 430 0.082 0.0099 0.102 3.28 1.06 1.10 1.07 1.004′ 400 0.050 0.0064 0.063 1.89 1.43 0.71 1.18 1.035′ 450 0.037 0.0060 0.049 1.66 1.43 0.67 1.13 0.996′ MDF 390 0.094 0.0098 0.114 3.36 1.22 1.09 1.19 1.20
Optimum core thickness (copt) and optimum face thickness (fopt) were calculated by settingdW/dc = 0 (see Eq. 13). From these thicknesses, panel density (rSW opt), panel thickness (hopt), andweight (Wopt) at the optimum point were calculated. The results were compared with the data ofthe manufactured panels in ratios to c, f, h, and W (see Table 1)
Fig. 5. Modulus of rupture (MOR) values of the sandwich beams inrelation to panel density. Numbers, see Fig. 2

309
The average IB values of PSW-T100 were 0.13, 0.28, and0.30MN/m2 for panel densities of 330, 390, and 400kg/m3
(for the core densities of 260, 340, and 360kg/m3), respec-tively. The average IB values of PSW-T100 increased withthe increase of panel density. An IB of 0.3MN/m2 is re-quired, according to JIS A 5908 for veneer-overlaid par-ticleboard.21 According to the JAS for structural panel,22 theIB is also required to be 0.3MN/m2. Therefore, a paneldensity of at least 400kg/m3 (hence the core density of360kg/m3) met the requirements for structural use.
As figured in relation to the core density (Fig. 6),the increasing trend in IB was similar to that of FB. Becausethe IB failures of PSW-T100 occurred in the core materialsand the density profiles of the core materials of PSW-T100were flat through the thickness, the IB values of PSW-T100were considered to depend on the core densities. There wasno difference in the IB properties between the steam-injection pressed PSW-T100 and the hot-pressed FB. Theaverage IB of FB at a density of 360kg/m3 was 0.31MN/m2,similar to the lowest limit of the core density of PSW-T100for structural use. This result was also similar to that ofanother low-density fiberboard,1 which was made from soft-wood fibers and processed by a batch-type steam-injectionpressing, where the lowest density limit was approximately350kg/m3.
As shown in Fig. 7A, the TS values of the sandwichpanels were in the range of 1.7%–3.0%. The TS values of allthe sandwich panels were much less than the requirementfor a TS value of less than 12%, according to JIS A5908.21
There was a trend that the WA values (Fig. 7B) increased atlower density, whereas the TS values generally decreased.This was because the lower-density panels included moreporosity, which absorbed more water. Due to the low com-paction ratios (low core-to-fiber density ratios), dimen-sional stability was not significantly affected by the increaseof WA.
The PSW-T100 at a panel density of 430kg/m3 providedthe TS value of 2.1% and WA of 17% on average. From theabove results, the PSW-T100 at a panel density of morethan 400kg/m3, which met the requirements for IB forstructural use, provided excellent dimensional stability inTS.
Conclusions
Several wood-based sandwich panels with low-density fiber-board were manufactured for structural insulated walls/floors, and the elastic moduli in four-point out-plane bend-ing and other fundamental properties were evaluated.Because the density control was critical for structural insu-lation use of panel, optimum design analysis on stiffness waswell applied to wood-based sandwich panels in four-pointbending.
As a result, the PSW-T100 at a density of 430kg/m3
(no. 3) had the most effective structure for improving ELI(13 × 10−6 GNm2) (where the EL, E0, and Gb were 3.5, 5.5, and0.038GN/m2, respectively) among these panels, and met therequirements for structural use with an excellent dimen-sional stability. Its structure was found to be the optimumdesign to provide the stiffness with minimum weight basedon the analysis. The panel (no. 3) has also been advanta-geous for both steady-state and non-steady-state insulationsdue to an adequate low density and a sufficient panelthickness.8
Therefore, it was concluded that the PSW-T100 panel(no. 3) was the most feasible as a structural insulated wall/floor. The practical use of PSW-T100 as a structural insu-lated wall/floor is expected to improve the energy efficiencyof indoor environments, and make them more comfortableto live and work in.
Acknowledgments The authors thank Mr. Noritoshi Sawada and hiscooperative members (Hokushin) for technical support in the manu-facturing of the sandwich panels. We also thank Drs. Kenji Umemura,Wong Ee Ding, and Guangping Han for their help and advice inmanufacturing the panels. We are grateful to Hokushin for the fiber,adhesive, and MDF, to Ishinomaki Plywood for the plywood, and toGun-ei Chemical for the adhesive.
Fig. 6. Internal bond (IB) of PSW-T100 (filled diamonds) in relation tocore density. The data were compared to that of FB (open squares).Regression curves for PSW-T100 (solid line) and for FB (dotted line)are shown
Fig. 7A,B. Thickness swelling (TS) (A) and water absorption (WA)(B) of the sandwich panels in relation to panel density. Numbers, seeFig. 2

310
References
1. Kawasaki T, Zhang M, Kawai S (1998) Manufacture and proper-ties of ultra-low density fiberboard. J Wood Sci 44:354–360
2. Structural Board Association (2000) OSB performance by design –OSB in wood frame construction (Canadian edition). StructuralBoard Association, Ontario
3. Gibson LJ, Ashby MF (1997) The design of sandwich panels withfoam cores. In: Clarke DR, Suresh S, Ward FRSIM (eds) Cellularsolids. Cambridge University Press, Cambridge, pp 345–386
4. Wang Q, Sasaki H, Yang P, Kawai S (1992) Utilization oflaminated-veneer-lumber from Sabah plantation thinnings asbeam flanges. III. Production of composite beam and its properties.Mokuzai Gakkaishi 38:914–922
5. Zhang M, Kawasaki T, Yang P, Honda T, Kawai S (1996) Manu-facture and properties of composite fiberboard III. Properties ofthree-layered bamboo–wood composite boards and stress analysisby the Finite Element Method. Mokuzai Gakkaishi 42:854–861
6. Kawasaki T, Zhang M, Kawai S (1999) Sandwich panel of veneer-overlaid low-density fiberboard. J Wood Sci 45:291–298
7. Kawasaki T, Kwang H, Komatsu K, Kawai S (2003) In-plane shearproperties of the wood-based sandwich panels as a small shearwall, evaluated by the shear test method using tie-rods. J Wood Sci49:199–209
8. Kawasaki T, Kawai S (2006) Thermal insulation properties ofwood-based sandwich panel for use as structural insulated wallsans floors. J Wood Sci 52:75–83
9. Allen HG (1969) Analysis and design of structural sandwich pan-els. Pergamon, Oxford
10. Arima T, Okuma M (1970) Studies on compound used injectedand foamed polyurethane resin as core. I (in Japanese). MokuzaiKogyo 25:267–268
11. Okuma M, Arima T (1970) Studies on compound used injected andfoamed polyurethane resin as core. II (in Japanese). MokuzaiKogyo 25:418–420
12. Vinson JR (1999) The behavior of sandwich structures of isotropicand composite materials. Technomic, Pennsylvania
13. Carlson LA, Nordstrand T, Westerlind B (2001) On the elasticstiffness of corrugated core sandwich. J Sandw Struct Mater3:253–267
14. Whitney JM (2001) A local model for bending of weak core sand-wich plates. J Sandw Struct Mater 3:269–288
15. Swanson SR, Kim J (2002) Optimization of sandwich beams forconcentrated loads. J Sandw Struct Mater 4:273–293
16. Gupta N, Woldesenbet E, Kishore, Sankaran S (2002) Response ofsyntactic foam core sandwich structured composites to three-pointbending. J Sandw Struct Mater 4:249–272
17. JAS (2000) JAS for structural plywood, Ministry of Agriculture,Forestry and Fisheries, Tokyo
18. Sasaki H (1991) Development of continuous press with steam-injection heating from both sides. Report for the Grant-in-Aid forScientific Research (No. 01860023) from the Ministry of Educa-tion, Science and Culture of Japan
19. JIS (1994) JIS A 1414 Methods of performance test of panels forbuilding construction. Japanese Standard Association, Tokyo
20. JIS (2003) JIS A 5905 Fiberboards. Japanese Standard Associa-tion, Tokyo
21. JIS (2003) JIS A 5908 Particleboards. Japanese Standard Associa-tion, Tokyo
22. JAS (2003) JAS for structural panel. Ministry of Agriculture,Forestry, and Fisheries, Tokyo
23. Triantafillou TC, Gibson LJ (1987) Failure mode maps for foamcore sandwich beams. Mat Sci Eng 95:37–53
24. Triantafillou TC, Gibson LJ (1987) Minimum weight design offoam core sandwich panels for a given strength. Mat Sci Eng 95:55–62